1. Introduction
Research related to the maneuvering of the surface ship has been continuously conducted. The roll moment of a ship has been a prime concern due to being the most dangerous among the 6-DoF, which has the possible consequences of instability and ship capsize. In general, the roll moment has usually been ignored when analyzing the maneuverability of the ship with low GM and high-speed ships, such as the KCS, DTMB, and ONRT, according to Hajivand et al. [
1], Liu et al. [
2], Franceschi et al. [
3], and Li et al. [
4]. However, it is widely known that the effect of the roll moment becomes significant for surface ships with small GM and high speed. Therefore, some researchers have investigated the effect of roll coupling on ship maneuverability. Kim et al. [
5] executed the captive model test that included the roll moment in several tests relative to roll, such as the static heel, combined drift-heel, combined turning-heel, and free roll decay for the KCS model to obtain hydrodynamic derivatives. The maneuvering simulation considering the roll effect was conducted for the 4-DoF motion. The comparison of simulation among 3-DoF, 4-DoF, and the free-running test indicated that the 4-DoF simulation was more accurate than the 3-DoF one. Yoshimura [
6] clarified the following principles structure regarding the effect of the roll motion on ship maneuverability. That is, the roll angle became larger by lower GM and a higher Froude number, and the derivatives of
and
were the key parameter that strongly affected the course-keeping and turning abilities of the ship. Furthermore, the rudder-to-yaw response equation was introduced in this study. Yasukawa and Yoshimura [
7] experimented with the oblique towing test and circular motion test with various heel angles for a container ship, pure car carrier, and ferry to obtain hydrodynamic derivatives relative to sway velocity, roll angle, and yaw rate, to analyze the roll-coupling effect. The simplified formulae were proposed for the course stability criterion and steady turning index. By analysis of the course stability criterion, it was concluded that the course stability was worse with increasing forward speed or decreasing GM, whereas the turning performance improved, and the response time until reaching the steady turning increased. Fukui et al. [
8] suggested the 4-DoF mathematical model for maneuvering simulation. The effect of roll angle for the KCS and passenger ferry was estimated by the captive model test by setting several roll angles to obtain hydrodynamic derivatives. The proposed mathematical model was validated by comparing the simulation with the free-running test at various GMs and forward speeds. As a result, the turning circle became greater with large GM. Yasukawa et al. [
9] proposed a practical maneuvering simulation method considering the roll-coupling effect by adding the motion equation of roll in the 3D-MMG (Maneuvering Modeling Group) model. The roll moment was estimated by multiplying the hull lateral force by the vertical acting point. The empirical formulae of roll-related derivatives and vertical acting points of the lateral force were introduced using the experiment data of four ship models. The validation of the simulation method with free running was implemented for several ships at various GMs, and indicated sufficient accuracy to predict the turning motion considering the roll-coupling effect.
From the literature review just presented, the roll-coupling effect was investigated by roll derivatives with respect to roll angle, which were obtained from the captive model test at various roll angles. The roll derivatives with respect to roll rate and roll acceleration that should be determined in the dynamic test such as the pure roll test have not previously been calculated for a surface ship, due to complex device requirements. Nevertheless, an experimental pure roll test was performed for the underwater vehicle by Kim et al. [
10] using an apparatus device. Consequently, roll-added mass and roll damping relative to roll rate were calculated for the underwater vehicle. Additionally, roll damping relative to the roll rate of the submerged body was measured from the pure roll test using Corning motion test equipment by Park et al. [
11]. Those devices are difficult to apply to a surface ship.
Another method to estimate the roll derivatives due to roll rate is to apply the system identification (SI) technique. However, this requires data from sea trial tests or free-running model tests. Yoon et al. [
12,
13] proposed a simpler method to identify the model structure of the hydrodynamic roll moment and its parameter using the data from the turning circle and 20°/20° zig-zag tests. Jeon et al. [
14] introduced the process of identifying the dynamic models of a combatant in intact and damaged condition, based on the measured data from free-running model tests. The hydrodynamic derivatives constituting 4-DoF were determined through system identification.
In this study, the pure roll simulation is executed for different surface ship types that have a small GM, such as the KCS, DTMB, and ONRT, and a high-speed ship, the Delft 372 catamaran. Although the Delft 372 catamaran has a large GM, it operates at high speed, so the roll moment has a significant change; thus, roll moment is a concern in this ship. Nowadays, numerous investigations of the roll motion on these ships are being conducted, especially the DTMB and ONRT, which are appended with bilge keel and skeg. Khekit et al. [
15] and Gokce et al. [
16] studied the free roll decay for the DTMB using the CFD simulation method. Meanwhile, the ONRT ship’s dynamic instability events and maneuverability were studied with a 4-DoF equation of motion including roll moment by Sadat-Hosseini et al. [
17], Araki et al. [
18], and Sanada et al. [
19]. A commercial CFD code of STAR CCM+ is applied to simulate the pure roll test for different surface ships with given dimensionless angular velocities. The simulation method is verified by conducting the grid and time-step convergence uncertainty analysis. The force and moment of different surface ships indicate the roll moment is greatest in the catamaran. Additionally, the roll moment of the DTMB and ONRT is greater than that of the KCS, due to the bilge keel attached to the DTMB and ONRT. By taking advantage of the CFD method, the flow field as free surface pattern, the pressure distribution, and the vortices field are analyzed during pure roll simulation. Then, roll-related derivatives in pure roll simulation are estimated. A comparison of derivatives due to roll rate demonstrates that the pure roll simulation brings acceptable results. Roll-related derivatives are used to complete the roll equation of motion for 4-DoF maneuverability.
4. Results and Discussion
Numerical simulation was used to carry out the pure roll simulation for different types of surface ships of the KCS, DTMB, ONRT, and Deft 372 catamaran at their design speed. Hydrodynamic force and moment were taken for three periods after a stable Kelvin wave was generated.
Figure 9,
Figure 10,
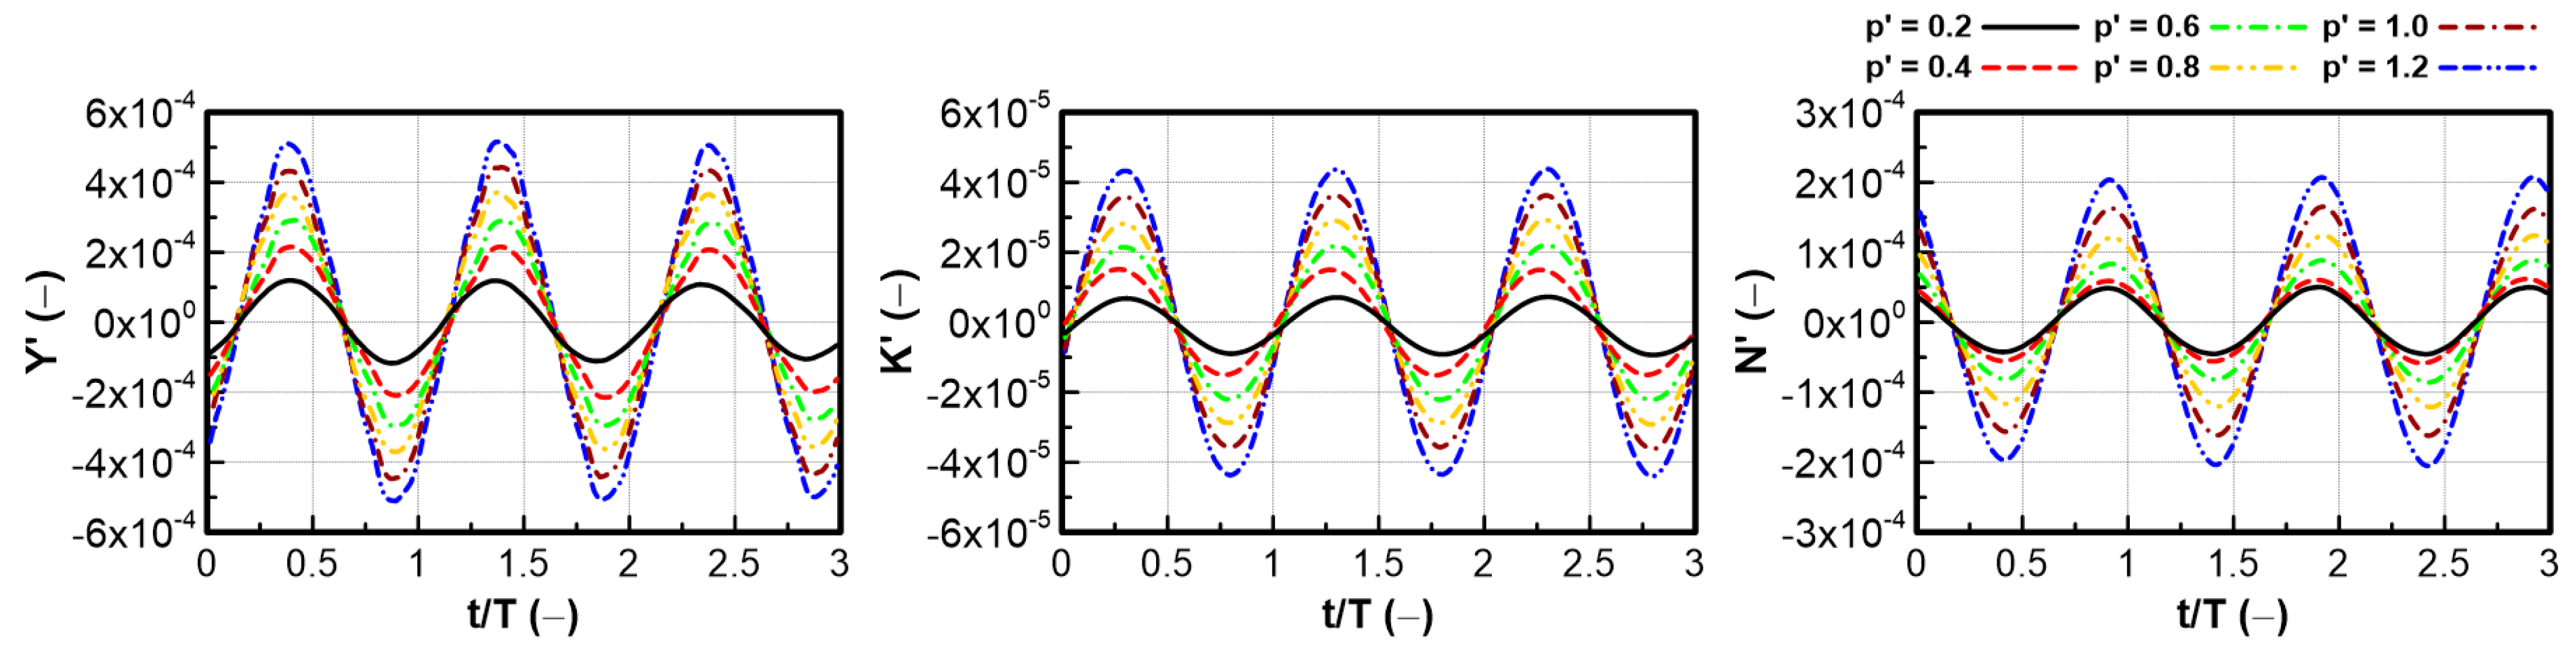
Figure 11 and
Figure 12 present the time histories of hydrodynamic force and moment during pure roll simulation of the KCS, DTMB, ONRT, and Delft 372 catamaran at different dimensionless roll angular velocities, respectively. It can be observed in all ships that as the dimensionless roll rate is increased, the amplitude of force and moment increase. Even though it was the pure roll test, the yaw moment was observed to be greater than the roll moment, except for the Delft 372 catamaran. This was demonstrated by Sadat-Hossenini [
14] for the ONRT when the yaw moment was larger than the roll moment in the static heel test. The roll moment of the catamaran is greater than the yaw moment, due to the entire demi-hull performing a mission of forcing water when the ship heels to the side, while for a single hull, the starboard or port side performs that mission. Moreover, the length-to-beam (
L/
B) ratio of the Delft 372 catamaran is small to be 3.2, which is also a reason to explain this problem. On the other hand,
Figure 13 compares the amplitude force and moment of the different surface ships. Because the roll moment of the KCS, DTMB, and ONRT is much smaller than that of the Delft 372 catamaran,
Figure 13d is plotted to observe clearly the difference in roll moment among single hulls. The comparison indicates that the force and moment are greatest in the Delft 372 catamaran, due to the entire demi-hull being forced to water when the ship heels to the side. For three single hulls, the roll moment of the ONRT and DTMB is observed to be greater than the KCS in
Figure 13d, because the bilge keel is a passive anti-roll device appended on the ORNT and DTMB. However, the roll and yaw moment of the DTMB is insignificantly larger than that of KCS, due to the slender body of the DTMB. In addition, a skeg equipped on the ONRT is a cause of the roll moment of the ONRT being larger than that of the DTMB. The yaw moment of different ships tends to be similar to the roll moment, while the sway force of the DTMB is significantly smaller than the KCS, and is seen to be nearly equal between the KCS and ONRT. This demonstrates that not only do the appendages of the bilge keel and skeg contribute to increasing the roll moment, but the surface shape also affects the change of the roll moment.
Figure 14 displays the Kelvin wave pattern generated around the surface ships during pure roll simulation. The wave pattern was generated to be different due to discrepancies in the surface shape, forward speed, and frequency of pure roll.
Figure 15 depicts the dynamic pressure distribution on the bottom of the ships in one period of pure roll simulation. The low-pressure distribution is observed at the side that is inclined, while the other side reaches the greater pressure distribution at that time. For example, when the ship heels to the starboard side (
t/
T = 1/4), the pressure distribution on the starboard is low, while the port side shows higher pressure, and vice versa. The low-pressure distribution at the inclined side is expanded to the middle of the bottom when the period time of
t/
T reaches 0 and 2/4.
Figure 16 and
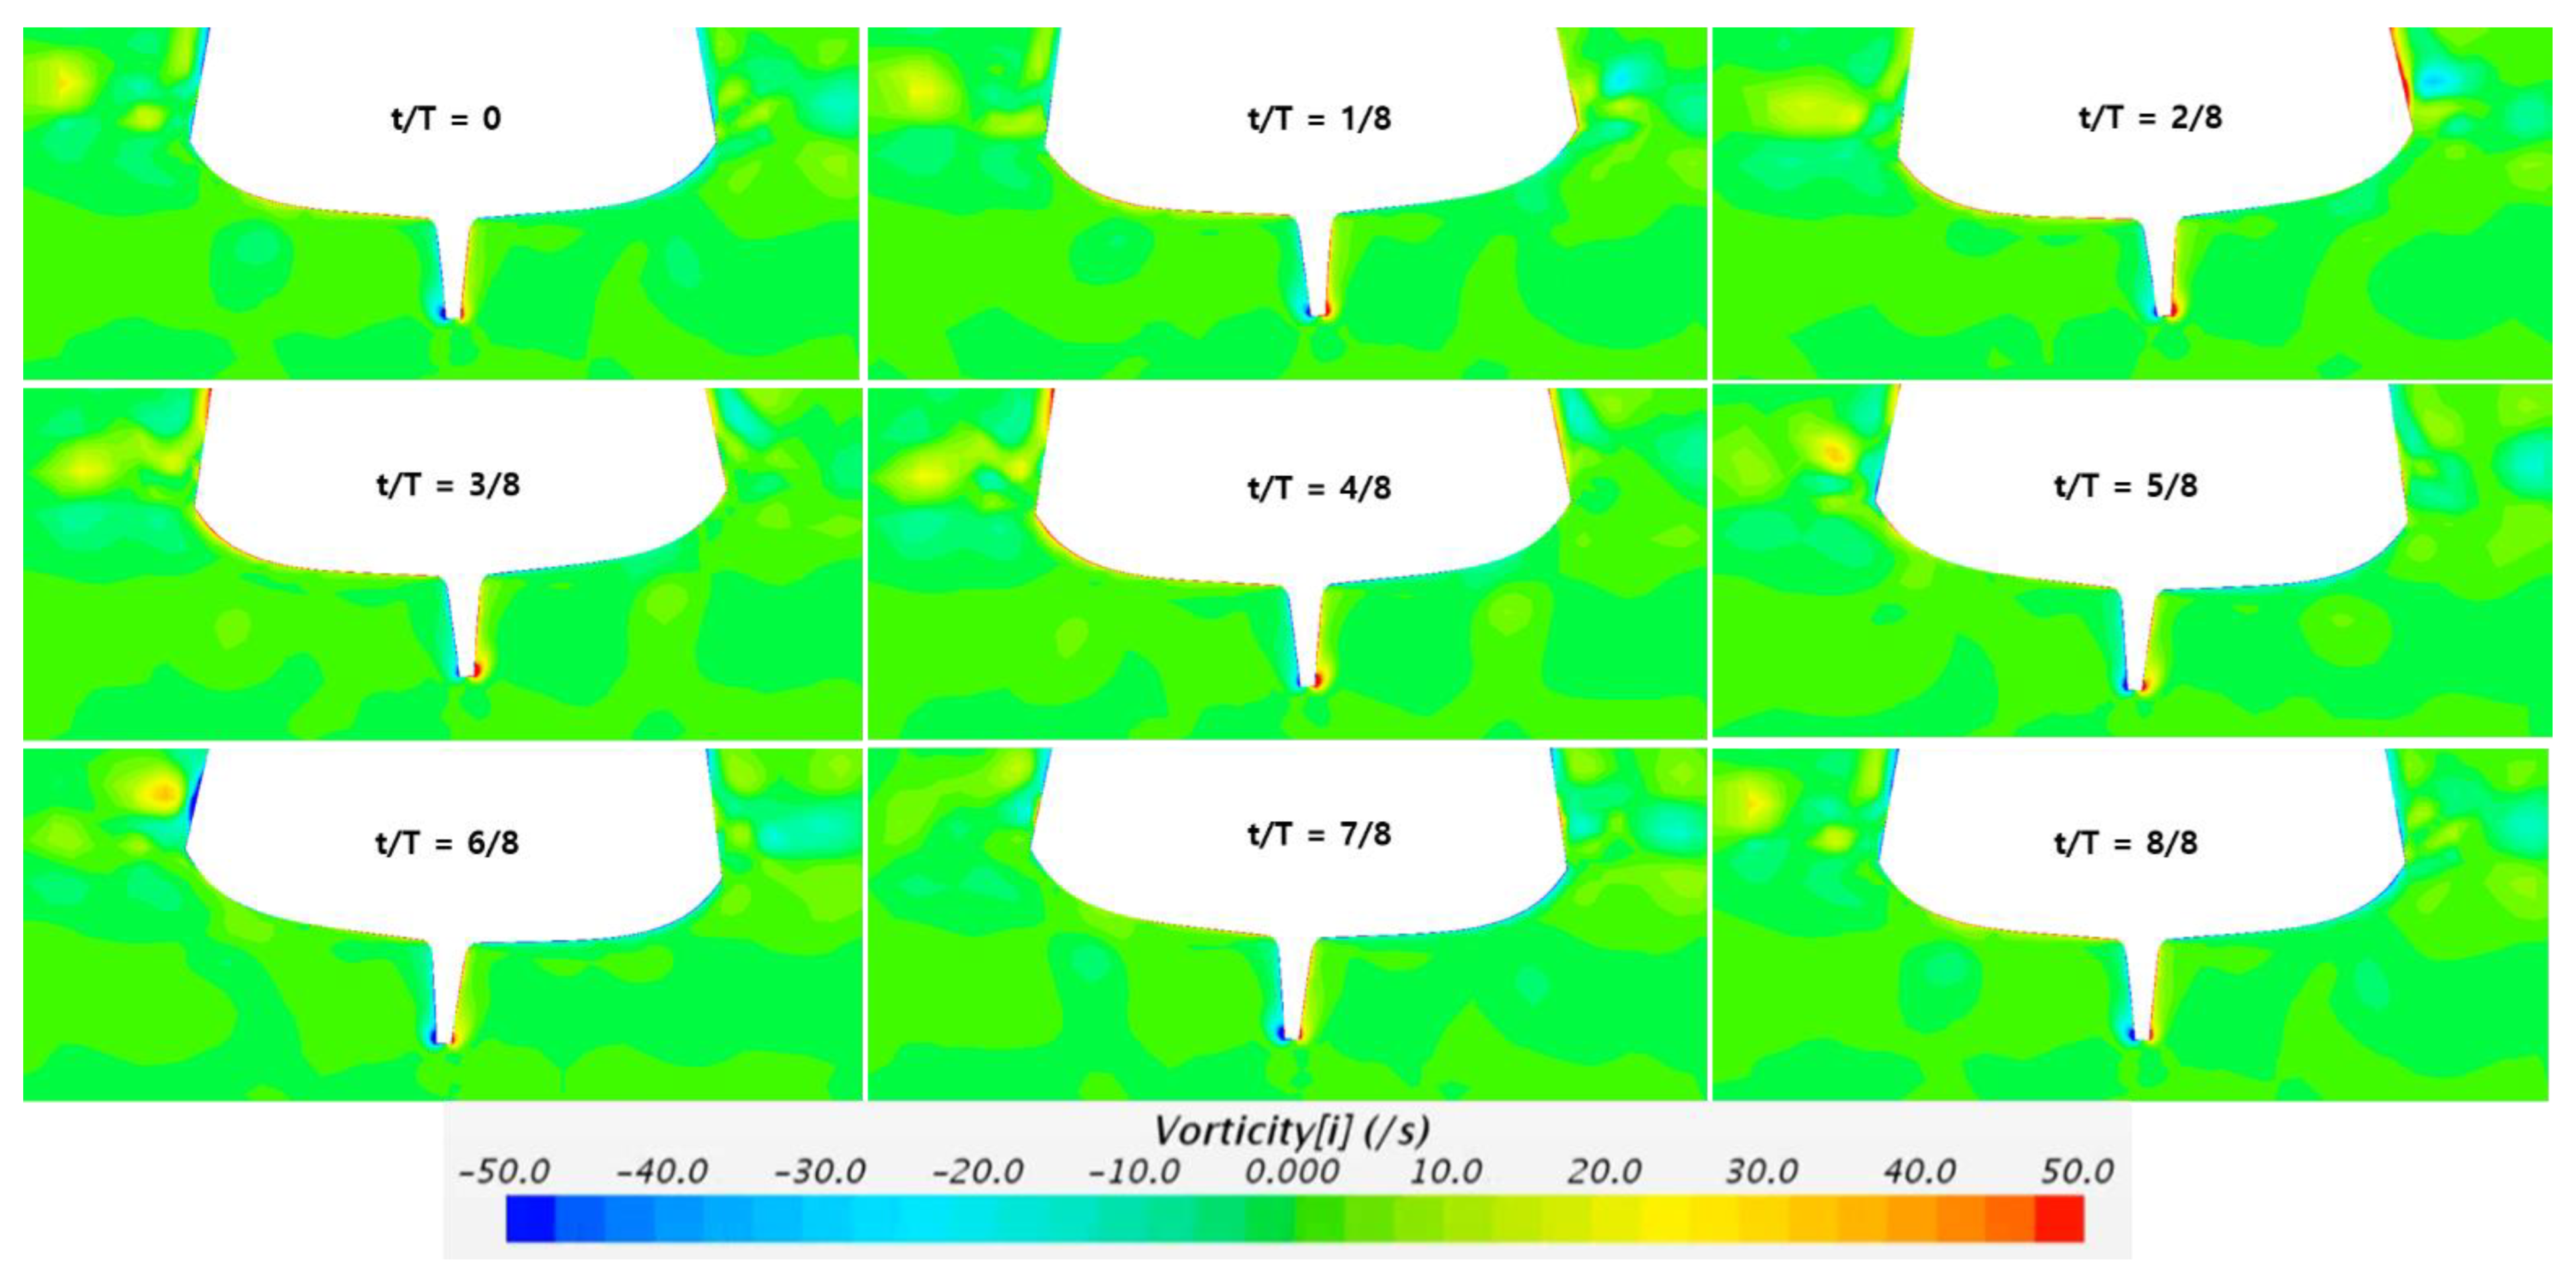
Figure 17 show the axial vortices around the bilge keel for one period of the DTMB and ONRT at the midship section. The bilge keel is attached to the ship hull as a passive anti-roll device to create extra damping, which leads to diminished roll motion and an increased period of motion due to increasing roll moment. Therefore, during the pure roll simulation, a vortex shedding is generated, which is the main physical phenomenon that affects the flow velocity around the ship. The vortices’ filament curls near the ends of the bilge keel, presenting the three-dimensional effect of the flow that can be seen. Moreover, the large and strong vortices are generated at
t/
T equal to 2/8 and 6/8, where full-grown positive and negative vortices are shed from the bilge keel when the roll angle reaches the peak. Here is also a place to generate the vortex interference that changes the magnitude of the vortices from strong to weaker, and vice versa. This is observed for both DTMB and ONRT.
Figure 18 depicts the axial vortices around the skeg for one period at
x/
Lpp = −0.381 of ONRT. The vortices are generated near the ends of the skeg. This demonstrates that the skeg also contributes to reducing the roll motion and increasing the roll moment. Therefore, the roll moment of ONRT is greater than that of DTMB as shown in
Figure 13.
The hydrodynamic force and moment of pure roll simulation are distinguished into in-phase and out-of-phase components by Fourier analysis, where the in-phase component determines the added mass due to angular acceleration, while the out-of-phase component determines the damping derivative due to angular velocity.
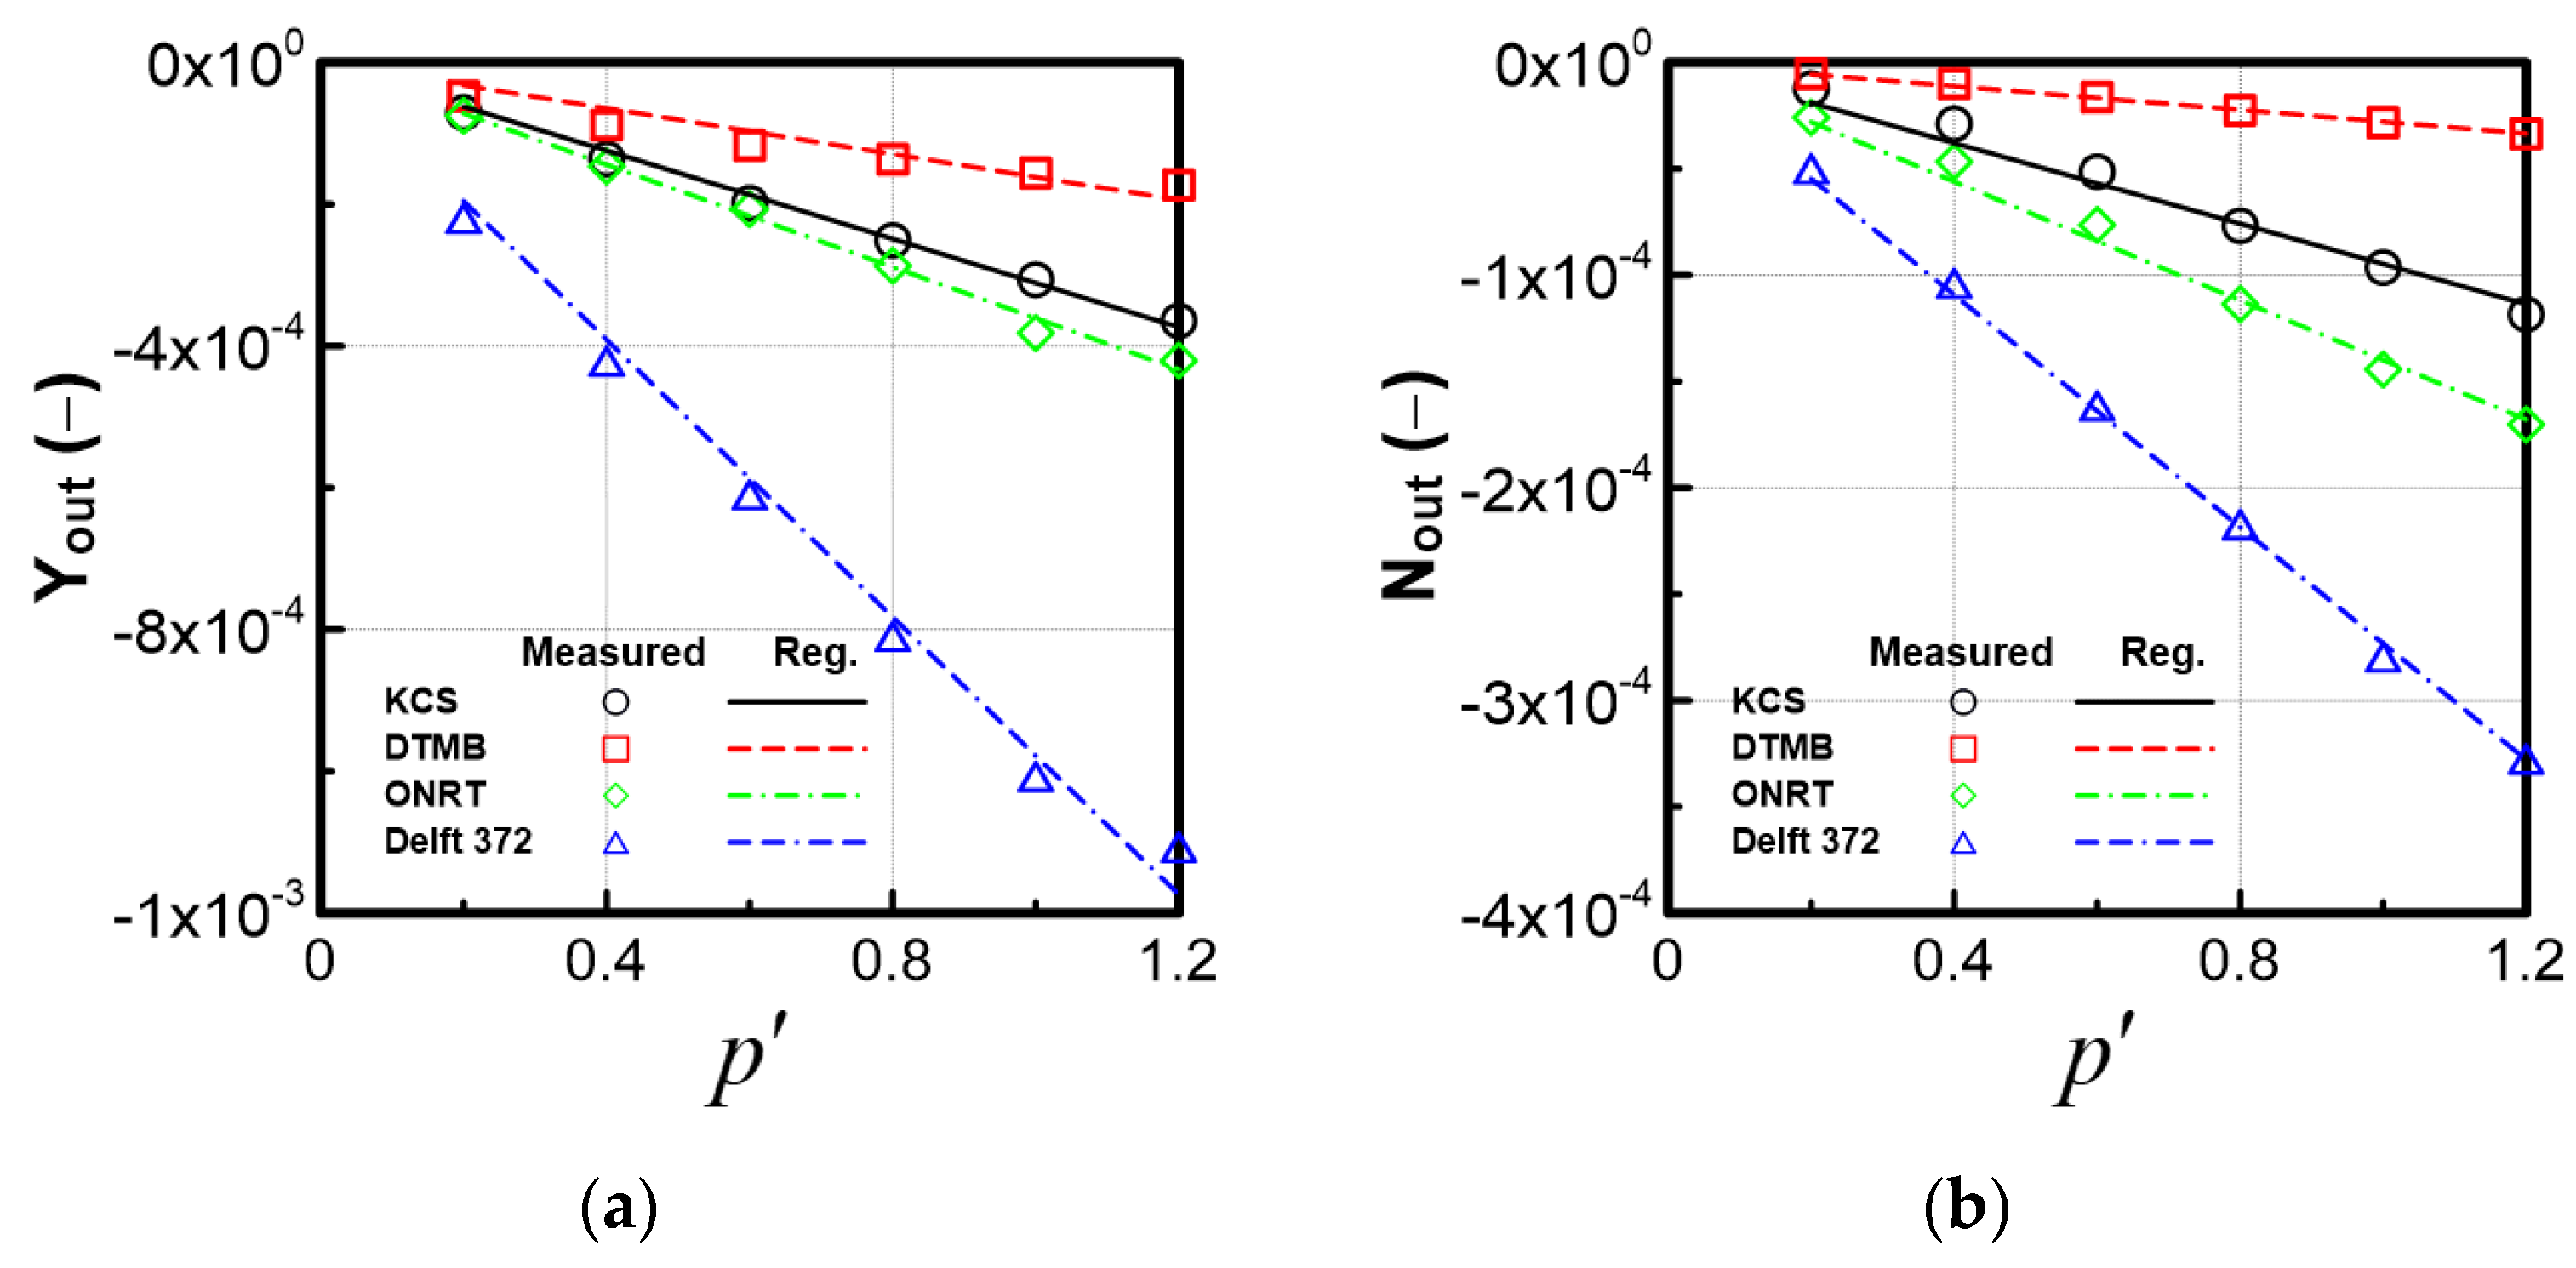
Figure 19 and
Figure 20 show the results of the in-phase component and out-of-phase component of different ships, respectively. The in-phase due to roll acceleration and out-of-phase due to roll rate are observed to be linear. Similar to the tendency in hydrodynamic force and moment, the in-phase and out-of-phase of the Delft 372 catamaran are greatest, in which the roll moment shows a significant discrepancy to be 9.6 times in in-phase and 11 times in out-of-phase compared with the ONRT at a dimensionless angular velocity of 1.2. The roll moment of the DTMB is smaller than the KCS at in-phase, but greater than at out-of-phase. For sway force, the in-phase and out-of-phase of the DTMB are the smallest. Although the amplitude of sway force is nearly the same between the KCS and ONRT, the in-phase of the ONRT is shown to be slightly greater than that for the KCS, while out-of-phase shows a smaller amount. For the yaw moment, the in-phase of the DTMB is greater than that of the KCS and ONRT; meanwhile, it is smaller than that of the out-of-phase of the KCS and ONRT in out-of-phase. This demonstrates that both in-phase and out-of-phase have a significant effect on the amplitude of the roll moment. After fitting the in-phase and out-of-phase by linear regression, the roll-related derivatives in pure roll simulation for each ship are calculated based on Equations (5) and (6), respectively.
Table 5 lists the roll-related derivatives in pure roll simulation that are then estimated. These derivatives will be used to complement the equation of roll moment in the 4-DOF equation of motion.
Table 6 compares the derivatives obtained from pure roll simulation and system identification performed by Yoon et al. [
12] for the container ship and Jeon et al. [
14] for the ONRT. The present results show a similar tendency to the derivatives due to roll rate, especially in the container ship, where the present derivatives are in good agreement with the system identification results. Comparing the estimated derivatives due to roll rate indicates that the pure roll simulation yields acceptable results.
5. Conclusions
In this paper, the roll-related derivatives, which were roll-added mass and roll damping due to roll rate, were estimated through pure roll simulation for different surface ships using the CFD simulation method.
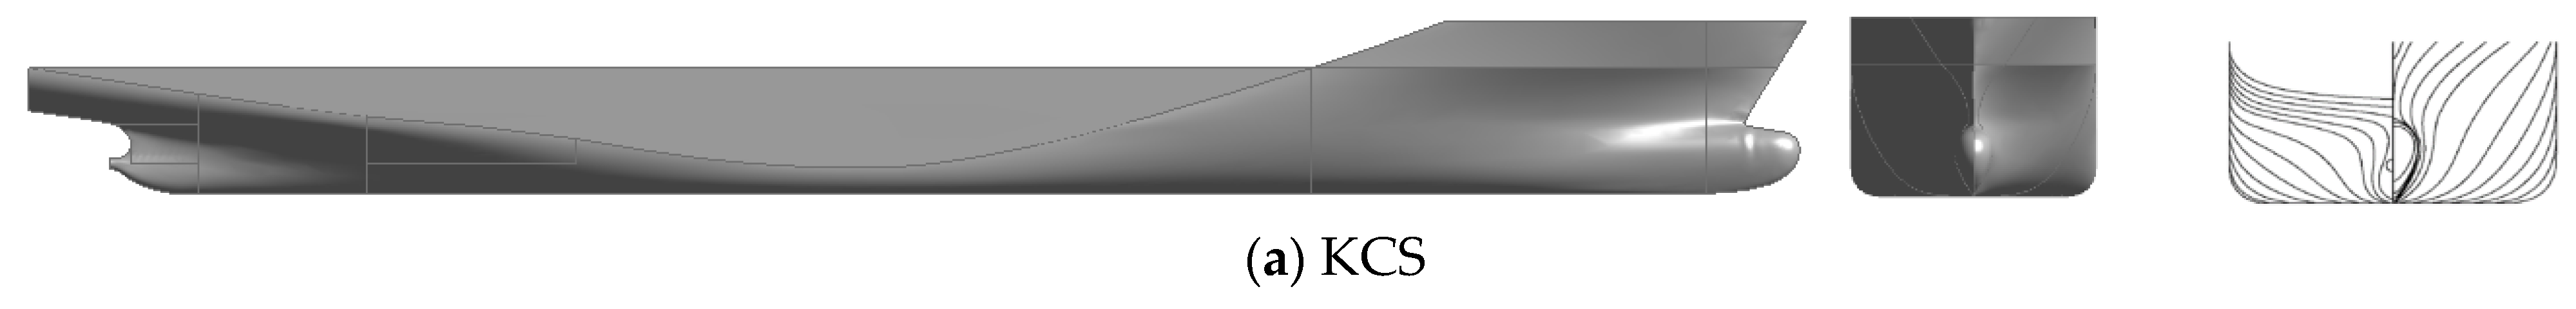
The KCS, DTMB, ONRT, and Delft 372 catamaran were selected in this study because they have the characteristics that roll moment becomes dominant, as designed with small GM in the KCS, DTMB, ONRT, and high-speed catamaran. In particular, the passive anti-roll device as bilge keel was appended on the DTMB, and both bilge keel and skeg devices were equipped on the ONRT.
The CFD simulation method was verified by performing the uncertainty analysis of the grid and time-step based on the Richardson Extrapolation method. Generally, the uncertainty error shows less than 5% for both grid and time-step, which indicated that the present method shows good convergence. Therefore, the present numerical simulation was acceptable to execute the pure roll simulation.
Hydrodynamic force and moment throughout pure roll simulation were taken three periods after the wave was generated in stable condition. The force and moment of the Delft 372 catamaran were observed to be greatest, due to the entire demi-hull being forced to water when the ship heels. The roll moment of the ONRT and DTMB was larger than that of the KCS, because they were appended with the bilge keel. Additionally, the skeg was attached on the ONRT, which is the reason the roll moment was larger than for the DTMB. Furthermore, the roll moment of the DTMB was insignificantly larger than that of the KCS, due to the slender shape of the DTMB. Therefore, it demonstrates that not only do the appendages of the bilge keel and skeg contribute to increasing the roll moment, but the surface shape also affects the change of roll moment.
Based on the advantages of the CFD method, the flow field as wave pattern, pressure distribution, and axial vortices around the surface ships were analyzed during pure roll simulation. Low-pressure distribution was observed at the inclined side, while the other side reached greater pressure. In addition, the low-pressure distribution was expanded to the middle of the bottom when the period time t/T reached 0 and 2/4. On the other hand, axial vortices flow was generated near the ends of the bilge keel in the DTMB and ORNT. The full-grown vortices shedding from the bilge keel were observed when the roll angle reached the peak. The generation of vortices demonstrated that bilge keel and skeg contribute to reducing roll motion and increasing roll moment. Flow analysis proved that the obtained force and moment were reasonable.
The hydrodynamic force and moment of pure roll simulation were then distinguished into in-phase and out-of-phase components based on Fourier analysis for different dimensionless angular velocities. Using linear regression to fit the in-phase and out-of-phase, the roll-added mass and damping derivative in the pure roll simulation were estimated. A comparison of the damping derivatives due to roll rate with results obtained from the system identification technique demonstrated that the pure roll simulation using the CFD method brought acceptable results. Pure roll simulation can be applied to determine roll-related derivatives in the early design stage. Those derivatives were used to complete the roll equation of motion for 4-DoF maneuverability.


