Article

Seasonal and Spatial Variations in Fish Assemblage in the Yangtze Estuary and Adjacent Waters and Their Relationship with Environmental Factors

1
CAS Key Laboratory of Marine Ecology and Environmental Sciences, Institute of Oceanology, Chinese Academy of Sciences, Qingdao 266071, China
2
Laboratory for Marine Ecology and Environmental Science, Qingdao National Laboratory for Marine Science and Technology, Qingdao 266237, China
3
University of Chinese Academy of Sciences, Beijing 100043, China
4
College of Ocean and Earth Sciences, Xiamen University, Xiamen 361005, China
5
Center for Ocean Mega-Science, Chinese Academy of Sciences, Qingdao 266071, China
6
Institute of Hydrobiology, Chinese Academy of Sciences, Wuhan 430072, China
*
Author to whom correspondence should be addressed.
J. Mar. Sci. Eng. 2022, 10(11), 1679; https://doi.org/10.3390/jmse10111679
Submission received: 8 October 2022 / Revised: 1 November 2022 / Accepted: 3 November 2022 / Published: 7 November 2022
(This article belongs to the Special Issue Estuarine Fish Ecology)

Abstract

:
In this work, we identified the seasonal and spatial variations in fish assemblages and their relation to environmental variables in the Yangtze Estuary and adjacent waters. A total of 61 fish species in 32 families were identified over four seasons; of these, 12 species were dominant and Harpadon nehereus was the most dominant species. Fish varied in abundance, biomass, and species composition in different seasons; both biomass and abundance were highest in autumn and lowest in spring. Fish can be spatially divided into high-salinity assemblages and low-salinity assemblages. The spatial variation in fish assemblages was caused by the selectivity and adaptability of species for the environmental conditions of the estuary and the seasonal variation in fish assemblage structure likely resulted from migrations of dominant taxa associated with fish spawning and foraging behavior as well as the environment. The results of CCA analysis showed that temperature, depth, salinity, dissolved oxygen, and chlorophyll were the major factors affecting the fish assemblage differences throughout the seasons. Of these, temperature drove the seasonal variation in assemblage structure, while salinity significantly affected the spatial distribution of assemblages. This paper revealed the relationship between the seasonal and spatial distribution patterns of the fish assemblage and environmental factors and the results could provide a scientific basis for the management and sustainable utilization of fishery resources in the Yangtze Estuary and adjacent waters.

1. Introduction

The Yangtze Estuary is the largest estuary in China and its environment is complex and diverse [1]. Sea currents in this area are affected by many factors, such as fresh water from the Yangtze River, the northern Jiangsu coastal current, the Taiwan warm current, and the branch of the nearshore Kuroshio [2]. This estuary is highly productive and rich in biological resources. Due to the nourishment of the Yangtze Estuary, many species live in the Yangtze Estuary and adjacent waters and others migrate to and/or through it to reproduce, deposit or release eggs, rear young, or feed during their life cycles [3]. Favorable habitat, baiting, and breeding conditions make the Yangtze Estuary the largest estuarine fishery in China: the Yangtze Estuary Fishery.
In recent years, the waters of the Yangtze Estuary have faced enormous environmental pressure, with nutrients such as inorganic carbon and reactive phosphate exceeding the standard and the seawater being eutrophicated, causing frequent red tides, thereby causing fish death, affecting fish spawning and migration and reducing the fish catches [4]. Human activities, such as tidal flat reclamation, have also caused habitat destruction [5]. The fishery resources of the Yangtze Estuary have faced great threats in recent years, showing obvious characteristics of resource decline, such as reduced biodiversity, individual fish catch, and declining fishing production [6]. Ecological protection and restoration of this estuary is urgently required [7].
The basic research on fish assemblages in the Yangtze estuary plays a crucial supporting role in the rational utilization and effective protection of fishery resources, especially the scientific basis for policy formulation. Most studies on fish in the Yangtze Estuary had focused on species composition, biodiversity, and fishery resources [8,9,10]. Only a small number of studies had reported interannual and spatial differences in fish assemblage structure adjacent to the Yangtze Estuary and how these are related to environmental factors [3,11,12,13]. There is a lack of seasonal and spatial variation studies of fish assemblages in recent years.
We analyzed seasonal fish and environmental survey data in the Yangtze Estuary and adjacent waters to identify seasonal and spatial variations in fish assemblages and their relation to environmental variables, ultimately providing a scientific basis for improving the management of fishery resources in the region.

2. Materials and Methods
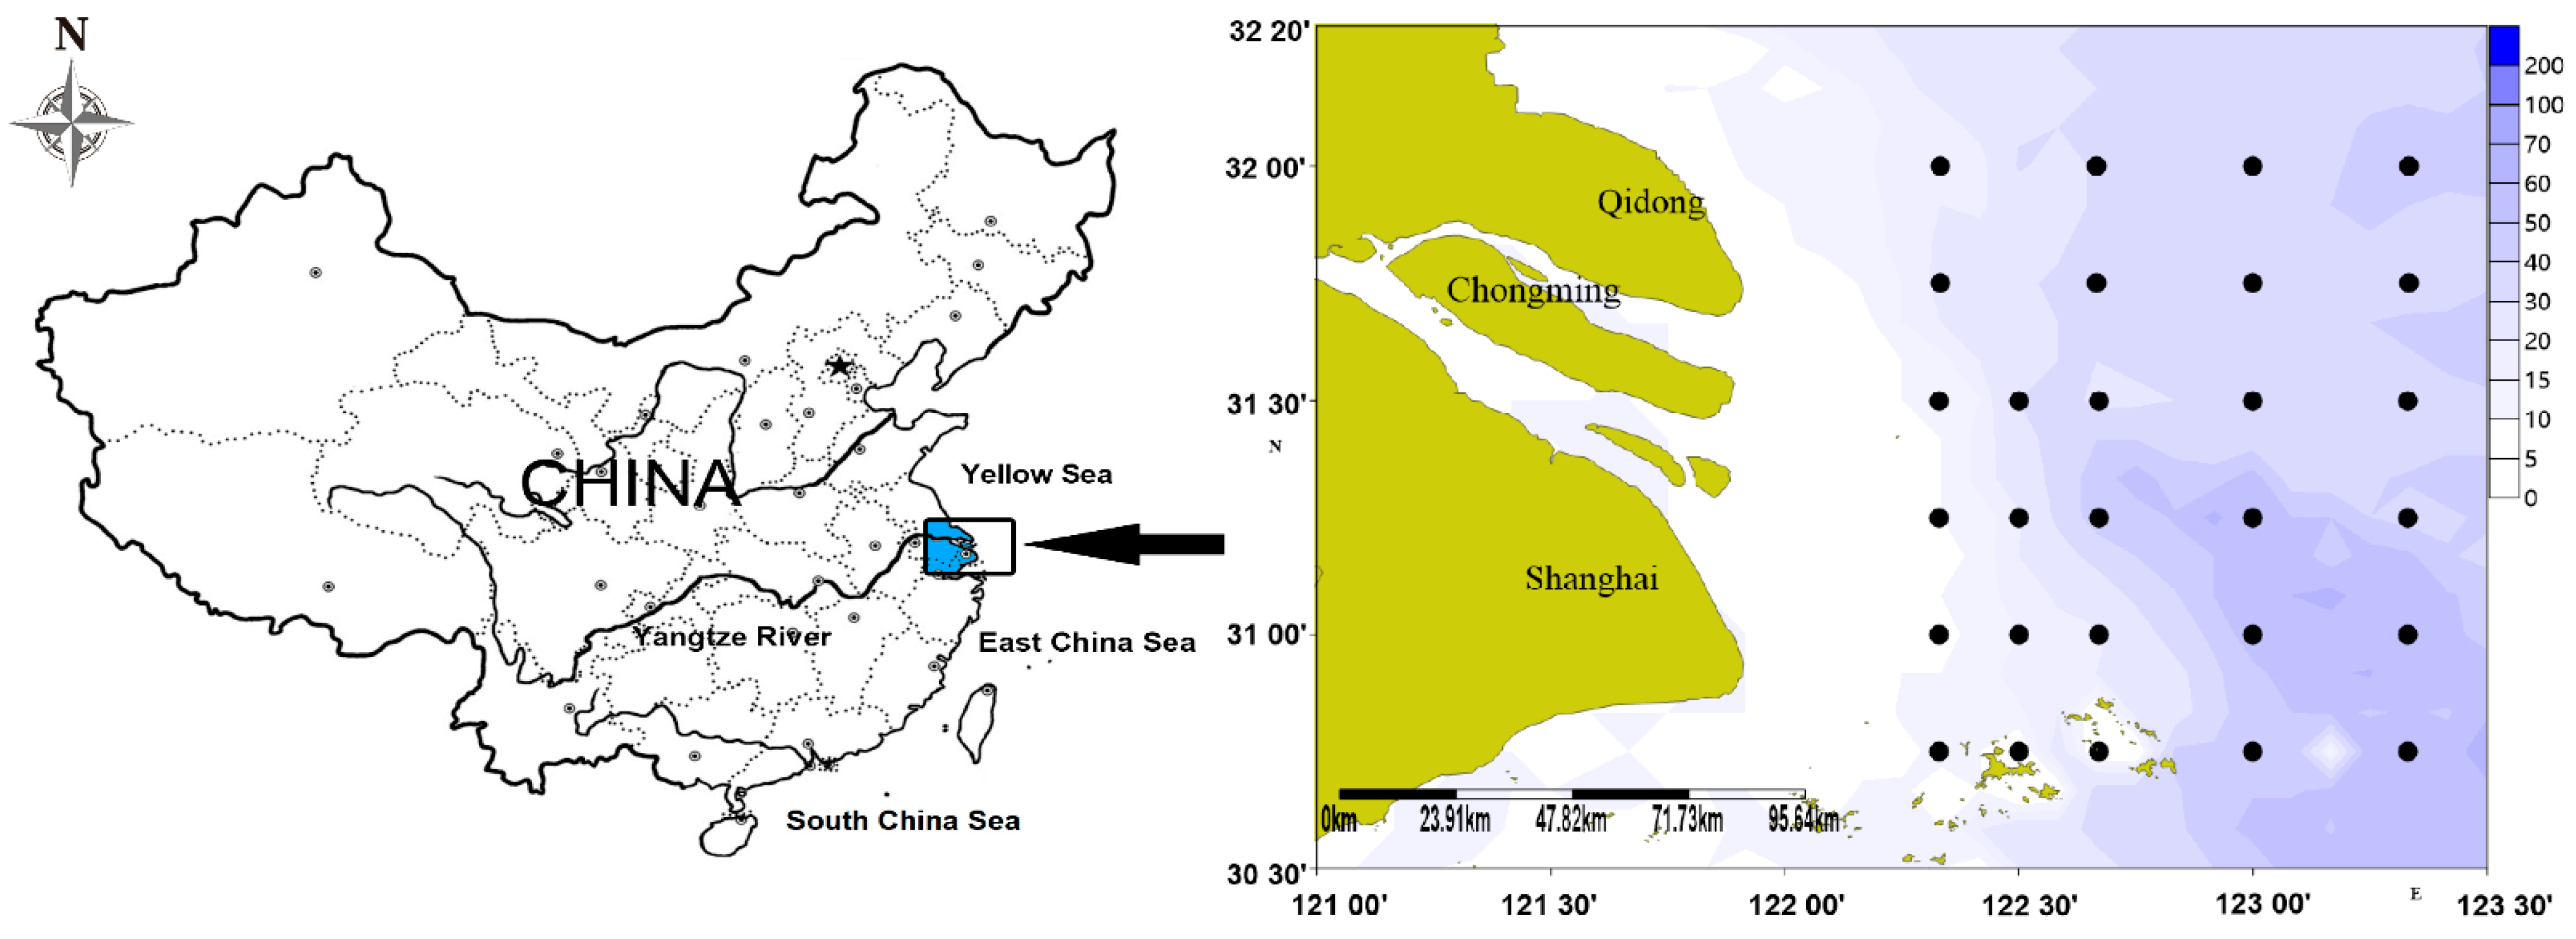
2.1. Study Area

Surveys were conducted in February (winter), May (spring), August (summer), and November (autumn) of 2018. Due to the water depth and fishing prohibition policy, trawling was only carried out in the Yangtze Estuary’s adjacent waters and there was no trawling site in the Yangtze Estuary (Figure 1). There were 28 survey stations in total: 16 in February and May, 12 in August, and 15 in November. These sites were chosen because they included a gradient of environmental variation from the estuary to the open sea. Weather and equipment failure resulted in not all sites being sampled for each survey.

2.2. Sampling

The survey fishing vessel, the “Zhe Shengyu 10201”, is a 255 KW bottom trawler. The light trawl net measures 150.5 × 96.5 m and has a mouth perimeter of 150.5 m, upper line length of 66 m, lower line length of 73 m, and maximum mesh of 200 mm. The mesh diameter decreased from the net body to the pocket net (30 mm). The net headline height during trawling ranges from 9–11 m, the average distance between the net sleeves was 18 m, and the net was trawled at 2–3 Kn for 0.5–1 h at each station.
Fish were frozen and delivered to a laboratory for identification using the taxonomic keys and catalogue of marine and freshwater fish. Each specimen was measured in centimeters and weighed with an electronic scale to grams. Environmental parameters were collected from surface water at catch collection sites. At each station, a conductivity, temperature, and depth (CTD) device recorded salinity (S), depth (D), and temperature (T); the water samples collected by the water bottle were collected and frozen for subsequent laboratory analysis (pH, turbidity (Turb), dissolved oxygen (DO), total phosphorus (TP), total nitrogen (TN) and chlorophyll a (Chl a)). Turbidity was measured by a turbidity meter, dissolved oxygen was measured by an iodometric titration, total nitrogen and total phosphorus were measured by an QuAAtro Continuous-flow Analyzer, and chlorophyll a was measured by fluorescence extraction. All of these were determined in the study according to GB/T 12763-2007 specifications for oceanographic surveys (SAC, 2007).

2.3. Data Analysis

Species abundance and biomass at each station were expressed as 103 individuals per km2 (103 ind. km−2) and kilogram per km2 (kg km−2), respectively. The dominant fish species were classified using the index of relative importance (IRI), calculated as:
IRI = (N% + W%) × F% × 10,000,
where N%, W%, and F% are relative abundance, biomass, and frequency of occurrence, respectively.
Based on the IRI index of relative importance, fish species with IRI >1000 are deemed to be dominant. Only species that appear in at least two stations are included in follow-up data analysis [14].
Levene’s and Kolmogorov–Smirnov tests were applied to determine data homoscedasticity and normality, respectively, after which one-way ANOVA was used to analyze the seasonal variation in fish assemblage abundance, biomass, biodiversity indexes and environmental factors and Student’s t-test was applied to analyze the spatial difference in environmental factors among regions.
Canonical correspondence analysis (CCA) was used to explore relationships between fish assemblages and the measured environmental variables. Detrended correspondence analysis (DCA) was first performed to determine a suitable response according to the maximum gradient length of the first DCA axis (>4, CCA; >4 and <3, CCA or RDA; <3, RDA). In CCA analysis, a Monte Carlo test was used to confirm the significance and importance of each environmental variable and to perform CCA ranking with a significance of p < 0.05. Analyses were performed using SPSS 21.0 (data), PRIMER 6.0 (assemblages), and CANOCO 5.0 (ranking).

3. Results

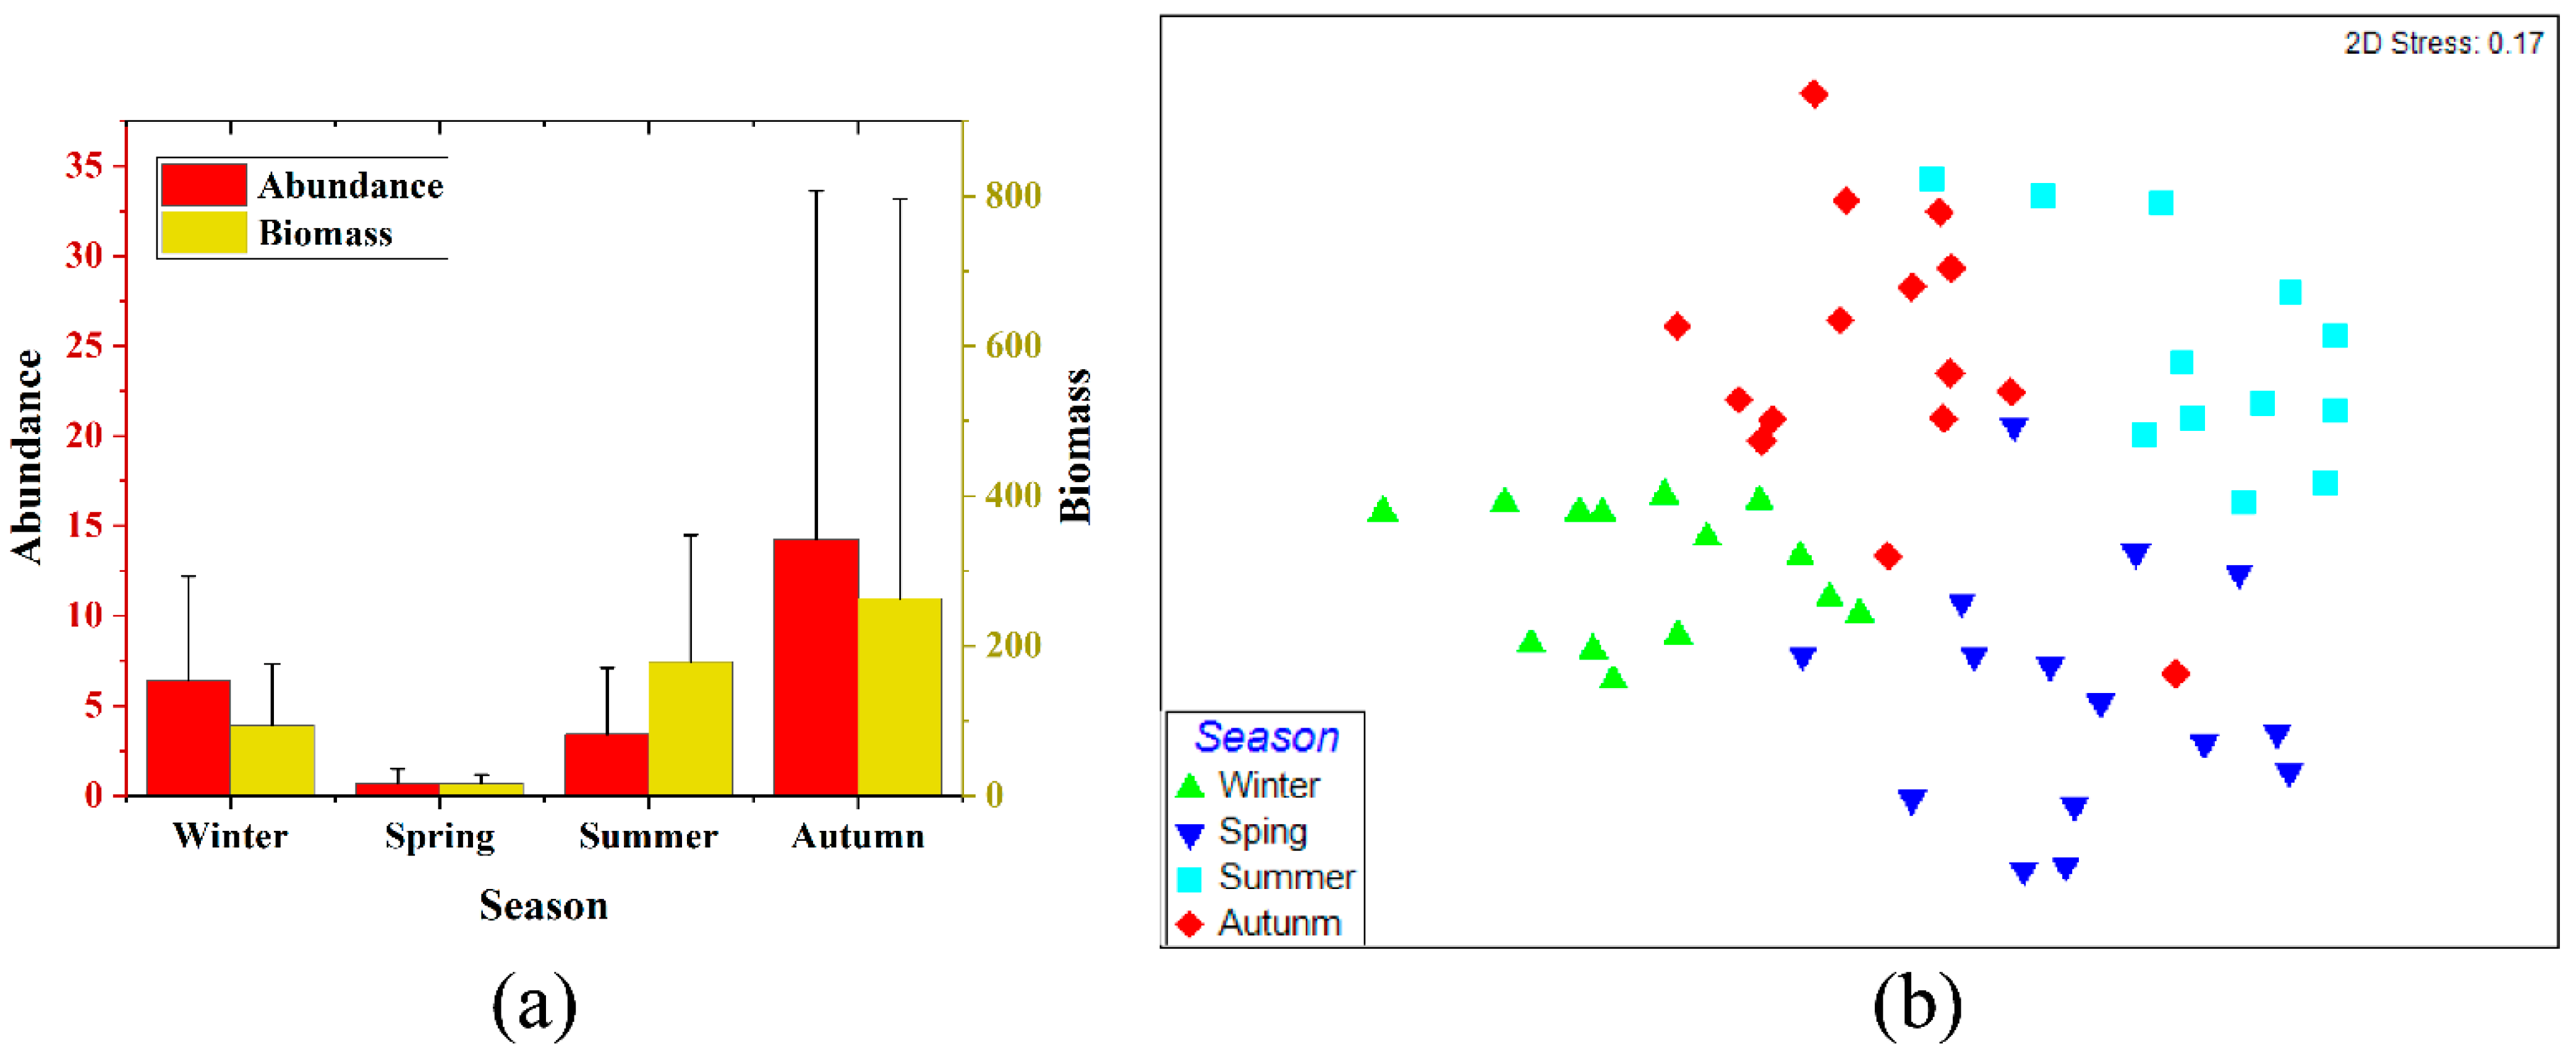
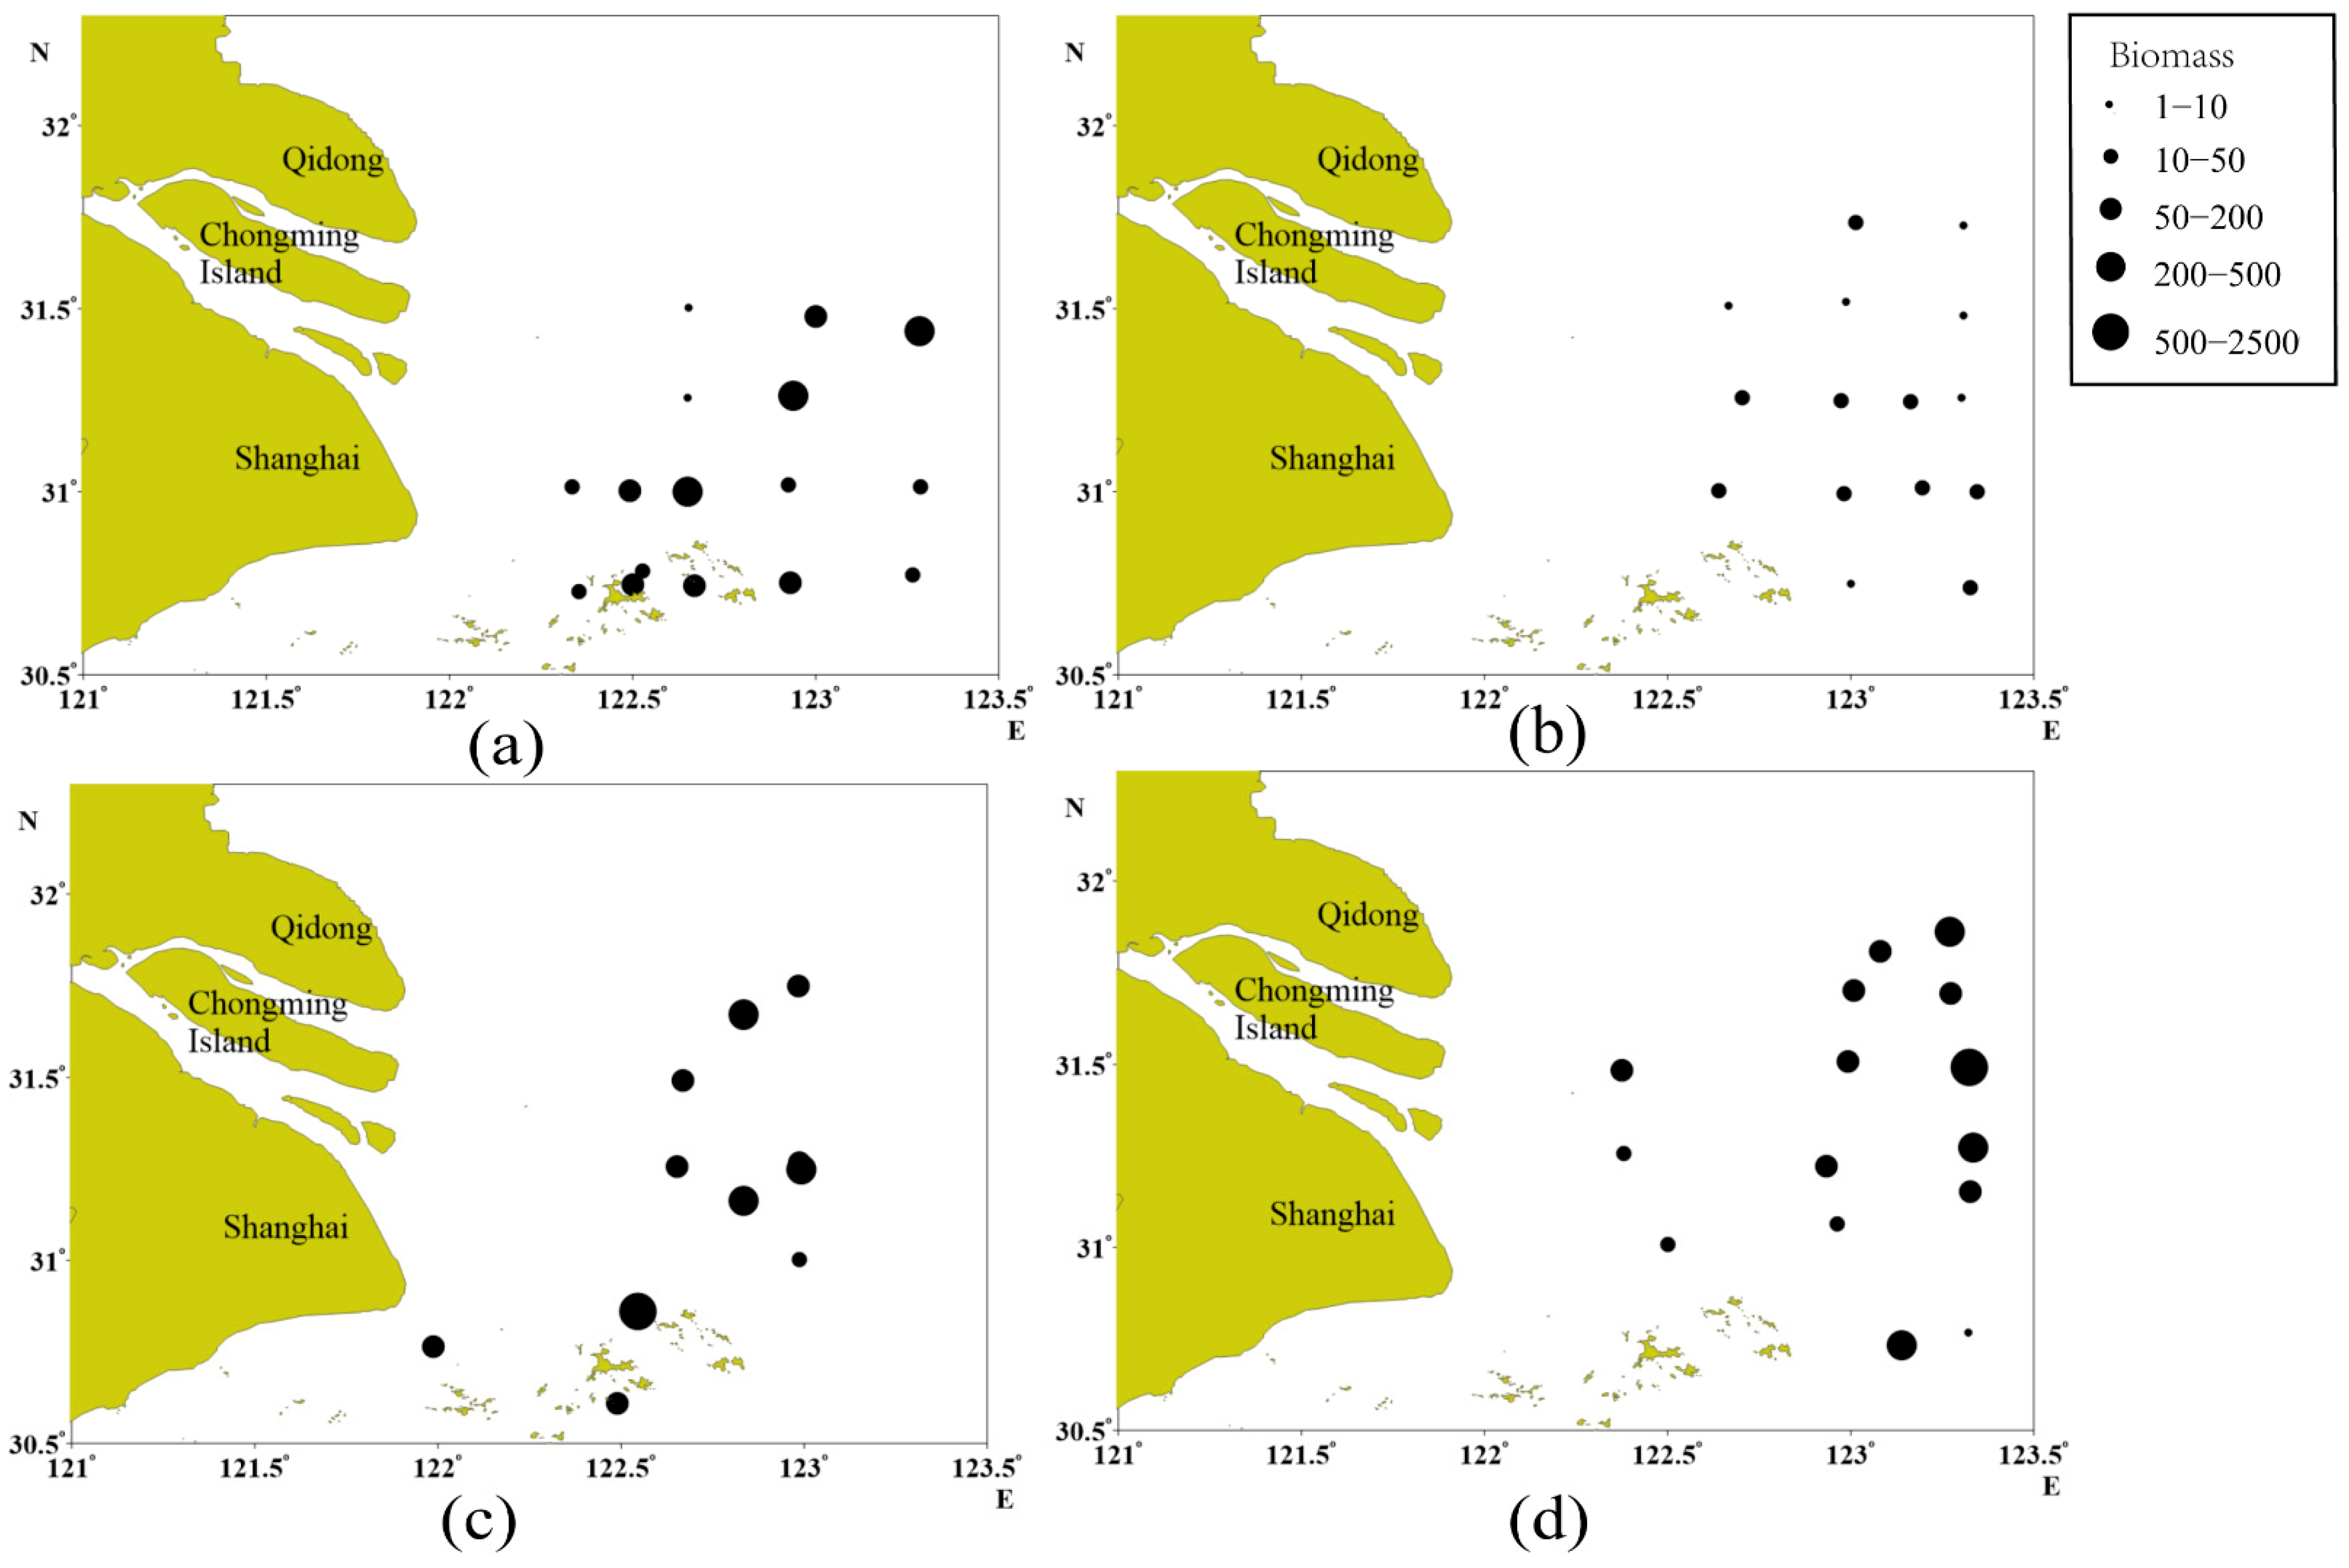
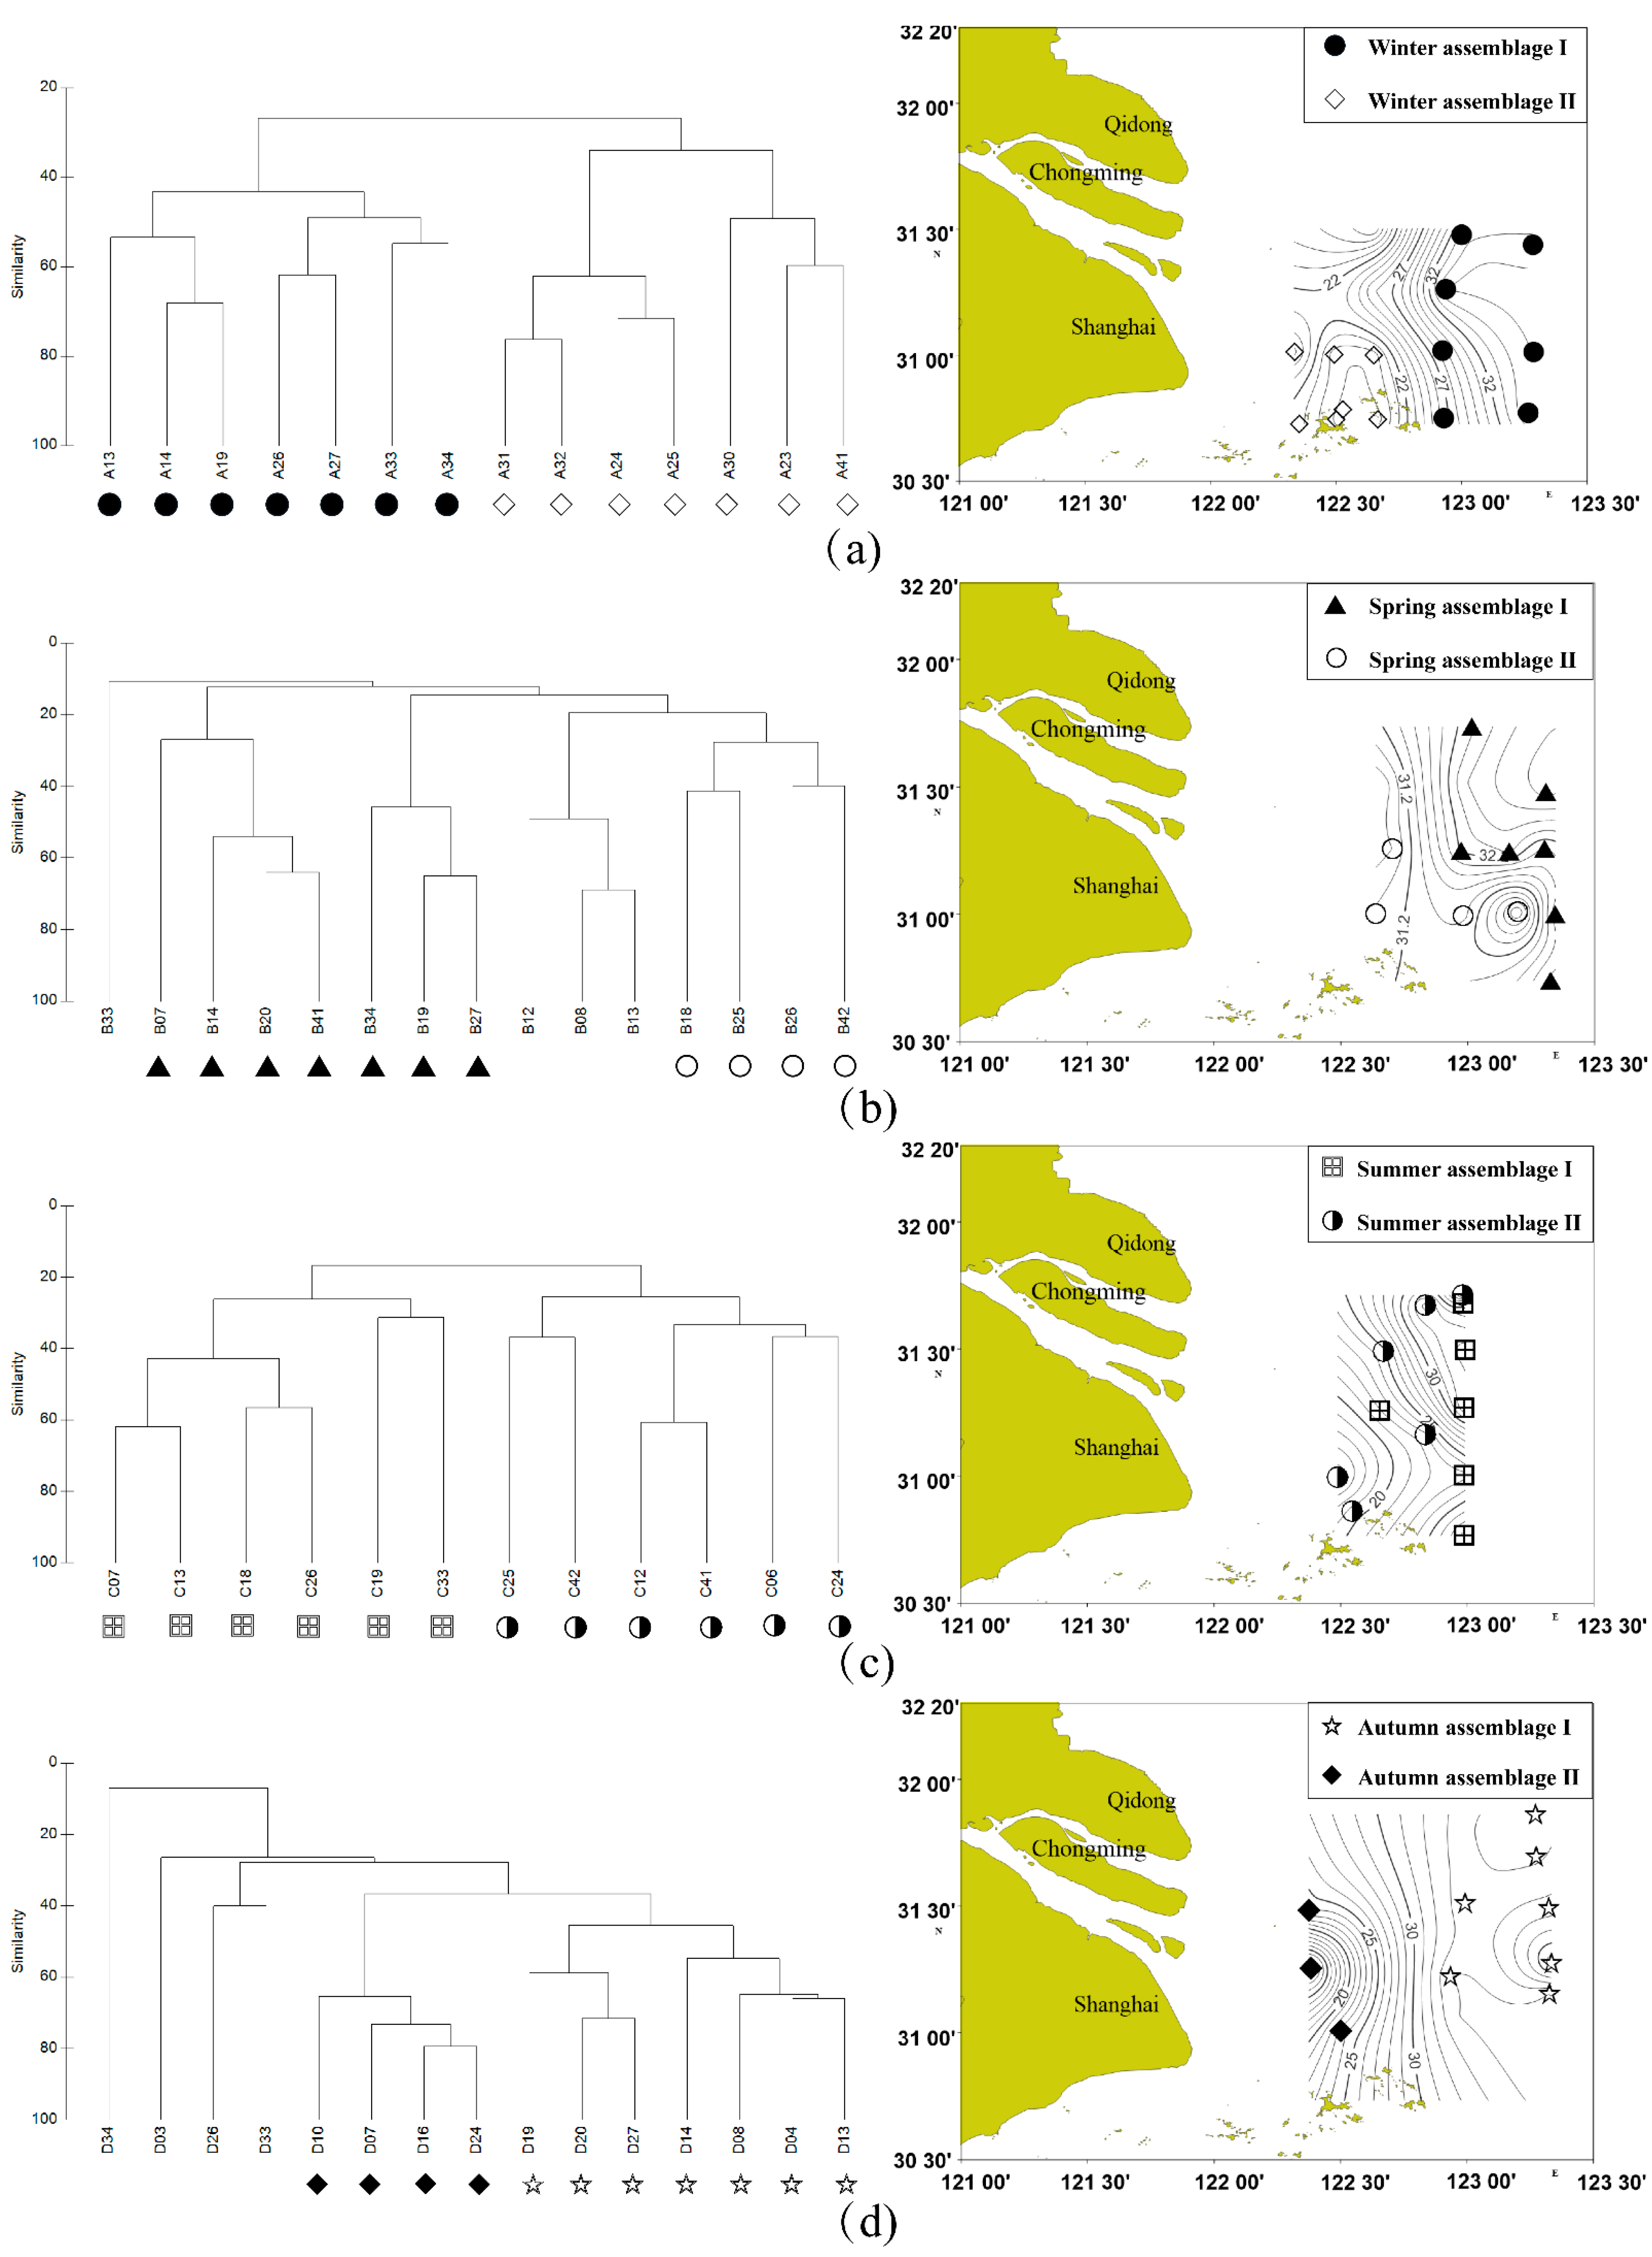
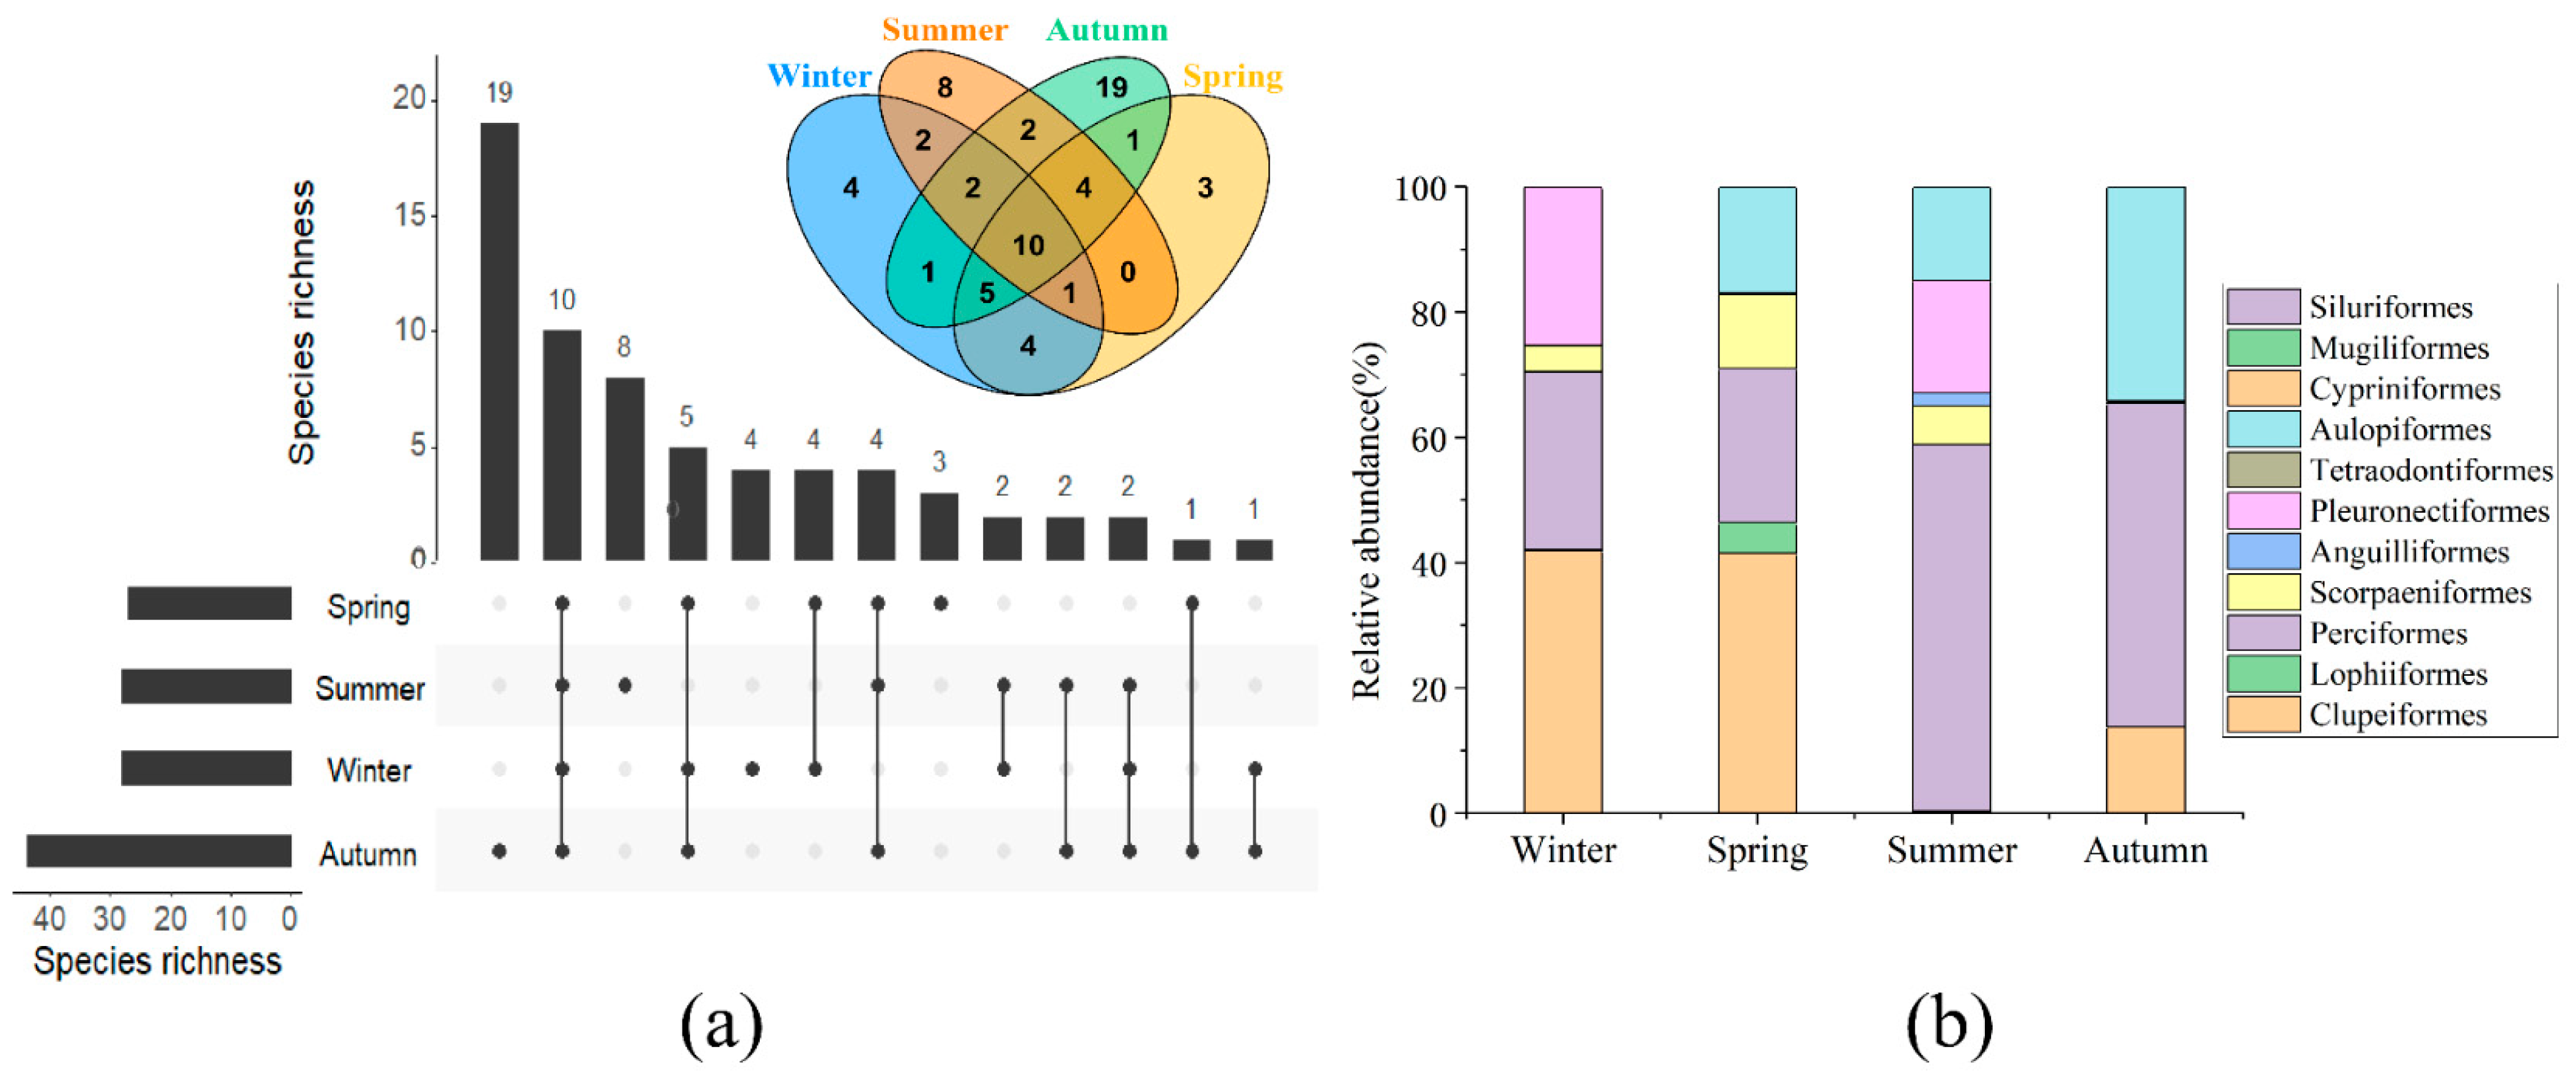
3.1. Seasonal and Spatial Variations in Fish Assemblages

Seasonal variations in fish abundance and biomass are shown in Figure 2a. Because the number of stations selected was different in season, the overall abundance and biomass of each season cannot be compared; we used the mean abundance and mean biomass of each station in a given season. Fish abundance and biomass were high in autumn, at 14.24 kN/km2 and 262.97 kg/km2, respectively, and low in spring, at 0.70 kN/km2 and 16.04 kg/km2, respectively. Spring values were significantly lower than those in winter and autumn (p < 0.05). The number of fish and individual biomass were significantly higher during autumn than in spring. There were no significant differences between other seasons (p > 0.05).
Clear seasonal differences in fish assemblages are shown in the NMDS plot (Figure 2b), with an adequate stress value of 0.17. ANOSIM reveals fish assemblages in each season to differ significantly (winter vs. spring: R = 0.553, p = 0.001; winter vs. summer: R = 0.692, p = 0.001; winter vs. autumn: R = 0.499, p = 0.001; spring vs. summer: R = 0.401, p = 0.001; spring vs. autumn: R = 0.591, p = 0.001; summer vs. autumn: R = 0.372, p = 0.002).
The spatial distribution of fish biomass for each season is shown in Figure 3. High biomass occurred during winter in southern and northern waters, spring biomass in southern waters was significantly higher than in northern waters, biomass was highest in the central area in summer, and biomass in offshore waters was significantly higher than in nearshore waters in autumn. The spatial distribution of biomass varied in different seasons.
Fish were spatially divided into high-salinity assemblage and low-salinity assemblage. Figure 4 depicts seasonal fish assemblages. Two salinity-based assemblages were apparent in each season: a high salinity (I) and a low salinity (II). Assemblage I mostly occurred in the western survey area near the Yangtze Estuary, and assemblage II mostly occurred in the eastern survey area. ANOSIM reveals significant seasonal differences in the composition of the two assemblages (winter assemblage I vs. II: R = 0.766, p = 0.001; spring assemblage I vs. II: R = 0.452, p = 0.009; summer assemblage I vs. II: R = 0.674, p = 0.002; autumn assemblage I vs. II: R = 0.767, p = 0.003).

3.2. Species Composition

In total, 61 fish species in 11 orders and 32 families were identified within trawl samples. Most (44) species were collected in autumn, followed by 28 each in winter and summer, and 27 in spring (Figure 5a). Of these, 10 occurred each season and 19 occurred only in autumn. Perciformes and Clupeiformes taxa were most commonly encountered (Figure 5b). Perciformes was the most species rich order (25 species), followed by Scorpaeniformes (10 species), Clupeiformes (8 species), and Pleuronectiformes (6 species); remaining orders contain fewer species.
Throughout 2018, 12 species had IRI values >1000 and dominated samples (Figure 6). Both the dominant taxa and the degree of dominance changed seasonally. Four species (Setipinna taty, Coilia mystus, Collichthys lucidus, and Cynoglossus abbreviatus) accounted for 73.6% of the total abundance and 61.2% of the total biomass in winter. Of these, Cynoglossus abbreviatus had the highest proportional abundance (28.7%) and biomass (26.2%). In spring, five species (Setipinna taty, Lophius litulon, Pampus argenteus, Larimichthys polyactis, and Harpadon nehereus) accounted for 52.3% of the total abundance and 68.4% of the total biomass. Of these, Harpadon nehereus was proportionally the most abundant (19.0%) and Lophius litulon had the highest biomass (26.2%). Five species (Larimichthys polyactis, Harpadon nehereus, Chelidonichthys kumu, Muraenesox cinereus, and Cynoglossus joyneri) dominated in summer, accounting for 64.6% of the total abundance and 82.2% of the total biomass. Of these, Cynoglossus joyneri had the highest proportional abundance (24.0%) and Chelidonichthys kumu had the highest biomass (30.8%). In autumn, two species (Trichiurus lepturus and Harpadon nehereus) dominated, accounting for 66.3% of the total abundance and 51.0% of the total biomass. Of these, Harpadon nehereus had both the highest proportional abundance (45.4%) and biomass (47.1%). The dominant species in this region was Harpadon nehereus but no single species was dominant in all seasons. The overall contribution of these dominant species to seasonal abundance and biomass exceeded 50%.
Seasonal variations in the abundance and biomass of dominant species are shown in Figure 6. While seasonal changes in the biomass and abundance of each fish were largely similar, exceptions include that from summer to autumn, the abundance of Pampus argenteus decreased but its biomass increased, indicating that individuals of this species had increased in size by autumn. Seasonal variations in the abundance and biomass of dominant fish were associated with their seasonal migration.
Dominant species and the spatial distributions of assemblages differed seasonally. In winter, the dominant assemblage I species were Setipinna taty and Lophius litulon, while the dominant assemblage II species were Cynoglossus abbreviatus and Amblychaeturichthys hexanema. The dominant spring assemblage I species were Engraulis japonicus and Ilisha elongatus, while the dominant spring assemblage II species were Coilia mystus and Harpadon nehereus. The dominant summer assemblage I species were Pleuronichthys cornutus and Scomber japonicus, while the dominant summer assemblage II species were Harpadon nehereus and Cynoglossus joyneri. The dominant autumn assemblage I species were Harpadon nehereus and Trichiurus lepturus, while the dominant autumn assemblage II species were Coilia mystus and Collichthys lucidus. Of these, Harpadon nehereus was a dominant species in spring, summer, and autumn, typically occurring in low-salinity assemblages in spring and summer but high-salinity assemblages in autumn; Coilia mystus was a dominant species of low-salinity assemblages in spring and autumn.

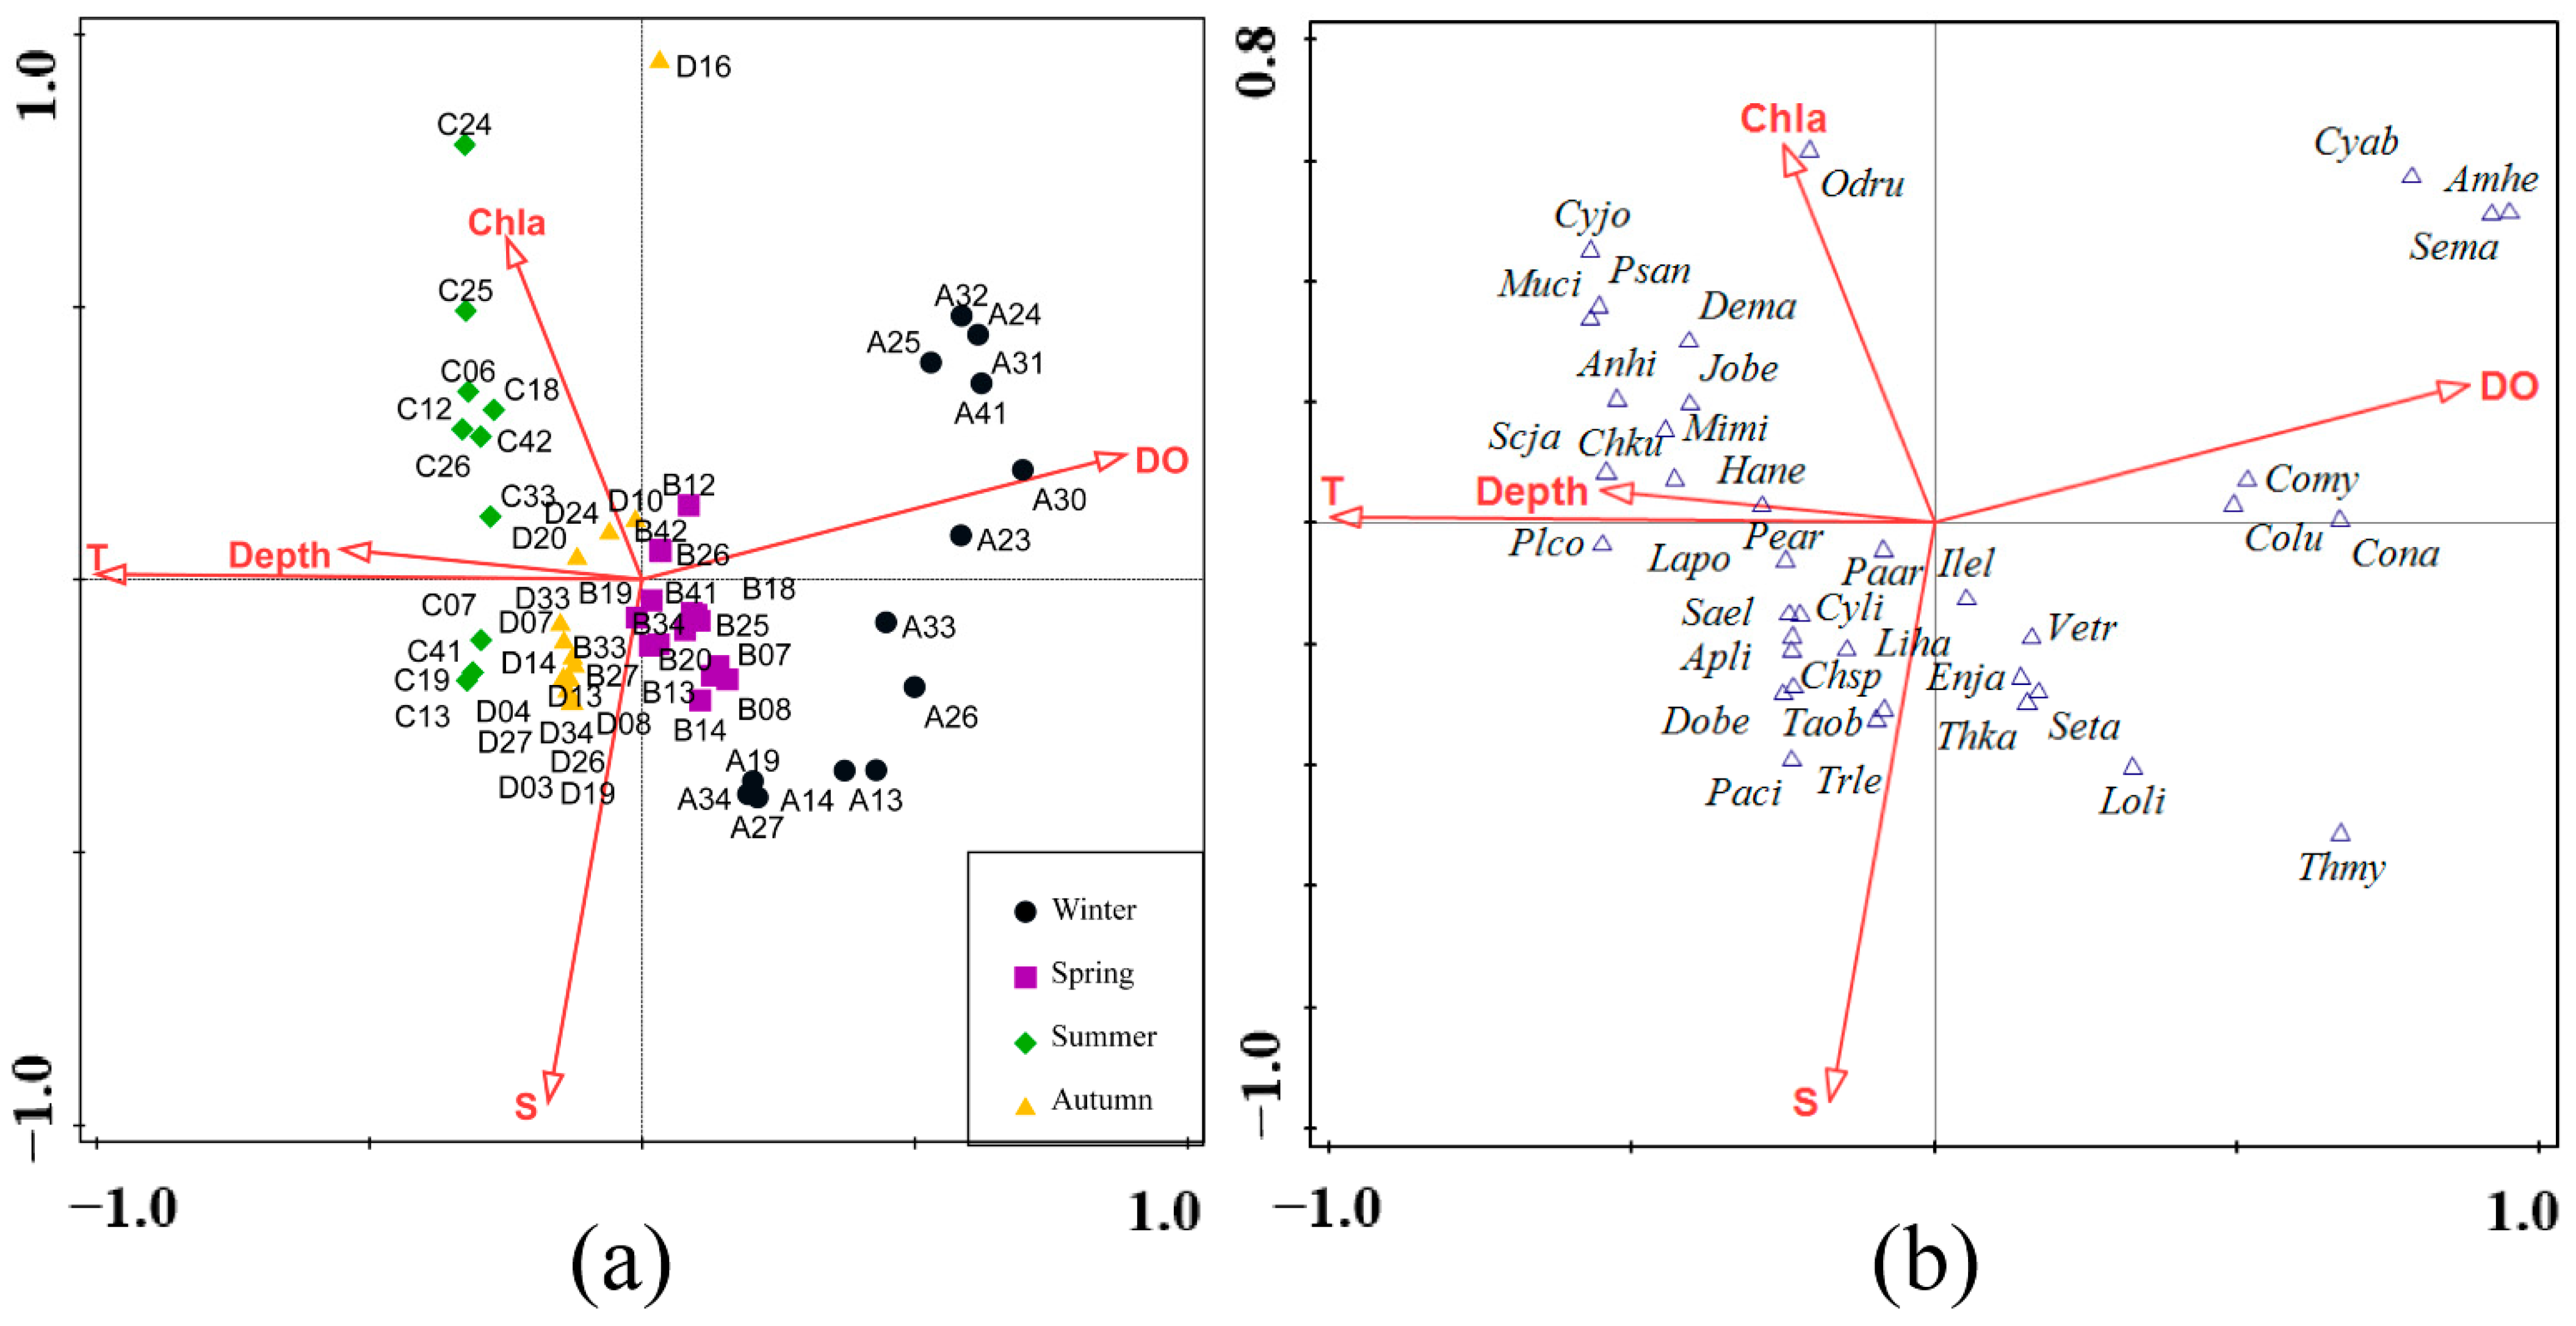
3.3. Fish Assemblage in Relation to Environmental Factors

The background environmental factors of the Yangtze Estuary are shown in Table 1. Most environmental factors varied significantly (p < 0.05) between seasons: depth ranged from 5–63 m; temperature was significantly higher in summer and lower in winter; salinity significantly differed between summer and autumn; dissolved oxygen significantly differed among three seasons; pH was significantly higher in summer; the highest total nitrogen value was in summer, while that for total phosphorus was in winter; and turbidity was significantly higher in winter than other seasons. Moreover, chlorophyll a ranged from 0.25–8.18, but did not significantly differ among seasons.
On the basis of the Monte Carlo tests of F-ratios (p < 0.05), temperature, salinity, depth, dissolved oxygen, and chlorophyll a were the most significant environmental variables affecting the fish assemblages. Of these five environmental variables, temperature, salinity, and depth had the most significant effects (p = 0.002). Temperature explained 17.6% of the variation in the species–environment relationships and made a contribution of 41.1% in all environment variables; salinity explained 6.2% of the variation, with a contribution of 14.5% in all environment variables; and depth explained 4.3% of the variation, with a contribution of 10.1% in all environment variables. In addition, dissolved oxygen (p = 0.004) and chlorophyll a (p = 0.034) also affected fish assemblages but their explanatory power and contribution were relatively low (dissolved oxygen explained 4% of variation, with a contribution of 9.4%, and chlorophyll a explained 2.2% of variation, with a contribution of 5.1%).
CCA (Figure 7a) demonstrates that the seasonal variation in fish assemblages in the Yangtze Estuary was driven by environmental factors, such as temperature, salinity, depth, dissolved oxygen, and chlorophyll a. Winter assemblages are mainly associated with low temperature and high dissolved oxygen; spring assemblages associated with low temperature, low dissolved oxygen, and low chlorophyll a; summer assemblages associated with high temperature, low dissolved oxygen, low salinity, and high chlorophyll a; and autumn assemblages associated with high temperature, high salinity, and low dissolved oxygen [15].
The location of species on the CCA diagram indicates their habitat preferences on an environmental gradient [16] (Figure 7b). From the CCA species ranking chart of measured variables, temperature, depth, salinity, dissolved oxygen, and chlorophyll a most affected the distribution of fish assemblages adjacent to the Yangtze Estuary. In winter, Coilia mystus and Cynoglossus abbreviatus were mainly associated with low temperature and high dissolved oxygen and occurred in the first CCA quadrant. The dominant species in spring, Pampus argenteus and Setipinna taty, were mainly associated with low chlorophyll a. The dominant Chelidonichthys kumu in summer was mainly associated with high temperature and chlorophyll a content. The dominant Harpadon nehereus in autumn was mainly associated with high salinity and low dissolved oxygen.
The degree of interpretation of the CCA results in Figure 7 is shown in Table 2. The CCA results are shown in Table 2. Eigenvalues (0 to 1) indicate the importance of the CCA axes. CCA revealed that the sum of all canonical eigenvalues accounts for 34.27% of the sum of all eigenvalues. Eigenvalues of the first two axes were relatively high (1 = 0.592, 2 = 0.217) while eigenvalues for axes 3 and 4 were relatively low (3 = 0.195, 4 = 0.095). The cumulative percentage variance of species data was 32.65% and that for the species–environment relation was 95.31%. The first two axes explained 17.59% and 51.34% of all variation, respectively.

4. Discussion

4.1. Seasonal and Spatial Variations in Fish Assemblages

As a typical temperate estuary, the fish assemblages of the Yangtze Estuary had significant seasonal variation. Fish abundance and biomass were highest in autumn and lowest in spring and the composition of species varied significantly in different seasons. The same distribution of fish occurred in the Yellow River Estuary, which is also a temperate estuary [17]. Tropical and subtropical estuaries have higher species richness than temperate systems [18]. The characterization of fish assemblages according to wet and dry seasons, influenced by rainfall and freshwater inflow, is an acknowledged important feature in tropical and subtropical estuarine systems [19,20,21]. Significant seasonal variation were also seen in the Estuarine River of Indian Sundarbans, which serves as a tropical and subtropical estuary [22]. As a high-latitude estuary influenced by glaciers, the seasonal variation in fish communities in the Gulf of Alaska was stronger than site effects [23]. It can be seen that seasonal variation in fish communities is common in most estuarine areas.
In 2018, fish in the Yangtze Estuary and adjacent waters can be spatially divided into high-salt assemblages and low-salt assemblages. Based on the samples adjacent to the Yangtze Estuary from spring of 2015, Xu et al. (2017) divided demersal fish assemblages into offshore, southern-middle, and southern-open-sea groups [3]. The southern-middle and southern-open-sea groups were similar and differed from the offshore group, which is consistent with the distributions of the two fish assemblages that we report here. From 1999 to 2001, the species adjacent to the Yangtze Estuary were divided into assemblages based on the temperature at the first level, and second-level assemblages based on salinity. Benthosema pterotum preferred high-salinity waters, while Pampus argenteus and Amblychaeturichthys hexanema occurred in lower-salinity waters [24]. Compared with those from the 1999–2001 data, fish assemblage structures in this region have changed significantly, suggesting that environmental factors may have also changed. In addition to the Yangtze Estuary, there was significant spatial variation among the fish fauna of 21 tropical Australian estuaries [25]. Continuously changing environmental gradients underlie the spatial variation in estuarine fish assemblages.

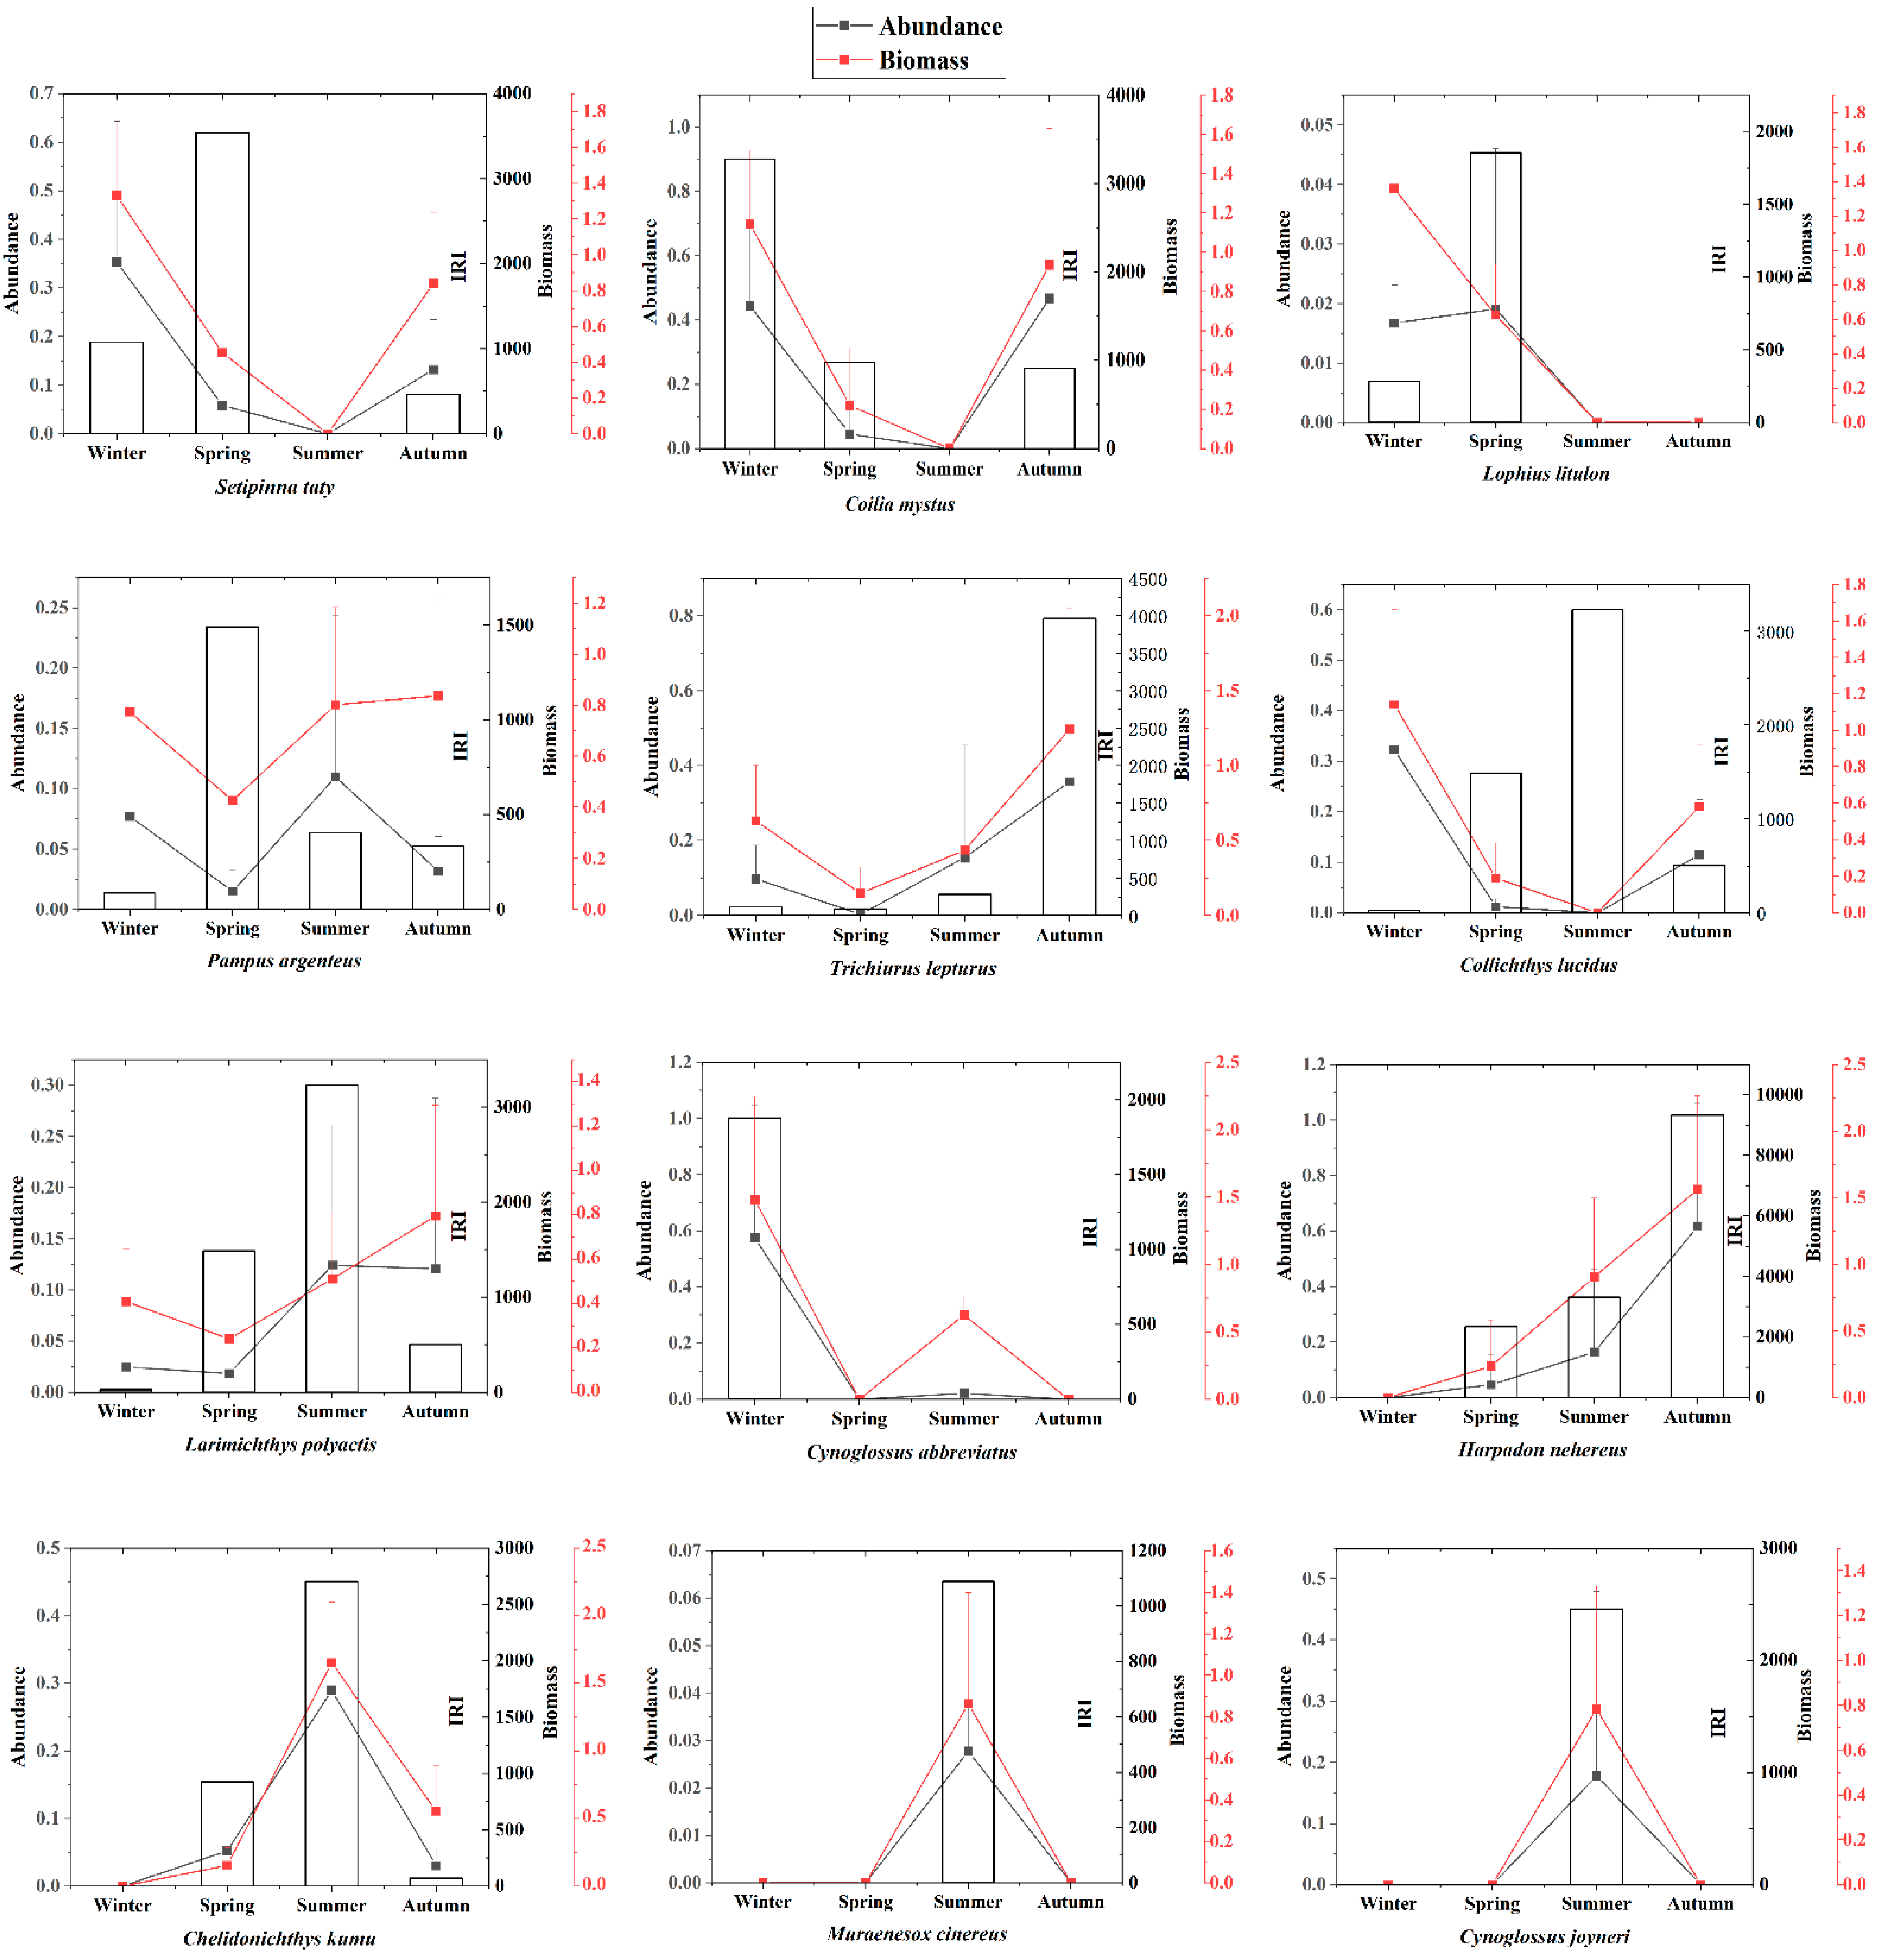
4.2. Seasonal Migration and Spatial Distribution of Dominant Species

The spatio-temporal variation in fish assemblages is mostly associated with changes in dominant species. While many species living in estuaries can tolerate wide fluctuations in environmental factors [26], other species are less tolerant and do not appear in large numbers [27]. These dominant species contribute the vast majority of abundance and biomass in different seasons. In 2018, the dominant species seasonally differed and the dominance of the same fish in different seasons also differed. The distributions of dominant species reflect differences in their habitat preferences. Among them, Setipinna taty and Pampus argenteus traditionally dominated throughout the region [3,11,13]. The fact that most dominant species were also commercially important signifies the importance of the Yangtze Estuary and adjacent waters as a fishing ground. For example, the Larimichthys polyactis supported a major fishery and motor-wheel trawling in the Yellow and East China seas [28].
Temporal differences in dominant species are mainly associated with seasonal migrations [29], with wintering, spawning, and feeding migrations all affecting their composition. Of the 12 dominant species of fish, 8 species (Setipinna taty, Coilia mystus, Pampus argenteus, Trichiurus lepturus, Larimichthys polyactis, Harpadon nehereus, Chelidonichthys kumu, and Muraenesox cinereus) had seasonal migratory habits [6]. Overwintering migrations of species reduce their regional abundance and biomass [30]. For example, Harpadon nehereus is a warm-water fish that is intolerant of winter low water temperatures adjacent to the Yangtze Estuary [31]; this species is dominant in spring, summer, and autumn but not winter. In some estuaries with large annual temperature differences, some species overwinter at sea. For example, marine species disappear in colder months and probably migrate to coastal waters to overwinter in Mont-Saint-Michel Bay, France [32]. Spawning of Setipinna taty extends from May to July in the Yangtze Estuary fishery [33] after which broodstock feed outside their spawning grounds [28]. In summer, Setipinna taty feeds in the outer waters and returns to wintering field in November [28], resulting in no Setipinna taty being caught in summer and their relatively low dominance in autumn. Spawning of Coilia mystus occurs from mid-May to early September, with spawning grounds adjacent to the Yangtze Estuary concentrated around Chongming, Hengsha, and Changxing islands [28]; no Coilia mystus were caught in summer trawls adjacent to the Yangtze Estuary. Decreased freshwater input from the Yangtze River in autumn increases salinity and warmer temperatures render the estuarine environment more suitable for fish feeding and conditioning [34]. Most fish have finished spawning in autumn and fish populations can replenish, increasing the abundance and biomass of fish in the Yangtze Estuary and adjacent waters. Fish migrations such as these lead to seasonal differences in the final structure of the fish community in the Yangtze Estuary and adjacent waters.
Spatial variation in fish assemblages is associated with the geographical selection of dominant species. The variability was largely a product of contrasting spatial patterns displayed by different species [23]. In high-salinity assemblages, fish such as Setipinna taty and Engraulis japonicus dominate, and in low-salinity assemblages, estuarine fish such as Cynoglossus abbreviatus and Coilia mystus dominate. Setipinna taty is mostly found offshore. Coilia mystus mostly lives in shallow coastal waters or offshore waters and can adapt to a lower salinity than Setipinna taty [35].

4.3. Influence of Environmental Factors

The spatio-temporal variation in the dominant species was mostly driven by the physico-chemical conditions. The Yangtze Estuary and adjacent waters hydrology considerably varies temporally and spatially. Large-scale (kilometer) patterns in the distribution of species are probably the result of their responses to the physical environment [36]. Habitat differences cause fish assemblage differences [37]. The influence of environmental factors on the distributions of species is greater than that of biological factors, such as interactions between species [38,39]. We report that temperature, depth, salinity, dissolved oxygen, and chlorophyll significantly affect fish assemblages adjacent to the Yangtze Estuary. Dominant abiotic variables may act like a physiological sieve and play a vital role in structuring assemblages [40].
Sea-air heat transport is affected by atmospheric forcing, including wind, temperature, and lateral heat transport and runoff, while water heat capacity is affected by water depth and the thermocline [41,42]. Seasonal variation in environmental factors driven by water temperature drives seasonal variation in fish assemblages adjacent to the Yangtze Estuary, in that temperature has the highest explanatory power of measured variables in the species–environment relationship. Water temperature directly affects fish survival and growth by influencing body temperature, gonad development, and spawning, and indirectly by affecting prey growth and changes to other environmental factors [43]. Temperature affected spatial variation in fish assemblages in and around Haizhou Bay [44]. In subtropical estuaries, temperature affected the seasonal succession of fish assemblages in Pearl River [45] and Mississippi River’s Biloxi Bay Estuary [46]. In some tropical estuaries, water temperature is not the main factor influencing fish assemblages, possibly because the small changes in temperature throughout the year do not produce sufficiently strong temperature gradients [47,48]. For example, in the West African Gambia Estuary, the effect of water temperature did not significantly affect fish assemblages but salinity and dissolved oxygen did [49].
Salinity changes drive the spatial variability of fish assemblages in the Yangtze Estuary. Salinity plays an important role in fish growth, physiological and biochemical indicators, biomarkers, the size and number of ionic cells, salinity-related regulatory genes, and hormone levels [50]. Because of the considerable influx of fresh water, a salinity gradient adjacent to the Yangtze Estuary extends from east to west. Areas of different salinity support fish assemblages with different ecological guilds. Highly variable salinity may prevent settlement of many species in estuaries [1]. During the monsoon season, increased rainfall and river runoff lower salinity, and overall species abundance and biomass. Declines in fish populations were reported following floods and because of reduced salinity for Aguada and Mormugao, Goa, India, and for the Severn Estuary, southwestern Great Britain [51,52].
In addition to temperature, salinity is the main influencing factor, other environmental factors also play an important role in the seasonal and spatial variations in fish assemblages. Depth affects the spatial variability of fish assemblages, possibly because species have different depth preferences. For example, Cynoglossus abbreviatus frequents bottom waters, Trichiurus lepturus migrates from deep to shallow waters from day to night, and Setipinna taty inhabits the middle and upper layers of the water column. Off Western Australia, depth is the main variable affecting fish assemblage structure, with those from 5–15 m differing significantly from those from 20–35 m [53]. Dissolved oxygen affects fish respiration; when concentrations drop to 5 mg/L, some fish experience difficulty respiring [54] and from 2.0–3.0 mg/L, a hypoxic zone forms [54]. Recent research has determined the Yangtze Estuary’s adjacent waters from 31.0–31.2° N, 122.8–123.1° E near the hypoxic zone and the hypoxic zone is gradually expanding [55]. This hypoxia is influenced by both natural processes and human disturbance, severely impacting marine ecology and posing a serious threat to the ongoing viability of this ecosystem [56].
Levels of chlorophyll a indicate the amount of organic matter in river runoff into the estuary. Seasonal differences in chlorophyll a are not significant but subtle changes can impact seasonal changes in fish assemblages. Because chlorophyll a indicates phytoplankton growth, the greater the phytoplankton biomass, the higher the primary productivity, and the more conducive an environment is to the growth of fish food [49].
The variation in species distribution explained by the first four axes of CCA was only 32.65%, indicating that other factors are also affected the distribution of fish assemblage in the Yangtze Estuary and adjacent waters. Physiological tolerances of organisms to the dominant gradient determine the frame of the structure, while biotic interactions determine the species distribution within this frame [57]. The effect of biological variables on the fish assemblage structure in the Yangtze Estuary and adjacent waters needs further study.
In terms of the effective utilization and rational protection of fishery resources in the Yangtze Estuary, different utilization and protection policies can be formulated at different times according to the seasonal changes and migration habits of fish assemblages, such as the formulation of fishing ban periods. According to the spatial distribution pattern of fish, the reasonable fishing intensity of different areas is guided.

5. Conclusions

We identified the seasonal and spatial variations in fish assemblages and their relation to environmental variables in the Yangtze Estuary and adjacent waters. Significant seasonal and spatial variations in fish assemblages were apparent. Fish varied in abundance, biomass and species composition in different seasons, and can be spatially divided into high-salinity assemblages and low-salinity assemblages. Differences in the distributions of fish assemblages in the Yangtze Estuary and adjacent waters were associated with the selectivity of species to environmental conditions, and migration and/or emigration of dominant taxa. Temperature drove seasonal variation in assemblage structure, while salinity significantly affected the spatial distribution of assemblages.

Author Contributions

Z.C. analyzed the data and completed the first draft. Q.R. and W.X. provide guidance on the structure of the paper. C.L. made suggestions on this paper and Z.C., Q.R. and W.X. made modifications to this paper. All authors participated in revising the manuscript. All authors have read and agreed to the published version of the manuscript.

Funding

National Natural Science Foundation of China (No. 31872568); Chinese Academy of Sciences Network Security and Informatization Special Application Demonstration Project (CAS-WX2021SF-0108); The Comprenshensive Safety Monitoring System of Three Gorges Project, Resevior Operation and Management Fund (No. 2136703).

Institutional Review Board Statement

Not applicable.

Informed Consent Statement

Not applicable.

Data Availability Statement

Not applicable.

Acknowledgments

This work was supported by grants from the National Natural Science Foundation of China (No. 31872568), Natural Science Foundation of China–Shandong Joint Fund for Marine Ecology and Environmental Sciences (U1606404), and Chinese Academy of Sciences Network Security and Informatization Special Application Demonstration Project (CAS-WX2021SF-0108). We thank the scientists and crew of the “Zhe Shengyu 10201” for sampling assistance, and Steve O’Shea, from Edanz (https://www.edanz.com/ac, accessed on 11 December 2021.) for editing a draft of this manuscript. We are grateful to the editors and reviewers for their constructive feedback and concerning on our work.

Conflicts of Interest

The authors state that the research was conducted without any commercial or financial relationships that could be considered as a potential conflict of interest.

References

  1. Luo, B.Z.; Shen, H.T. Three Gorges Project and Estuary Ecological Environment; Science Press: Beijing, China, 1994. [Google Scholar]
  2. Yang, D.Z.; Yin, B.S.; Liu, Z.L.; Bai, T.; Qi, J.F.; Chen, H.Y. Numerical study on the pattern and origins of Kuroshio branches in the bottom water of southern East China Sea in summer. J. Geophys. Res. Ocean. 2012, 117, C02014. [Google Scholar] [CrossRef]
  3. Xu, Y.; Ma, L.; Li, X.Z.; Sun, Y.; Gong, L. Demersal fish assemblage characteristics and their relationship with environmental variables in the sea off Changjiang river estuary. Oceanol. Limnol. Sin. 2017, 48, 1383–1391. [Google Scholar]
  4. Xu, Q.H.; Qian, J.H.; Chen, Z.Y.; Zhang, H.P.; Chen, L. Water Environment Status and Pollution Prevention and Control in Yangtze River Estuary and Adjacent Waters. China Dev. 2015, 15, 10–14. [Google Scholar]
  5. Song, Z.K.; Cheng, H.Q.; Hu, H.; Li, J.F.; Jiang, Y.P. Numerical simulation analysis of influence of reclamation of north branch in the Yangtze River estuary on hydrodynamic characteristics. Yangtze River 2012, 43, 59–63. [Google Scholar]
  6. Zhuang, P. Fishes of the Yangtze Estuary; China Agriculture Press: Beijing, China, 2018. [Google Scholar]
  7. Wang, X.C.; Xie, P.F.; Li, Q.; Zhang, J.Y.; Li, H.J. Ecological Environment of the Yangtze Estuary and Protection Countermeasures. Res. Environ. Sci. 2020, 33, 1197–1205. [Google Scholar]
  8. Xu, Z.L.; Yuan, Q.; Jiang, M.; Zang, Z.J. An investigation of fish eggs, larvae and juveniles in the Changjiang esturary. J. Fish. Sci. China 1999, 6, 63–64. [Google Scholar]
  9. Zhang, G.X.; Zhang, X.S. A survey on the fisheries of set stow net in the Chang Jiang Estuary. J. Fish. China 1985, 9, 185–198, (In Chinese with English abstract). [Google Scholar]
  10. Zhang, H.; He, W.S.; Tong, C.F.; Lu, J.J. Species composition and biodiversity of the intertidal fishes in Chongxi Wetland in winter in Changjiang Estuary. Resour. Environ. Yangtze Basin 2007, 16, 308–313. [Google Scholar]
  11. Yu, H.C.; Xian, W.W. Fish Assemblage Structure in Adjacent Sea of Yangtze Estuary and Its Relationshp with Envirorm ental Factors. J. Yangtze River Sci. Res. Inst. 2010, 27, 88–92. [Google Scholar]
  12. Shi, Y.R.; Chao, M.; Quan, W.M.; Huang, H.J.; Shen, X.Q. Fish community diversity analyses in the Yangtze Estuary, China. J. Fish. Sci. China 2012, 19, 1051–1059. [Google Scholar]
  13. Zhang, Y.Q.; Xian, W.W.; Li, W.L. Fish Assemblage Structure in Adjacent Sea of Changj iang Estuary in Spring of 2004 and 2007 and Its Association With Environmental Factors. Pericdical Ocean Univ. China 2013, 43, 67–74. [Google Scholar]
  14. Cheila, A.; Rui, C.; Marco, S.; Luís, B.; Pedro, M.; Joaquim, R.; Karim, E.; Jorge, M.S.G. Use of different intertidal habitats by faunal communities in a temperate coastal lagoon. Estuar. Coast. Shelf Sci. 2008, 80, 357–364. [Google Scholar]
  15. Ren, Q.Q.; Xian, W.W.; Zhang, Y.; Liu, C.L.; Li, W.L. Invertebrate assemblage structure associated with key environmental factors in the Yangtze Estuary, China. Chin. J. Appl. Ecol. 2018, 29, 3067–3077. [Google Scholar]
  16. Chu, C.; Jones, N.E. Spatial variability of thermal regimes and other environmental determinants of stream fish communities in the Great Lakes Basin, Ontario, Canada. River Res. Appl. 2011, 27, 646–662. [Google Scholar] [CrossRef]
  17. Sun, P.F.; Shan, X.J.; Wu, Q.; Chen, Y.L.; Jin, X.S. Seasonal variations in fish community structure in the Laizhou Bay and the Yellow River Estuary. Acta Ecol. Sin. 2014, 34, 367–376. [Google Scholar]
  18. Whitfield, A.K. Fish species diversity in Southern African estuarine systems: An evolutionary perspective. Environ. Biol. Fishes 1994, 40, 37–48. [Google Scholar] [CrossRef]
  19. Stoner, A.W. Community structure of the demersal fish species of Laguna Joyuda, Puerto Rico. Estuaries 1986, 9, 142–152. [Google Scholar] [CrossRef]
  20. Flores-Verdugo, F.; González-Farías, F.; Ramírez-Flores, O.; AmezcuaLinares, F.; Yánez-Arancibia, A.; Alvarez-Rubio, M.; Day, J.W. Mangrove ecology, aquatic primary productivity, and fish community dynamics in the Teacapán-Agua Brava lagoonestuarine system (Mexican Pacific). Estuaries 1990, 13, 219–230. [Google Scholar] [CrossRef]
  21. Fraser, T.H. Abundance, seasonality, community indices, trends and relationships with physicochemical factors of trawled fish in upper Charlotte Harbor, Florida. Bull. Mar. Sci. 1997, 60, 739–763. [Google Scholar]
  22. Mukherjee, S.; Chaudhuri, A.; Kundu, N.; Mitra, S.; Homechaudhuri, S. Comprehensive Analysis of Fish Assemblages in Relation to Seasonal Environmental Variables in an Estuarine River of Indian Sundarbans. Estuaries Coasts 2013, 36, 192–202. [Google Scholar] [CrossRef]
  23. Beaudreau, A.H.; Bergstrom, C.A.; Whitney, E.J.; Duncan, D.H.; Lundstrom, N.C. Seasonal and interannual variation in high-latitude estuarine fish community structure along a glacial to non-glacial watershed gradient in Southeast Alaska. Environ. Biol. Fishes 2022, 105, 431–452. [Google Scholar] [CrossRef]
  24. Yu, H.C. Fish Community Structure in the Changjiang Estuary and Adjacent Waters; Institute of Oceanology, Chinese Academy of Sciences: Qingdao, China, 2008. [Google Scholar]
  25. Sheaves, M.; Johnston, R. Ecological drivers of spatial variability among fish fauna of 21 tropical Australian estuaries. Mar. Ecol. Prog. Ser. 2009, 385, 245–260. [Google Scholar] [CrossRef]
  26. Maes, J.; Stevens, M.; Ollevier, F. The composition and community structure of the ichthyofauna of the upper Scheldt estuary: Synthesis of a 10-year data collection (1991–2001). J. Appl. Ichthyol. 2005, 21, 86–93. [Google Scholar] [CrossRef]
  27. Whitfield, A.K. Biology and Ecology of Fishes in Southern African Estuaries, 2nd, ed.; Ichthyological Monogro; Smith Institute of Ichthyology: Grahamstown, South Africa, 1998. [Google Scholar]
  28. Zhuang, P. Fishes of Yangtze Estuary; Shanghai Scientific & Technical Publishers: Shanghai, China, 2006. [Google Scholar]
  29. Wu, J.H.; Wang, J.Q.; Dai, X.J.; Tian, S.Q.; Liu, J.; Chen, J.H.; Wang, X.F. An analysis of spatial co-occurrence pattern of fish species of Yangtze Estuary based on probabilistic model. South China Fish. Sci. 2019, 15, 1–9. [Google Scholar]
  30. Shi, Y.R. Studies on Fish Community Diversity and Community Dynamics Based on Multivariate Analysis in the Yangtze Estuary; Shanghai Ocean University: Shanghai, China, 2012. [Google Scholar]
  31. Luo, H.Z.; Zhang, H.D.; Li, P.F.; Zhou, Y.D. Analysis of the Current Situation of Fishery Biology of Harpodon nehereus in the East China Sea. J. Zhejiang Ocean Univ. Nat. Sci. 2012, 31, 202–205+233. [Google Scholar]
  32. Laffaille, P.; Feunteun, E.; Lefeuvre, J.C. Composition of fish communities in a European macrotidal salt marsh (the Moint Saint-Michel bay, France). Estuar. Coast. Shelf Sci. 2000, 51, 429–438. [Google Scholar] [CrossRef]
  33. Liu, Y.; Cheng, J.H.; Li, S.F. A study on the distribution of Setipinna taty in the East China Sea. Mar. Fish. 2004, 26, 255–260. [Google Scholar]
  34. Shen, X.Q.; Shi, Y.R.; Chao, M.; Huang, H.J.; Tang, F.H. Fish community structure of the Yangtze Estuary in summer and autumn. J. Fish. China 2011, 35, 700–710. [Google Scholar]
  35. Shen, G.Y.; Shi, B.Z. Marine Ecology; Science Press: Beijing, China, 2003; pp. 153–183. [Google Scholar]
  36. Martino, E.J.; Able, K.W. Fish assemblages across the marine to low salinity transition zone of a temperate estuary. Estuar. Coast. Shelf Sci. 2003, 56, 969–987. [Google Scholar] [CrossRef]
  37. Yang, G. Fish Community Structure and Correlation to Major Environmental Factors in Yangtze Estuary; Shanghai Ocean University: Shanghai, China, 2012. [Google Scholar]
  38. David, J.H.; Kirk, O.W.; Jenny, S.B. Local and regional determinants of stream fish assemblage structure: Inferences based on taxonomic vs. functional groups. J. Biogeogr. 2007, 34, 324–338. [Google Scholar]
  39. Márcia, C.C.A.; Francisco, G.A.; André, L.M.P.; Márcio, A.S. Co-occurrence of demersal fishes in a tropical bay in southeastern Brazil: A null model analysis. Estuar. Coast. Shelf Sci. 2006, 66, 315–322. [Google Scholar]
  40. Remmert, H. Studies and thoughts about the zonation along the rocky shores of the Baltic. Zoologica 1983, 22, 121–125. [Google Scholar]
  41. Hu, Y.Y.; Zhao, L.; Guo, X.Y.; Wei, H. Variations of the water temperature offshore the Changjangriver Estuary in winters and sprincs. Oceanol. Et Limnol. Sin. 2012, 43, 655–661. [Google Scholar]
  42. Zhou, X.Y.; Hu, D.B.; Wang, C.Z.; Hu, X.J.; Yao, S.K. Seasonal and Interannual SST Var iations in the Changjiang Estuary. Period. Ocean. Univ. China 2005, 35, 357–362. [Google Scholar]
  43. Wang, H.C.; Yu, J.G. Effect of water temperature on fish. Heilongjiang Fish. 2011, 42, 30–31. [Google Scholar]
  44. Wang, X.L. Temporal and Spatial Variations of the Fish Community Structure in Haizhou Bay and Adjacent Waters; Ocean University of China: Qingdao, China, 2013. [Google Scholar]
  45. Li, Y.Z.; Chen, G.B.; Sun, D.R. Analysis of the composition of fishes in the Pearl River estuarine waters. J. Fish. China 2000, 24, 312–317. [Google Scholar]
  46. Peterson, M.S.; Ross, S.T. Dynamics of littoral fishes and decapods along a coastal river-estuarine gradient. Estuar. Coast. Shelf Sci. 1991, 33, 467–483. [Google Scholar] [CrossRef]
  47. Simier, M.; Laurent, C.; Ecoutin, J.M.; Albaret, J.J. The Gambia River estuary: A reference point for estuarine fish assemblages studies in West Africa. Estuar. Coast. Shelf Sci. 2006, 69, 615–628. [Google Scholar] [CrossRef]
  48. Garcia, A.M.; Vieira, J.P.; Winemiller, K.O. Effects of 1997–1998 El Nino on the dynamics of the shallow-water fish assemblage of the Patos Lagoon Estuary (Brazil). Estuar. Coast. Shelf Sci. 2003, 57, 489–500. [Google Scholar] [CrossRef]
  49. Whitfield, A.K. Ichthyofaunal assemblages in estuaries: A South African case study. Rev. Fish Biol. Fish. 1999, 91, 51–86. [Google Scholar]
  50. Ran, F.X.; Jin, W.J.; Huang, S.; Liu, C.X.; Li, Z.X.; Li, C.Z. Research progress on the effects of salinity change on fish. J. Northwest AF Univ. Nat. Sci. Ed. 2020, 48, 10–18. [Google Scholar]
  51. Ansari, Z.A.; Chatterji, A.; Ingole, B.S.; Sreepada, R.A.; Rivonkar, C.U.; Parulekar, A.H. Community structure and seasonal variation of an inshore demersal fish community at Goa, west coast of India. Estuar. Coast. Shelf Sci. 1995, 41, 593–610. [Google Scholar] [CrossRef]
  52. Claridge, P.N.; Potter, I.C.; Hardisty, M.W. Seasonal changes in movements, abundance, size composition and diversity of the fish fauna of the Sevem Estuary. J. Mar. Biol. Assoc. 1986, 66, 229–258. [Google Scholar] [CrossRef] [Green Version]
  53. Hyndes, G.A.; Platell, M.E.; Potter, I.C.; Lenanton, R.C.J. Does the composition of the demersal fish assemblages in temperate coastal waters change with depth and undergo consistent seasonal changes? Mar. Biol. 1999, 134, 335–352. [Google Scholar] [CrossRef]
  54. Wang, P.H.; Li, B. Historical Changes and Mechanism of Hypoxia in the Changjiang Estuary and Its Adjacent Waters. J. Zhejiang Ocean Univ. Nat. Sci. 2019, 38, 401–406. [Google Scholar]
  55. Wang, K.; Li, B.; Lu, J.J.; Wang, P.H. Temperature and salinity characteristics of summer hypoxia area in the Yangtze River Estuary adjacent sea area. J. Xiamen Univ. Nat. Sci. 2020, 59, 32–38. [Google Scholar]
  56. Wei, Q.S.; Yu, Z.G.; Xia, J.Y.; Ran, X.B.; Zhang, X.L. A preliminary analysis on the dynamic characteristics of the hypoxic zone adjacent to the Changjiang Estuary in summer. Acta Oceanol. Sin. 2011, 33, 100–109. [Google Scholar]
  57. Menge, B.A.; Olson, A.M. Role of scale and environmental factors in regulation of community structure. Trends Ecol. Evol. 1990, 5, 52–57. [Google Scholar] [CrossRef]
Figure 1. Sampling stations in the Yangtze Estuary’s adjacent waters. The background color indicates the depth variation.
Jmse 10 01679 g001
Figure 2. Seasonal variations in fish mean abundance and mean biomass (a), where error bars indicate standard deviations, and NMDS plot of assemblage structure (b) for 2018.
Jmse 10 01679 g002
Figure 3. Spatial and temporal variations in fish biomass, 2018: (a) winter, (b) spring, (c) summer, (d) autumn.
Jmse 10 01679 g003
Figure 4. Fish assemblage structure, Yangtze Estuary, 2018: (a) winter, (b) spring, (c) summer, (d) autumn.
Jmse 10 01679 g004
Figure 5. Species richness (a) and relative abundance of taxa (b) in the Yangtze Estuary and adjacent waters from 2018. (a, lower): UpSet plot showing the fish composition from 2018 (e.g., 19 species were found only in autumn (left), whereas 10 species occurred each season).
Jmse 10 01679 g005
Figure 6. Seasonal distribution of dominant fish species with IRI > 1000: abundance (kN/km2), biomass (kg/km2), where error bars indicate standard deviations.
Jmse 10 01679 g006
Figure 7. CCA plots of fish assemblages (a) and species (b) associated with environmental variables adjacent to the Yangtze Estuary. Seta: Setipinna taty; Comy: Coilia mystus; Loli: Lophius litulon; Cona: Coilia nasus; Paar: Pampus argenteus; Trle: Trichiurus lepturus; Vetr: Vespicula trachinoides; Thka: Thryssa kammalensis; Thmy: Thryssa mystax; Colu: Collichthys lucidus; Odru: Odontamblyopus rubicundus; Lapo: Larimichthys polyactis; Enja: Engraulis japonicus; Amhe: Amblychaeturichthys hexanema; Cyab: Cynoglossus abbreviatus; Sema: Sebastiscus marmoratus; Ilel: Ilisha elongata; Hane: Harpadon nehereus; Jobe: Johnius belangerii; Taob: Takifugu obscurus; Chku: Chelidonichthys kumu; Liha: Liza haematocheila; Muci: Muraenesox cinereus; Mimi: Miichthys miiuy; Psan: Psenopsis anomala; Cyjo: Cynoglossus joyneri; Dema: Decapterus maruadsi; Plco: Pleuronichthys cornutus; Anhi: Antennarius hispidus; Scja: Scomber japonicus; Sael: Saurida elongata; Dobe: Doederleinia berycoides; Apli: Apogonichthys lineatus; Paci: Pampus cinereus; Chsp: Chelidonichthys spinosus; Cyli: Cynoglossus lighti; Pear: Pennahia argentata.
Jmse 10 01679 g007
Table 1. Seasonal variation in environmental factors, Yangtze Estuary and adjacent waters, 2018 (Mean ± SD).
Environmental Factor WinterSpringSummerAutumn
Depth (D)M36.75 ± 27.1641.80 ± 9.6831.83 ± 10.2036.40 ± 15.69
Temperature (T)°C7.92 ± 2.52 c14.41 ± 1.07 bc28.62 ± 0.84 a20.65 ± 1.38 ab
Salinity (S) 24.77 ± 6.90 ab30.81 ± 0.86 ab24.69 ± 5.82 b29.61 ± 6.64 a
Dissolved oxygen (DO)mg/L10.05 ± 1.06 a9.03 ± 0.66 b7.25 ± 0.59 c7.35 ± 0.49 c
pHFTU8.01 ± 0.05 b8.00 ± 0.26 b8.18 ± 0.05 a8.04 ± 0.06 b
Total nitrogen (TN)μmg/L37.13 ± 15.93 a36.43 ± 7.24 a61.81 ± 49.66 a20.20 ± 12.70 b
Total phosphorus (TP)μmg/L2.27 ± 1.71 a0.49 ± 0.18 b1.97 ± 2.64 ab0.93 ± 0.54 ab
Turbidity (Turb) 55.25 ± 60.96 a12.72 ± 29.40 b3.63 ± 5.69 b7.73 ± 7.30 b
Chlorophyll a (Chl a)μg/L0.94 ± 0.621.91 ± 1.952.74 ± 2.580.81 ± 0.53
Values with different letters (a–c) indicate significant differences among seasons; values with the same letter indicate that differences were not significant.
Table 2. Results of canonical correspondence analysis relating fish biomass data to environmental factors adjacent to the Yangtze Estuary, 2018.
Axes1234Total Inertia
Eigenvalues0.592 0.217 0.195 0.095 3.367
Species–environment correlations0.956 0.705 0.852 0.700
Cumulative percentage variance
of species data17.5924.0229.8232.65
of species–environment relation51.3470.1187.0395.31
Sum of all eigenvalues 3.367
Sum of all canonical eigenvalues 1.154
Publisher’s Note: MDPI stays neutral with regard to jurisdictional claims in published maps and institutional affiliations.

