Article

Sharks Do Not Always Grow Slowly: Tagging Data Reveal a Different Pattern of Growth, Longevity and Maturity for Threatened Smooth-Hounds in the Central Mediterranean Sea

by
Gabriele Boscolo Palo
1,2,†,
Manfredi Di Lorenzo
3,4,*,†,
Salvatore Gancitano
3,
Sergio Ragonese
5,
Carlotta Mazzoldi
2,6 and
Francesco Colloca
7,*
1
Institute for Biological Resources and Marine Biotechnologies, National Research Council (IRBIM-CNR), Largo Fiera della Pesca, 2, 60125 Ancona, Italy
2
Department of Biology, University of Padova, Via Ugo Bassi 58/B, 35131 Padova, Italy
3
Institute for Biological Resources and Marine Biotechnologies, National Research Council (IRBIM-CNR), Via Luigi Vaccara, 61, 91026 Mazara del Vallo, Italy
4
Integrative Marine Ecology Department, Stazione Zoologica Anton Dohrn, Sicily, Lungomare Cristoforo Colombo (Complesso Roosevelt), 90142 Palermo, Italy
5
Independent Researcher, 91026 Mazara del Vallo, Italy
6
Consorzio Nazionale Interuniversitario per le Scienze del Mare (CoNISMa), Piazzale Flaminio, 00196 Rome, Italy
7
Integrative Marine Ecology Department, Stazione Zoologica Anton Dohrn, Via Po 25c, 00198 Rome, Italy
*
Authors to whom correspondence should be addressed.
These authors contributed equally to this work.
J. Mar. Sci. Eng. 2022, 10(11), 1647; https://doi.org/10.3390/jmse10111647
Submission received: 30 September 2022 / Revised: 24 October 2022 / Accepted: 25 October 2022 / Published: 3 November 2022
(This article belongs to the Special Issue Coastal Fish Research II)

Abstract

:
Elasmobranchs are among the marine species more threatened by overfishing. Their conservation is often impaired by the lack of knowledge of species’ life history traits. We filled knowledge gaps on age and growth of two threatened smooth-hound sharks (Mustelus mustelus, Mm; Mustelus punctulatus, Mp) in the central Mediterranean Sea, combining standard vertebrae analysis with growth increment data from a tagging survey. Our data revealed that the two species grow at a faster rate than previously estimated using vertebrae reading only. The maximum age/size found was higher for Mm (16 years, 170 cm TL) than Mp (8 years, 120 cm TL), the first species attaining larger size-at-age than the second one. Mp reaches maturity at earlier ages (A50 3 years for both females and males) than Mm (A50 females: 4 years; males: 3 years). The use of the tag-recapture method to validate the growth rate, firstly derived by sectioned vertebrae readings, highlighted the presence of false check marks. The new estimates of growth and longevity have important implications for the assessment of natural mortality, productivity, and stock resilience to fishing pressure which, combined with the high site fidelity highlighted by tagging data, may have crucial implications for the conservation of these two threatened sharks in the Mediterranean Sea.

1. Introduction

During the last decades, overfishing, habitat degradation, and climate change have profoundly altered the populations of several marine species [1], especially of those less resilient to anthropogenic pressures [2]. Elasmobranchs, among these, suffered a fast decline in many marine areas, particularly as an effect of overfishing [3]. Due to their k-selected life traits, such as slow population growth rate, late age at maturity, extended longevity, low fecundity, and long gestation period, they are poorly resilient to fishing, declining fast when exposed to unbalanced fishing exploitation [4,5,6]. As a consequence, many elasmobranch species are endangered or highly threatened to extinction according to the International Union for the Conservation of Nature (IUCN) [7].
A paradigmatic example of the status of conservation of this taxon regards the Mediterranean Sea, where the high species diversity of this region has been rapidly eroded by the development of semi-industrial fisheries during the last century [8,9,10,11]. In addition, small scale fisheries have been also found to impact elasmobranch populations [12]. According to the IUCN, 53% of the 73 species assessed are classified as threatened (Vulnerable: VU, Endangered: EN, Critically Endangered: CR) and in category A2 [13]. This means that their estimated populations declined between 30% and 80% within 10 years, or 3 generations. The Mediterranean Sea is therefore nowadays regarded as the area with the highest proportion of threatened elasmobranch species worldwide. Among these, the smooth-hounds (Mustelus spp.) were important components of coastal fish communities and exploited by artisanal fisheries for centuries [10]. Of the three smooth-hound species occurring in the Mediterranean Sea, the starry smooth-hound (Mustelus asterias Cloquet, 1819) is nowadays extremely rare and still occasionally caught in a few areas [10,14]. The other two species, the common smooth-hound (Mustelus mustelus Linnaeus, 1758) and black-spotted smooth-hound (Mustelus punctulatus Risso, 1827) are still relatively common but only in a small part of their original distribution range [10,15]. A rate of reduction of 80–90% since the beginning of the last century brought the two species to almost disappear in a large part of their original distributional range during the 1980s and 1990s [10]. Such a quick temporal decline in abundance was also perceived by fishers [8,11,16]. According to the Mediterranean IUCN’s European Red List of marine fish, M. asterias, M. mustelus (Mm), and M. punctulatus (Mp) are classified as “Vulnerable” [13].
The common and black-spotted smooth-hounds have overlapping distribution and bathymetric ranges and share very similar morphological characteristics, making their identification often difficult even for skilled fish biologists [17,18]. The current knowledge of life-history traits of the two smooth-hound species is very scarce and restricted to a few Mediterranean areas. For both species, the most attention was paid to studying the maturity and fecundity of individuals captured along Tunisian coasts [19,20,21], Adriatic Sea [22,23,24], and Turkey [25]. Diet composition was also studied in the Gulf of Gabes [21,26], Adriatic Sea [23,27], and South of Sicily [28]. Only a few published studies focused on age and growth of the common smooth-hound living along the Mediterranean Turkish [25] and Libyan coasts [29] and South African waters [30,31,32], while only one recent study estimated age and growth rate of the black-spotted smooth-hound in the Adriatic Sea [24].
Using ring counts on vertebrae sections, the studies carried out in the Mediterranean Sea missed validating the ring pattern on vertebrae, making the estimates of growth, age at maturity, and longevity largely uncertain. As shown by [32], the occurrence of false rings in the vertebrae of the common smooth-hound can likely lead to age overestimation and, in turn, underestimation of the growth rate.
The objective of this study was to provide new knowledge on life history traits of the of the two smooth-hound species from the North sector of the Strait of Sicily in the central Mediterranean Sea. Although this area is highly impacted by fishing [11,33,34], it still hosts viable populations of the smooth-hound populations. We therefore hypothesize that the presence of these species in the area could be due to their potential fast growing. We filled knowledge gaps on age and growth of the two species by validating ring deposition patterns on vertebral centra using tagging data. This new knowledge is important to better understand the impact of fishing on smooth-hound populations and, in turn, for their sustainable management and conservation [35].

2. Materials and Methods

2.1. Study Area, Sample Collection, and Ethical Statement

The south coast of Sicily lies in the Strait of Sicily (SoS), a region located in the central Mediterranean Sea between Sicily, Tunisia, east Algeria, and west Libya (Figure 1). It is an important biogeographic area where biota of the western and eastern Mediterranean overlap, leading to high biodiversity [33]. It hosts large continental shelf banks off the eastern (Malta Bank) and western Sicilian coasts (Adventure Bank). It is an important fishing area where multi-national fleets (i.e., Italy, Malta, Tunisia, and even Egypt) exploit pelagic and demersal stocks with a high by-catch of sharks and rays [33].
The two smooth-hound species are still common, and are frequently landed in the harbors along the South coasts of Sicily by trawlers and artisanal vessels using trammel nets and gillnets. They are also commonly caught during bottom trawl surveys carried out in the area [36,37]. Fish samples were collected between 2012 and 2017 from both scientific trawl surveys (MEDITS: International bottom trawl survey in the Mediterranean) carried out in the South of Sicily (FAO-GSA 16), and commercial landings (EU Data Collection Framework, DCF) of fishing vessels of Mazara del Vallo harbor (SW Sicily). All procedures carried out were approved by the international authorities (EU/DG Mare, FAO/GFCM). All individuals were sampled in accordance with the relevant guidelines and regulations. In cases when the animal was alive when it arrived on the vessel during the scientific survey (MEDITS-DCF, EU Reg. 199/2008), it was suppressed by administering an overdose of anesthetic in compliance with the recommendation of Decree Law n. 26 of 4 March 2014. All efforts were made to minimize suffering. Species identification was based on the shape of dermal denticles according to Marino et al. (2018). A slice of skin was removed from each sampled individual and observed under a binocular microscope. Mm presents a weakly tricuspidate crown and three longitudinal crests along the entire denticles, while Mp has a smooth tip and weakly, if present, ridges. All individuals were measured for total length (TL) to the nearest centimeter, weighted to the nearest gram, and both sex and macroscopic maturity stage were recorded according to MEDITS program protocol.

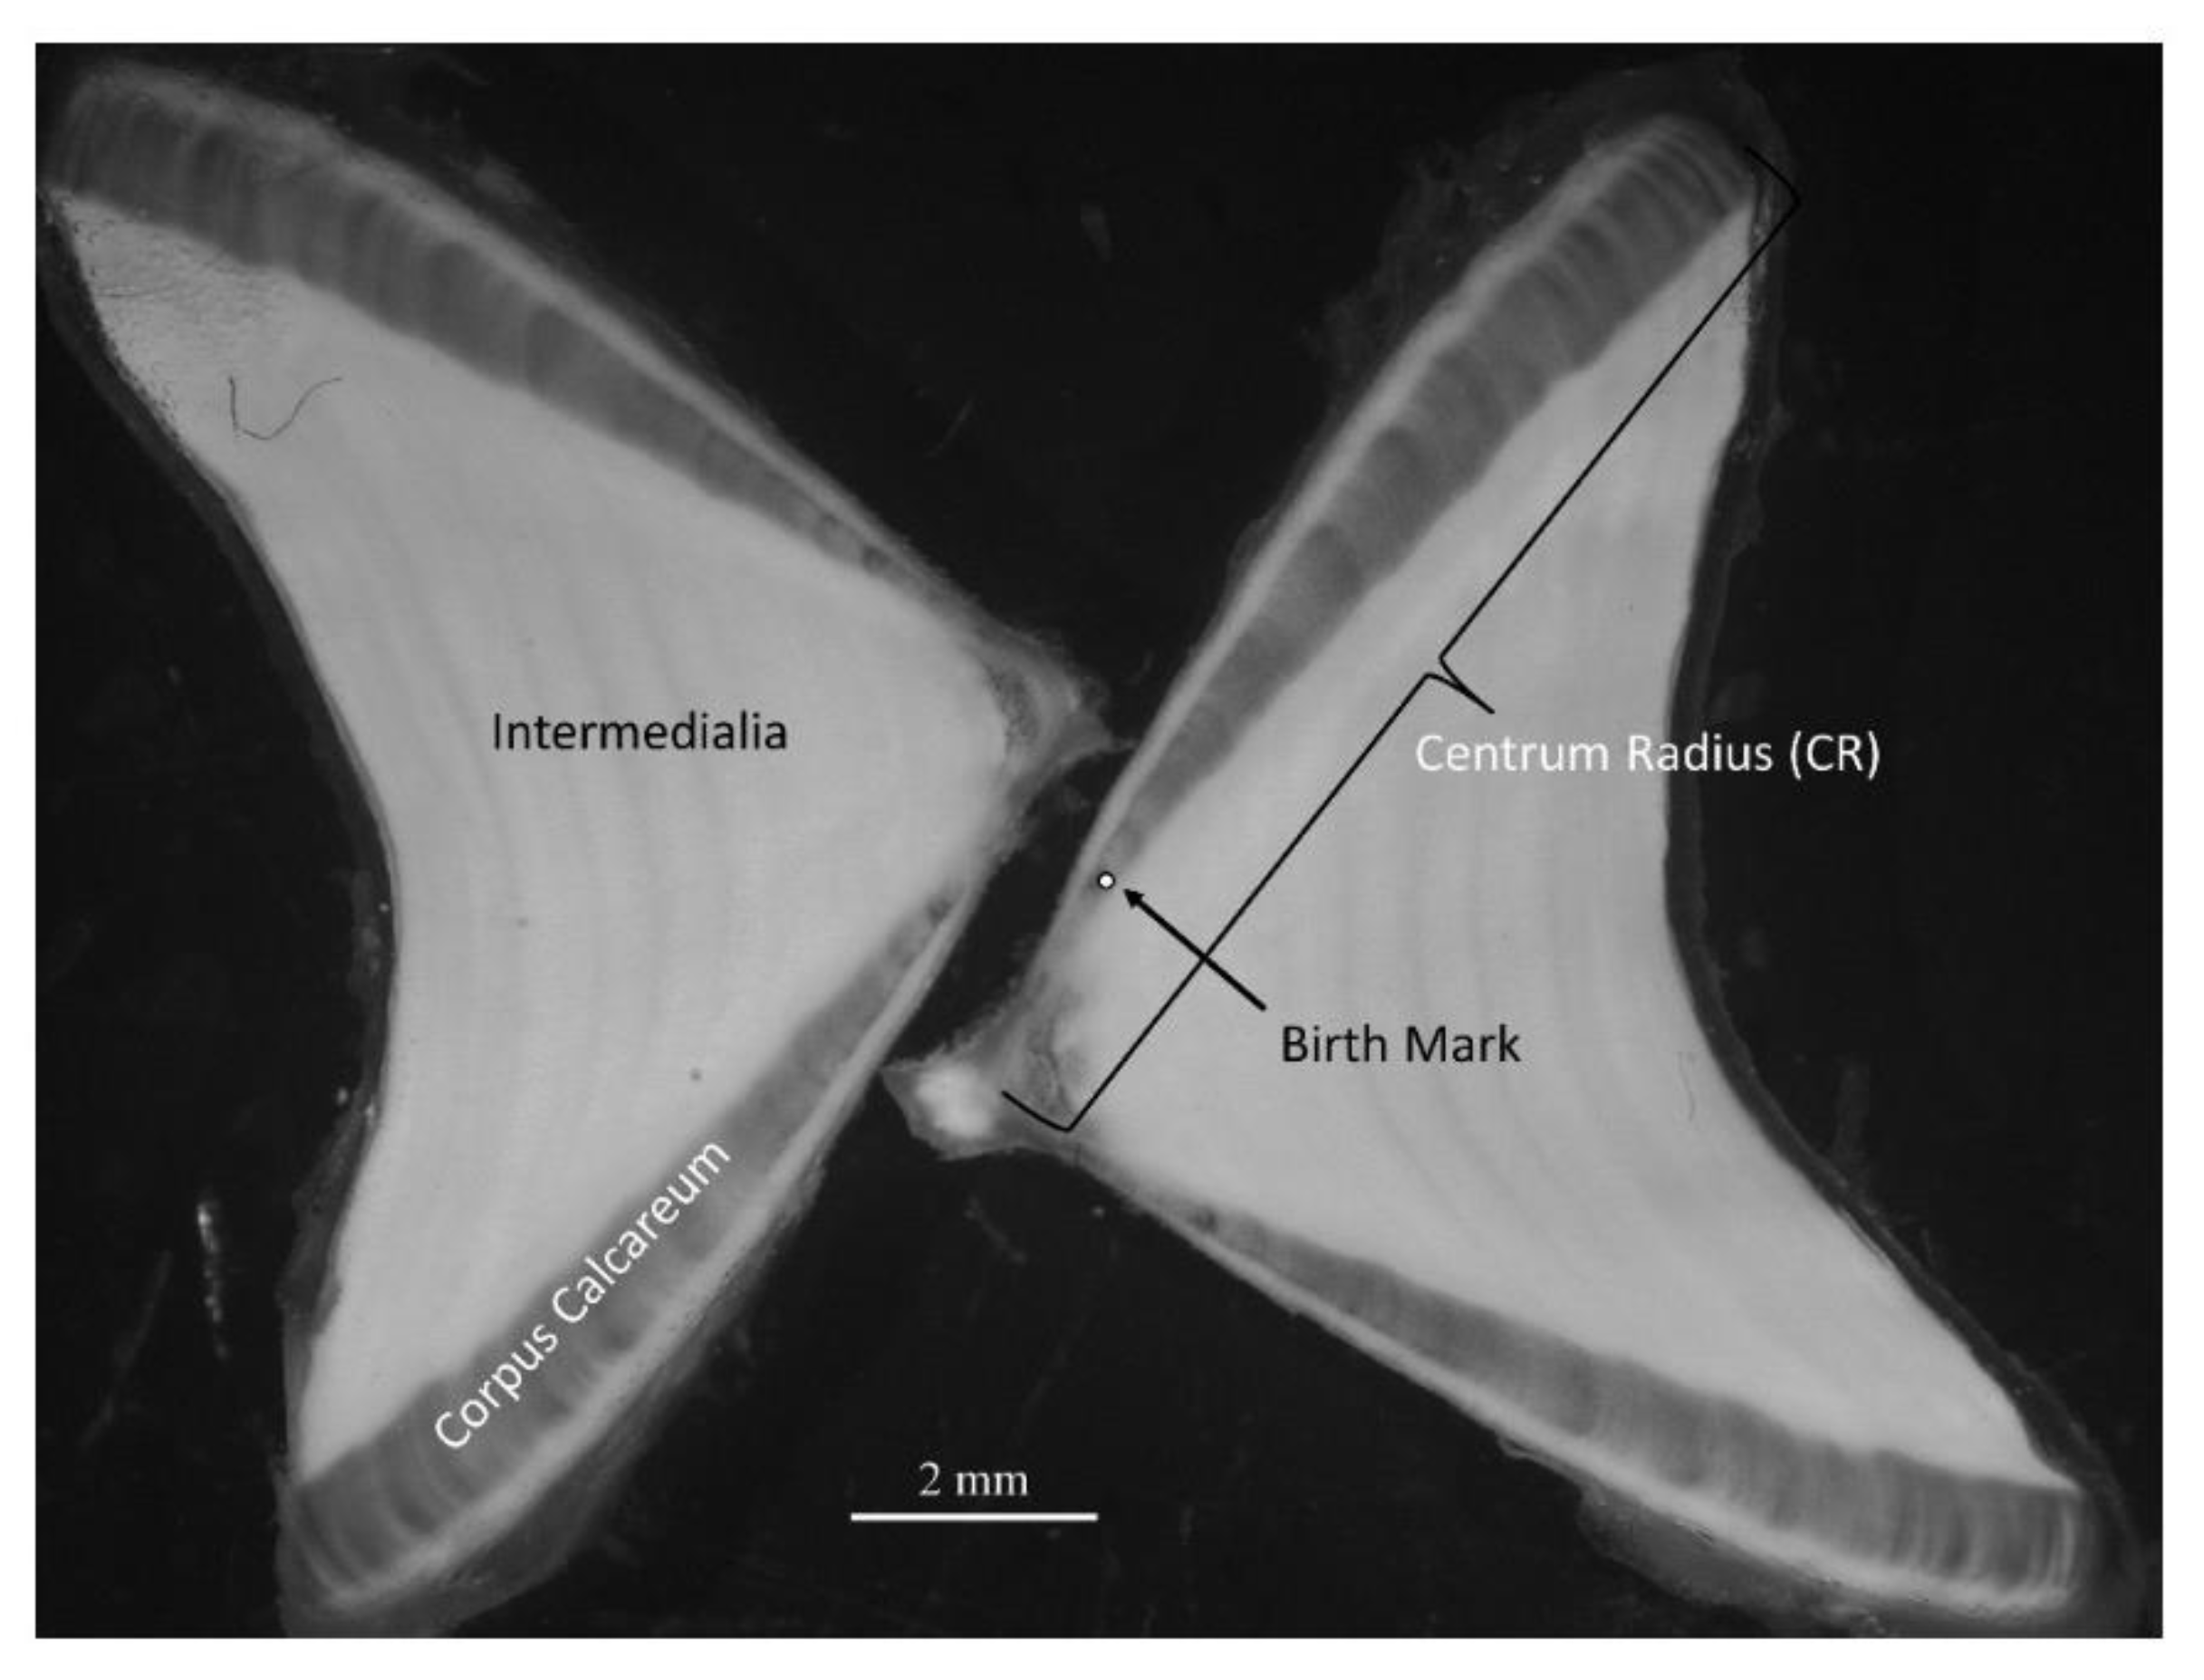
2.2. Age and Growth Curve Estimation

The first cervical vertebrae (n. 4 or 5) were extracted from each sampled individual, from the second to the fifth or sixth vertebra, behind the gills. Vertebral samples were separated into individual centra and cleaned mechanically to remove tissue before immersing them in an ammoniacal solution for 2–3 h [38]. Each centrum was sectioned through the middle along the sagittal plane using an IsoMet low-speed diamond bladed saw to obtain a 1 mm section. The sections were mounted on glass slides and a liquid cover slip was applied. Sections were observed under a stereomicroscope with a magnification of 0.8×. Vertebrae centra of small specimens (less than 60 cm TL) were embedded in a hard epoxy composed by Buehler EpoThin resin and Buehler EpoThin hardener in a 5:2 weight ratio. To make the resin harder, we put the samples in an oven with a temperature of 50 °C for about 2 h. Then, the cube of resin with the vertebra inside was cut as described above for vertebrae of larger specimens. The sections were put in a petri dish with water and observed with the help of a stereomicroscope with a magnification of 0.8×.
Age estimations were obtained by counting fully formed translucent bands along the corpus calcareum occurring after the birth mark (BM) [39]. A banding pattern with wide opaque bands separated by distinct narrow translucent bands was distinguishable in sectioned centra using transmitted light (Figure 2). This pattern occurred on both arms of the corpus calcareum and extended across the intermedialia. We digitalized the vertebra image using a Leica camera connected to the stereomicroscope using the ImageJ software (https://imagej.nih.gov/, (accessed on 25 May 2021)) to measure the centrum radius (CR) and distance to the outer margin of each translucent band. All the measures were taken to the nearest 0.001 mm along a straight line from the central focus to the center of the outer margin of the corpus calcareum (Figure 2) [40]. Total body length was plotted against Vertebra Radius (VR), the distance from the center of the section to the end of the corpus calcareum (Figure 2), to determine whether vertebral growth was proportional to somatic growth.
We used the back-calculation method to describe the growth history of each individual sampled [39]. Back-calculations estimate lengths-at-previous-ages for each individual, and its use is recommended if a sample size is small and samples are not available for every month [41], as in the present study. The method relies on the relationship between fish body size and the length of the radius of the vertebral centrum. We adopted the “size-at-birth-modified” Fraser-Lee equation [42] to relate the point of origin of proportional back-calculations to a biologically derived intercept (i.e., length at birth):
Li = Lc + ((CRiCRc) × (LcLbirth)/(CRcCRbirth))
where Li is the estimated total length at band i, Lc is the total length at capture, CRc is the centrum radius at capture, CRi is the centrum radius at band i, Lbirth is the length at birth, and CRbirth is the centrum radius at the birth mark.
To identify the latter, we compared the back-calculated lengths of the first 2–3 translucent rings with the observed size of newborn individuals. This was obtained from the size of embryos found in females in a very advanced pregnancy stage, so very close to parturition, and according to the available literature [20,21].
Back-calculated length-at-age of females and males of the two species were used to estimate the parameters of the Von Bertalanffy growth function (VBGF):
VBGF: L ⦋1 − ek (tt0)⦌;
where L is the theoretical average asymptotic, and k is the growth coefficient.
The analysis of covariance (ANCOVA) was used to evaluate if there were significant interspecific differences in both the length–weight and in the vertebra radius–fish length relationships. The R packages FSA [43] and nls were used to fit the growth model. Interspecific difference in growth were tested through the likelihood ratio test for comparing multiple growth curves using the R package Fishmethod [44]. Likelihood ratios were calculated by using the residual sum-of-squares and were tested against chi-square statistics with the appropriate degrees of freedom.

2.3. Validation of Ring Pattern on Vertebrae Using Tagging Data

A tag and recapture program of Mm and Mp was carried out along the SW Sicilian coast in 2007–2010. Smooth hounds were tagged on board of commercial trawlers using “spaghetti” tags (Hallprint©; Hindmarsh Valley, Australia). These consisted of a monofilament vinyl streamer attached to a plastic barb and were inscribed with a unique alphanumeric code and contact details (i.e., phone number and the address of the CNR institute involved in the project). The following information were collected for each individual during the two phases of the experiment, tagging and recapture: tag code, TL, weight, sex, geographic coordinates, and date. We used the same approach and tools to measure fish length at tagging and recapture phases to make the measurement with high accuracy. Unfortunately, it was not possible to distinguish the two species on board due to their very similar morphological characteristics. For this reason, individuals were classified as Mustelus spp. Consequently, tagging data were analyzed for the two species combined and the corresponding growth rate of recaptured specimens was used as a guideline to discriminate true winter ring from false check marks on vertebrae centra. As shown by [32] for Mm in South African waters, the existence of false check marks, narrow vertebral band composition with aperiodic vertebral band deposition resulted in problems with estimation of age and highlights the need for age validation. To avoid an overestimation of age due to the existence of false checks, we adopted the following approach based on back-calculated length-at-age: (1) the birth mark (BM: age 0) was selected as the one laying at a back-calculated length corresponding to the size of newborns; (2) the first winter ring (age 1) was the first translucent ring whose back-calculated length corresponded to a size increment from length at BM comparable with the growth rate of tagged and recaptured specimens in the same size range; (3) the same approach was adopted for the subsequent rings.

2.4. Maturity and Reproduction

Male sexual maturity stage was evaluated by exploring external features: clasper size (relative to pelvic fins) and calcification, and the extrusion of sperm after applying pressure to the sperm sacs. The females were dissected, and the reproductive apparatus was analyzed to determine sexual maturity. They were considered sexually mature if eggs/embryos were present in the uteri, or eggs/embryos were absent but uteri had placental scars and/or if uteri were well developed and vascularized and the ovary had large yellow oocytes [45]. If the embryos were recognizable, they were sexed and measured with a caliper to the nearest millimeter (TL). The Chi-Square test was used to test for significant difference in the sex ratio of litters examined. The length at which 50% (L50) of the males and females were sexually mature was estimated using a logistic regression for each sex and species separately by calculating coefficients a and b, respectively, of the following logistic equation:
PTL = 1/(1 + e(−(a+bTL)))
where PTL is the probability of an individual to be sexually mature. L50 is equal to −a/b.
The fecundity (f), as mean number of embryos per female length class, was estimated only for Mm using a power function with two parameters f = xTLy. It was not possible to estimate the fecundity of Mp due to a low number of specimens collected during the study.

3. Results

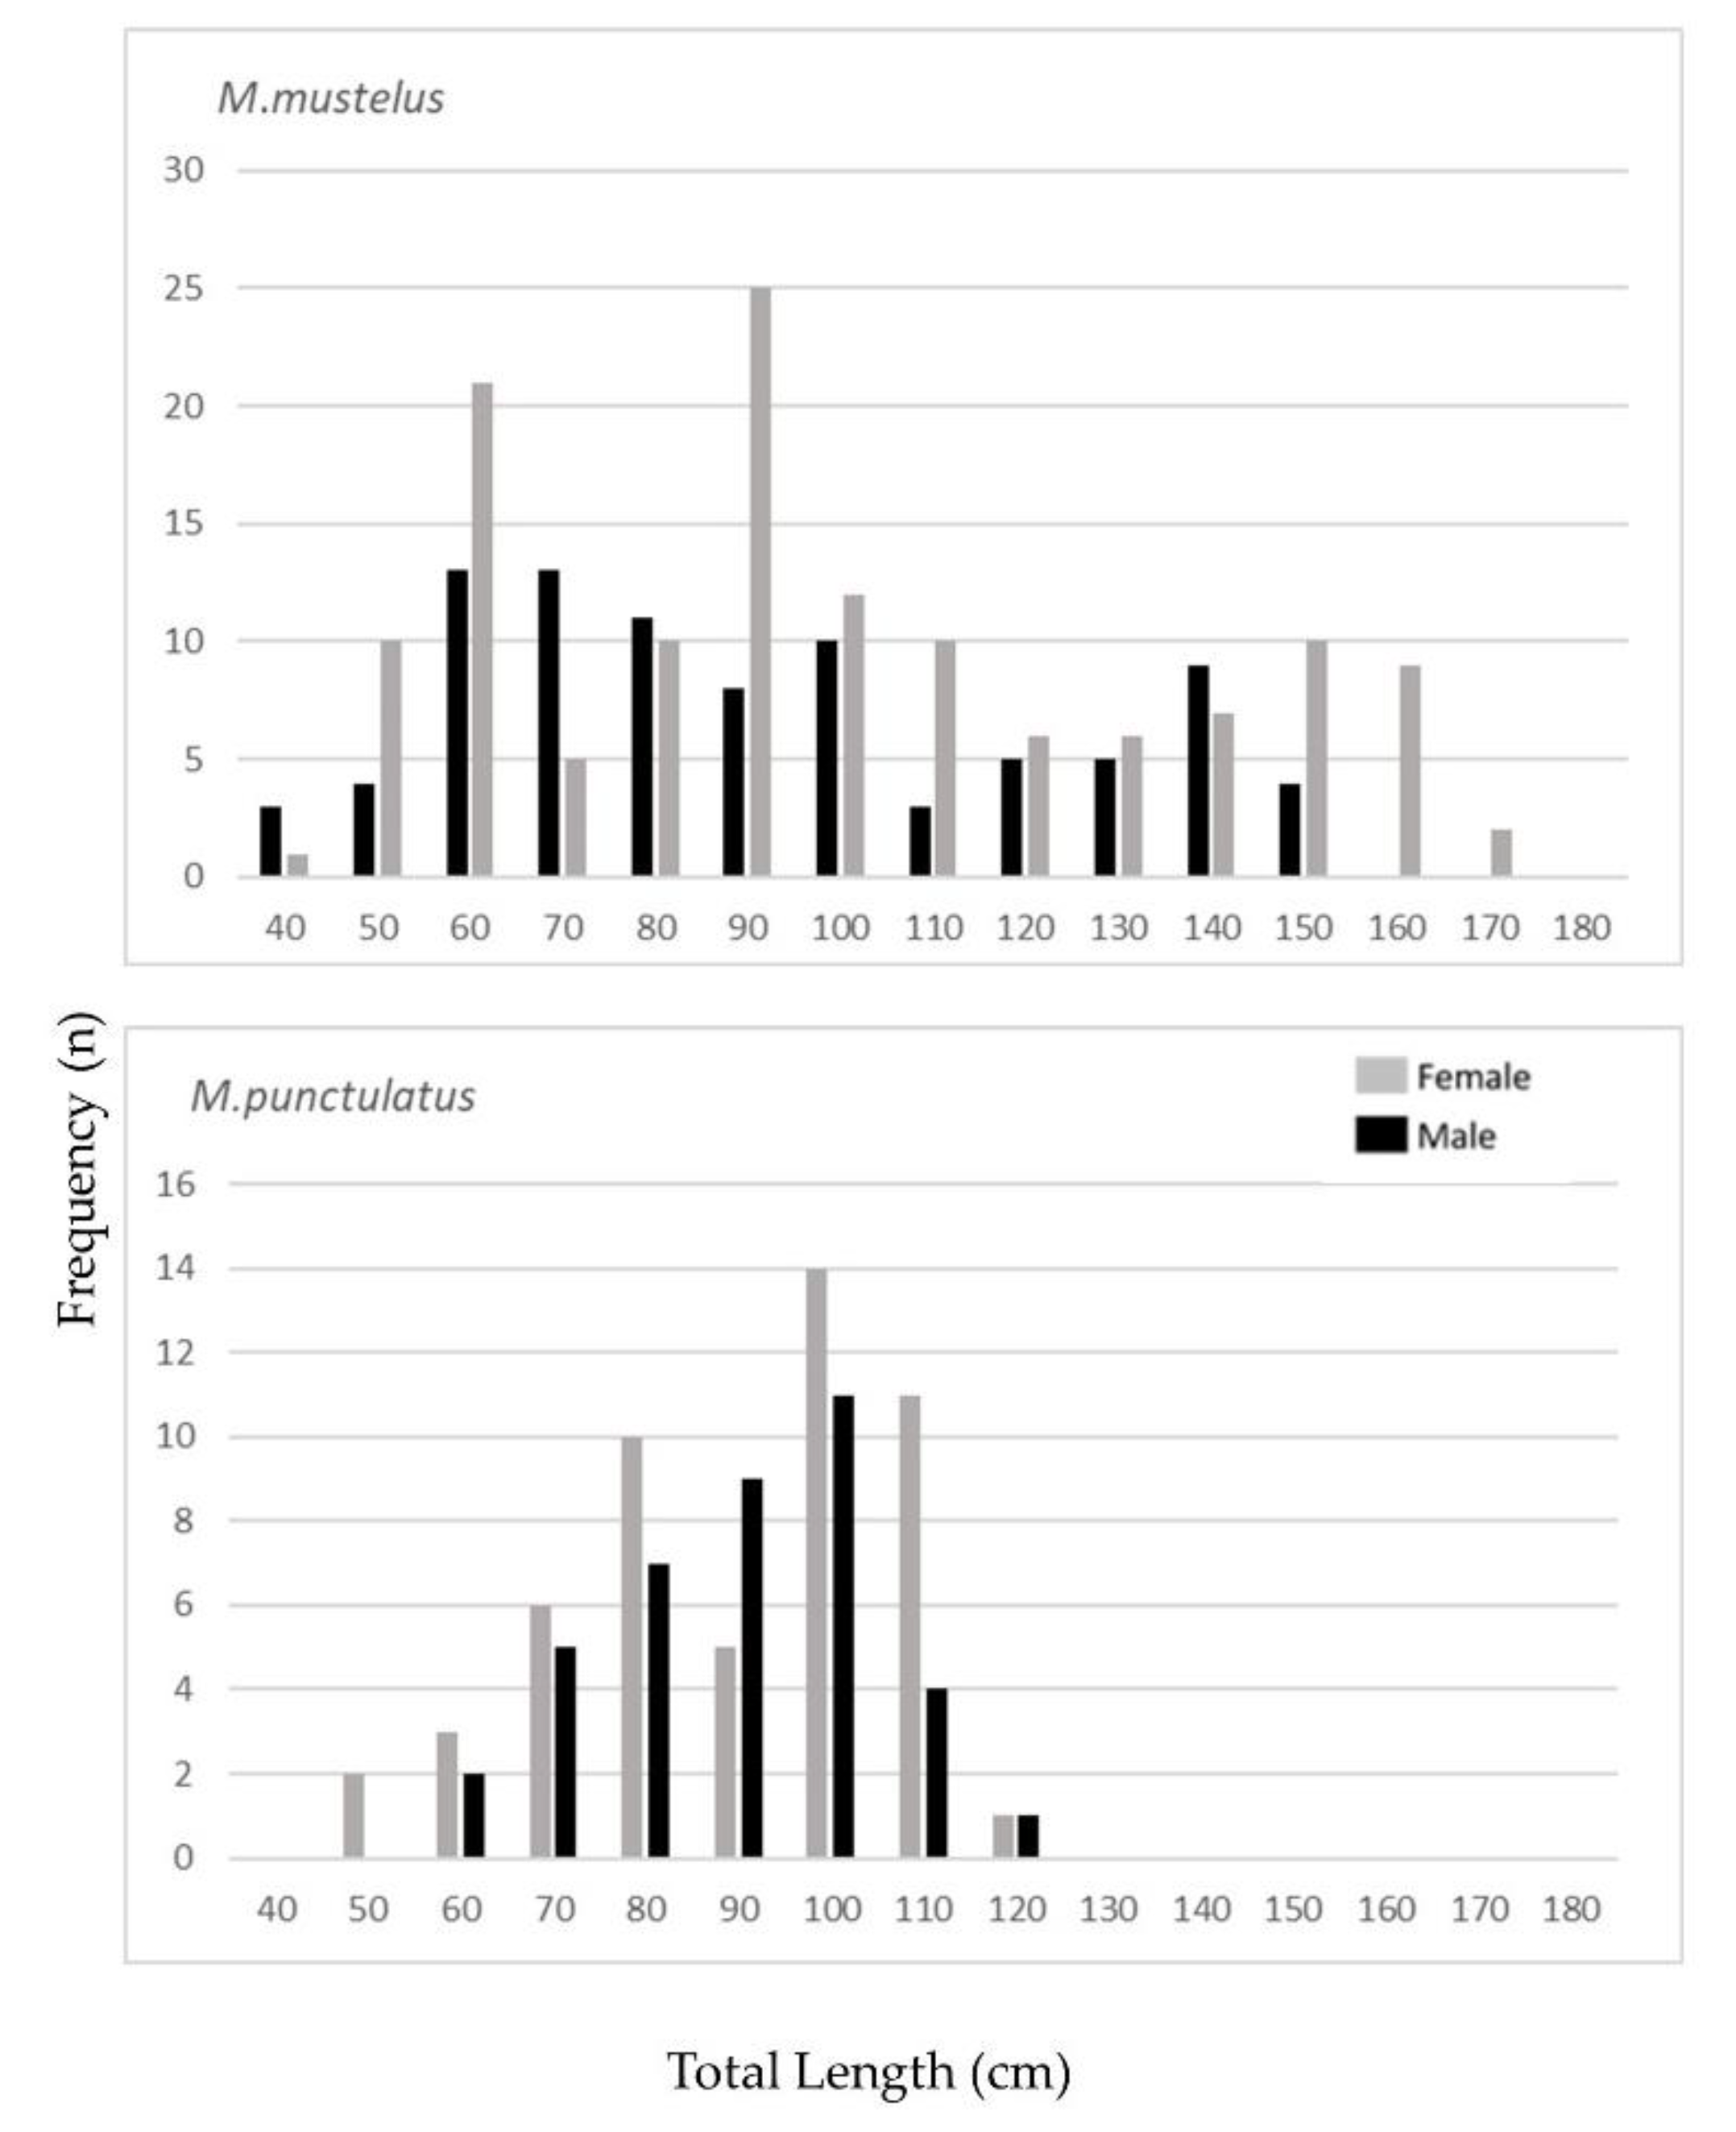
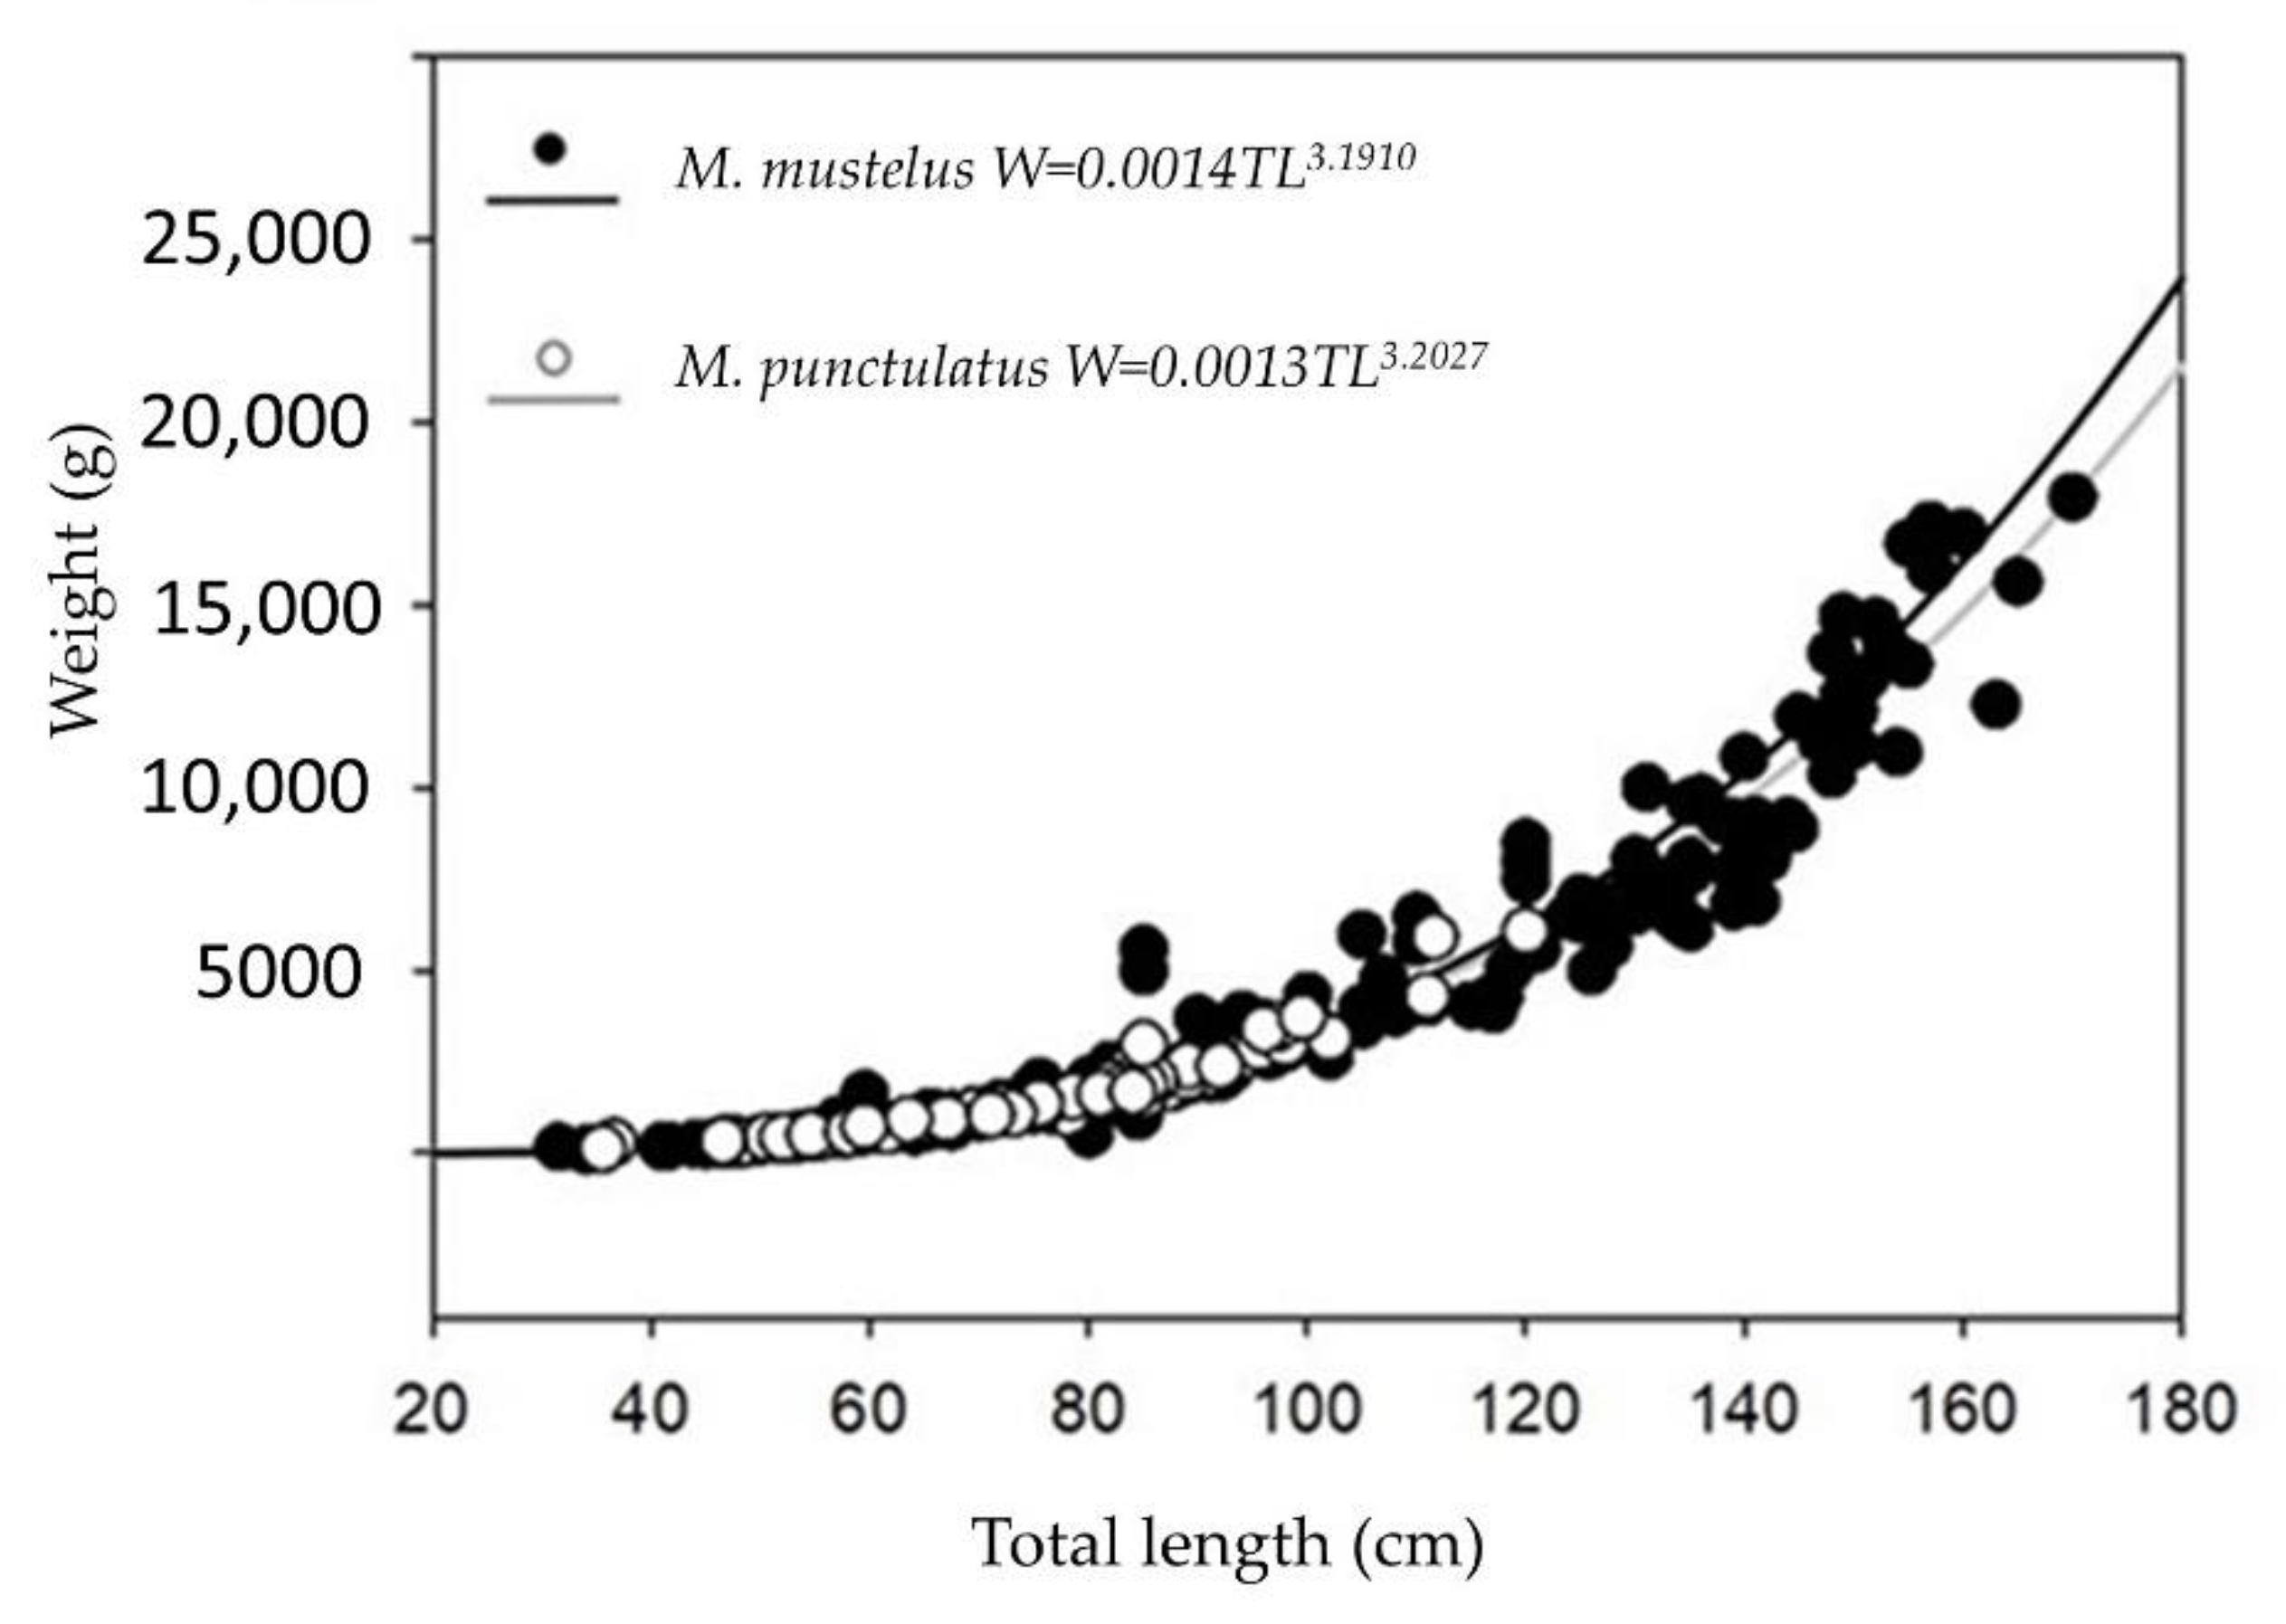
3.1. Smooth-Hounds’ Samples

The study was based on a sample of 232 (139 females and 93 males) Mm, and 97 (56 females and 41 males) Mp, whose size ranged between 31.5 and 170.0 cm TL and between 35.5 and 120.0 cm TL, respectively (Figure 3).
The two species did not show significant differences in length–weight relationships (ANCOVA, p > 0.05, F = 785.549) (Figure 4).

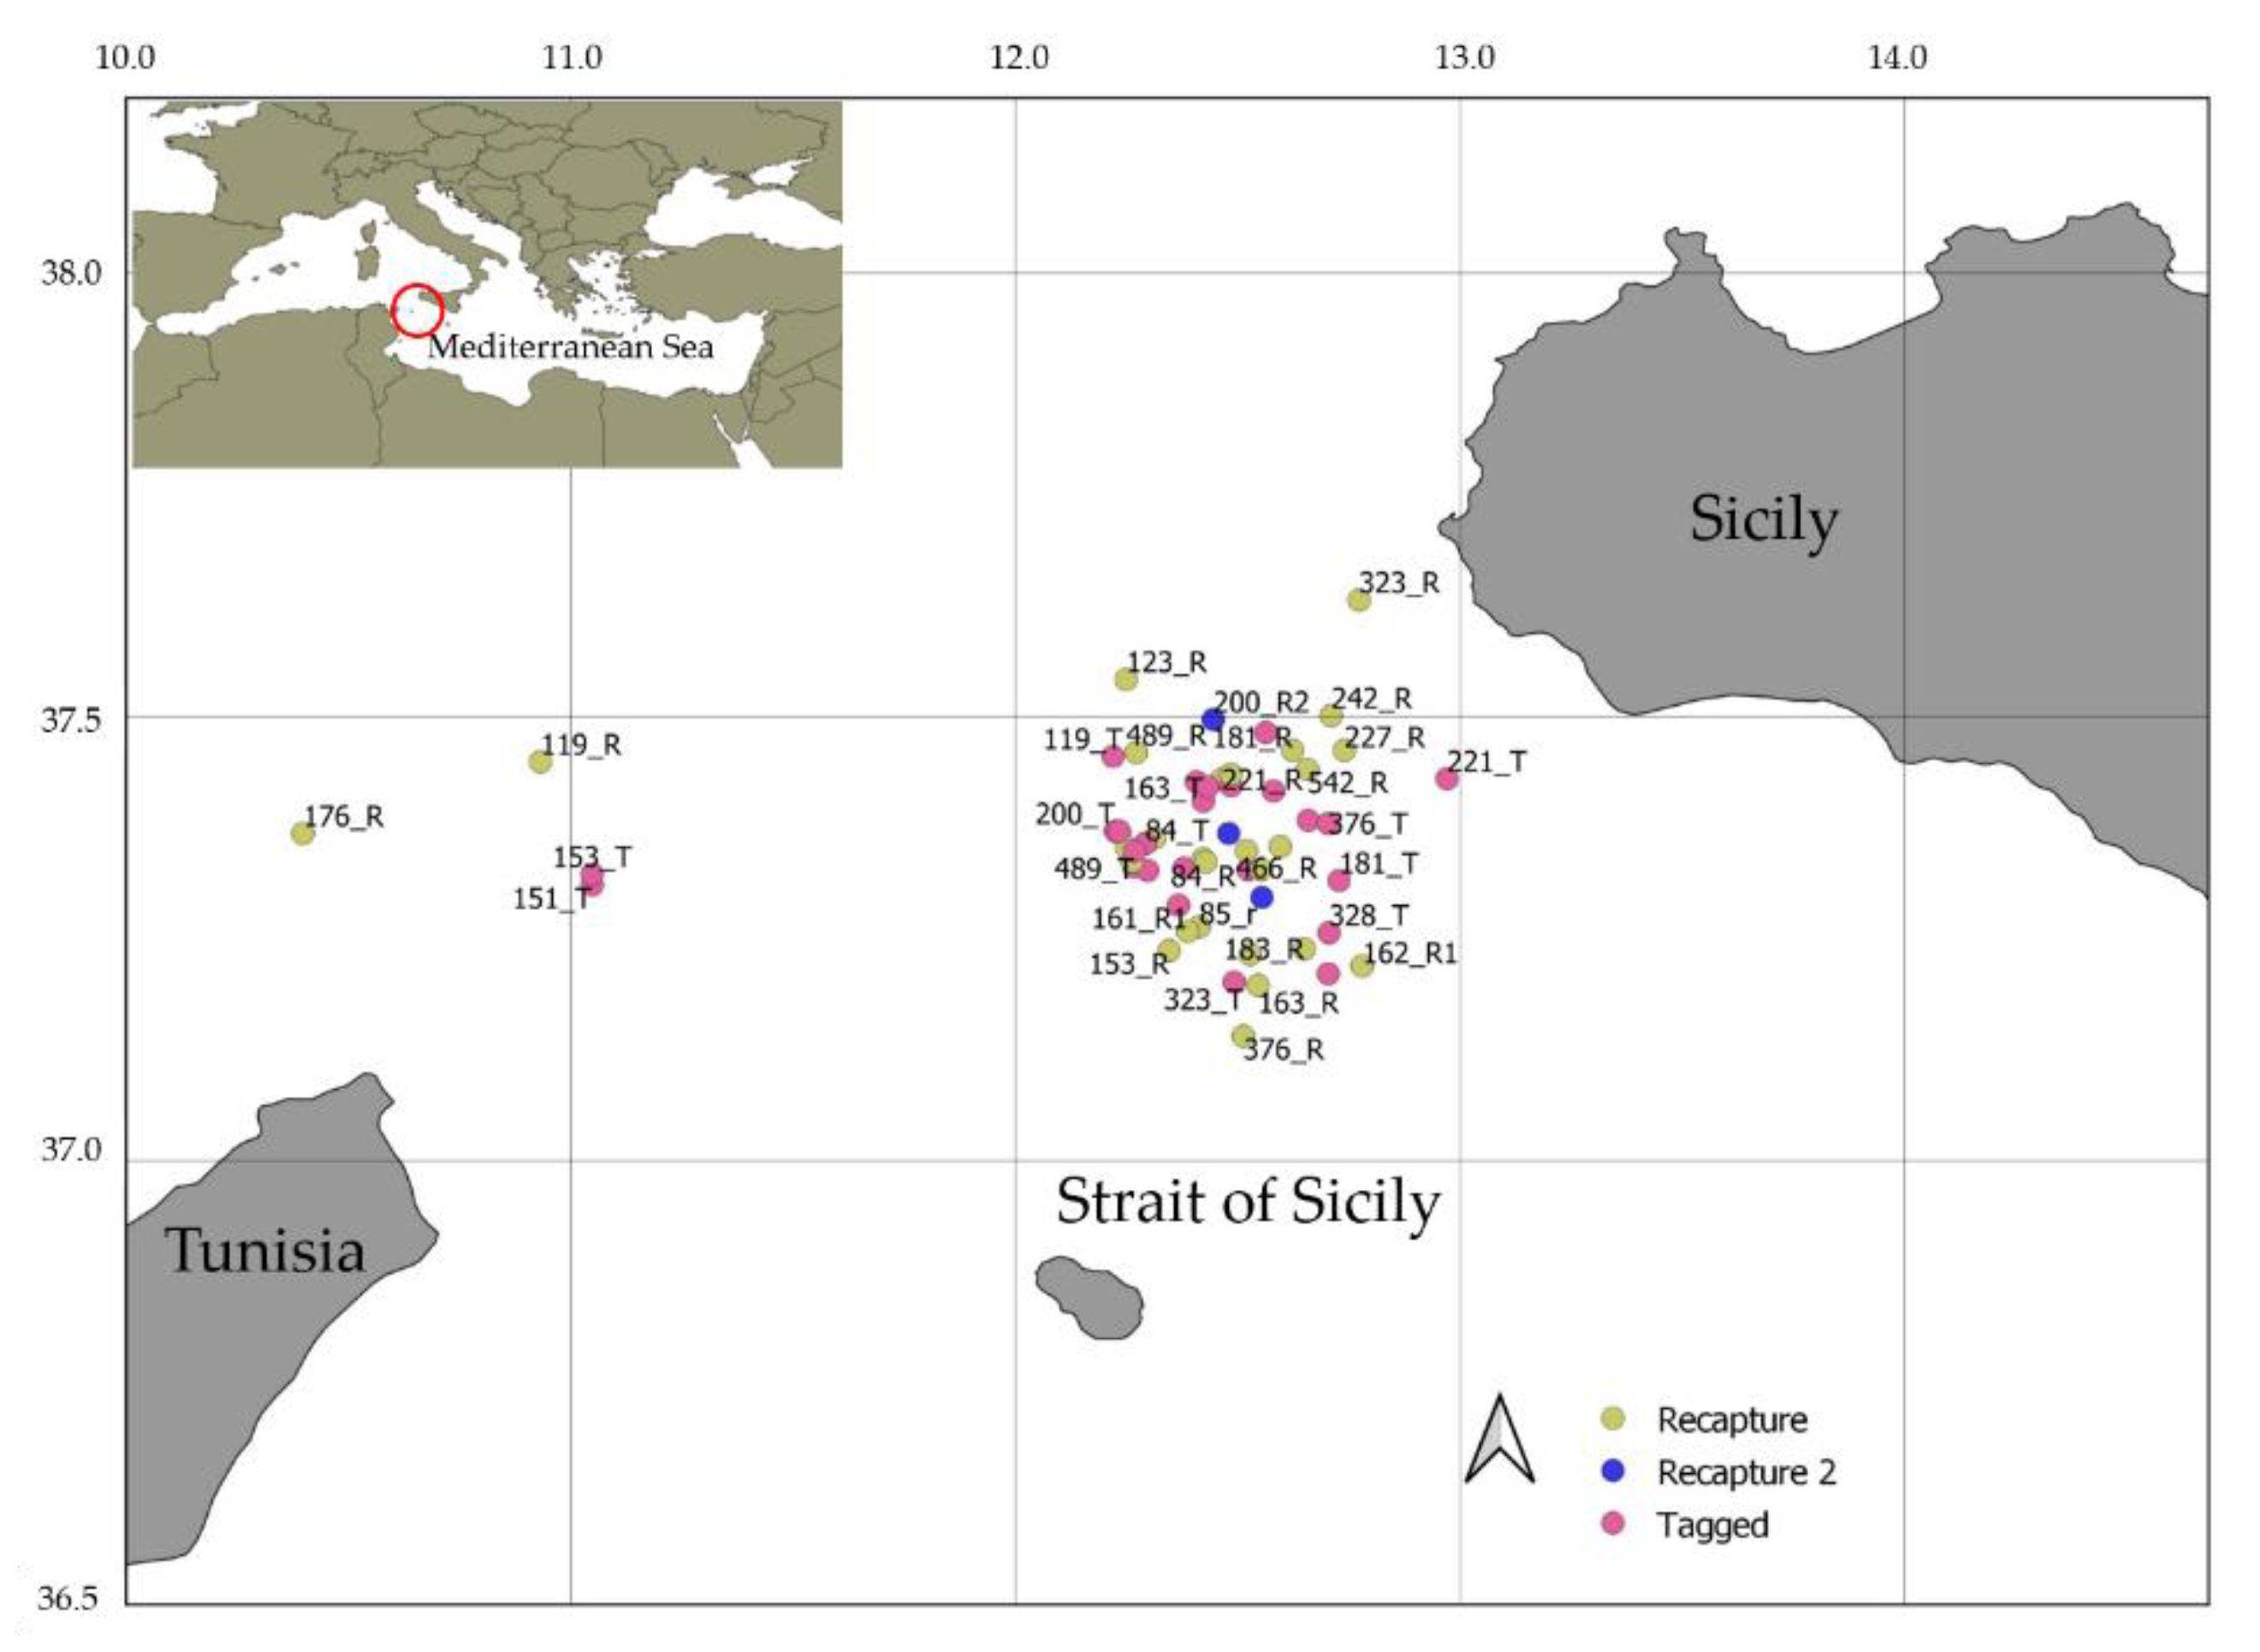
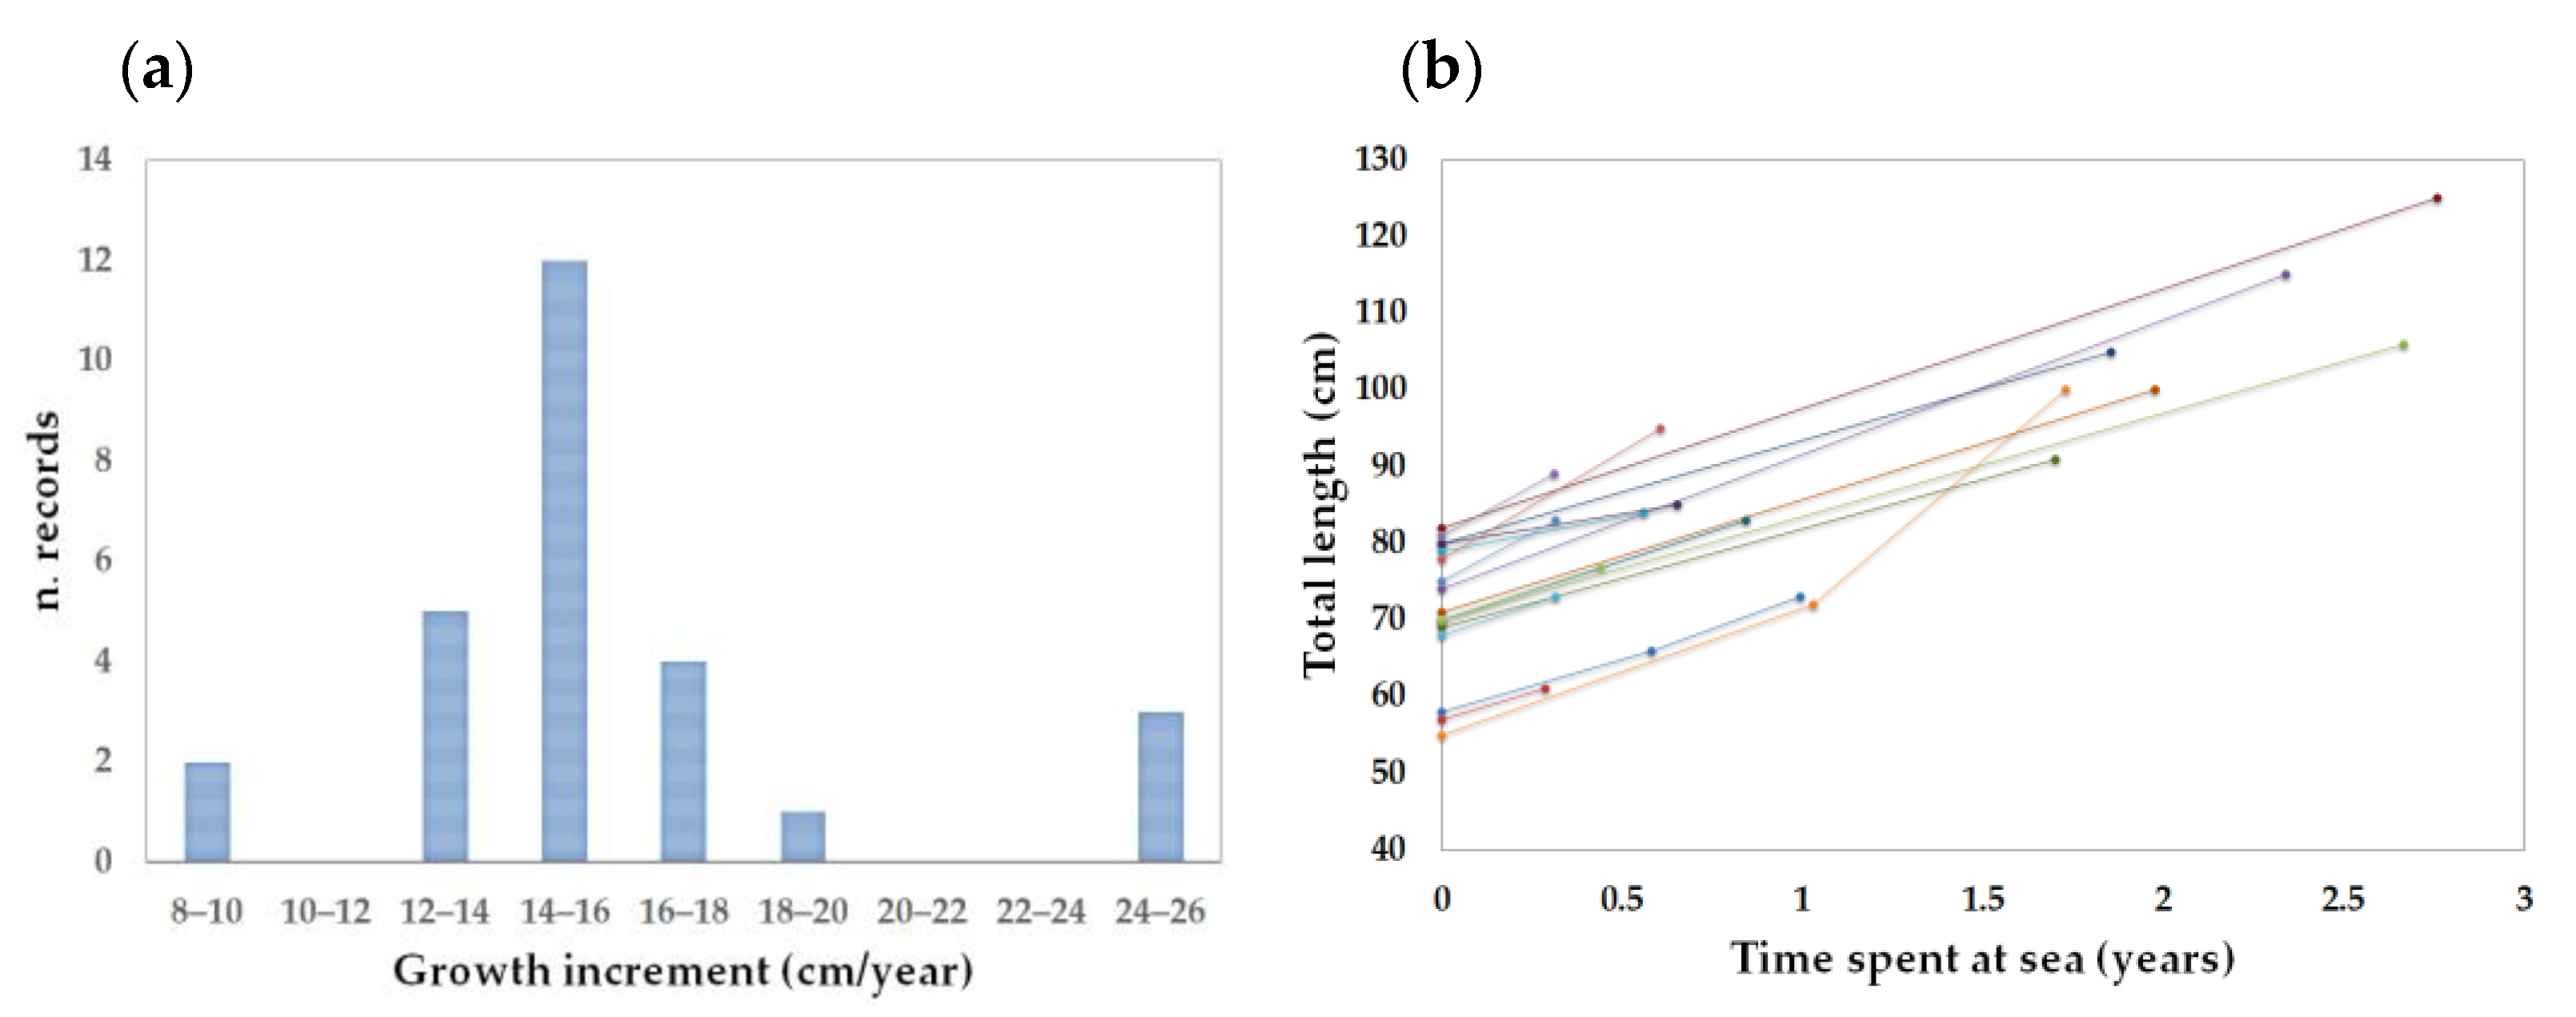
3.2. Tag-Recapture Data
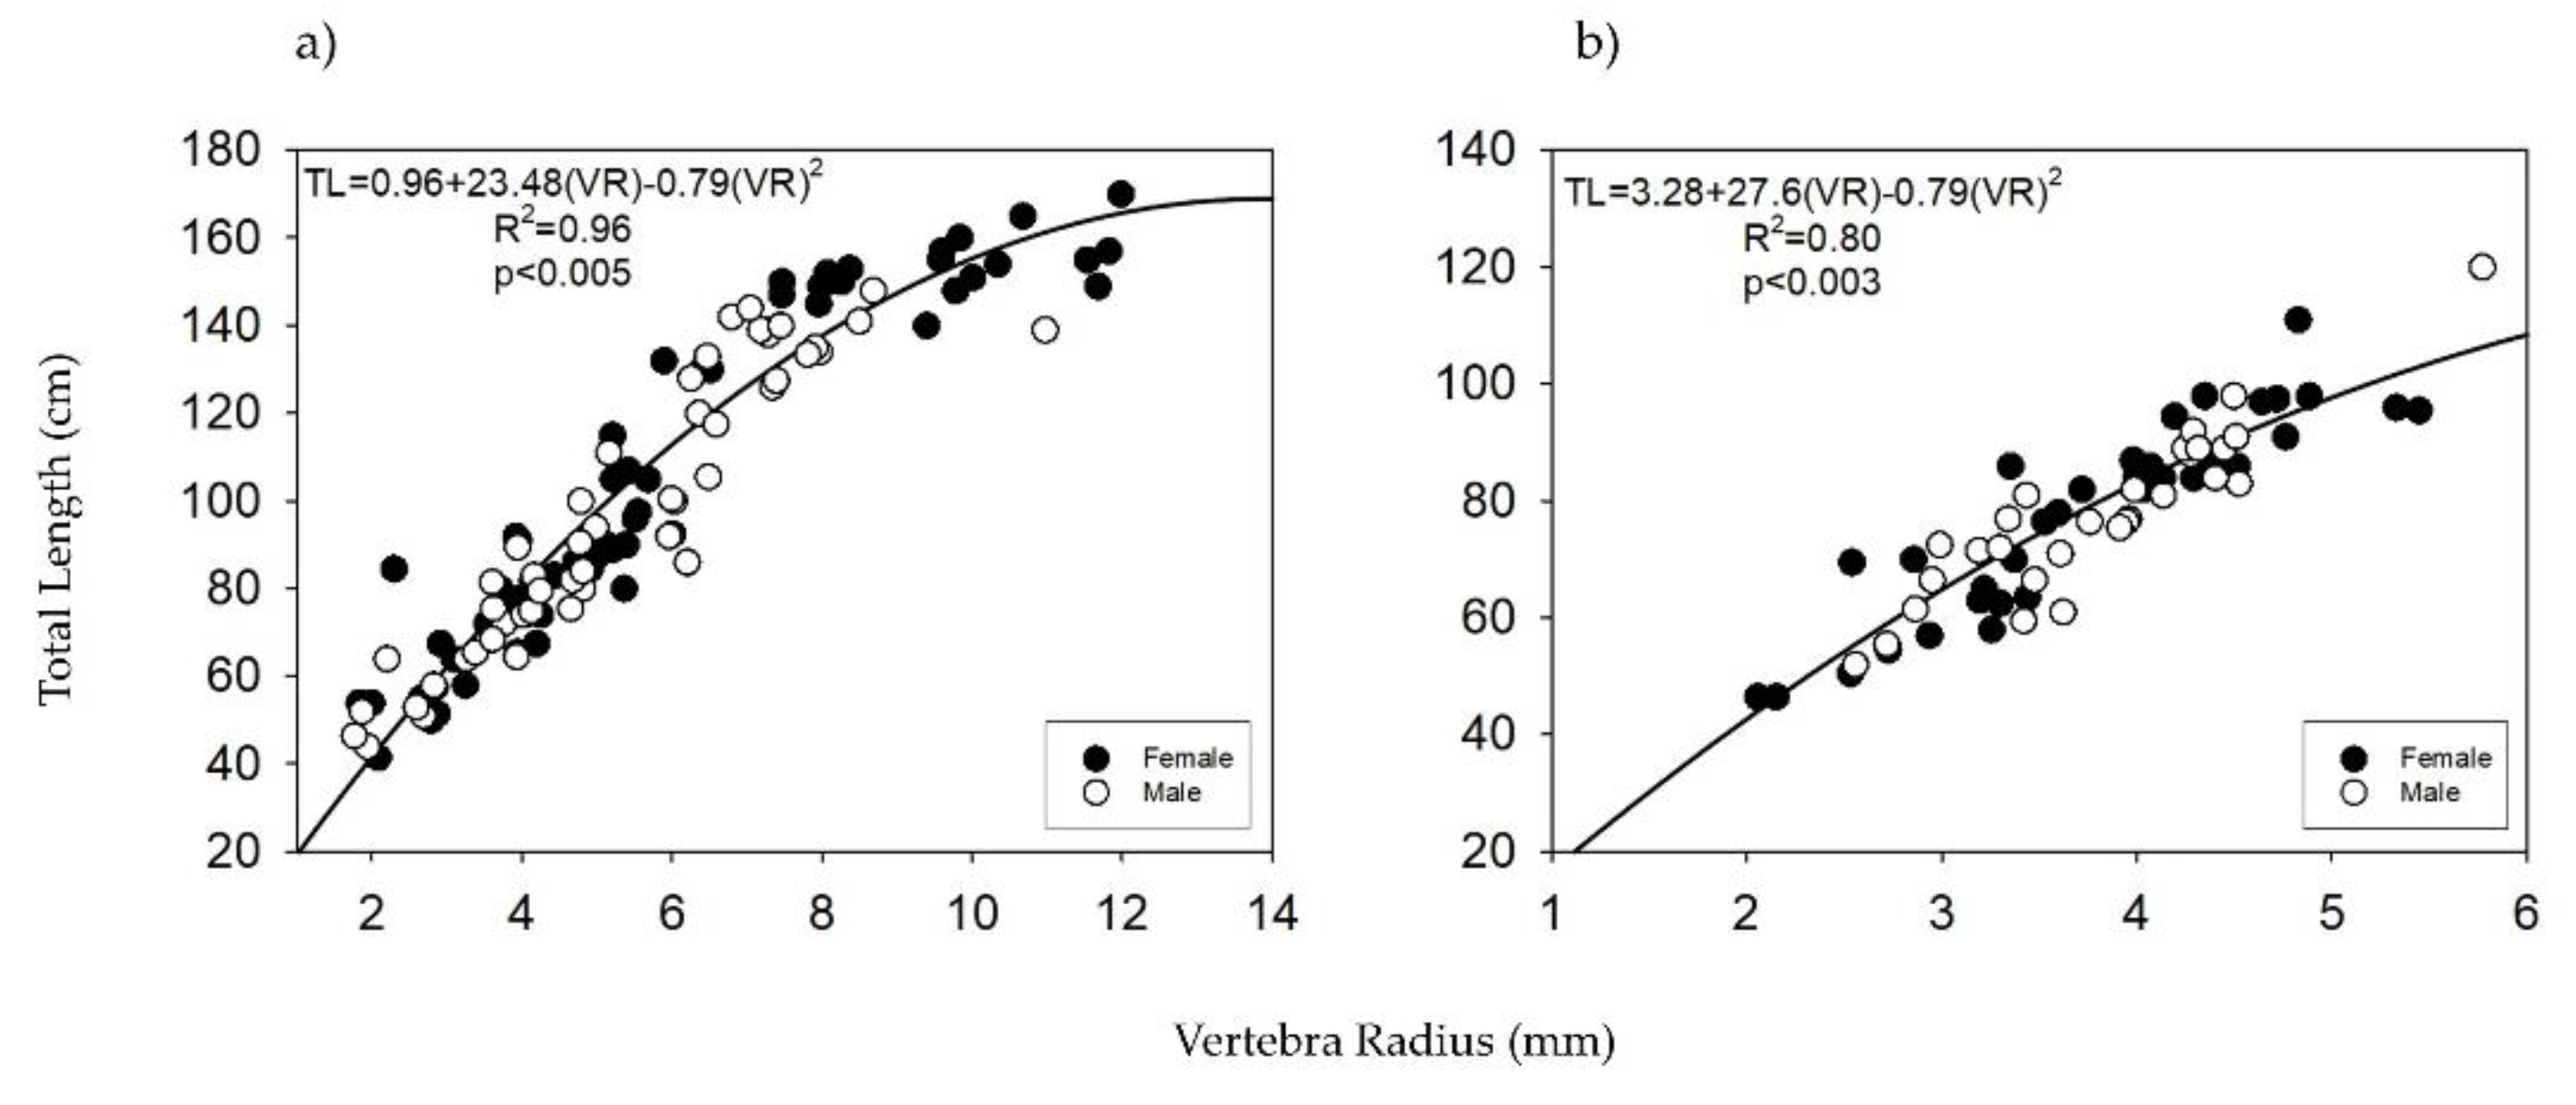
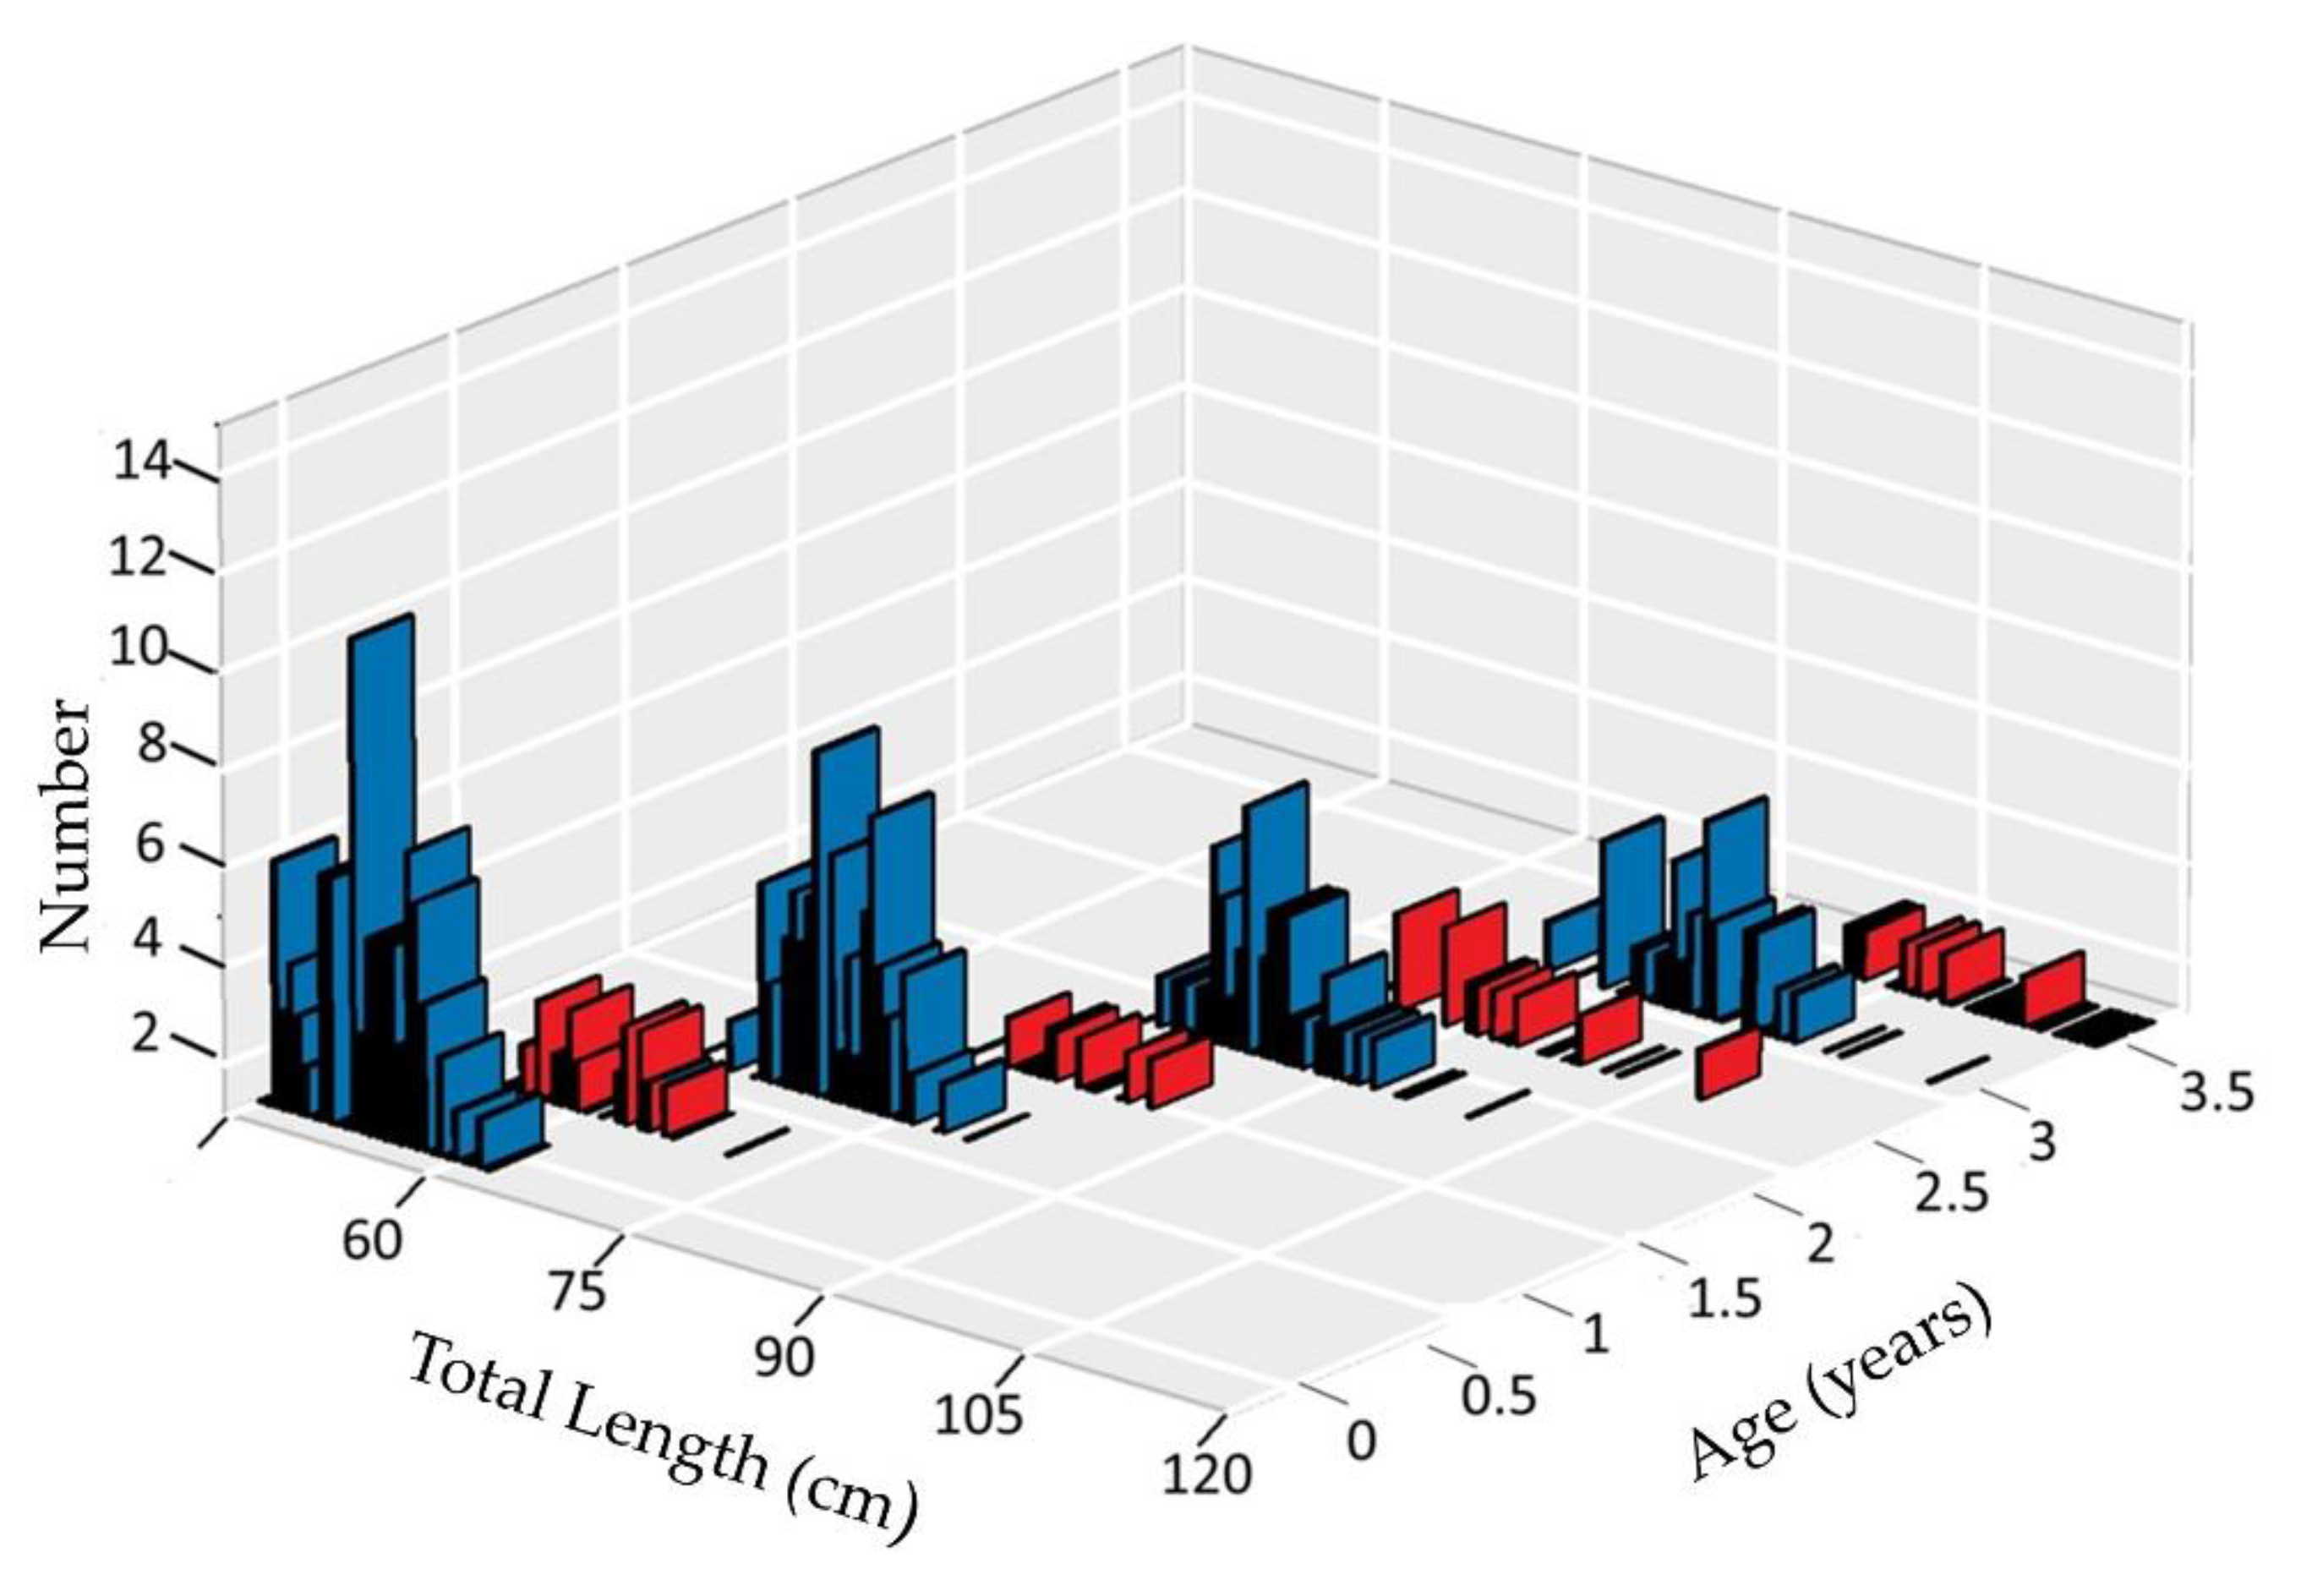
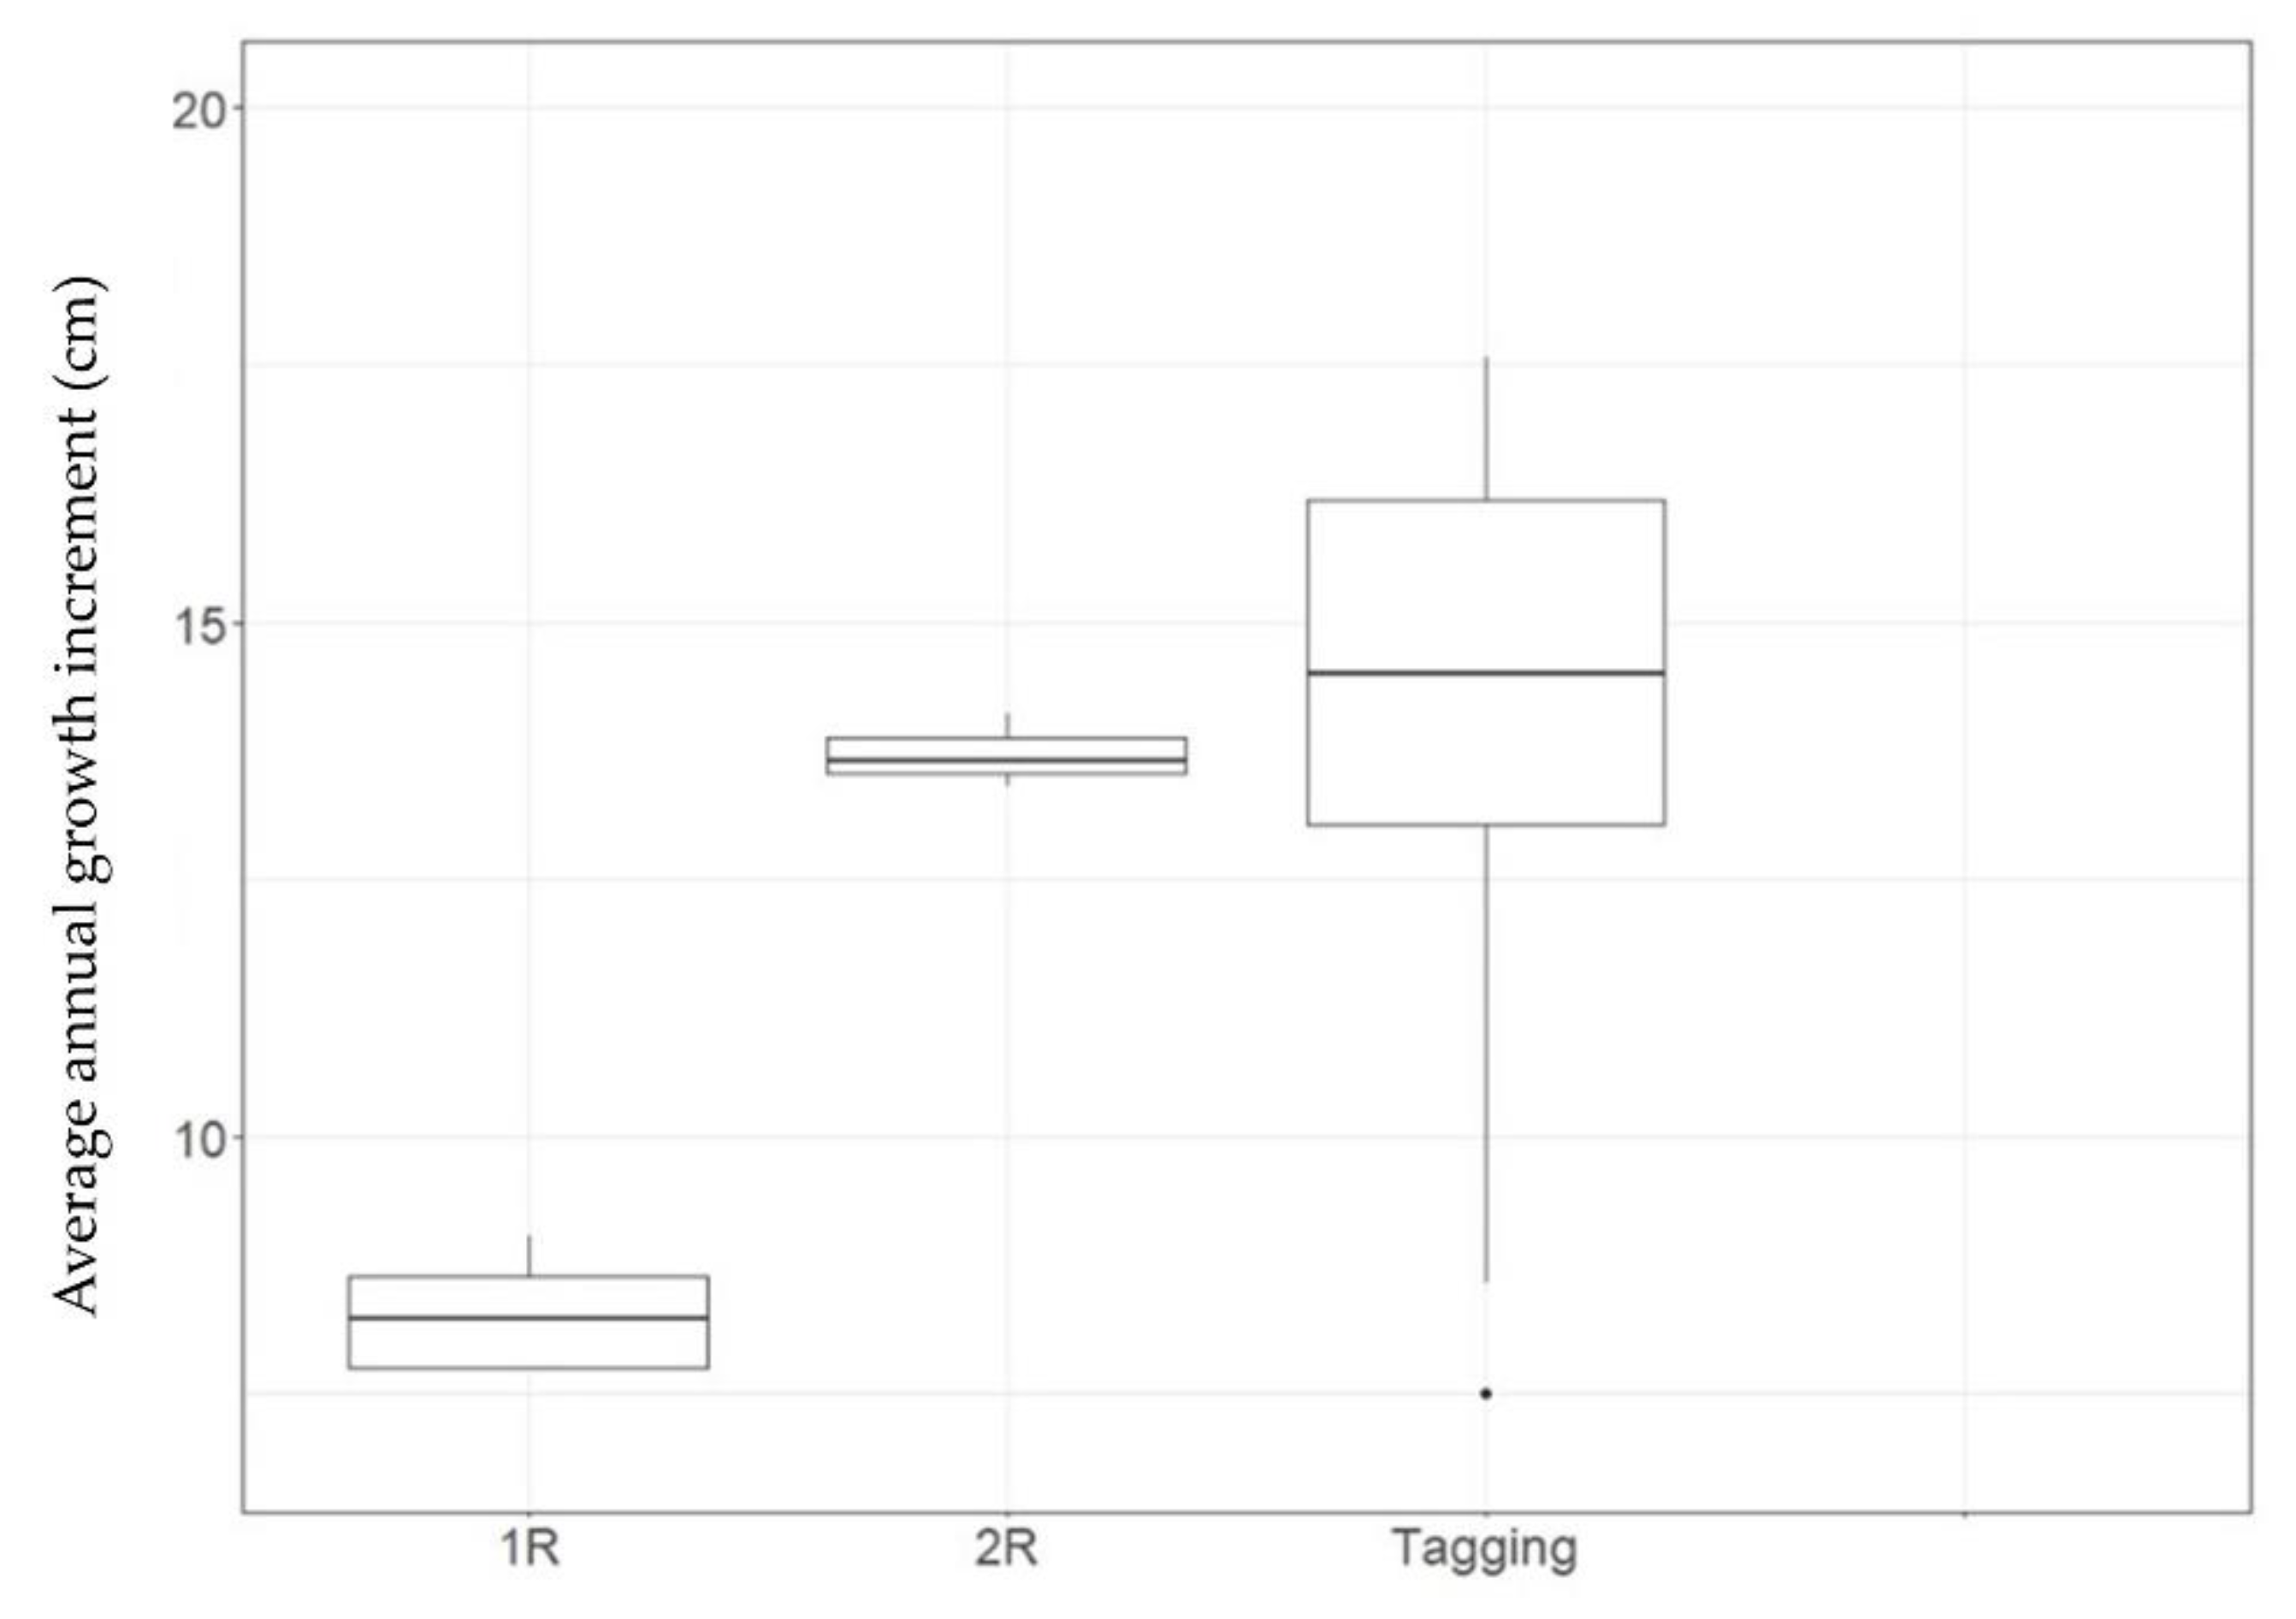
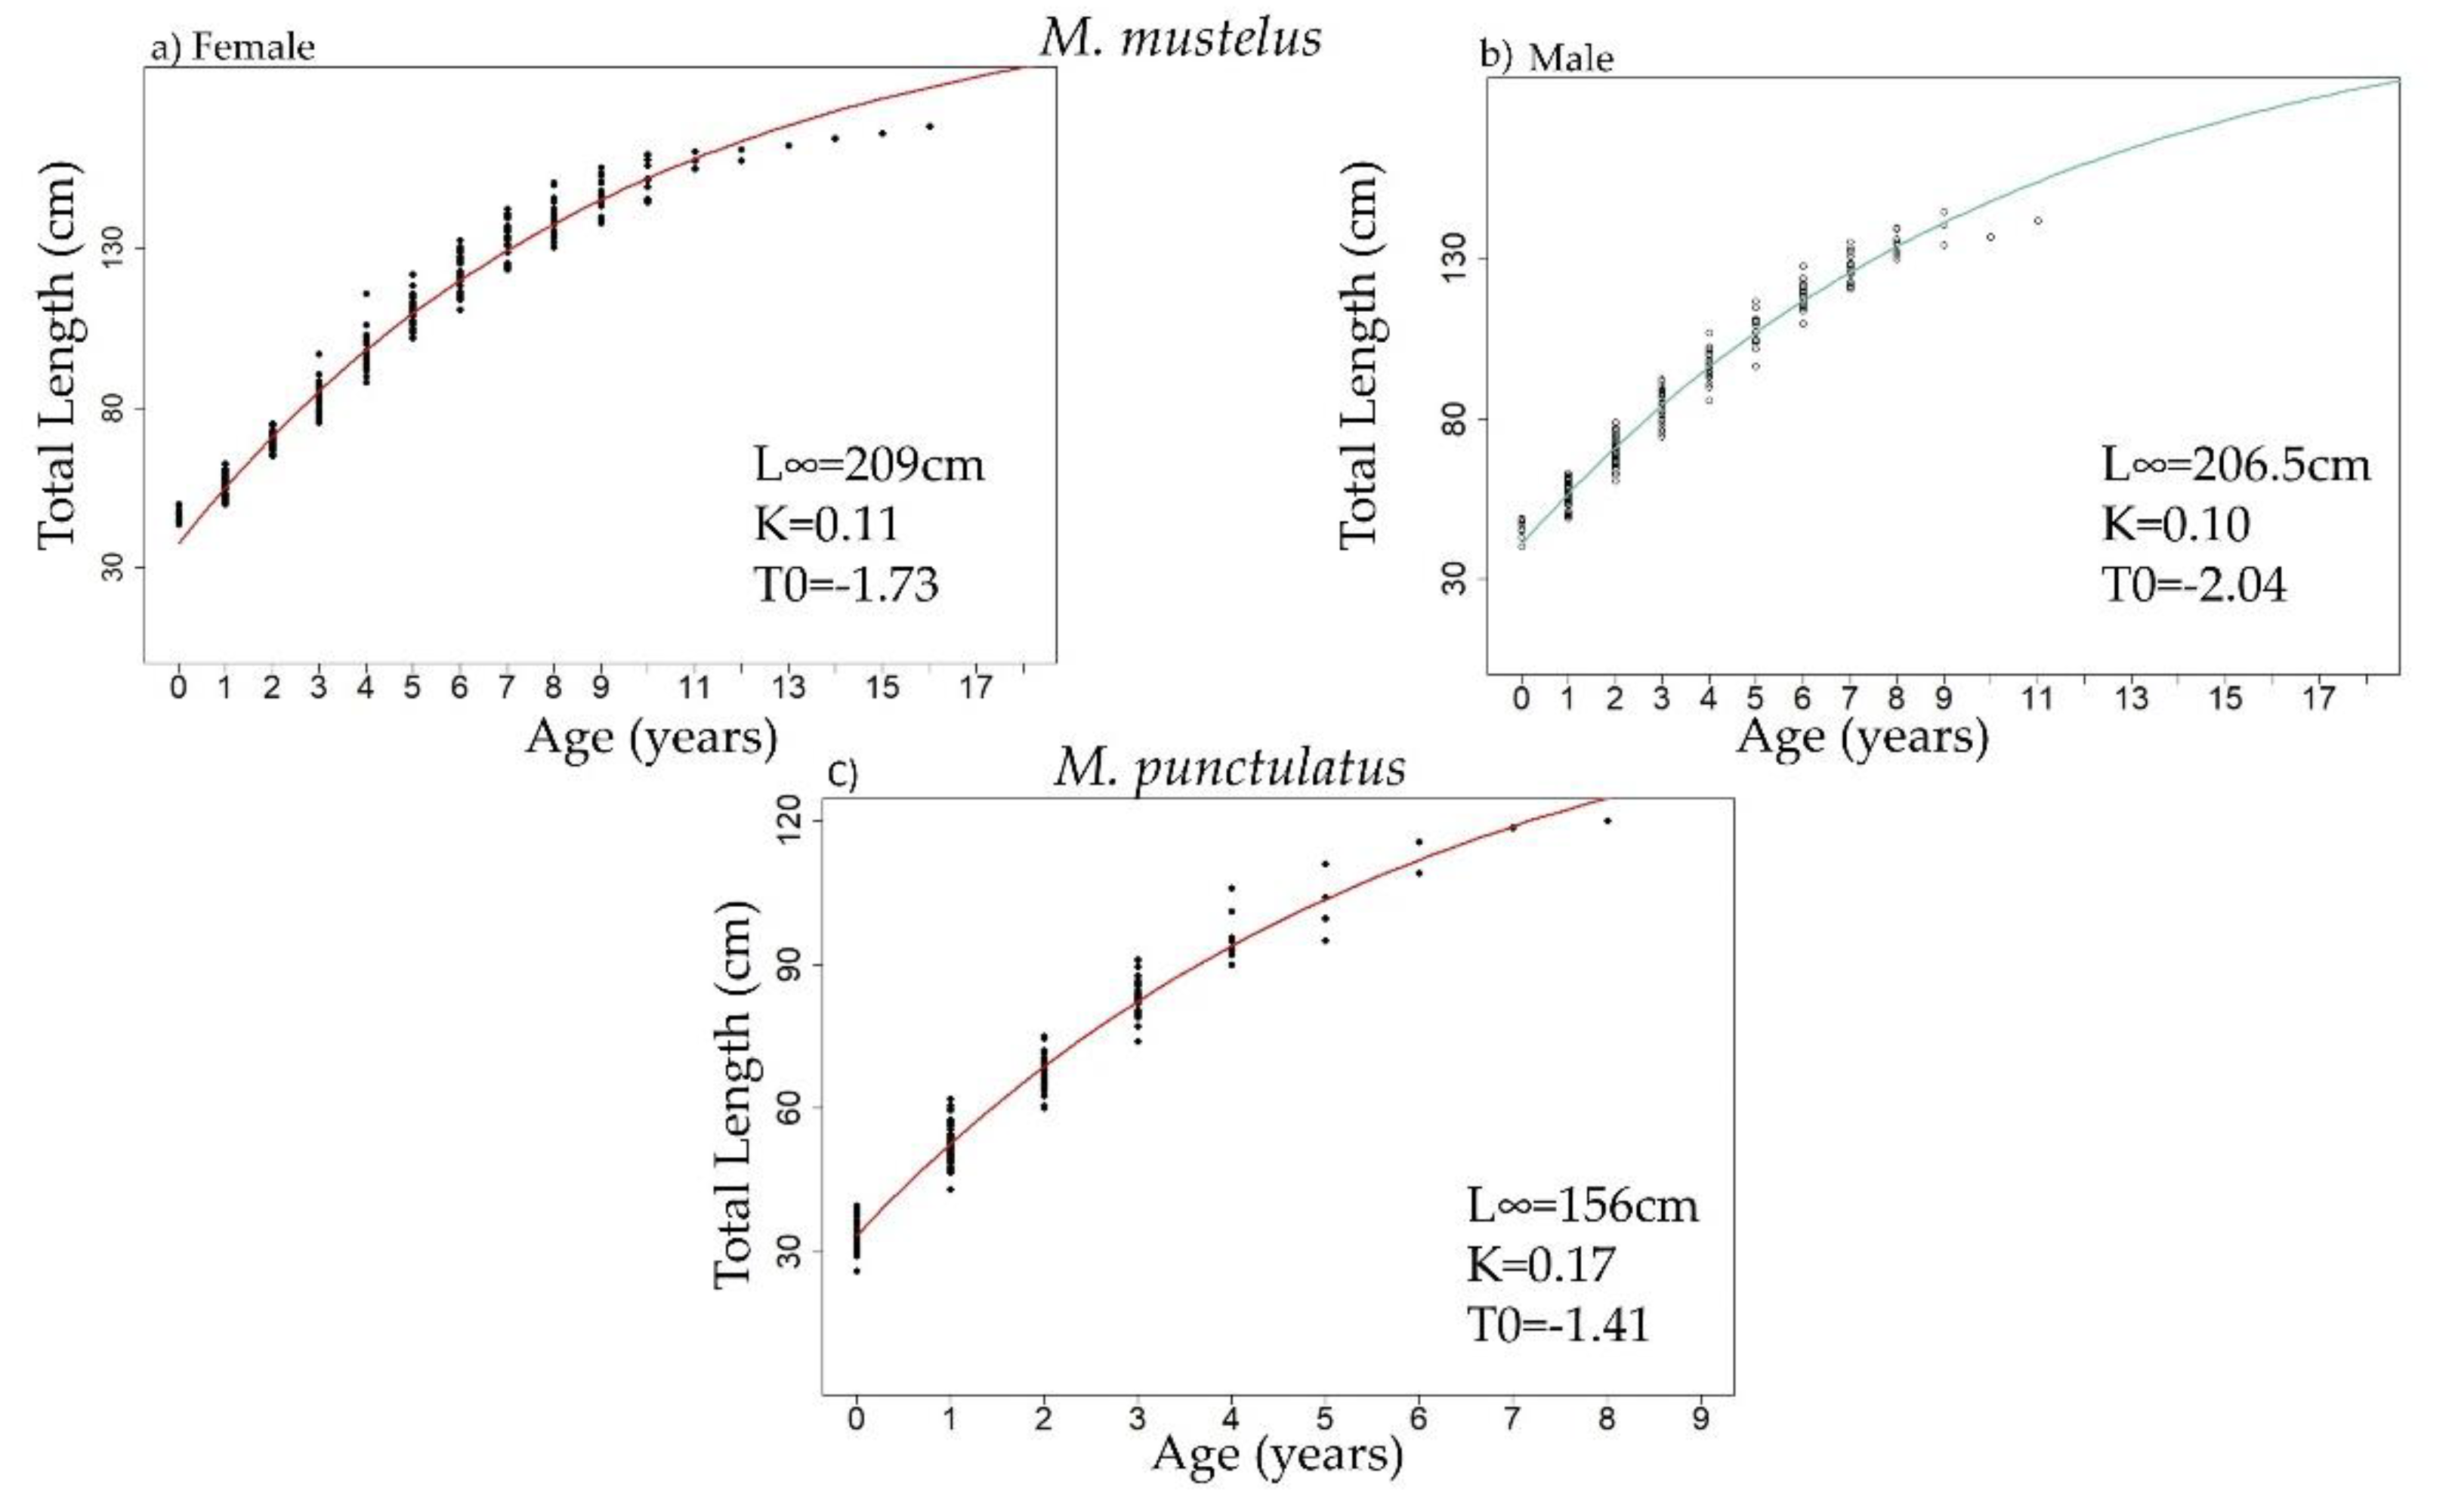
About 349 specimens of Mustelus spp. were tagged and released at sea during the tagging survey along the SW coast of Sicily. On the whole, recapture data of 26 individuals were obtained from local fishers, three of which were recaptured and released twice (Table S1). Tagging effort was fairly evenly distributed throughout all months, whereas most recaptures were made in Autumn (43.7%) and Spring (40.6%). Time at liberty, defined as the number of days between tagging and recapture, of tagged individuals ranged between 2 and 1007 days. All the recaptures (93%, n = 27) occurred within 60 km from the original tagging site. Only four specimens were recaptured beyond this range, showing a movement between the Sicilian and Tunisian shelf (Figure 1). The distance from the tagging site seems to increase with days at liberty. Particularly, the tagged individual that travelled the longest distance (60 km) was recaptured after 2 years. The shortest distance (0.2 km) was recorded for an individual recaptured after 1 month from tagging. Growth increments of tagged and recaptured individuals of Mustelus spp. showed a rate of increment averaging 16.2 cm per year, with most of the records at 14–16 cm year per year (Table S2; Figure 5a), which was almost constant among individuals between 55 and 125 cm TL, with some outliers growing at a rate of 25–28 cm TL per year (Table S2; Figure 5b).

3.3. Age Estimation

Vertebrae were collected from 115 Mm (52 males and 63 females), ranging from 34 to 170 cm TL, and 62 Mp (27 males and 35 females), between 36.5–120 cm. The relationship between TL and VR was described by a polynomial function in both species and did not show significant differences between sexes either for Mm or Mp (ANCOVA, p > 0.05; Figure 6).
The vertebrae of both species showed a multiple pattern of translucent and opaque rings along the corpus calcareum. Translucent rings did not show a clear pattern of decreasing inter-ring distance from the first to the last ring as expected due to decreasing growth rate during ontogeny, thus indicating the likely occurrence of false check marks. To discriminate the latter and exclude them from our matrix of back-calculated length-at-ages, we used growth increments derived from tagged individuals as a guideline for aging (see material and method section). Ring interpretation based on growth rate of tagged and recaptured specimens returned a pattern with winter rings that alternate with false checks, i.e., two translucent rings lay down every year (Figure 7). As shown in Figure 7, false rings are not always observed between the winter rings, thus highlighting that they are not constantly laid down in all individuals and during growth.
The mean annual increase in growth derived from the two translucent rings hypothesis is very similar to the growth rate of the tagged individuals. The hypothesis of a translucent ring laid down per year results in a growth rate that is approximately half of that derived from tagging (Figure 8).
The two species showed significant interspecific differences in growth (p < 0.01), with Mm achieving a higher asymptotic length (L) and a lower growth coefficient (k) than Mp (Figure 8; Tables S3 and S4). The estimated VBGF were as follows:
Mm females: L = 209 cm TL; k = 0.11; t0 = −1.73; r2 = 0.985
Mm males: L = 206 cm TL; k = 0.10; t0 = −2.04; r2 = 0.97
Mp sex combined: L = 156 cm TL; k = 0.17; t0 = −1.41; r2 = 0.95 (Figure 9).
Mm females and males grow at a similar rate in the first years of life, with females attaining larger sizes at ages than males after age 4 (Figure 9). The maximum age found for Mm was 16 and 12 years for females and males, respectively. The low number of individuals sampled of Mp did not allow for estimating the growth curves by sex, and back-calculated length-at-ages were combined. The oldest Mp individual was a male of 8 years, whilst females were not found over 6 years old (Figure 9).

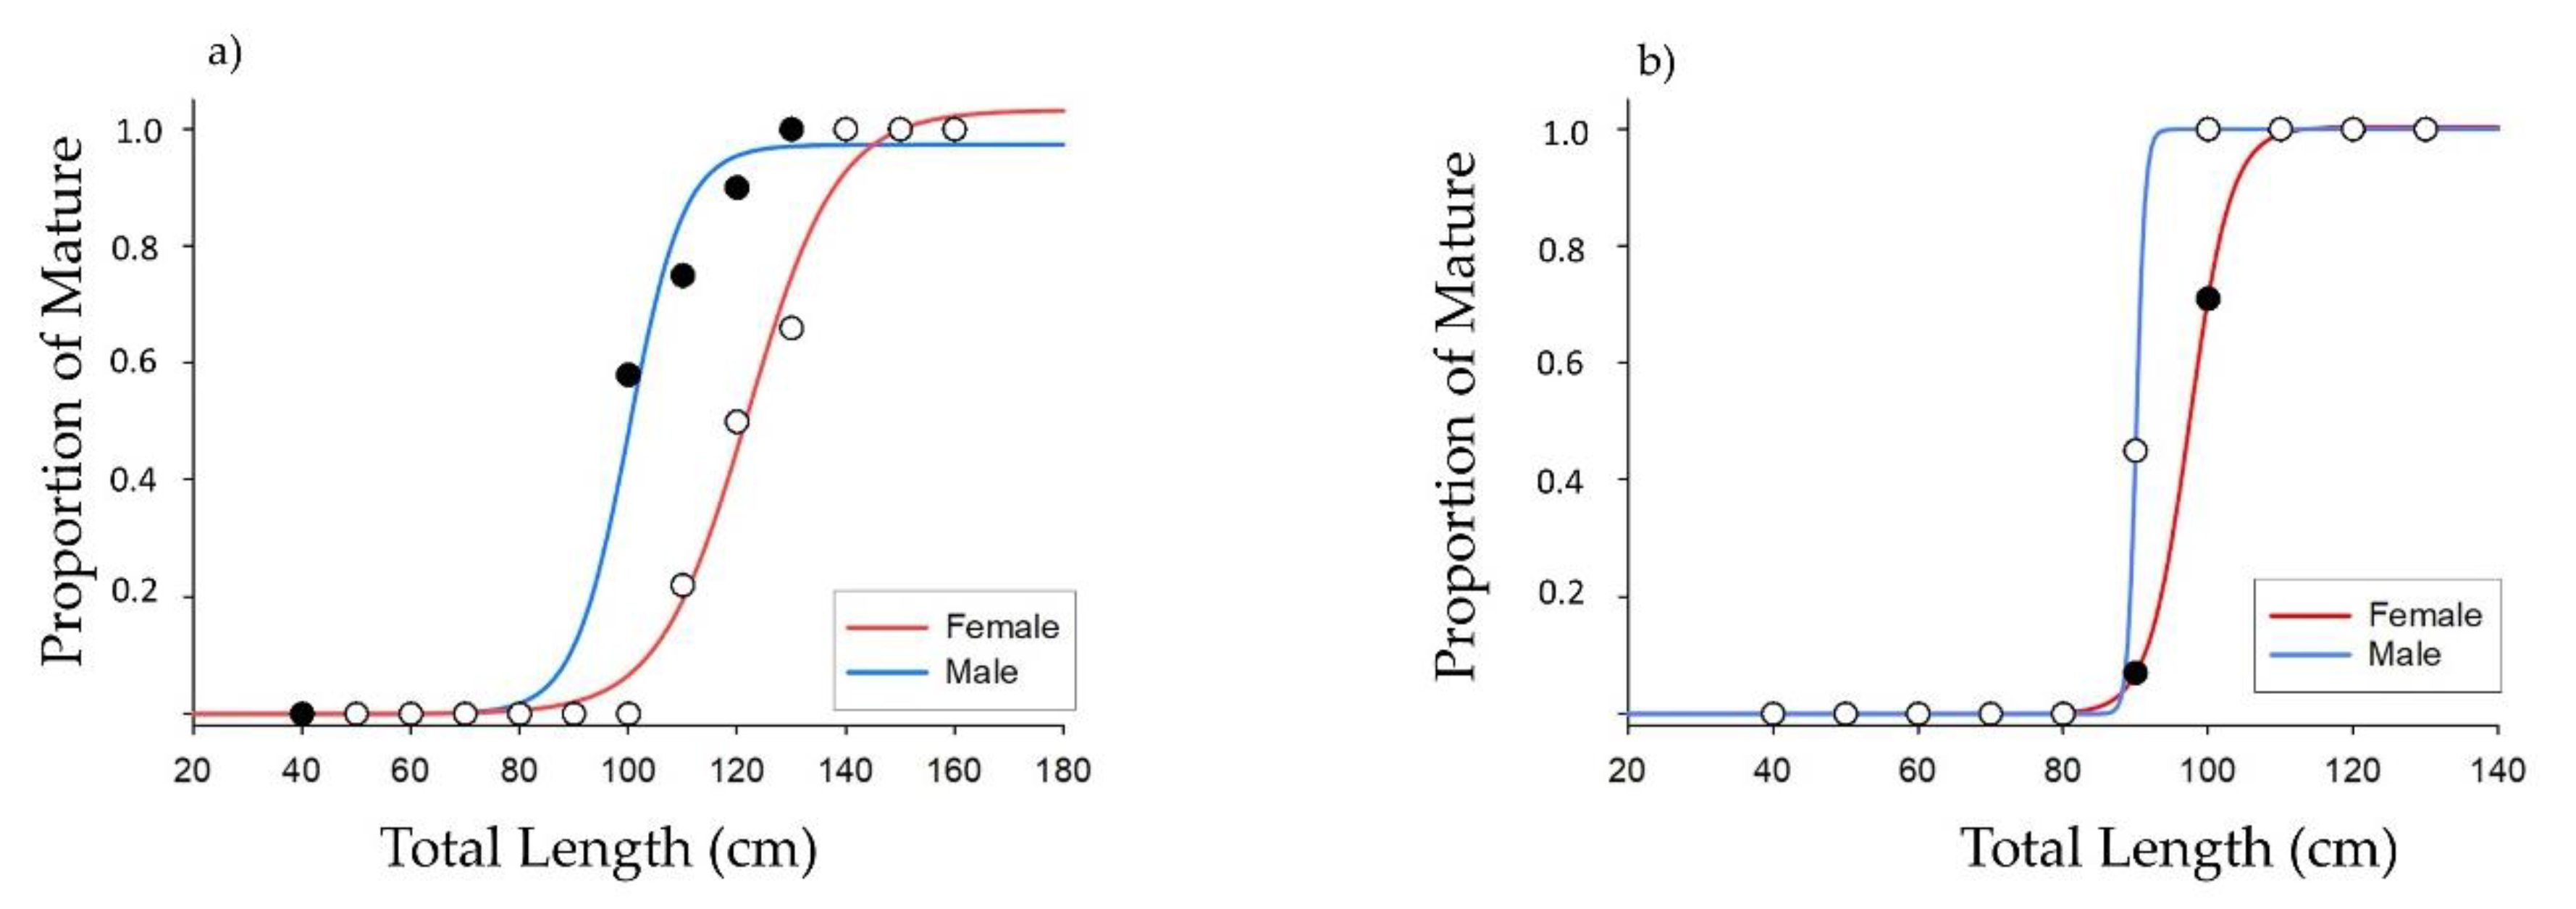
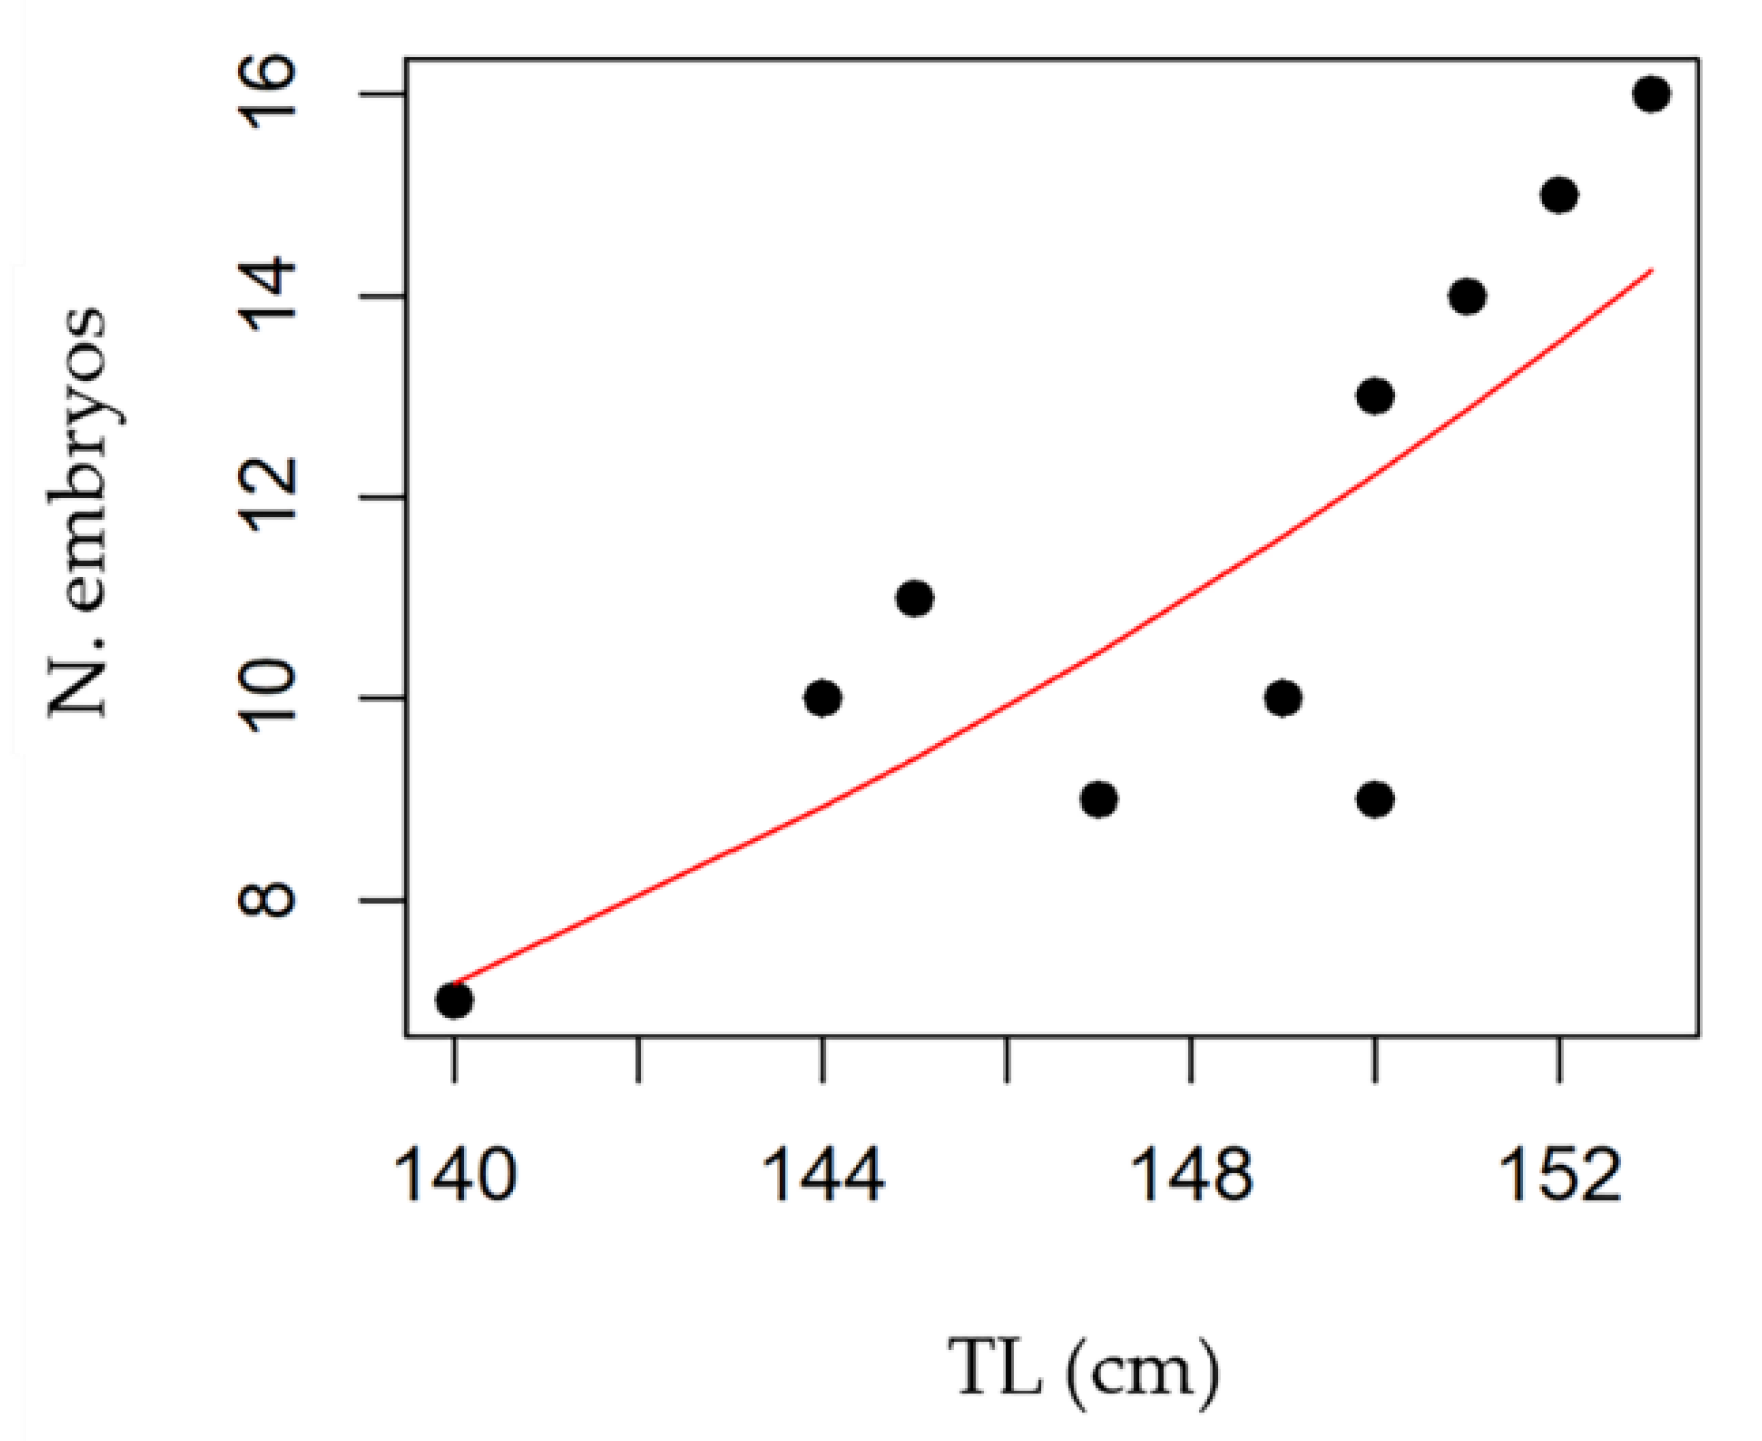
3.4. Maturity and Fecundity

Maturity data were collected for 209 Mm (117 females, 92 males) and 97 Mp (56 females, 41 males). The smallest mature female was 105 cm TL for Mm and 86 cm for Mp. Mature males were observed from 79 cm and 85 cm TL for Mm and Mp, respectively. Females attained maturity at larger sizes and ages than males (Figure 10). L50 of Mm was 111.5 cm TL (5 years) for females and 92.5 cm TL (4 years) for males. L50 of Mp was 92.5 cm TL (4 years) and 84.5 cm TL (3 years) for females and males, respectively (Figure 10).
Among the Mm mature females collected, 11 were pregnant with a mean (±SD) litter size of 10.5 ± 3.6. In total, there were 127 embryos (66 females, 61 males). The embryos ranged in size from 120–190 mm in October–November to 32–42 cm in May–June for full-term embryos. Late spring can be therefore assumed as a parturition period. The embryo sex ratio did not differ significantly from 1:1 (χ2 = 0.019, d.f. = 1, p = 0.94). The results of the relationship between length and fecundity (f = n. embryos) of Mm was significant (power function: f = 2e−16TL7.73 (R2 = 0.62, p < 0.001), with the number of embryos increasing from 7 to 17 for females between 140 and 152 cm TL (Figure 11).
Maturity data on Mp were scanty. Only three collected Mp females (96–99.5 cm TL) were pregnant at the beginning of the gestation period (November), respectively with 1, 11, and 18 embryos of 12–14 cm TL body size. It is likely that the female with only 1 embryo had a miscarriage due to the stress during capture. It was therefore not possible to estimate the length of the newborn.

4. Discussion

In this study we have provided new knowledge on the life history traits of two threatened smooth-hounds species, Musteus mustelus and M. punctulatus, in the central Mediterranean Sea. In particular, using data from a tagging survey, we have shown that the smooth-hounds grow at a faster rate than assumed in other studies based on vertebral age readings only [24,25,29]. Growth increments of tagged and recaptured smooth-hounds’ individuals in the size range between 50 and 130 cm total length indicated annual increments between 8 and 28 cm per year, 16.2 cm per year on average, more or less double than those obtained from the reading of vertebrae assuming the deposition of only one translucent ring every year. The occurrence of fast-growing individuals could be due to difference in growth rate between the two species or among individuals of the same species. Differences in growth rates are quite common and may depend on food availability, temperature, and other factors varying according to the areas inhabited [46]. Tagging data, although available for the two species combined (i.e., Mustelus spp.), because they are very difficult to discriminate in the field, support the hypothesis that at least one false check mark is laid down before or after the deposition of the winter ring. The occurrence of false check mark was demonstrated for Mm in South African waters using micro-computed tomography [32].
In the case of smooth-hounds of the Strait of Sicily, most of the recaptured individuals, and in particular those spending more than one year at liberty, showed a rate of increase higher than the one assumed in past studies. We can reasonably assume that our tagging dataset of growth increment was made up by both species, given that their abundance in the study area is similar and they are often landed together in mixed boxes by local fishing vessels [34].
Age analysis showed that Mm reaches larger sizes than Mp and lives longer. Overall, the maximum sizes of both smooth-hound species observed in this study were in line with those observed in other Mediterranean areas, confirming that adults Mm reach bigger sizes-at-ages than Mp (Table 1). The oldest individuals found in our study were a 16 years old (170 cm TL) Mm female and 8 years old (120 cm TL) Mp male, thus indicating longevities less extended than assumed in previous studies carried out in the Mediterranean region, where the maximum age reported was over 25 years in Mm [25,29] and 19 years in Mp [24]. Similar to our study, Da Silva et al. [32], in South African waters accounting for false check marks in vertebral centra, found that the maximum age of Mm along the South African coasts was 13 years for both females (190 cm TL) and males (112 cm TL). This was almost half of the maximum age estimated from a previous study in South Africa, where false check marks on vertebrae were interpreted as true winter rings [31]. Our estimates of growth and longevity of the two Mediterranean smooth-hounds are also coherent with the patterns in life-history traits found for other smooth-hound species. For most of the species belonging to the genus Mustelus, the longevity seems to be between 10 and 20 years: 16 years: Mustelus antarcticus [47], M. canis [48], and M. walkeri [49]; 13 years: M. asterias [50] and M. henlei [51], and 12 years: M. lenticulatus [52]; 11 years M. schmitti [53]; 9 years: M. californicus [51] and M. manazo [54]. According to these findings, smooth-hounds cannot be considered long-living species as other Carchariniformes [55], and this, along with a rather fast growth, can be the main reason explaining the existence of productive fisheries exploiting these meso-predatory sharks in several marine areas (e.g., [56,57,58]).
Lengths-at-maturity data of the two species in South of Sicily seem to support the occurrence of geographical differences likely linked to a latitudinal pattern of increasing size at maturity from south to north [22]. L50 values were smaller in South of Sicily, Tunisia (Mm: males: 97.1 cm, females: 117.2 cm, [20]; Mp: males: 81.4 cm, females: 95.6 cm, [21]), and Turkey (Mm males: 92 cm, females: 109 cm [25]) than in the Adriatic Sea (Mm: males: 108.1 cm, females: 121.2 cm; Mp: males: 91.3 cm, females: 109.9 cm [22]). Latitudinal patterns of maximum size and size at maturity were reported in general for several marine fish [59] and also observed in other smooth-hound species (M. manazo, [60]) and described in the small-spotted catshark, Scyliorhinus canicula [61].
As commonly observed in smooth-hounds, fecundity of Mm increased with size with a maximum observed number of 17 embryos in a female of 154 cm TL. A similar pattern was found in Tunisia [20] and Adriatic Sea [22]. Mp has a higher fecundity (7–35 embryos, [22]; 12–27 embryos, [21]) and the newborns are smaller (24–30.5 cm [21]) than in Mm. In this latter species we found sizes at birth ranging between 32 and 42 cm TL, supporting the data reported in Tunisian waters [20] and similar to the minimum size of the specimens collected in this study during late spring.
The observed body size of Mm embryos increased between October and June, while the only two pregnant Mp females found in November were at the beginning of the gestation period. This trend is in agreement with past studies, highlighting a gestation period of 11–12 months and parturition in April–May for both species [20,21,22].
Tagging data provided some new insights about the movement patterns and site fidelity of Mustelus spp. in the central Mediterranean region. All the tagged sharks showed localized movements, with the majority of individuals recaptured less than 60 km from their original release sites. Although our tagging approach did not allow us to monitor the movement patterns during the days at liberty, our results indicate that the tagged individuals of Mustelus spp. had high site fidelity, in line with the results of a recently published study on the movements of Mm in South Africa [62]. This behavior might determine the existence of multiple quite isolated stocks with low interconnectivity. The site fidelity of this species may be related to their philopatric behavior; in fact, smooth-hound’ individuals show a residency and site fidelity behavior, at least for females, which, even if able to disperse over long distances, return preferentially to key reproductive areas [62,63,64,65,66,67]. In the case of Mm and Mp there is still a lack of knowledge on their population structure and connectivity patterns in the Mediterranean Sea, although the existence of very specialized local fisheries exploiting mating aggregations and pregnant females might be indirect evidence of the occurrence of groups of individuals belonging to specific localities, rather than to large mixed stocks [10]. To bridge this knowledge gap, further studies are required to understand population connectivity in relation to the existence of aggregation sites of the species (e.g., mating and parturition areas), site fidelity, and dispersal behavior. Understanding habitat-use and movements of smooth-hounds across their distribution area would be crucial to implement spatial conservation strategies to protect individuals when they aggregate and are more vulnerable to fishing exploitation.
During the last century, Mm and Mp have dramatically been overexploited in the Mediterranean Sea, although mostly caught as by-catch by trawlers and artisanal fishing vessels, causing a drastic reduction in both their distribution and abundance [10,11]. The estimates of Mm and Mp growth, age at maturity, and longevity obtained in our study could lead to a more optimistic vision about the resilience of smooth-hounds’ populations to fishing exploitation. However, the ongoing decline of the two species in the Strait of Sicily, as in the rest of the Mediterranean Sea, is a clear wake-up call about the sustainability of the ongoing exploitation pattern, indicating the need for the adoption of a conservation strategy aimed at population rebuilding. Unfortunately, no management measures have been developed to date to mitigate the impact of fishing on smooth-hounds, including minimum landing size. Restriction of fishing activities should be designed to protect spawning aggregations and areas where pregnant females concentrate for parturition. The reduction of fishing mortality on spawners, in combination with the protection of the newborn and their recruitment habitats, could increase population resilience to fishing exploitation [68]. It has been shown that successful fishery could occur when fishing mortality is minimized for older sharks, as they can maintain high levels of recruitment [69,70]. For this purpose, it would be important to elucidate the spatial distribution patterns of the two species in the region in relation to parturition and mating areas. This body of knowledge could also be advantaged from the local ecological knowledge of fishers to make the decision-making process more robust [11,16]. Stakeholder involvement in co-management is indeed considered determinant to share responsibility in shark conservation, making the regulations more legitimate for the fishing sector and therefore improving the likelihood of compliance with the rules [70,71]. From a species conservation perspective, the new data on growth, longevity, maturity, and spatial dynamics of smooth-hounds in the Strait of Sicily provided in this study can be relevant to better assess the impact of fishing on populations and support the adoption of a sound management plan.

Supplementary Materials

The following supporting information can be downloaded at: https://www.mdpi.com/article/10.3390/jmse10111647/s1, Table S1: Tagged individuals of M. mustelus in the South of Sicily. Samples are sorted by time at liberty. Information includes: tag codes; released and recapture dates; fish total length and sex. The bold rows indicate individuals recaptured twice. Table S2: Comparison of annual growth estimates (cm) obtained from vertebrae of M. mustelus and tagged individuals of Mustelus spp. Data are listed for different size classes. SD = Standard deviation; Table S3: Mean back-calculated length-at-age (cm) for combined sexes of M. mustelus and M. punctulatus. SD = Standard deviation; Table S4: Summary of estimated growth parameters of M. mustelus and M. punctulatus in the South of Sicily. SD = Standard deviation.

Author Contributions

Conceptualization, M.D.L. and F.C.; methodology, M.D.L., S.G. and F.C.; validation, M.D.L., F.C. and G.B.P.; formal analysis, G.B.P., M.D.L. and F.C.; investigation, M.D.L. and F.C.; data curation, M.D.L., G.B.P. and S.R.; writing—original draft preparation, M.D.L. and G.B.P.; writing—review and editing, G.B.P., M.D.L., S.R., S.G., C.M. and F.C.; funding acquisition, F.C. All authors have read and agreed to the published version of the manuscript.

Funding

This research was funded by RitMare National Flag Project (Italy, Ministry of University and Research) and Italian National Programme on Halieutic Data Collection (PNRDA).

Institutional Review Board Statement

All procedures carried out were approved by the international authorities (EU/DG Mare, FAO/GFCM). All specimen and methods were caught and performed in accordance with the relevant guidelines and regulations. In the cases the animal was alive when it arrived on the vessel during the scientific survey (MEDITS-DCF, EU Reg. 199/2008), it was suppressed in compliance with the recommendation of Decree Law n. 26 of 4 March 2014. All efforts were made to minimize suffering.

Informed Consent Statement

Not applicable.

Data Availability Statement

Data are available upon a formal request to the lead author.

Acknowledgments

We are very grateful to all of the fishermen who helped us collect Mustelus specimens and conduct the tagging experiment.

Conflicts of Interest

The authors declare no conflict of interest.

References

  1. McCauley, D.J.; Pinsky, M.L.; Palumbi, S.R.; Estes, J.A.; Joyce, F.H.; Warner, R.R. Marine defaunation: Animal loss in the global ocean. Science 2015, 347, 1255641. [Google Scholar] [CrossRef] [PubMed] [Green Version]
  2. Myers, R.A.; Worm, B. Rapid worldwide depletion of predatory fish communities. Nature 2003, 423, 280–283. [Google Scholar] [CrossRef] [PubMed]
  3. Pacoureau, N.; Rigby, C.L.; Kyne, P.M.; Sherley, R.B.; Winker, H.; Carlson, J.K.; Fordham, S.V.; Barreto, R.; Fernando, D.; Francis, M.P.; et al. Half a century of global decline in oceanic sharks and rays. Nature 2021, 589, 567–571. [Google Scholar] [CrossRef] [PubMed]
  4. Baum, J.K.; Myers, R.A.; Kehler, D.G.; Worm, B.; Harley, S.J.; Doherty, P.A. Collapse and conservation of shark populations in the Northwest Atlantic. Science 2003, 299, 389–392. [Google Scholar] [CrossRef]
  5. Baum, J.K.; Myers, R.A. Shifting baselines and the decline of pelagic sharks in the Gulf of Mexico. Ecol. Lett. 2004, 7, 135–145. [Google Scholar] [CrossRef]
  6. Shepherd, T.D.; Myers, R.A. Direct and indirect fishery effects on small coastal elasmobranchs in the northern Gulf of Mexico. Ecol. Lett. 2005, 8, 1095–1104. [Google Scholar] [CrossRef]
  7. Dulvy, N.K.; Pacoureau, N.; Rigby, C.L.; Pollom, R.A.; Jabado, R.W.; Ebert, D.A.; Finucci, B.; Pollock, C.M.; Cheok, J.; Derrick, D.H.; et al. Overfishing drives over one-third of all sharks and rays toward a global extinction crisis. Curr. Biol. 2021, 31, 4773–4787. [Google Scholar] [CrossRef]
  8. Maynou, F.; Sbrana, M.; Sartor, P.; Maravelias, C.; Kavadas, S.; Damalas, D.; Cartes, J.E.; Osio, G. Estimating Trends of Population Decline in Long-Lived Marine Species in the Mediterranean Sea Based on Fishers’ Perceptions. PLoS ONE 2011, 6, e21818. [Google Scholar] [CrossRef] [Green Version]
  9. Ferretti, F.; Myers, R.A.; Serena, F.; Lotze, H.K. Loss of Large Predatory Sharks from the Mediterranean Sea. Conserv. Biol. 2008, 22, 952–964. [Google Scholar] [CrossRef]
  10. Colloca, F.; Enea, M.; Ragonese, S.; Di Lorenzo, M. A century of fishery data documenting the collapse of smooth-hounds (Mustelus spp.) in the Mediterranean Sea. Aquat. Conserv. Mar. Freshw. Ecosyst. 2017, 27, 1145–1155. [Google Scholar] [CrossRef]
  11. Colloca, F.; Carrozzi, V.; Simonetti, A.; Di Lorenzo, M. Using Local Ecological Knowledge of Fishers to Reconstruct Abundance Trends of Elasmobranch Populations in the Strait of Sicily. Front. Mar. Sci. 2020, 7, 508. [Google Scholar] [CrossRef]
  12. Di Lorenzo, M.; Calò, A.; Di Franco, A.; Milisenda, G.; Aglieri, G.; Cattano, C.; Milazzo, M.; Guidetti, P. Small-scale fisheries catch more threatened elasmobranchs inside partially protected areas than in unprotected areas. Nat. Commun. 2022, 13, 4381. [Google Scholar] [CrossRef] [PubMed]
  13. Dulvy, N.K.; Allen, D.J.; Ralph, G.M.; Walls, R.H.L. The Conservation Status of Sharks, Rays, and Chimaeras in the Mediterranean Sea; IUCN: Malaga, Spain, 2016; p. 236. [Google Scholar] [CrossRef]
  14. Carpentieri, P.; Nastasi, A.; Sessa, M.; Srour, A. Incidental Catch of Vulnerable Species in Mediterranean and Black Sea fisheries—A Review; Studies and Reviews No. 100; General Fisheries Commission for the Mediterranean: Rome, Italy, 2021; p. 317. [Google Scholar] [CrossRef]
  15. Follesa, M.C.; Marongiu, M.F.; Zupa, W.; Bellodi, A.; Cau, A.; Cannas, R.; Colloca, F.; Djurovic, M.; Isajlovic, I.; Jadaud, A.; et al. Spatial variability of Chondrichthyes in the northern Mediterranean. Sci. Mar. 2019, 83, 81–100. [Google Scholar] [CrossRef] [Green Version]
  16. Barbato, M.; Barría, C.; Bellodi, A.; Bonanomi, S.; Borme, D.; Ćetković, I.; Colloca, F.; Colmenero, A.I.; Crocetta, F.; De Carlo, F.; et al. The use of fishers’ Local Ecological Knowledge to reconstruct fish behavioural traits and fishers’ perception of conservation relevance of elasmobranchs in the Mediterranean Sea. Mediterr. Mar. Sci. 2021, 22, 603–622. [Google Scholar] [CrossRef]
  17. Farrell, E.D.; Clarke, M.W.; Mariani, S. A simple genetic identification method for Northeast Atlantic smoothhound sharks (Mustelus spp.). ICES J. Mar. Sci. 2009, 66, 561–565. [Google Scholar] [CrossRef]
  18. Marino, I.A.M.; Finotto, L.; Colloca, F.; Di Lorenzo, M.; Gristina, M.; Farrell, E.D.; Zane, L.; Mazzoldi, C. Resolving the ambiguities in the identification of two smooth-hound sharks (Mustelus mustelus and Mustelus punctulatus) using genetics and morphology. Mar. Biodivers. 2017, 48, 1551–1562. [Google Scholar] [CrossRef]
  19. Capapé, C.; Quignard, J.P. Contribution a la biologie des Triakidae des cotes tunisiennes. I. Mustelus mediterraneus Quignard et Capape, 1972, répartition géographique et bathymétrique, migrations et déplacements, reproduction, fécondite. Bull. Off. Nat. Peches Tunis. 1977, 1, 173–179. [Google Scholar]
  20. Saïdi, B.; Bradaï, M.N.; Bouaïn, A. Reproductive biology of the smooth-hound shark Mustelus mustelus (L.) in the Gulf of Gabès (south-central Mediterranean Sea). J. Fish Biol. 2008, 72, 1343–1354. [Google Scholar] [CrossRef]
  21. Saïdi, B.; Bradaï, M.N.; Bouaïn, A. Reproductive biology and diet of Mustelus punctulatus (Risso, 1826) (Chondrichthyes: Triakidae) from the Gulf of Gabès, central Mediterranean Sea. Sci. Mar. 2009, 73, 249–258. [Google Scholar] [CrossRef]
  22. Riginella, E.; Correale, V.; Marino, I.A.M.; Rasotto, M.B.; Vrbatovic, A.; Zane, L.; Mazzoldi, C. Contrasting life-history traits of two sympatric smooth-hound species: Implication for vulnerability. J. Fish Biol. 2020, 96, 853–857. [Google Scholar] [CrossRef]
  23. Costantini, M.; Bernardini, M.; Cordone, P.; Guilianini, P.G.; Orel, G. Observations on fishery, feeding habits and reproductive biology of Mustelus mustelus (Chondrichtyes, Triakidae) in Northern Adriatic Sea. Biol. Mar. Medit. 2000, 7, 427–432. [Google Scholar]
  24. Gračan, R.; Polak, T.; Lazar, B. Life history traits of the Blackspotted smooth-hound Mustelus punctulatus (Carcharhiniformes: Triakidae) in the Adriatic Sea. Nat. Croat. 2021, 30, 475–492. [Google Scholar] [CrossRef]
  25. Ozcan, E.; Basusta, N. Preliminary study on age, growth and reproduction of Mustelus mustelus (Elasmobranchii: Carcharhiniformes: Triakidae) inhabiting the Gulf of Iskenderun, north-eastern Mediterranean Sea. Acta Ichthyol. Piscat. 2018, 48, 27–36. [Google Scholar] [CrossRef] [Green Version]
  26. Saïdi, B.; Enajjar, S.; Bradaï, M.N.; Bouaïn, A. Diet composition of smooth-hound shark, Mustelus mustelus (Linnaeus, 1758), in the Gulf of Gabès, southern Tunisia. J. Appl. Ichthyol. 2009, 25, 113–118. [Google Scholar] [CrossRef]
  27. Jardas, I.; Šantić, M.; Nerlović, V.; Pallaoro, A. Diet composition of blackspotted smooth-hound, Mustelus punctulatus (Risso, 1826), in the eastern Adriatic Sea. J. Appl. Ichthyol. 2007, 23, 279–281. [Google Scholar] [CrossRef]
  28. Di Lorenzo, M.; Vizzini, S.; Signa, G.; Andolina, C.; Palo, G.B.; Gristina, M.; Mazzoldi, C.; Colloca, F. Ontogenetic trophic segregation between two threatened smooth-hound sharks in the Central Mediterranean Sea. Sci. Rep. 2020, 10, 11011. [Google Scholar] [CrossRef]
  29. Kara, A.F.; Al Hajaji, M.; Ghmati, H.; Shakman, E.A. Growth & Reproduction of Mustelus mustelus (Chondrichthyes: Triakidae) in the south Mediterranean (Libyan coast). Libyan J. Ecol. Env. Sci. Tech. 2019, 1, 31–38. [Google Scholar]
  30. Goosen, A.J.J.; Smale, M.J. A preliminary study of age and growth of the smoothhound shark Mustelus mustelus (Triakidae). S. Afr. J. Mar. Sci. 1997, 18, 85–91. [Google Scholar] [CrossRef] [Green Version]
  31. Smale, M.J.; Compagno, L.J.V. Life history and diet of two southern African smoothhound sharks, Mustelus mustelus (Linnaeus, 1758) and Mustelus palumbes Smith, 1957 (Pisces: Triakidae). Afr. J. Mar. Sci. 1997, 18, 229–248. [Google Scholar] [CrossRef]
  32. da Silva, C.; Attwood, C.G.; Wintner, S.P.; Wilke, C.G.; Winker, H.; Smale, M.J.; Kerwath, S.E. Life history of Mustelus mustelus in the Langebaan Lagoon marine protected area. Mar. Freshw. Res. 2021, 72, 1142–1159. [Google Scholar] [CrossRef]
  33. Di Lorenzo, M.; Sinerchia, M.; Colloca, F. The North sector of the Strait of Sicily: A priority area for conservation in the Mediterranean Sea. Hydrobiologia 2018, 821, 235–253. [Google Scholar] [CrossRef]
  34. Falsone, F.; Scannella, D.; Geraci, M.; Vitale, S.; Colloca, F.; Di Maio, F.; Milisenda, G.; Gancitano, V.; Bono, G.; Fiorentino, F. Identification and characterization of trammel net métiers: A case study from the southwestern Sicily (Central Mediterranean). Reg. Stud. Mar. Sci. 2020, 39, 101419. [Google Scholar] [CrossRef]
  35. Jorgensen, S.; Micheli, F.; White, T.; Van Houtan, K.; Alfaro-Shigueto, J.; Andrzejaczek, S.; Arnoldi, N.; Baum, J.; Block, B.; Britten, G.; et al. Emergent research and priorities for shark and ray conservation. Endanger. Species Res. 2022, 47, 171–203. [Google Scholar] [CrossRef]
  36. Ragonese, S.; Vitale, S.; Dimech, M.; Mazzola, S. Abundances of demersal sharks and chimaera from 1994-2009 scientific surveys in the Central Mediterranean Sea. PLoS ONE 2013, 8, e74865. [Google Scholar] [CrossRef] [PubMed] [Green Version]
  37. Lauria, V.; Gristina, M.; Attrill, M.J.; Fiorentino, F.; Garofalo, G. Predictive habitat suitability models to aid conservation of elasmobranch diversity in the central Mediterranean Sea. Sci. Rep. 2015, 5, 13245. [Google Scholar] [CrossRef] [Green Version]
  38. Cailliet, G.M.; Smith, W.D.; Mollet, H.F.; Goldman, K.J. Age and growth studies of chondrichthyan fishes: The need for consistency in terminology, verification, validation, and growth function fitting. J. Appl. Phycol. 2006, 77, 211–228. [Google Scholar] [CrossRef]
  39. Goldman, K.J. Age and Growth of Elasmobranch Fishes. In Elasmobranch Fisheries Management Techniques; Musick, J.A., Bonfil, R., Eds.; APEC Fisheries Working Group: Singapore, 2004; pp. 97–132. ISBN 981-04-9682-6. [Google Scholar]
  40. Campana, S.E. Age Determination of Elasmobranchs with Special Reference to Mediterranean Species: A Technical Manual; FAO-GFCM: Rome, Italy, 2014; Studies and Review; Volume 94, ISBN 9789251083208. [Google Scholar]
  41. Cailliet, G.M.; Goldman, K.J. Age determination and validation in chondrichthyan fishes. In Biology of Sharks and Their Rela-Tives; Carrier, J.C., Musick, J.A., Heithaus, M.R., Eds.; CRC Press: Boca Raton, FL, USA, 2004; pp. 399–447. [Google Scholar]
  42. Campana, S.E. How Reliable are Growth Back-Calculations Based on Otoliths? Can. J. Fish. Aquat. Sci. 1990, 47, 2219–2227. [Google Scholar] [CrossRef]
  43. Ogle, D.; Wheeler, P.; Dinno, A. Package ‘FSA’. R Package Version 0.8.31. 2020. Available online: https://cran.r-project.org/web/packages/FSA/index.html (accessed on 10 July 2022).
  44. Nelson, G.A. Package ‘Fishmethods‘: Fishery Science Methods and Models. R Package Version 1.11-3. 2022. Available online: https://cran.r-project.org/web/packages/fishmethods/fishmethods.pdf (accessed on 15 February 2022).
  45. Conrath, C.L.; Musick, J.A. Reproductive biology of the smooth dogfish, Mustelus canis, in the Northwest Atlantic Ocean. Environ. Biol. Fishes 2002, 64, 367–377. [Google Scholar] [CrossRef]
  46. Hutchings, J. A Life Histories of Fish. In Handbook of Fish Biology and Fisheries; Hart, P.J.B., Reynolds, D., Eds.; Blackwell Science Ltd.: Oxford, UK, 2002; Volume 1, pp. 149–174. [Google Scholar]
  47. Moulton, P.; Walker, T.; Saddlier, S. Age and growth studies of Gummy Shark, Mustelus antarcticus Gunther, and School Shark, Galeorhinus galeus (Linnaeus), from Southern Australian Waters. Mar. Freshw. Res. 1992, 43, 1241–1267. [Google Scholar] [CrossRef]
  48. Conrath, C.L.; Gelsleichter, J.; Musick, J.A. Age and growth of the smooth dogfish (Mustelus canis) in the northwest Atlantic Ocean. Fish. Bull. 2002, 100, 674–682. [Google Scholar]
  49. Rigby, C.L.; White, W.T.; Smart, J.J.; Simpfendorfer, C.A. Life histories of two deep-water Australian endemic elasmobranchs: Argus skate Dipturus polyommata and eastern spotted gummy shark Mustelus walkeri. J. Fish Biol. 2016, 88, 1149–1174. [Google Scholar] [CrossRef] [PubMed]
  50. Farrell, E.D.; Mariani, S.; Clarke, M.W. Age and growth estimates for the starry smoothhound (Mustelus asterias) in the Northeast Atlantic Ocean. ICES J. Mar. Sci. 2010, 67, 931–939. [Google Scholar] [CrossRef]
  51. Yudin, K.G.; Cailliet, G.M. Age and growth of the gray smoothhound, Mustelus californicus, and the brown smoothhound, M. henlei, sharks from central California. Copeia 1990, 191–204. [Google Scholar] [CrossRef]
  52. Francis, M.; Francis, R. Growth rate estimates for New Zealand Rig (Mustelus lenticulatus). Mar. Freshw. Res. 1992, 43, 1157–1176. [Google Scholar] [CrossRef]
  53. Molina, J.M.; Blasina, G.E.; Cazorla, A.C.L. Age and growth of the highly exploited narrownose smooth-hound (Mustelus schmitti) (Pisces: Elasmobranchii). Fish. Bull. 2017, 115, 365–379. [Google Scholar] [CrossRef] [Green Version]
  54. Tanaka, S.; Mizue, K. Studies on sharks—XV. Age and growth of Japanese dogfish Mustelus manazo Bleeker in the East China Sea. Bull. Jap. Soc. Sci. Fish 1979, 45, 43–50. [Google Scholar] [CrossRef] [Green Version]
  55. Cortés, E. Life history patterns and correlations in sharks. Rev. Fish. Sci. 2000, 8, 299–344. [Google Scholar] [CrossRef]
  56. Walker, T. Fishery simulation model for sharks applied to the Gummy Shark, Mustelus antarcticus Gunther, from Southern Australian waters. Mar. Freshw. Res. 1992, 43, 195–212. [Google Scholar] [CrossRef]
  57. Colautti, D.; Baigun, C.; Cazorla, A.L.; Llompart, F.; Molina, J.M.; Suquele, P.; Calvo, S. Population biology and fishery characteristics of the smooth-hound Mustelus schmitti in Anegada Bay, Argentina. Fish. Res. 2010, 106, 351–357. [Google Scholar] [CrossRef]
  58. Bitalo, D.N.; Maduna, S.N.; da Silva, C.; Roodt-Wilding, R.; der Merwe, A.E.B.-V. Differential gene flow patterns for two commercially exploited shark species, tope (Galeorhinus galeus) and common smoothhound (Mustelus mustelus) along the south–west coast of South Africa. Fish. Res. 2015, 172, 190–196. [Google Scholar] [CrossRef]
  59. Fisher, J.; Frank, K.; Leggett, W. Global variation in marine fish body size and its role in biodiversity–ecosystem functioning. Mar. Ecol. Prog. Ser. 2010, 405, 1–13. [Google Scholar] [CrossRef] [Green Version]
  60. Yamaguchi, A.; Taniuchi, T.; Shimizu, M. Geographic Variation in Growth of the Starspotted Dogfish Mustelus manazo from Five Localities in Japan and Taiwan. Fish. Sci. 1998, 64, 732–739. [Google Scholar] [CrossRef]
  61. Finotto, L.; Gristina, M.; Garofalo, G.; Riginella, E.; Mazzoldi, C. Contrasting life history and reproductive traits in two populations of Scyliorhinus canicula. Mar. Biol. 2015, 162, 1175–1186. [Google Scholar] [CrossRef]
  62. Klein, J.D.; Asbury, T.A.; da Silva, C.; Hull, K.L.; Dicken, M.L.; Gennari, E.; Maduna, S.N.; der Merwe, A.E.B. Site fidelity and shallow genetic structure in the common smooth-hound shark Mustelus mustelus confirmed by tag-recapture and genetic data. J. Fish Biol. 2021, 100, 134–149. [Google Scholar] [CrossRef] [PubMed]
  63. Brevé, N.W.P.; Winter, H.V.; Wijmans, P.A.D.M.; Greenway, E.S.I.; Nagelkerke, L.A.J. Sex differentiation in seasonal distribution of the starry smooth-hound Mustelus asterias. J. Fish Biol. 2020, 97, 1870–1875. [Google Scholar] [CrossRef]
  64. Brevé, N.W.P.; Winter, H.V.; Van Overzee, H.M.J.; Farrell, E.D.; Walker, P.A. Seasonal migration of the starry smooth-hound shark Mustelus asterias as revealed from tag-recapture data of an angler-led tagging programme. J. Fish Biol. 2016, 89, 1158–1177. [Google Scholar] [CrossRef]
  65. Chapman, D.D.; Feldheim, K.A.; Papastamatiou, Y.P.; Hueter, R.E. There and Back Again: A Review of Residency and Return Migrations in Sharks, with Implications for Population Structure and Management. Annu. Rev. Mar. Sci. 2015, 7, 547–570. [Google Scholar] [CrossRef]
  66. Sandoval-Castillo, J.; Beheregaray, L. Metapopulation structure informs conservation management in a heavily exploited coastal shark (Mustelus henlei). Mar. Ecol. Prog. Ser. 2015, 533, 191–203. [Google Scholar] [CrossRef] [Green Version]
  67. Hueter, R.E.; Mann, D.E.; Maruska, K.P.; Sisneros, J.A.; Demski, L.S. Sensory biology of elasmobranchs. In Biology of Sharks and Their Relatives; Carrier, J.C., Musick, J.A., Heithaus, M.R., Eds.; CRC Press: Boca Raton, FL, USA, 2004; pp. 325–368. [Google Scholar]
  68. Sacchi, J. Overview of Mitigation Measures to Reduce the Incidental Catch of Vulnerable Species in Fisheries; Studies and Reviews No. 100; General Fisheries Commission for the Mediterranean: Rome, Italy, 2021. [Google Scholar] [CrossRef]
  69. Simpfendorfer, C.A. Demographic analysis of the dusky shark fishery in southwestern Australia. In Life in the Slow Lane: Ecology and Conservation of Long Lived Marine Animals; Musick, J.A., Ed.; American Fishery Society Symposium: Bethesda, MD, USA, 1999; pp. 149–160. [Google Scholar]
  70. Prince, J.D. Gauntlet Fisheries for Elasmobranchs—the Secret of Sustainable Shark Fisheries. J. Northwest Atl. Fish. Sci. 2005, 35, 407–416. [Google Scholar] [CrossRef]
  71. Stöhr, C.; Lundholm, C.; Crona, B.; Chabay, I. Stakeholder participation and sustainable fisheries: An integrative framework for assessing adaptive comanagement processes. Ecol. Soc. 2014, 19, 14. [Google Scholar] [CrossRef]
Figure 1. Map of the Strait of Sicily showing locations where both species of smooth-hounds were tagged (pink dots) and recaptured once (yellow dots) or twice (blue dots). Numbers refer to tagged individuals. For details, see Table S1.
Jmse 10 01647 g001
Figure 2. Sagittal sections from a female M. mustelus, 153.5 cm TL showing the alternation of opaque and translucent rings.
Jmse 10 01647 g002
Figure 3. Length frequency distributions by sex of Mm (n = 232) and Mp (n = 97) collected in SW Sicily.
Jmse 10 01647 g003
Figure 4. Length–weight relationship of Mustelus mustelus and M. punctulatus (sex combined by species) from the SW coast of Sicily.
Jmse 10 01647 g004
Figure 5. Growth trajectories of Mustelus spp. Individuals tagged along the SW coast of Sicily: (a) frequency distribution of growth increments data (cm/year); (b) relationship between time spent at sea and total length of tagged and recaptured individuals. Colored lines represent the growth trajectories of single individuals.
Jmse 10 01647 g005
Figure 6. Relationship between vertebra radius (VR) and total length (TL) for males and females of M. mustelus (a) and M. punctulatus (b) from the SW coast of Sicily.
Jmse 10 01647 g006
Figure 7. Back-calculated length distributions corresponding to translucent vertebral centra measurements of the first four years of life of M. mustelus from the South of Sicily. Blue bars: true winter rings; red bars: false rings.
Jmse 10 01647 g007
Figure 8. Box-plots of annual growth increments of M. mustelus individuals obtained from back-calculated lengths-at-age according to two different interpretations of translucent rings deposition: one winter ring per year (1R) and two winter rings per year (2R). The growth increment calculated from tagged and recaptured Mustelus spp. is also shown.
Jmse 10 01647 g008
Figure 9. Von Bertalanffy growth curves of M. mustelus females (a) and males (b), and M. punctulatus (sexes combined); (c) from SW Sicily.
Jmse 10 01647 g009
Figure 10. Maturity ogives of males and females of M. mustelus (a) and M. punctulatus (b) from the south coast of Sicily.
Jmse 10 01647 g010
Figure 11. Relationship between total length (TL) and fecundity. The black dots are the number of embryos observed in pregnant females of M. mustelus sampled in SW Sicily. The red line is the power function: N. embryos = 2e−16TL7.7297 (R2 = 0.62, p < 0.001).
Jmse 10 01647 g011
Table 1. Comparison of life-history traits of M. mustelus and M. punctulatus from different studies and in different areas. Source as in the reference list [1]: SW Sicily (present work); [22]: N Adriatic Sea (Riginella et al., 2020); [20]: Gulf of Gabes, Tunisia (Saïdi et al., 2008); [29]: Libya (Faraj Kara et al., 2019); [25]: Gulf of Iskenderun (Ozcan and Başusta, 2018); [30]: South Africa (Goosen and Smale, 1997); [31]: South Africa (Smale and Compagno, 1997); [32]: South Africa (Da Silva et al. 2021); [24]: NE Adriatic Sea (Gračan et al., 2021); [21]: Gulf of Gabes, Tunisia (Saïdi et al., 2009).
Mustelus mustelusMustelus punctulatus
Source
1222029253031321222421
L∞ F209////204.9/189.7//208.4/
kF0.11////0.06/0.11//0.04/
t0 F−1.73////−3.35/−2.08//−4.49/
L∞ M206////145.1/112//136.4/
kM0.10////0.12/0.41//0.10/
t0 M−2.04////−2.14/−1.26//−2.53/
L∞ F+M///194.9195.1///156///
kF+M///0.030.06///0.17///
t0 F+M///−9.31−4.27///−1.41///
Agemax F16//282524/136/19/
Agemax M12//212017/118/14/
Agemax F+M ////// ///
A50F5///812–15/6.211/12.5/
A50M4///76–9/3.29/6.6/
Lmax F170158 165168162.6164165173.4111141136.2122
Lmax M148 150144.5129.2149 145 145 126.7120 119 126.5111
L50F111.5121.2117.285109/125 *119.492.5109.910095.6
L50M92.5108.197.17592/95 *96.784.591.383.181.4
Litter size8–163–184–188–2410–15/2–232–2611–187–35/12–27
* minimum maturity size.
Publisher’s Note: MDPI stays neutral with regard to jurisdictional claims in published maps and institutional affiliations.

