1. Introduction
Due to the development of the economy and water transportation, the navigation environments near bridges are complicated, and ship–bridge collision accidents often occur, which usually results in considerable losses [
1,
2]. To deal with the adverse effects of uncertain factors, scholars created an active early warning system to avoid ship–bridge collisions. The functioning of the system depends on the core index of the ship–bridge collision risk. The algorithm of the ship–bridge collision risk and the early warning strategy are the core key components of the system; they are the critical components that allow the system to be applied in practice.
Currently, the active early warning system of ship–bridge collision avoidance mainly operates through the vessel traffic management (VTS), ship automatic identification (AIS) [
3], and video target detection combined with the video surveillance system (CCTV) [
4] to warn facilities of a ship–bridge collision. The investments in these systems are very large, but some false alarms and missing alarms still occur, which limits the application of the ship–bridge collision early warning system in the industry. To solve this problem, researchers have conducted many studies on ship–bridge collision risks. From the subjective qualitative perspective, by analyzing historical accidents, scholars can determine the ship–bridge collision risk factors and use them to predict the ship–bridge collision risk [
5,
6,
7,
8,
9,
10,
11,
12]. Under this perspective, researchers consider the influence of the ship’s dimensions on the ship–bridge collision risk; however, the calculation results are not accurate enough because it depends on expert experience. From the objective and quantitative perspective, researchers calculate the risk of the ship colliding with a bridge by using objective data [
13,
14,
15,
16,
17], which has high credibility. However, some false alarms and missing alarms still occur with the current active warning model. Therefore, by taking the objective quantitative perspective and calculating the ship’s dimension, we calculated the ship–bridge collision risk and propose an active warning system of ship–bridge collisions that considers the ship’s dimension.
2. Constructing Algorithm
Firstly, we established the plane rectangular coordinate system according to the channel structure of the bridge, and we utilized the Mercator projection method to convert the geographical location of the bridge and ship. Then, we designed the coordinates of the ship’s projection point E on the bridge axis along the channel direction based on the relationship between the ship, bridge, and channel centerline. Finally, we constructed the risk algorithm of the ship–bridge collision by using the distance between the projection point E and the intersection point K of the channel centerline and the bridge.
Based on the high-precision risk of the ship–bridge collision, we propose an active warning strategy of ship–bridge collision avoidance. We increased the precision, reliability, and practicability of the warning system, and the common safety of the bridge and ship is guaranteed.
Figure 1 depicts a flow chart of the risk algorithm of the ship–bridge collision, where A is the position of the pier close to the ship, EA is the distance between points E and A, and EK is the distance between points E and K. ξ is the risk of the ship–bridge collision, and ξ
min0 is the minimum risk of the ship–bridge collision.
2.1. Establishment of Rectangular Coordinate System
As shown in
Figure 2, we used the channel entrance direction as the positive direction of the longitudinal axis of the bridge–ship coordinate system. Because many channel entrance directions exist and only one channel centerline was present in the bridge area waterway, we used the channel centerline in the bridge area waterway as the longitudinal axis (
x-axis). We used the active early warning system’s entrance direction as the positive direction of the
y-axis and its outer boundary GH in the entrance direction as the horizontal axis (
y-axis). We used the intersection between the channel centerline in the bridge area waterway and the outer boundary GH as the origin O (0,0). Point K is the intersection of the
x-axis and bridge AB.
The method that we used to divide the active early warning system for ship–bridge collision avoidance is as follows: We selected point S on the
x-axis to create OK = KS, going through S and drawing a line JF parallel to the
y-axis. We crossed pier A and drew a straight line perpendicular to the
y-axis, intersecting JF at point F and intersecting the
y-axis at point H. Similarly, we crossed pier B and drew a straight line perpendicular to the
y-axis, intersecting JF at point J and intersecting
y-axis at point G., i.e., JFHG in
Figure 2 is the active early warning range for the ship–bridge collision avoidance.
When the ship sails into the outer boundary GH, the active early warning system for ship–bridge collision avoidance begins to work.
2.2. Coordinate Transformation
Utilizing the Mercator projection method, we transformed the longitude and latitude coordinate points (lat, lon) of the ships and bridges into new coordinate points (x, y) in the bridge–ship coordinate system. Because the Earth is an ellipsoid, we set the semimajor axis of the ellipsoid as a, the short half axis of the ellipsoid as b, lat
0 as the longitude of the bridge–ship coordinate system origin, lon
0 as the latitude of the bridge–ship coordinate system origin, e as the first eccentricity of the ellipsoid, e’ as the second eccentricity of the ellipsoid, and U and q as intermediate variables. Therefore, the coordinate conversion formula [
18] is Equations (1)–(4):
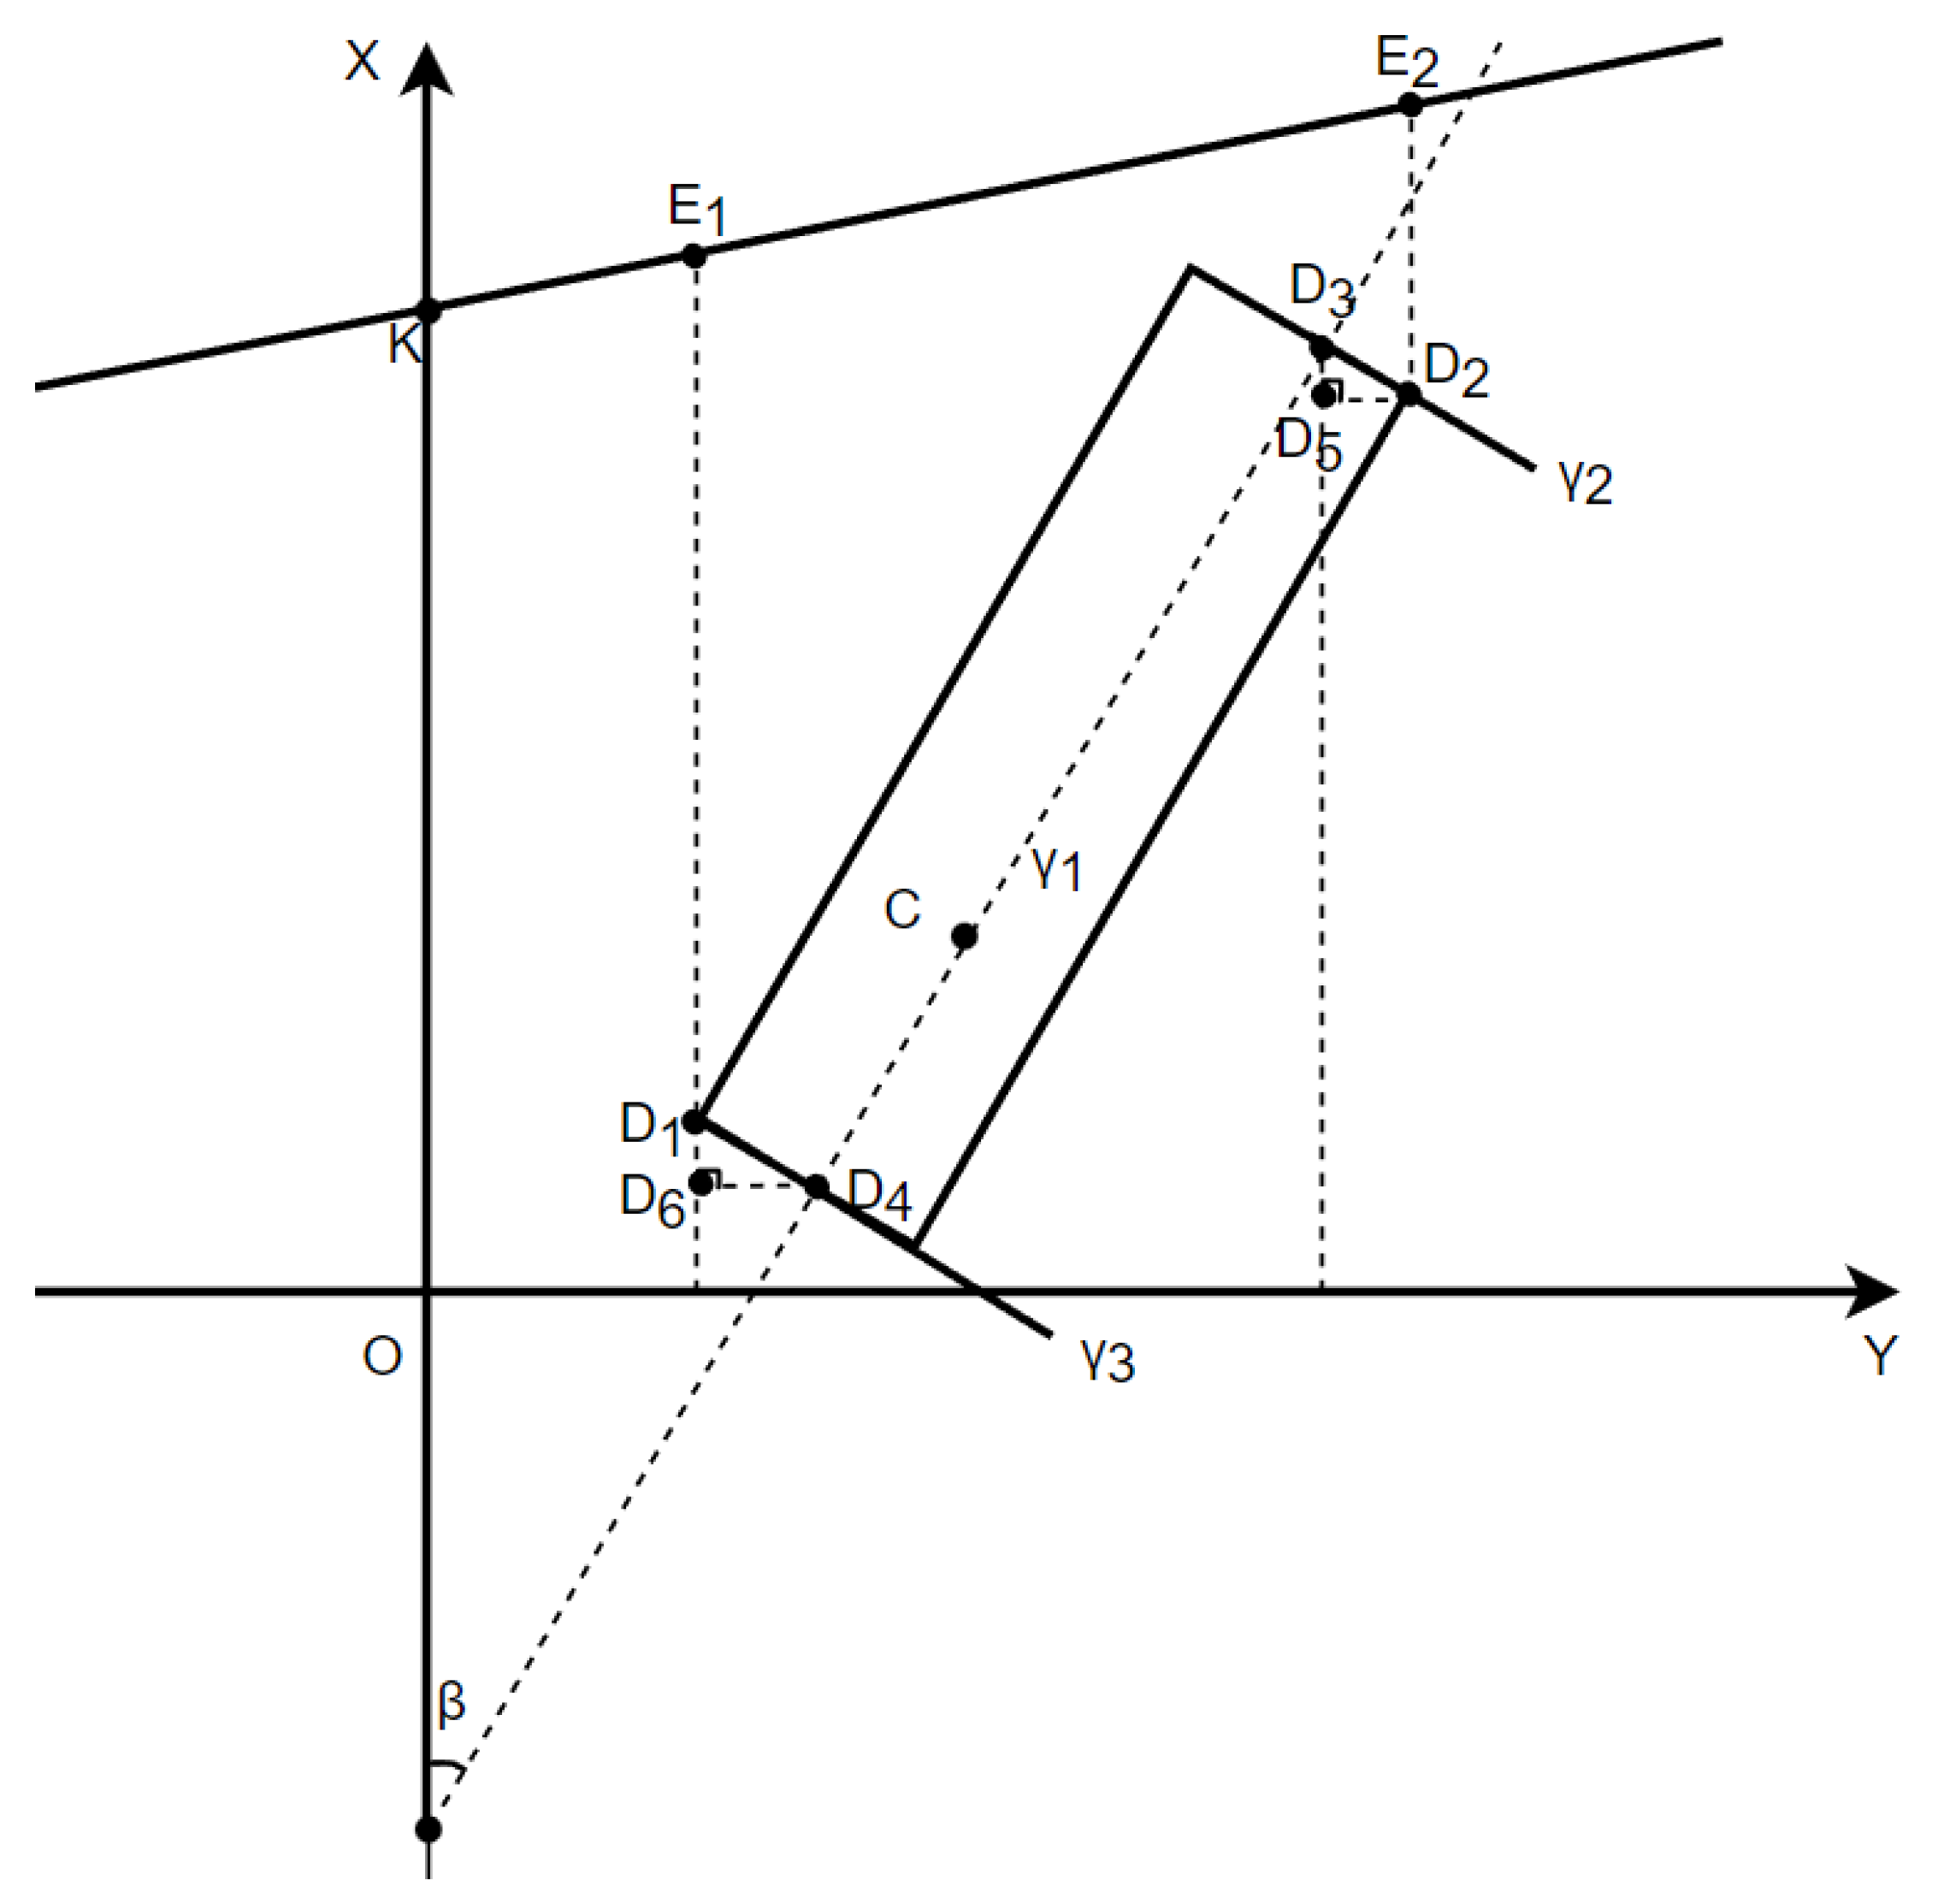
2.3. Position Coordinate Projection Position
As shown in
Figure 3, L is the ship length, Z is the ship width, and the position sensor on the ship is point C. The ship’s course over ground (COG) is the angle θ between due north and the heading direction of a ship (i.e., the ship’s sailing direction), α is the angle between due north and the
x-axis (θ and α are not shown in the figure), β is the angle between the heading direction of the ship and the
x-axis (i.e.,
), D
1 is the left posterior position point of the ship (the leftmost point), and D
2 is the right anterior position point of the ship (the rightmost point).
In
Figure 3, γ
1 is the parallel line about the ship navigation direction passing through point C of the position sensor, γ
2 is the vertical line about the ship navigation direction passing through the ship head, γ
3 is the vertical line passing through the stern about the ship navigation direction, D
3 is the intersection of γ
1 and γ
2, D
4 is the intersection of γ
1 and γ
3, and points E
1 and E
2 are the projection points of the points D
1 and D
2 of the ship on bridge AB (point A and B are the location points of the two piers of the bridge, as shown in
Figure 2) (that is, E
1 and E
2 are the farthest and nearest projection points of the ship on bridge AB).
As can be seen in
Figure 3, the coordinates (y
c, x
c) are the coordinates of point C, where the position sensor on the ship and the relationship between the coordinates (x, y) of D
i (i = 3,4) can be determined with Equation (5):
The captain is L, and the ship breadth is Z. According to the position of the ship position sensor C, the settings are D3C = 0.68L, D2D3 = 0.51Z, D4C = 0.32L, and D1D4 = 0.49Z.
We set the position coordinate of D
3 to (y
3, x
3) in Equation (6):
We calculated the position coordinates (y3, x3) of D3 from Formula (6) and obtained two coordinate points. We took the position coordinates where y3 is greater than yc as the position coordinates of D3.
We set the position coordinates of D
4 to (y
4, x
4) in Equation (7):
We calculated the position coordinates (y4, x4) of D4 from Equation (7) and obtained two coordinate points. We took the position coordinates where y4 is less than yc as the position coordinates of D4.
According to
Figure 3, in triangle D
3D
2D
5, the length of D
2D
3 was 0.51Z, and according to the geometric relationship, ∠D
3D
2D
5 = β, the horizontal scale of D
2 can be expressed as Equation (8):
Similarly, in triangle D
1D
4D
6, the horizontal scale of D
1 can be expressed as Equation (9):
Because E1 and E2 are the projection points of D1 and D2 on the bridge, respectively, the horizontal scale of E1 and E2 are y1 and y2.
From pier A(y
a, x
a) and pier B(y
b, x
b), one can obtain the functional relationship of the bridge as Equation (10):
Let the coordinate of point K be (0, x
k); then, x
k is Equation (11):
According to the horizontal scale of E1 and E2, the vertical coordinates of E1 and E2 are x1 and x2; that is, the coordinates of E1 are (y1, x1) and the coordinates of E2 are (y2, x2).
2.4. Construction of Ship–Bridge Collision Risk Algorithm
As shown in
Figure 2, we divided the active early warning system for ship–bridge collision avoidance into four areas (Equation (12)), where x and y are the vertical and horizontal coordinate points of any point in the bridge–ship coordinate system, respectively: entrance normal navigation area OKAH (quadrant I), entrance reverse navigation area OKBG (quadrant II), exit normal navigation area SKBJ (quadrant III), and exit reverse navigation area SKAF (quadrant IV).
Based on the coordinates of D1, D2, D3, and D4 and Equation (12), we can judge whether the current position of the ship is within the range of the above four quadrants, and then, we can judge whether the ship is in the normal navigation area (safe) or in the reverse navigation area (unsafe) according to the navigation direction of the ship. Furthermore, we can determine the quadrant where the ship is sailing, send an intrusion warning to ships sailing outside of the scope of the active anticollision warning, and send a reverse warning to ships sailing in the reverse channel quadrant.
As shown in
Figure 2, the center of pier A is connected to the center of the ship, intersecting the channel centerline (
x-axis) at point R. The center of pier A is connected to point R. We used pier A as the center of the circle, and we used the Euclidean distance D
i between the ship and pier A as the radius to draw a circle. Additionally, we used pier A as the center of the circle, and we used the distance D
i’ between the center of pier A and point R as the radius to draw a circle.
For all ships in the normal navigation area within the active early warning range of the active antiship collision avoidance, we took the Euclidean distance between each ship and the nearest pier (we took pier A as an example in this paper). We calculated the distances E1k and E2k from the E
1 and E
2 point to the K point on the channel centerline, and we calculated the distances E
1A and E
2A from pier A to the E
1 and E
2 point. According to E
1(y
1, x
1), E2(y
2, x
2), K(0, x
K), and A(y
a, x
a), the length of E
1k, E
2K, E
1A, and E
2A can be determined with Equations (13)–(16):
According to the geometric relationship between the bridge, pier, and channel centerline, the ratio of AK and E
iA is equal to the ratio of D
i′ to D
i (i = 1, 2). According to D
i and D
i′, we constructed the risk index model of the collision between the ship and bridge, and the formula is Equations (17) and (18):
According to Equation (17), the E
1K to E
1A ratio is ρ
1. The ship–bridge collision risk of the lower left endpoint of ship D
1 is the lowest (because we set pier A as the closest pier to the ship), and we set the ship collision risk at point D
1 as ξ
1. According to formula 18, the E
2K to E
2A ratio is ρ
2. The ship–bridge collision risk of the upper right endpoint D
2 is the largest. We set the ship collision risk of the D
2 point as ξ
2, (e is a natural constant), and ξ
1 and ξ
2 can be determined with Equations (19) and (20):
The risk of a collision between the ship and bridge is between [ξ1,ξ2].
2.5. Active Early Warning Strategy
Figure 4 shows a graph of the ship–bridge collision risk that we created with Python. The red line is the curve of ship–bridge collision risk, and the blue line is the tangent of curve. According to the tangent of the graph, the risk change rate of the ship–bridge collision is large after the risk is 0.75. Therefore, we set the threshold of the early warning of the ship–bridge collision risk to 0.75.
We started the early warning function under the following two conditions:
(1) The ship is under a single-hole two-way span bridge. If the upper limit of the risk interval of the ship collision ξ2 is greater than or equal to the threshold of 0.75, we started the warning function.
The ship navigates under a two-hole one-way span bridge. As shown in
Figure 5, a pier IMPN is present between piers A and B. One must consider the projection of the pier on the bridge along the channel direction. We set the projection point closest to pier A as E
3 and the furthest projection point as E
4. We took the ship navigation direction shown in
Figure 3 as an example, where the projection point at the leftmost side of the ship coincides with E
3 and the ship–bridge collision risk is ξ
min0, and therefore the minimum ship–bridge collision risk is ξ
min0. When the upper risk limit of the ship–bridge collision ξ
2 is greater than or equal to the threshold of 0.75, or the lower risk limit of the ship–bridge collision ξ
1 is less than or equal to ξ
min0, we started the warning function.
(2) In a certain period of time (t
1,t
2), at time t
1, the minimum ship–bridge collision risk i is
, and at time t
2, the maximum ship–bridge collision risk i is
. So, the change rate of the ship–bridge collision risk during time (t
1,t
2) is
(Equation (21)):
The point K ordinate in the coordinate system can be obtained from Equation (11), and the ordinate XK is the warning distance of the bridge area. According to the AIS data of the ship, the ship speed at this time is v
i, so the time T
0 spent by the ship sailing in the early warning range of the bridge area waterway can be determined with Equation (22):
When , we started the early warning function.
We installed the active warning system of the ship–bridge collision on a bridge, and when a ship enters the warning area and reaches the warning conditions, the active warning system will automatically warn the ship. The early warning mainly occurs through AIS information, photoelectric, screen, SMS, directional speaker reminders, etc. The whole system can also provide a support platform to warn facilities early on of ship–bridge collisions involving sea-cross bridges.
3. Case Analysis
For bridges threatened by ship collisions, researching an active early warning system for ship–bridge collision avoidance is crucial. However, even if the risk coefficient was low, a ship hitting a bridge was still possible in some studies where the authors did not consider the impact of the ship’s dimension on the results. Thus, we calculated the risk of a ship colliding with a bridge by considering the ship’s dimension. If the danger range of the ship sailing on the current course is higher overall, the captain can adjust the ship’s course to effectively reduce the ship–bridge collision risk.
To effectively discuss the algorithm of the ship–bridge collision risk considering the ship’s dimension, we tested our algorithm with the Shanghai–Nantong Railway Yangtze River Bridge. The Shanghai–Nantong Railway Yangtze River Bridge connects the cities of Suzhou and Nantong in Jiangsu Province, China, with a total length of 2296 m and a main span of 1092 m. The single-hole two-way span of the main navigation hole channel of the bridge is 900 m, as is the navigation clearance width. The Shanghai–Nantong Railway Yangtze River Bridge plan is shown in
Figure 6 [
19].
The selected channel range that we studied is shown in
Table 1. We established a rectangular coordinate system, including the origin, channel direction, and selection range. The longitude and latitude of the two piers of the main channel of the bridge were A (120.713044 E, 32.009569 N) and B (120.714733 E, 31.999814 N), respectively.
The “warning area” in
Figure 7 is the active early warning range used by early warning systems to avoid ship–bridge collisions. In the Figure, A and B are the two piers, and the arrows represent the direction of sailing. We used the channel centerline of the Shanghai–Nantong Railway Yangtze River Bridge as the longitudinal axis (
x-axis). We used the active early warning range of the ship–bridge collision’s entrance direction as the positive direction of the
y-axis, and its outer boundary of the entrance direction as the transverse axis (
y-axis). We used the intersection of the channel centerline of the bridge area and the outer boundary of the ship entrance direction as the origin O (0,0). Point K is the intersection of the
x-axis and bridge AB in the bridge–ship coordinate system.
Because many ships sail under the Shanghai–Nantong Railway Yangtze River Bridge in August and October every year, we selected the AIS data of ships sailing under the Shanghai–Nantong Railway Yangtze River Bridge in August and October 2020 for algorithm verification purposes. We obtained the data from the Nantong Maritime Safety Administration.
First, we conducted predata processing to obtain the data that this algorithm needed to use, including MMSI (Maritime Mobile Service Identify), longitude, latitude, length, and width, and we filtered the data out when analyzing quadrant I. This algorithm is universal in the four quadrants. Because the pier closest to the ship is not necessarily the same pier each time the algorithm runs, we took the ship sailing in the first quadrant as an example to verify the algorithm.
Then, using Python to create the recurrence algorithm, we used the above preprocessed AIS data to calculate the ship–bridge collision risk [
20]. Some results are shown in
Table 2, which are the risk ranges of the ship sailing according to the current heading at a certain position point.
As shown in
Table 2, the maximum ship–bridge collision risk of MMSI 41,398,580 and 413,406,430 was 0.994 and 0.840, which is higher than 0.75. That means that the probability of the ship hitting the pier was 0.81630 if the ship sailed according to its current course. At this time, the active early warning system for ship–bridge collision avoidance would activate, alarming the facility and telling the captain that he needs to change his sailing direction.
Figure 8 is the curve diagram of the ship trajectory points and maximum risk, which we created with Python. The horizontal blue line indicates that the risk of collision is 0.75. And different colored lines indicate different ships. As can be seen from the curve diagram, when the risk of a ship–bridge collision is 0.75 or above, alarm intervals are present in the active warning system for ship–bridge collisions. When the risk of a ship–bridge collision is lower than 0.75, the ship can safely sail.
Because the Shanghai–Nantong Railway Yangtze River Bridge is a single-hole two-way span bridge, we only needed to compare the maximum risk of a ship collision ξ2 with the threshold 0.75. If the bridge was a two-hole one-way span bridge, the lower limit of the risk range of the ship–bridge collision would also have needed to be considered, no matter if ξ1 was less than or equal to ξmin0. If ξ1 was less than or equal to ξmin0, the warning system would also have needed to be alarmed.
4. Discussion
In previous studies investigating ship–bridge collision avoidance, the authors did not consider the ship’s dimensions enough when creating algorithms on ship–bridge collision risks. We creatively propose an algorithm on ship–bridge collision risk that considers the geometric position relationship between the ship, pier, and channel. Our algorithm comprehensively considers factors such as the pier layout, navigation span, bridge, and channel in the bridge area. Additionally, we propose an active early warning strategy according to the index coming from the algorithm.
In this paper, we illustrated the reliability of our algorithm with a case study on the Shanghai–Nantong Railway Yangtze River Bridge. First, we calculated the ship–bridge collision risk of the ships passing through the main channel. Then, we conducted a comparative analysis with the actual situation. The results showed that the calculation results of this algorithm were basically consistent with the actual ship collision risk, and thus the algorithm can accurately predict the ship collision risk.
5. Conclusions
The algorithm that we propose adequately considers the influence of the ship’s dimensions on ship–bridge collision risks. It can considerably increase the accuracy of the ship–bridge collision risk prediction, and it can be applied to an active early warning system to avoid ship–bridge collisions. It is conducive to the application of the active early warning system in practice, and it heightens the safety level of ships and bridges. Moreover, the algorithm is not only suitable for bridges that have a single-navigable-hole two-way navigation, but it is also suitable for bridges that have double-navigable-hole single-way navigation.
However, we only based our ship–bridge collision risk calculations on the ship’s dimensions, which are in the two-dimensional plane research stage and does not consider the influence of height. In the future, researchers can further consider the influence of height from the three-dimensional space. Additionally, researchers can construct more-accurate ship-collision-risk early warning systems, and they can promoting the wide application of ship–bridge collision early warning systems in engineering practices.


