Article

Genetic Diversity Analysis of Different Populations of Lutjanus kasmira Based on SNP Markers

1
Key Laboratory of South China Sea Fishery Resources Exploitation and Utilization, South China Sea Fisheries Research Institute, Chinese Academy of Fishery Sciences, Ministry of Agriculture and Rural Affairs, Guangzhou 510300, China
2
School of Fisheries and Life Science, Dalian Ocean University, Dalian 116023, China
3
Southern Marine Science and Engineering Guangdong Laboratory (Guangzhou), Guangzhou 511458, China
4
Guangdong Provincial Engineer Technology Research Center of Marine Biological Seed Industry, Guangzhou 510300, China
5
Tropical Aquaculture Research and Development Center, South China Sea Fisheries Research Institute, Chinese Academy of Fishery Sciences, Sanya 572018, China
*
Author to whom correspondence should be addressed.
J. Mar. Sci. Eng. 2022, 10(10), 1547; https://doi.org/10.3390/jmse10101547
Submission received: 26 September 2022 / Revised: 13 October 2022 / Accepted: 14 October 2022 / Published: 20 October 2022
(This article belongs to the Special Issue New Techniques in Marine Aquaculture)

Abstract

:
Lutjanus kasmira belongs to the family Lutjanidae. Over the past 20 years, the L. kasmira population in the South China Sea has been shrinking due to climate change, pressure from human activities, and inadequate food supplies. In this study, single nucleotide polymorphism (SNP) data obtained from restriction site-associated DNA sequencing (RAD-seq) were used to assess the genetic diversity of L. kasmira in Zhubi Dao (ZB) and Meiji Dao (MJ). The genome-wide nucleotide diversity (π) of the ZB population and MJ population was 0.02478 and 0.02154, respectively. The inbreeding coefficient (Fis) of the ZB population and MJ population was −0.18729 and 0.03256, respectively. The genetic differentiation (Fst) between the ZB and MJ subpopulations was 0.00255102. The expected heterozygosity (He) of individuals from ZB and MJ was 0.33585 and 0.22098, respectively. The observed heterozygosity (Ho) of individuals from the ZB population and MJ population was 0.46834 and 0.23103, respectively. Although the ZB and MJ populations did not have significant genetic differences, the genetic differentiation between them was confirmed using population structure, phylogenetic, and principal component analyses. These results indicated that the genetic diversity of the ZB and MJ populations was relatively low at the genome level, and that their genetic differences were small.

1. Introduction

Single nucleotide polymorphisms (SNPs) are DNA sequence polymorphisms caused by the transformation or transposition of a single nucleotide at the genomic level [1]. SNP markers are a tool for studying the genetic structure of species [2]. Since any base of genomic DNA can be mutated, SNP molecular markers are ubiquitous in animals and plants [3]. SNPs have the advantages of a large number, a wide distribution, strong representativeness [4], good genetic stability, and convenience for high-throughput and highly automated detection and analysis [5]. The distribution of SNPs in the genome can comprehensively reflect a population’s genetic variation [4].
L. kasmira is a typical reef-dwelling fish found throughout the Indo-Pacific region, from Australia in the east to Japan in the north [6]. Individuals of this species are mainly distributed around the South China Sea islands, Taiwan waters, and in the southern portion of the East China Sea [7]. L. kasmira has a bright yellow surface and a reddish underside; the side of the body bears four blue longitudinal bands, with an indistinct black spot between the third and fourth blue bands [8]. In recent years, the habitat of this species, i.e., coral reefs and mangroves, has been reduced and degraded due to anthropogenic destruction and environmental pollution [9]. Moreover, L. kasmira suffers from overfishing due to its delicious meat, high economic value, and spawning clusters [7]. At present, studies on L. kasmira mainly focus on its physiological ecology and molecular systematics [7,8,9]; there are no reports on the development of SNP markers and the genetic diversity level of L. kasmira. In this study, the whole-genome SNPs of L. kasmira were first discovered by restriction site-associated DNA sequencing (RAD-seq) technology [10] and then used to analyze the genetic diversity and structure of this fish species, providing a theoretical basis for the rational development and conservation of its germplasm resources.

2. Materials and Methods

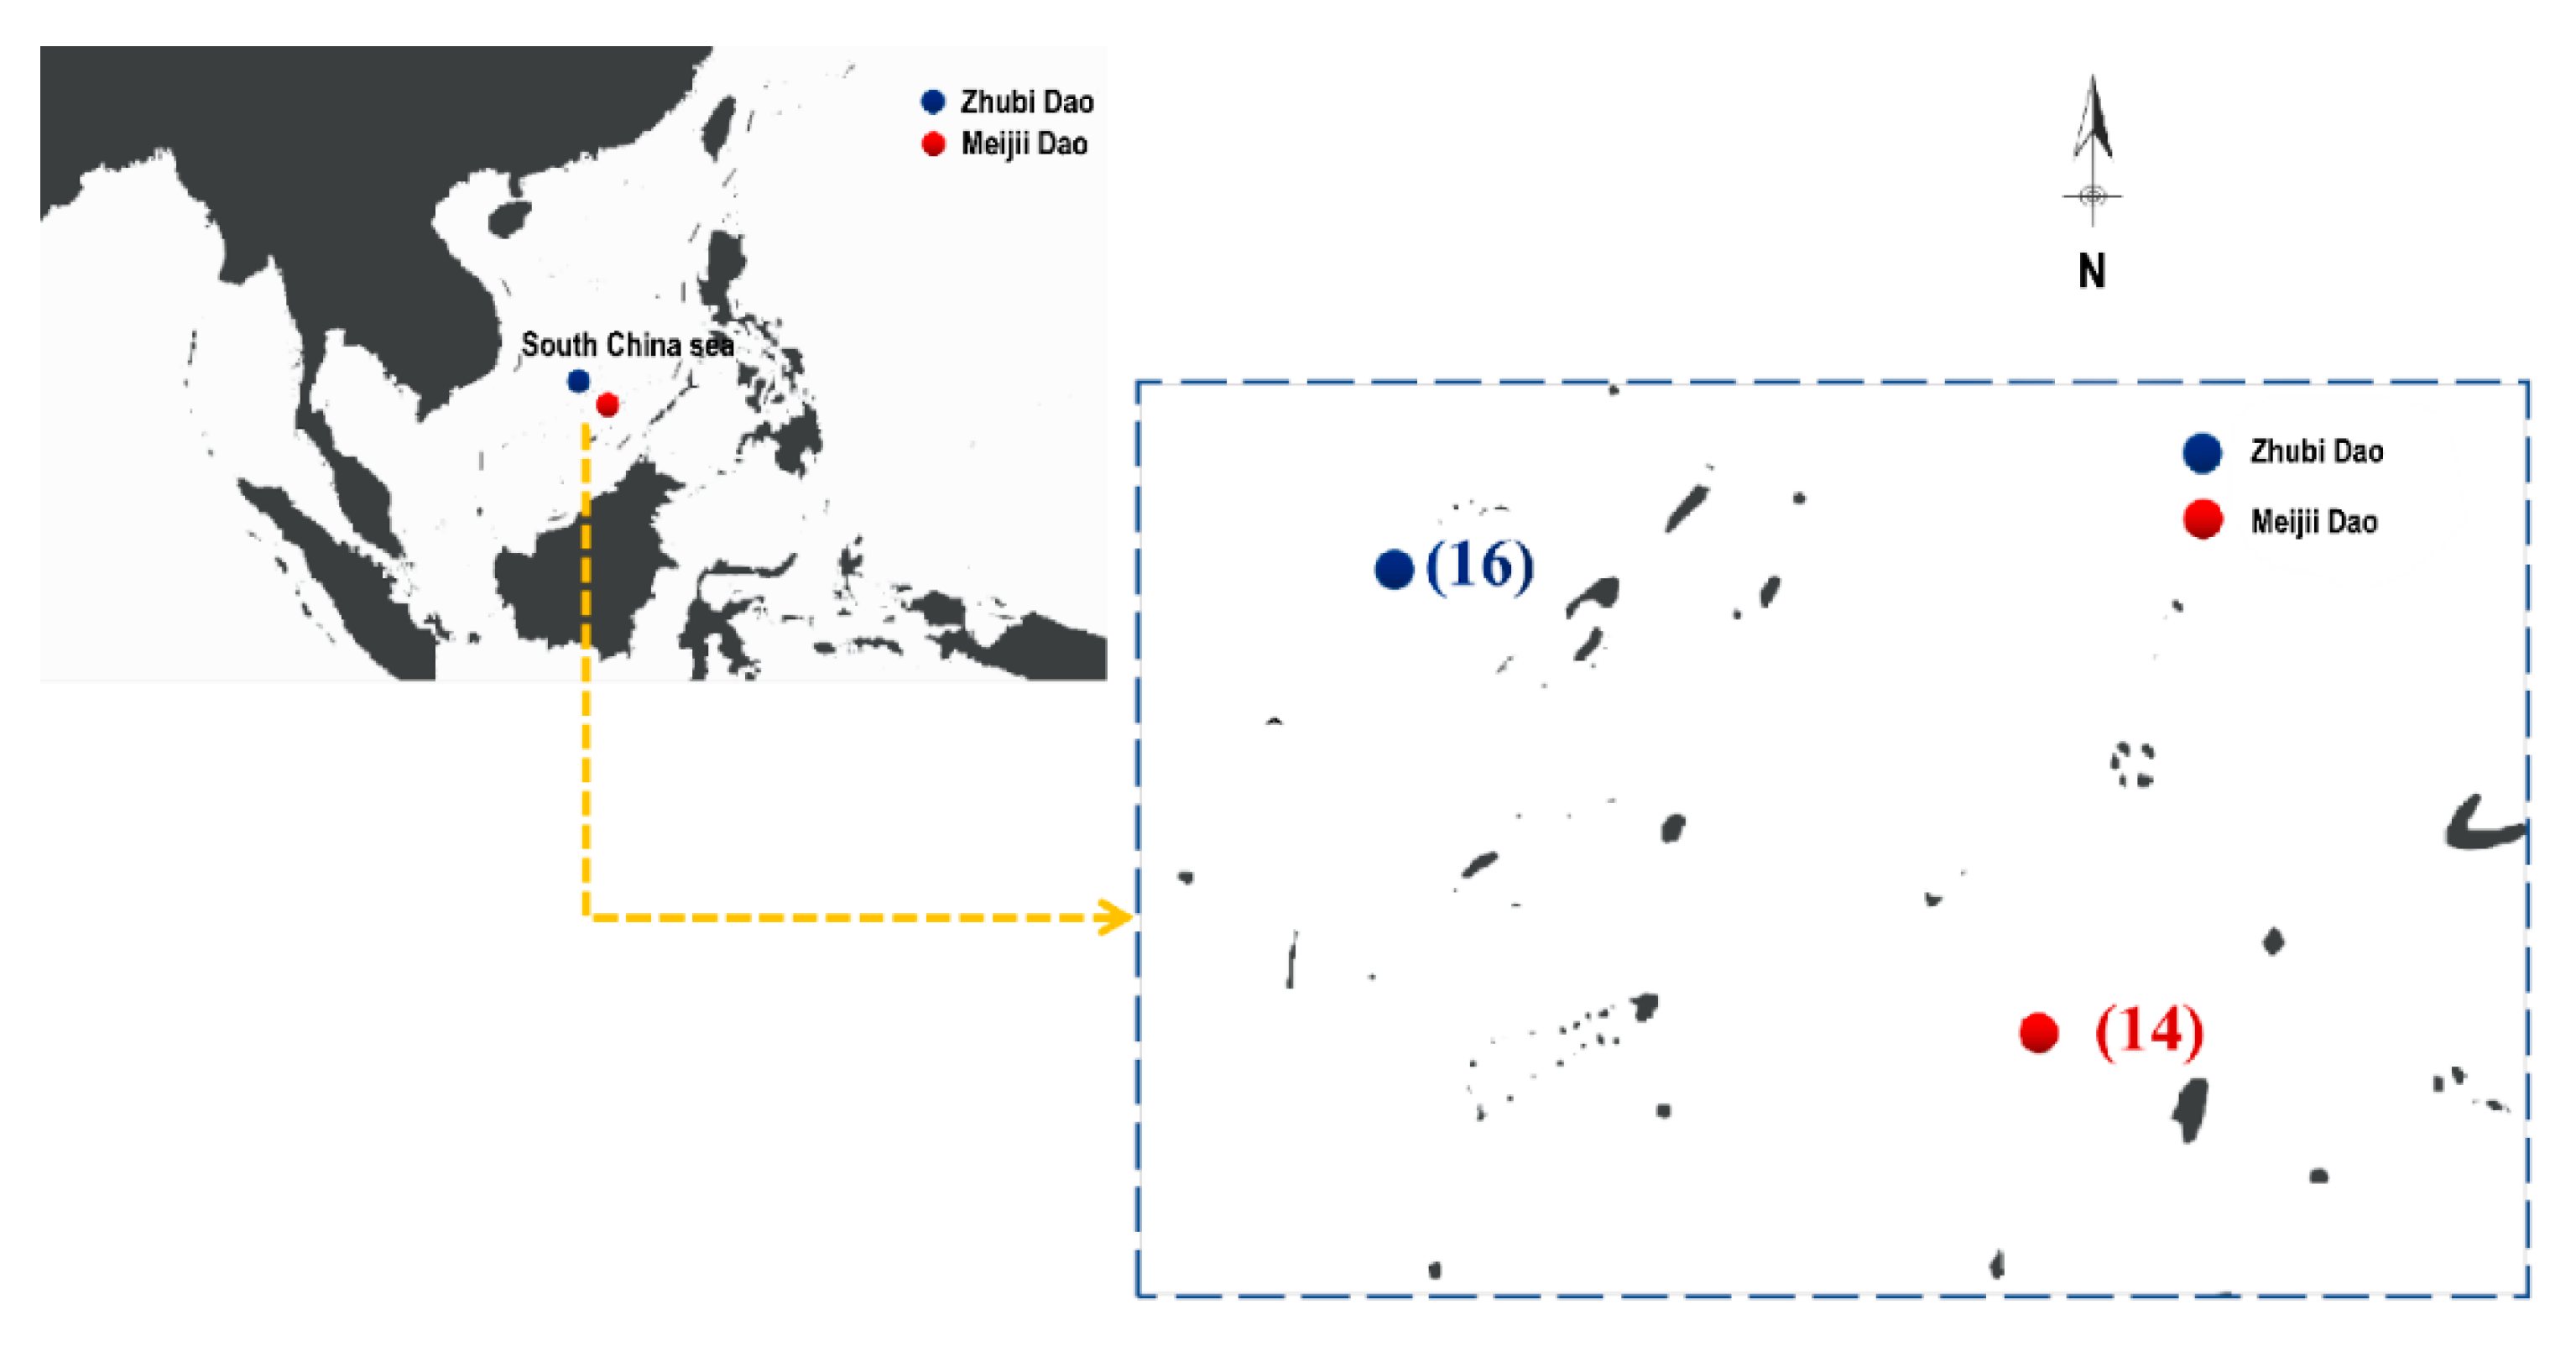
2.1. Sample Collection and DNA Extraction

L. kasmira samples were collected from Meiji Dao (MJ) and Zhubi Dao (ZB), which are separated by approximately 200 km (Figure 1). A total of 30 L. kasmira samples were collected, comprising 14 samples from MJ and 16 samples from ZB (Table 1). Tissue was collected by clipping the fin strip of the experimental samples. The tissue samples were fixed in 75% anhydrous ethanol and stored at room temperature. A Tissue DNA Extraction CZ Kit (Mobio, Guangzhou, China) was used to extract genomic DNA from the pterygiophore of each fish according to the manufacturer’s protocol.

2.2. RAD-Seq Library Construction and Sequencing

RAD-seq libraries were prepared as described by Yangkun Wang and Yan Hu [11]. First, genomic DNA samples were digested by the restriction endonuclease EcoRI. Then, P1 adapter was added to both ends of the digested genome fragment, which contains a complementary sequence that binds to the primer for PCR amplification and a complementary sequence that binds to the primer for Illumina sequencing. The barcode used for sample tracking and the corresponding restriction enzyme cutting site were also part of the P1 adapter. Next, the sequence of the added P1 adapter was interrupted. Through agarose gel detection, the target band was selected in the range of 400~500 bp. The DNA fragment was then attached to the P2 adapter. The multiplexed libraries were sequenced on the Illumina 1.9 platform with an average sequencing depth of 1.5× for each individual.

2.3. Sequence Alignment and SNP Genotyping

Stacks (version 2.55, Julian Catchen and Nicolas Rochette, Urbana, IL, USA) software is widely used in RAD-seq data analysis [12]. First, raw reads were processed using the process_radtags program [11]. Through raw data processing, each clean read was assigned to a sample to ensure the quality of the sequencing data for use in subsequent analysis. Ustacks begins by clustering reads from a single sample obtained from the process_radtags program to produce stacks [13]. Ustacks in the Stacks package was applied to cluster the reads for each sample, with the same stack representing one enzyme cutting site (locus). The clustering parameter -m was set to 3 [14], and the loci and locus sequencing depth of each sample were statistically analyzed. Next, we used Cstacks to merge the loci of all samples and allowed up to 2 mismatches between different sample loci to obtain the catalogue consensus sequence of each locus [14]. Sstacks was used next. The minor allele frequency (MAF) was set at 0.05 [15]. Loci in each sample deviating from the catalogue consensus sequence were identified, and then populations were filtered to obtain the SNPs. Only the genotype of the first SNP for each tag and loci shared by more than 75% of individuals were used for further analysis. The loci not in Hardy–Weinberg equilibrium (HWE) were removed [16], and the selected loci were used to analyze genetic diversity and population genetic differentiation.

2.4. Genetic Diversity and Population Structure

The genetic diversity parameters of MJ and ZB were calculated by Stacks-2.55 [15], including observed heterozygosity (Ho), expected heterozygosity (He), genetic differentiation (Fst), the inbreeding coefficient (Fis), and nucleotide diversity (π).
Genetic variation was determined by population structure analysis and genetic differentiation assessment. The R package poppr [17] was used to calculate a distance matrix and draw a heatmap [18]. The R packages igraph and poppr were used to cluster multi-locus genotypes (MLGs) to generate minimum spanning networks (MSNs) [19]. A phylogenetic tree was constructed by PHYLIP (version 3.695, Phylip Team, Washington, DC, USA) software [20] to analyze the relationships between samples. Compared with Structure, Admixture software can be used to estimate the ancestral components of individuals faster [21]. Therefore, ADMIXTURE (version 1.3.0, David H. Alexander et al., Los Angeles, CA, USA) software [22] was used to consider various numbers of putative clusters (ranging from 1 to 10) and compute the ten-fold cross-validation error to select the most suitable number of clusters [23]. The PCA module of GCTA (version 1.93.2, Jian Yang et al., Hangzhou, Zhejiang, China) software [24] was used for principal component analysis (PCA).

3. Results

3.1. Genomic Data Statistics and SNP Discovery

Raw reads were obtained by RAD-seq of 30 individuals of L. kasmira. After trimming barcodes and filtering, a total of 286,264,230 high-quality clean reads were obtained from 30 individuals. The number of clean reads per individual ranged from 6,672,063 to 21,514,652, with an average of 9,542,141. In all the libraries, the GC content was stable between 39% and 40%, and the Phred score was 20 ≥ 93.64% (Table 2). A total of 9822 high-quality SNPs were screened out for further analysis after the selection of SNPs with an MAF < 0.05 and in HWE.

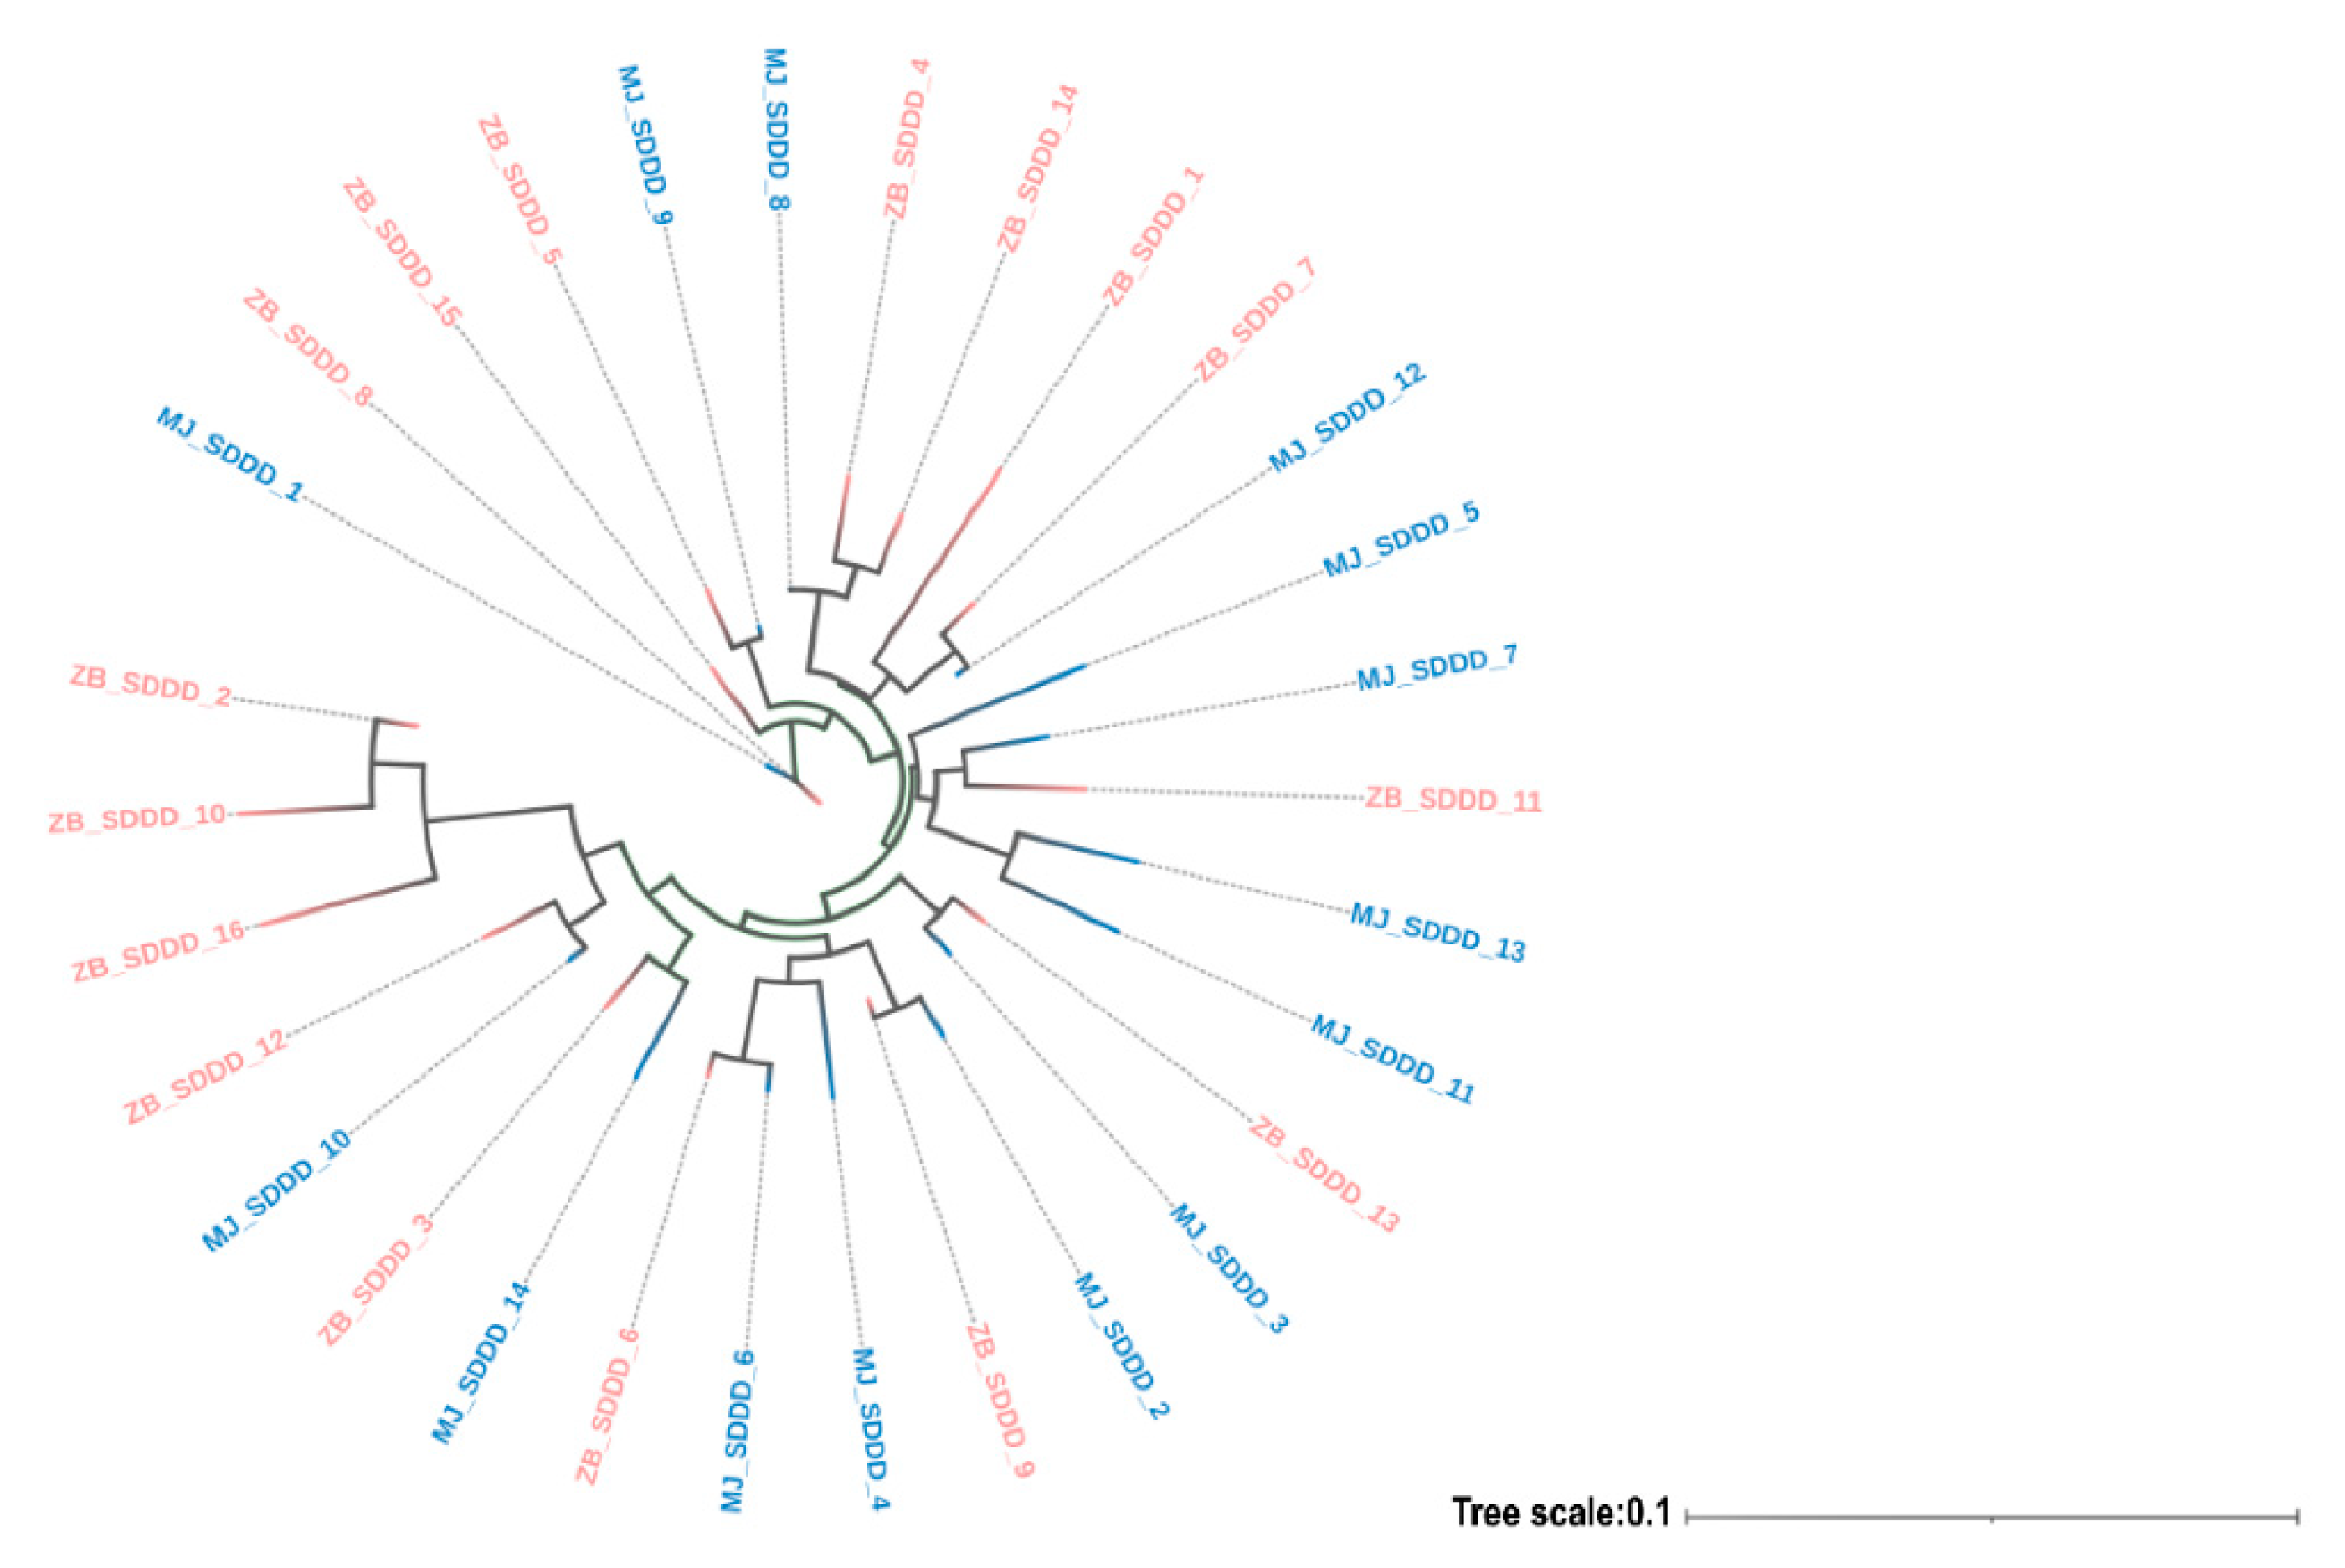
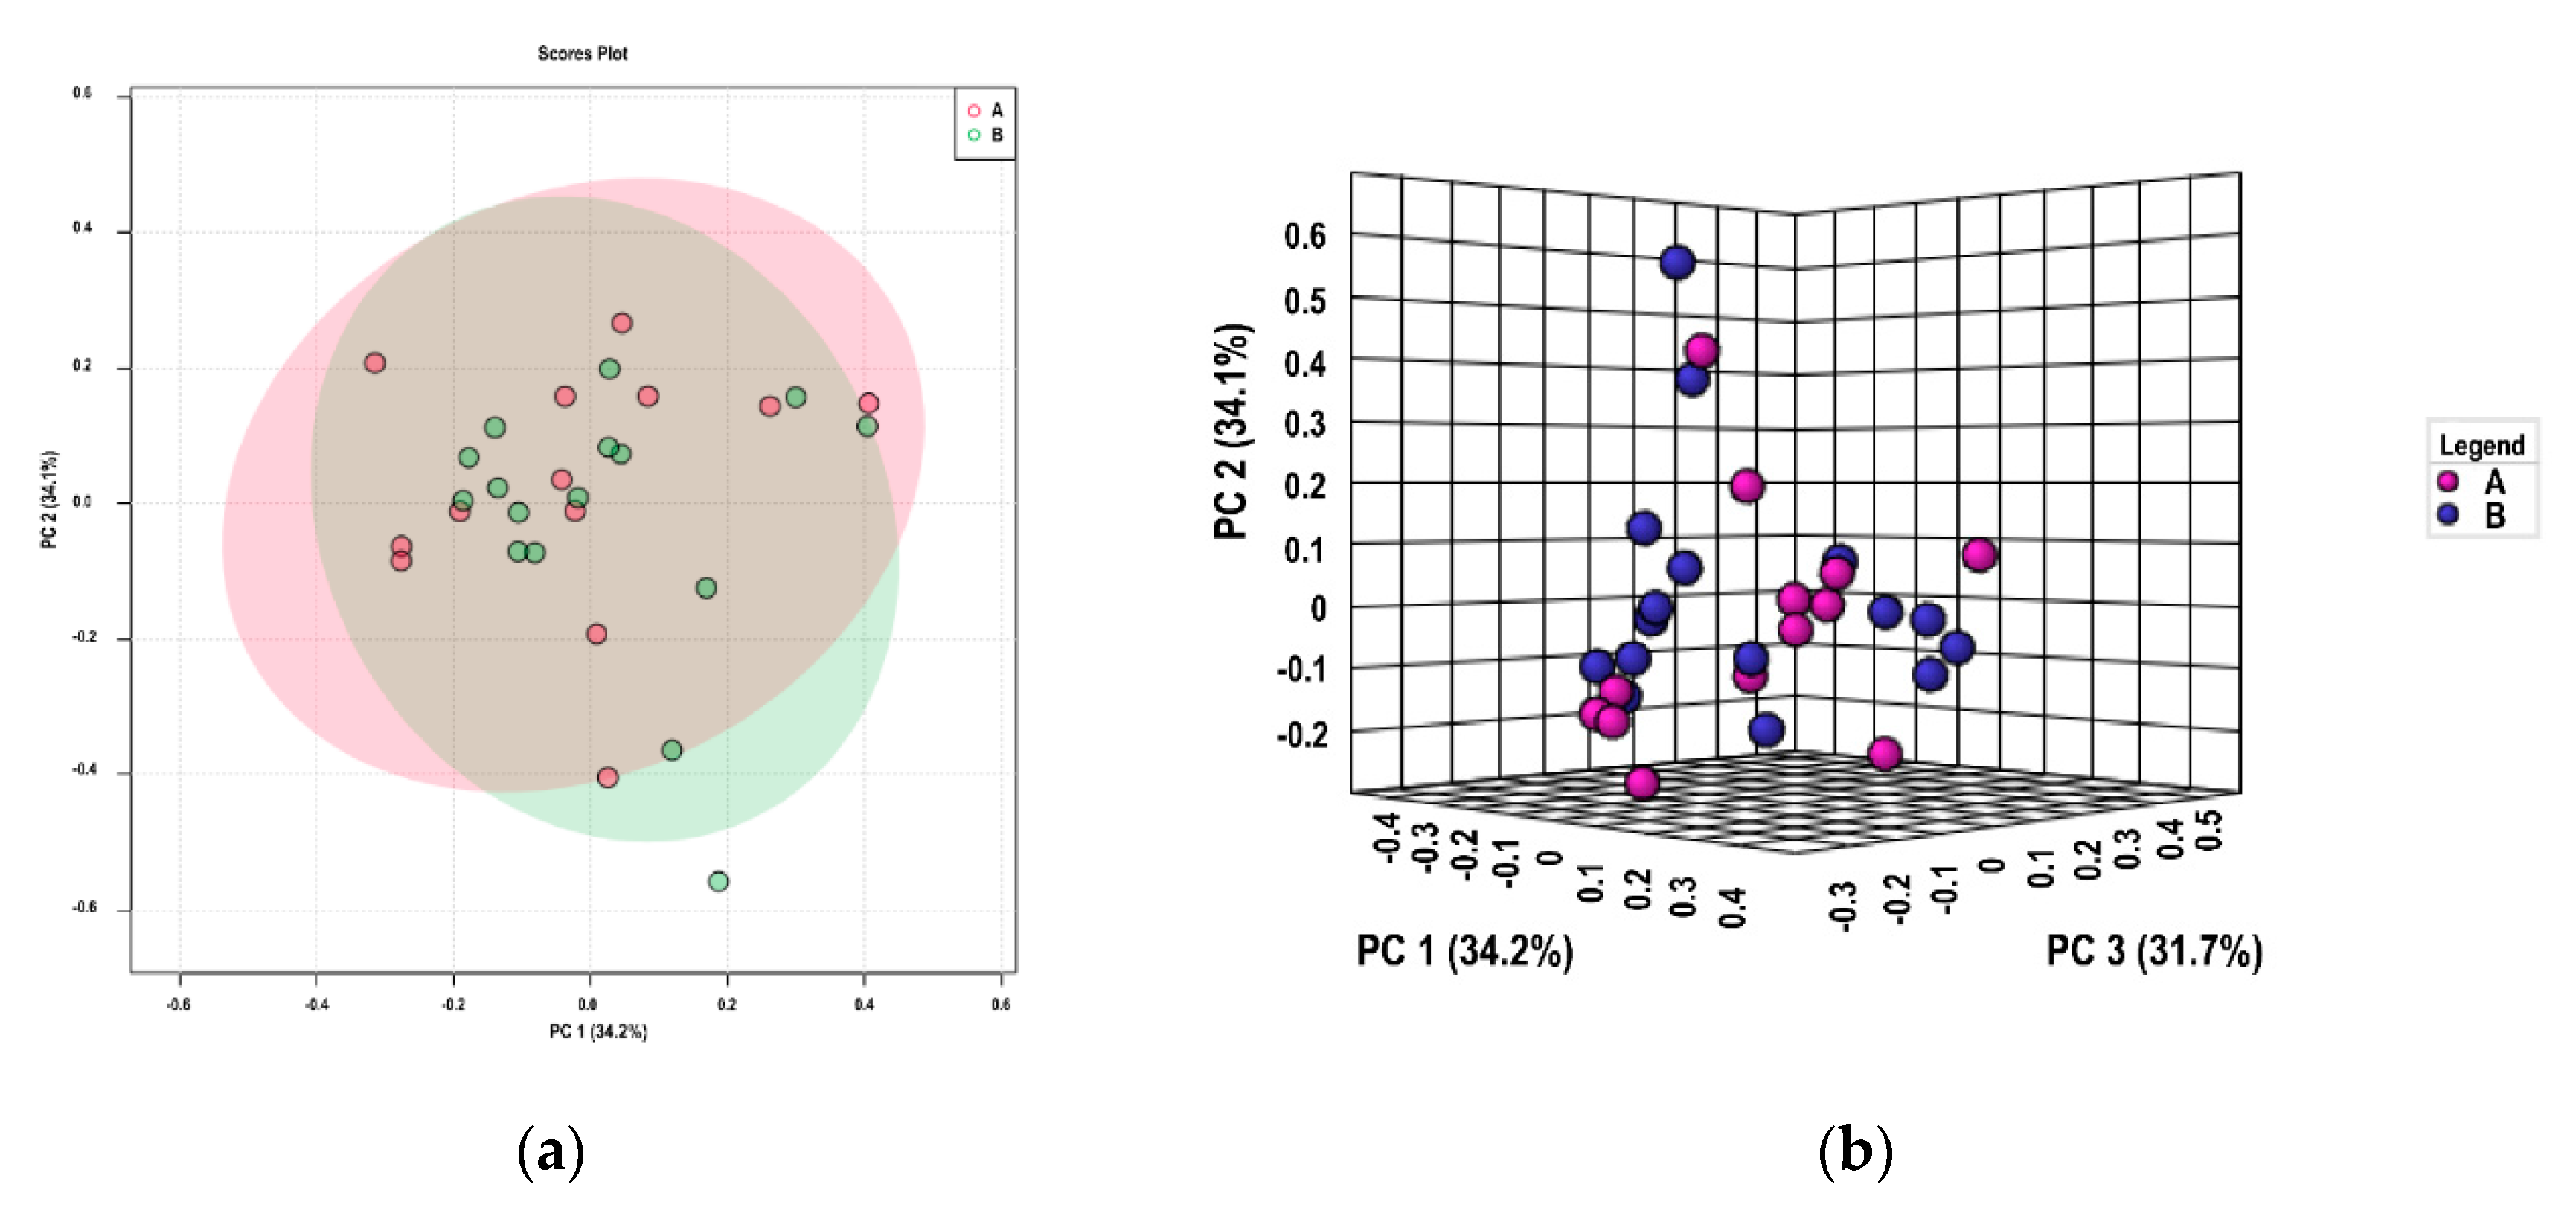
3.2. Genetic Diversity and Population Structure

The genetic diversity parameters were calculated according to the original SNPs, and the statistical results were obtained. The genome-wide nucleotide diversity (π) of the ZB population and MJ population was 0.02154 and 0.02478, respectively. The inbreeding coefficient (Fis) of the ZB population and MJ population was −0.18729 and 0.03256, respectively. The genetic differentiation (Fst) between the ZB and MJ subpopulations was 0.00255102. The expected heterozygosity (He) of individuals from ZB and MJ was 0.33585 and 0.22098, respectively. The observed heterozygosity (Ho) of individuals from the ZB population and MJ population was 0.46834 and 0.23103, respectively (Table 3).
The heatmap showed positive correlations between the individuals of L. kasmira. In general, the correlations between individuals within the ZB population were the strongest, followed by those between the ZB population and MJ population, and the correlations between individuals within the MJ population were the weakest (Figure 2). The POP revealed the genetic distances between the 30 individuals, clustering MLGs based on genetic distance. The distances between individuals from the ZB population and MJ population were within the range of 0.002~0.004, indicating relatively short distances, consistent with other analysis results. Each MLG is a node, and the distance between the nodes represents the genetic distance between individuals (Figure 3). The phylogenetic tree revealed no significant clustering of the 30 L. kasmira samples (Figure 4). The population structure of L. kasmira was analyzed by Admixture software. Assuming that the number of groups (K value) is 1–10, the cross-validation error is maximal when K = 7 (Figure 5a,b). Therefore, the 30 samples of L. kasmira collected in this study were not from the same population. The genetic backgrounds of the ZB and MJ populations were complex, and there was admixture between the populations, which might be explained by the coexistence of artificial breeding and wild resources. The cross-validation results of the clustering showed that when K = 1 (Figure 5a), the error rate of cross-validation was minimal, indicating that the optimal clustering number was 1. It is speculated that L. kasmira individuals in the ZB and MJ populations came from the same primitive ancestor (Figure 5b). The results of PCA showed that the 30 L. kasmira individuals were tightly clustered (Figure 6a,b) and the genetic heterogeneity between individuals was small, which was consistent with the phylogenetic tree results.

4. Discussion

RAD-seq is a simplified genome sequencing technology based on whole-genome restriction sites developed on the basis of second-generation sequencing [11]. The number of RAD markers developed by this method is 10 times higher than that of traditional molecular marker development technology [11], with high accuracy and high data utilization [25]. RAD-seq shortens the marker development cycle compared to that of traditional markers and reduces experimental costs [26]. The technology can also screen for SNPs on a large scale in species without a reference genome [27]. SNPs are a new type of DNA molecular marker with broad application prospects [28]. SNPs occur at a high frequency and have a high marker density in most genomes. Compared with simple sequence repeat (SSR) markers, SNPs have higher genetic stability and are easier to automate [29]. RAD-seq technology can also be used to construct linkage maps [30]. For example, Palaiokostas et al. used RAD-seq technology to construct the first linkage map of Dicentrarchus labrax based on high-density SNPs [31].
In previous studies, genetic diversity was studied mainly by SSR analysis and D-loop sequence analysis [32], but these techniques have inherent difficulties in obtaining high-quality DNA from wild individuals [33]. By referring to the study of 29 Rhinopithecus roxellana by Zhang et al. [34], we used RAD-seq to detect SNP markers in 30 L. kasmira individuals in this study and further analyzed the genetic diversity levels of different populations of this species. Based on a study of L. kasmira in the South China Sea by microsatellite analysis [32], further exploration was performed. A comparison of the results of this study with those of other studies shows that the degree of variation of L. kasmira in the ZB and MJ areas is low. This reflects its p ability to adapt to environmental change and respond to natural selection. Therefore, it is necessary to investigate the wild population as soon as possible and determine how to improve its genetic diversity. A larger sample size would produce more statistically robust results. More samples should be collected in different regions for more comprehensive genetic diversity analysis in the future.
In the phylogenetic tree based on RAD-seq data, the 30 samples of L. kasmira did not form obvious groups, and the population structure diagram also showed that they came from the same ancestor. Similar results were obtained with PCA, which were mutually confirmed with the results of the phylogenetic tree. The genome-wide nucleotide diversity (π) of the ZB population and MJ population was 0.02478 and 0.02154, respectively, indicating high nucleotide diversity. The expected heterozygosity (He) of individuals from ZB and MJ was 0.33585 and 0.22098, respectively. However, the observed heterozygosity (Ho) of individuals from the ZB population and MJ population was 0.46834 and 0.23103, respectively. The He of the two populations was lower than the Ho, indicating a low degree of variation for L. kasmira in the two areas and a certain degree of heterozygote deficiency. The genetic differentiation (Fst) between the MJ and ZB subpopulations was 0.00255102. The Fst value was consistent with the results of the heatmap and MSN. The distance between individuals was short, and differentiation was not obvious. Although π was high, He and Ho were low. The overall analysis showed that the population structure of L. kasmira was simple and had a low degree of variation, which might lead to poor adaptability to the environment. Furthermore, the genetic diversity of the MJ population was lower than that of the ZB population.
These results may be due to overfishing and global warming, which have reduced the genetic diversity of wild populations. Therefore, there is an urgent need to protect the population genetic resources of L. kasmira, and we can improve its genetic diversity through fishing restriction protection measures and artificial breeding of superior varieties. It is suggested that effective population size analysis and population history tracing should be performed for L. kasmira.

5. Conclusions

In this study, SNP data obtained by RAD-seq technology were used to analyze the genetic diversity in two populations of L. kasmira, providing a new approach for genetic diversity evaluation. The results showed that the genetic diversity of the two populations was relatively low at the genome level. To ensure adequate survival of the species, it is necessary to protect existing diversity and take measures to improve genetic diversity. To promote the healthy and sustainable development of germplasm resources of L. kasmira, much attention should be given to improving and maintaining its population genetic diversity, to implementing methods to increase gene flow, and to breeding excellent varieties by applying molecular breeding techniques.
Finally, our results indicate that the RAD-seq technique can detect SNP markers and apply them to the research of genetic diversity, with the benefits of a huge number of markers, low costs, and simple automation. This study is useful for the conservation of aquatic germplasm resources as well as for the development and utilization of high-quality resources.

Author Contributions

Conceptualization, D.Z. and S.J.; methodology, F.Z. and L.G.; software, L.G.; validation, F.Z. and J.Y.; formal analysis, F.Z.; investigation, K.Z.; resources, N.Z.; data curation, F.Z.; writing—original draft preparation, F.Z.; writing—review and editing, D.Z.; visualization, F.Z.; supervision, H.G. and B.L. (Bo Liu); project administration, B.L. (Baosuo Liu). All authors have read and agreed to the published version of the manuscript.

Funding

This research was funded by the Financial Fund of the Ministry of Agriculture and Rural Affairs, P. R. of China (NHYYSWZZZYKZX2020) and National Marine Genetic Resource Center, and China-ASEAN Maritime Cooperation Fund.

Institutional Review Board Statement

All applicable international, national, and institutional guidelines for the care were followed by the authors.

Informed Consent Statement

Informed consent was obtained from all subjects involved in the study. Written informed consent has been obtained from the patients to publish this paper.

Data Availability Statement

All data generated or analyzed during this study are included in this published article.

Conflicts of Interest

The authors declare no conflict of interest.

References

  1. Niu, W.; Huang, Y.; Zhang, C.; Pu, T.; Lu, Y.; Jia, T.; You, Y.; Du, Y.; Mao, Y.; Ding, C. Development and Characterization of 31 SNP Markers for the Crested Ibis (Nipponia nippon). Conserv. Genet. Resour. 2021, 13, 5–7. [Google Scholar] [CrossRef]
  2. Li, Y.; Lou, F.; Song, P.; Liu, S.; Siyal, F.K.; Lin, L. New Perspective on the Genetic Structure and Habitat Adaptation of Pampus Minor off the Coast of China Based on RAD-Seq. Comp. Biochem. Physiol. Part D Genom. Proteom. 2021, 39, 100865. [Google Scholar] [CrossRef] [PubMed]
  3. Catanese, G.; Trotta, J.R.; Iriondo, M.; Grau, A.M.; Estonba, A. Discovery of SNP Markers of Red Shrimp Aristeus Antennatus for Population Structure in Western Mediterranean Sea. Conserv. Genet. Resour. 2021, 13, 21–25. [Google Scholar] [CrossRef]
  4. Chaves, C.L.; Blanc-Jolivet, C.; Sebbenn, A.M.; Mader, M.; Meyer-Sand, B.R.V.; Paredes-Villanueva, K.; Honorio Coronado, E.N.; Garcia-Davila, C.; Tysklind, N.; Troispoux, V.; et al. Nuclear and Chloroplastic SNP Markers for Genetic Studies of Timber Origin for Hymenaea Trees. Conserv. Genet. Resour. 2019, 11, 329–331. [Google Scholar] [CrossRef]
  5. Yue, L.; Zhang, S.; Zhang, L.; Liu, Y.; Cheng, F.; Li, G.; Zhang, S.; Zhang, H.; Sun, R.; Li, F. Heterotic Prediction of Hybrid Performance Based on Genome-Wide SNP Markers and the Phenotype of Parental Inbred Lines in Heading Chinese Cabbage (Brassica rapa L. Ssp. Pekinensis). Sci. Hortic. 2022, 296, 110907. [Google Scholar] [CrossRef]
  6. Vignon, M.; Morat, F.; Galzin, R.; Sasal, P. Evidence for Spatial Limitation of the Bluestripe Snapper Lutjanus Kasmira in French Polynesia from Parasite and Otolith Shape Analysis. J. Fish Biol. 2008, 73, 2305–2320. [Google Scholar] [CrossRef]
  7. Zhang, J.; Chen, Z. Variation in the population characteristics of blue-striped snapper Lutjanus kasmira in the South China Sea in recent 20years. Oceanol. Limnol. Sin. 2020, 51, 114–124. [Google Scholar]
  8. Tan, W.; Wang, Z. Structure and Evolution of Complete Mitochondrial Genome of Lutjanus kasmira. In Proceedings of the 12th Annual Conference of China Association for Science and Technology; The Transformation of Economic Development Pattern and Independent Innovation, Fuzhou, China, 1–3 November 2010; Volume 3, pp. 1143–1150. [Google Scholar]
  9. Tang, C.; Xiao, L.; Zhang, Q.; Zhou, Q.; Xu, S.; Wang, Y. DNA barcoding of some Lutjanus species in China and its adjacent sea areas based on COI gene. Mar. Fish. 2019, 41, 129–137. [Google Scholar] [CrossRef]
  10. Davey, J.W.; Blaxter, M.L. RADSeq: Next-Generation Population Genetics. Brief. Funct. Genom. 2010, 9, 416–423. [Google Scholar] [CrossRef]
  11. Wang, Y.; Hu, Y. Current status and perspective of RAD-seq in genomic research. Hereditas 2014, 36, 41–49. [Google Scholar] [CrossRef]
  12. Catchen, J.M.; Amores, A.; Hohenlohe, P.; Cresko, W.; Postlethwait, J.H. Stacks: Building and Genotyping Loci De Novo from Short-Read Sequences. G3 Genes Genomes Genet. 2011, 1, 171–182. [Google Scholar] [CrossRef]
  13. Paris, J.R.; Stevens, J.R.; Catchen, J.M. Lost in Parameter Space: A Road Map for stacks. Methods Ecol. Evol. 2017, 8, 1360–1373. [Google Scholar] [CrossRef] [Green Version]
  14. Mastretta-Yanes, A.; Arrigo, N.; Alvarez, N.; Jorgensen, T.H.; Piñero, D.; Emerson, B.C. Restriction Site-Associated DNA Sequencing, Genotyping Error Estimation and de Novo Assembly Optimization for Population Genetic Inference. Mol. Ecol. Resour. 2015, 15, 28–41. [Google Scholar] [CrossRef]
  15. Rochette, N.C.; Catchen, J.M. Deriving Genotypes from RAD-Seq Short-Read Data Using Stacks. Nat. Protoc. 2017, 12, 2640–2659. [Google Scholar] [CrossRef]
  16. Sun, L.; Gan, J.; Jiang, L.; Wu, R. Recursive Test of Hardy-Weinberg Equilibrium in Tetraploids. Trends Genet. 2021, 37, 504–513. [Google Scholar] [CrossRef]
  17. Kamvar, Z.N.; Tabima, J.F.; Grunwald, N.J. Poppr: An R Package for Genetic Analysis of Populations with Clonal, Partially Clonal, and/or Sexual Reproduction. PeerJ 2014, 2, e281. [Google Scholar] [CrossRef] [Green Version]
  18. Schaub, F.X.; Dhankani, V.; Berger, A.C.; Trivedi, M.; Richardson, A.B.; Shaw, R.; Zhao, W.; Zhang, X.; Ventura, A.; Liu, Y.; et al. Pan-Cancer Alterations of the MYC Oncogene and Its Proximal Network across the Cancer Genome Atlas. Cell Syst. 2018, 6, 282–300.e2. [Google Scholar] [CrossRef] [Green Version]
  19. Kamvar, Z.N.; Larsen, M.M.; Kanaskie, A.M.; Hansen, E.M.; Grünwald, N.J. Spatial and Temporal Analysis of Populations of the Sudden Oak Death Pathogen in Oregon Forests. Phytopathology 2015, 105, 982–989. [Google Scholar] [CrossRef] [Green Version]
  20. Felsenstein, J. PHYLIP (Phylogeny Inference Package), version 3.6; Distributed by the author; Department of Genome Sciences, University of Washington: Seattle, DC, USA, 2005. [Google Scholar]
  21. Parry, R.M.; Wang, M.D. A Fast Least-Squares Algorithm for Population Inference. BMC Bioinform. 2013, 14, 28. [Google Scholar] [CrossRef] [Green Version]
  22. Wang, M.; Du, W.; Tang, R.; Liu, Y.; Zou, X.; Yuan, D.; Wang, Z.; Liu, J.; Guo, J.; Yang, X.; et al. Genomic History and Forensic Characteristics of Sherpa Highlanders on the Tibetan Plateau Inferred from High-Resolution InDel Panel and Genome-Wide SNPs. Forensic Sci. Int. Genet. 2022, 56, 102633. [Google Scholar] [CrossRef]
  23. Wang, J.; Zhang, Z. Analysis of the Genetic Structure and Diversity of Upland Cotton Groups in Different Planting Areas Based on SNP Markers. Gene 2022, 809, 146042. [Google Scholar] [CrossRef]
  24. Yang, J.; Lee, S.H.; Goddard, M.E.; Visscher, P.M. GCTA: A Tool for Genome-Wide Complex Trait Analysis. Am. J. Hum. Genet. 2011, 88, 76–82. [Google Scholar] [CrossRef] [Green Version]
  25. Lecaudey, L.A.; Schliewen, U.K.; Osinov, A.G.; Taylor, E.B.; Bernatchez, L.; Weiss, S.J. Inferring Phylogenetic Structure, Hybridization and Divergence Times within Salmoninae (Teleostei: Salmonidae) Using RAD-Sequencing. Mol. Phylogenet. Evol. 2018, 124, 82–99. [Google Scholar] [CrossRef]
  26. Zhou, W.; Ji, X.; Obata, S.; Pais, A.; Dong, Y.; Peet, R.; Xiang, Q.-Y.J. Resolving Relationships and Phylogeographic History of the Nyssa Sylvatica Complex Using Data from RAD-Seq and Species Distribution Modeling. Mol. Phylogenet. Evol. 2018, 126, 1–16. [Google Scholar] [CrossRef]
  27. Díaz-Arce, N.; Arrizabalaga, H.; Murua, H.; Irigoien, X.; Rodríguez-Ezpeleta, N. RAD-Seq Derived Genome-Wide Nuclear Markers Resolve the Phylogeny of Tunas. Mol. Phylogenet. Evol. 2016, 102, 202–207. [Google Scholar] [CrossRef] [Green Version]
  28. Singha, H.; Vorimore, F.; Saini, S.; Deshayes, T.; Saqib, M.; Tripathi, B.N.; Laroucau, K. Molecular Epidemiology of Burkholderia Mallei Isolates from India (2015–2016): New SNP Markers for Strain Tracing. Infect. Genet. Evol. 2021, 95, 105059. [Google Scholar] [CrossRef]
  29. Bao, W.; Ao, D.; Wuyun, T.; Wang, L.; Bai, S.; Bai, Y. Development and Characterization of 72 SNP Markers in Armeniaca Sibirica Based on Transcriptomics. Conserv. Genet. Resour. 2020, 12, 373–378. [Google Scholar] [CrossRef]
  30. Fukuda, S.; Nagano, Y.; Matsuguma, K.; Ishimoto, K.; Hiehata, N.; Nagano, A.J.; Tezuka, A.; Yamamoto, T. Construction of a High-Density Linkage Map for Bronze Loquat Using RAD-Seq. Sci. Hortic. 2019, 251, 59–64. [Google Scholar] [CrossRef]
  31. Palaiokostas, C.; Bekaert, M.; Khan, M.G.Q.; Taggart, J.B.; Gharbi, K.; McAndrew, B.J.; Penman, D.J. Mapping and Validation of the Major Sex-Determining Region in Nile Tilapia (Oreochromis niloticus L.) Using RAD Sequencing. PLoS ONE 2013, 8, e68389. [Google Scholar] [CrossRef]
  32. Li, P.; Wang, Z.; Guo, Y.; Liu, L.; Liu, C. Microsatellite analysis of Lutjanus bengalensis and L. Kasmira. J. Oceanogr. Taiwan Strait 2011, 30, 517–521. [Google Scholar]
  33. Park, S.-H.; Scheffler, J.A.; Ray, J.D.; Scheffler, B.E. Identification of Simple Sequence Repeat (SSR) and Single Nucleotide Polymorphism (SNP) That Are Associated with the Nectariless Trait of Gossypium hirsutum L. Euphytica 2021, 217, 78. [Google Scholar] [CrossRef]
  34. Zhang, Y.; Zhou, Y.; Liu, X.; Yu, H.; Li, D.; Zhang, Y. Genetic Diversity of the Sichuan Snub-Nosed Monkey (Rhinopithecus roxellana) in Shennongjia National Park, China Using RAD-Seq Analyses. Genetica 2019, 147, 327–335. [Google Scholar] [CrossRef]
Figure 1. Locations of the 30 collected Lutjanus kasmira.
Jmse 10 01547 g001
Figure 2. The distance matrix heatmap of 30 individuals of L. kasmira created using the R package poppr.
Jmse 10 01547 g002
Figure 3. The minimum spanning network of 30 L. kasmira individuals.
Jmse 10 01547 g003
Figure 4. Phylogenetic tree of 30 L. kasmira individuals based on SNP loci created using the neighbor-joining method.
Jmse 10 01547 g004
Figure 5. The group structure diagrams. (a) The cross-validation error for L. kasmira according to the admixture value K; (b) results of Bayesian cluster analysis of L. kasmira based on SNP loci using ADMIXTURE software for K = 1–10 clusters.
Jmse 10 01547 g005
Figure 6. Population relationships of the collected L. kasmira individuals. (a) Principal component analysis (PCA) plot of 30 L. kasmira individuals based on all SNP loci between the ZB and MJ populations. A and B represent the MJ population and ZB population, respectively; (b) three−dimensional PCA clustering map of 30 L. kasmira individuals based on all SNP loci between the ZB and MJ populations. A and B represent the MJ population and ZB population, respectively.
Jmse 10 01547 g006
Table 1. Sample information for the 30 L. kasmira collected in Zhubi Dao and Meiji Dao.
Sample
ID
Sample
Location
Length (mm)Sampling DateSample
ID
Sample
Location
Length
(mm)
Sampling
Date
ZB_SDDD_1Zhubi Dao1362019MJ_SDDD_1Meiji Dao1532019
ZB_SDDD_2Zhubi Dao1462019MJ_SDDD_2Meiji Dao1792019
ZB_SDDD_3Zhubi Dao1502019MJ_SDDD_3Meiji Dao1532019
ZB_SDDD_4Zhubi Dao1282019MJ_SDDD_4Meiji Dao1642019
ZB_SDDD_5Zhubi Dao1332019MJ_SDDD_5Meiji Dao1232019
ZB_SDDD_6Zhubi Dao1372019MJ_SDDD_6Meiji Dao1542019
ZB_SDDD_7Zhubi Dao1462019MJ_SDDD_7Meiji Dao1262019
ZB_SDDD_8Zhubi Dao1482019MJ_SDDD_8Meiji Dao1372019
ZB_SDDD_9Zhubi Dao1522019MJ_SDDD_9Meiji Dao1462019
ZB_SDDD_10Zhubi Dao1392019MJ_SDDD_10Meiji Dao1252019
ZB_SDDD_11Zhubi Dao1202019MJ_SDDD_11Meiji Dao1432019
ZB_SDDD_12Zhubi Dao1492019MJ_SDDD_12Meiji Dao1352019
ZB_SDDD_13Zhubi Dao1322019MJ_SDDD_13Meiji Dao1542019
ZB_SDDD_14Zhubi Dao1252019MJ_SDDD_14Meiji Dao1442019
ZB_SDDD_15Zhubi Dao1652019
ZB_SDDD_16Zhubi Dao1432019
Table 2. Statistics for the genomic data obtained from 30 L. kasmira individuals.
Sample IDNumber of
Clean Reads
Bases (Q20%)GC%Sample IDNumber of
Clean Reads
Bases (Q20%)GC%
ZB_SDDD_17,974,07099.3239MJ_SDDD_19,265,89195.3239
ZB_SDDD_26,867,44496.1240MJ_SDDD_213,500,65796.7539
ZB_SDDD_311,342,74293.6439MJ_SDDD_39,120,59899.3039
ZB_SDDD_46,831,67295.4040MJ_SDDD_412,363,57399.6439
ZB_SDDD_510,947,35296.3240MJ_SDDD_58,022,13998.2039
ZB_SDDD_68,673,00298.8939MJ_SDDD_610,972,36597.6739
ZB_SDDD_78,040,81096.6339MJ_SDDD_714,935,27394.0339
ZB_SDDD_87,251,35797.6039MJ_SDDD_810,483,10296.4339
ZB_SDDD_98,440,58096.3040MJ_SDDD_99,245,79894.6039
ZB_SDDD_107,441,15594.5639MJ_SDDD_106,732,76398.7539
ZB_SDDD_118,497,49993.2139MJ_SDDD_119,673,99495.3039
ZB_SDDD_126,672,06395.6339MJ_SDDD_129,046,08798.0039
ZB_SDDD_139,912,87499.1139MJ_SDDD_136,814,09295.1939
ZB_SDDD_147,340,57498.6539MJ_SDDD_147,280,37796.3239
ZB_SDDD_1521,514,65299.3039
ZB_SDDD_1611,059,67597.2139
Table 3. Comparison of population genetic parameters in the ZB population and MJ population.
Population IDπHoHeAverage_FisFst
ZB population0.024780.468340.33585−0.187290.00255102
MJ population0.021540.231030.220980.03256
Publisher’s Note: MDPI stays neutral with regard to jurisdictional claims in published maps and institutional affiliations.

