Mortality Prediction of the CHA2DS2-VASc Score, the HAS-BLED Score, and Their Combination in Anticoagulated Patients with Atrial Fibrillation

 , ,
, , 
Abstract
:1. Introduction
2. Methods
2.1. Registry Data and Patients’ Population
2.2. Outcomes
2.3. Statistical Methods
3. Results
3.1. Patient Characteristics
3.2. Outcome Distributions
3.3. Logistic Regression Analysis Results
3.3.1. CHA2DS2-VASc Risk Score
3.3.2. HAS-BLED Risk Score
3.3.3. CHA2DS2-VASc and HAS-BLED Combined
4. Discussion
4.1. Previous Study Comparisons: Scores for Stroke vs. Scores for Bleeding
4.2. Previous Studies for Mortality Prediction in Atrial Fibrillation
4.3. Added Value of the Present Study from the PREFER in AF Registry
5. Limitations
6. Conclusions
Supplementary Materials
Author Contributions
Funding
Conflicts of Interest
Abbreviations
| AF | Atrial fibrillation |
| ATRIA | AnTicoagulation and Risk factors In Atrial fibrillation |
| AUC | Area under the curve |
| CHADS2 | Congestive heart failure, hypertension, age ≥ 75 years, diabetes, stroke/transient ischemic attack/thromboembolism [doubled] |
| CHA2DS2-VASc | Congestive heart failure, hypertension, age ≥ 75 years [doubled], diabetes, stroke/transient ischemic attack/thromboembolism [doubled], vascular disease [prior myocardial infarction, peripheral artery disease, or aortic plaque], age 65–75 years, sex category [female] |
| CRUSADE | Can Rapid risk stratification of Unstable angina patients Suppress ADverse outcomes with Early implementation of the ACC/AHA guidelines |
| DACH | Germany (Deutschland), Austria, Switzerland (Confederatio Helvetica) |
| eCRF | Electronic case report form |
| GOF | Hosmer and Lemeshow goodness-of-fit test |
| GRACE | Global Registry of Acute Coronary Events |
| HAS-BLED | hypertension, abnormal renal/liver function, stroke, bleeding history or predisposition, labile international normalized ratio [INR], elderly [age ≥ 65 years], drugs/alcohol concomitantly |
| IDI | Integrated discrimination improvement |
| ISTH | International Society on Thrombosis and Haemostasis |
| NRI | Net reclassification improvement |
| NOAC | non-vitamin K antagonist oral anticoagulant |
| PREFER in AF | Prevention of Thromboembolic Events—European Registry in Atrial Fibrillation” study |
| SD | Standard deviation of the mean |
| SEE | Systemic embolic event |
| TIA | Transient ischemic attack |
| TIMI | Thrombolysis In Myocardial Infarction |
| VKA | Vitamin K antagonist |
References
- January, C.T.; Wann, L.S.; Calkins, H.; Chen, L.Y.; Cigarroa, J.E.; Cleveland, J.C., Jr.; Ellinor, P.T.; Ezekowitz, M.D.; Field, M.E.; Furie, K.L.; et al. 2019 AHA/ACC/HRS Focused Update of the 2014 AHA/ACC/HRS Guideline for the Management of Patients with Atrial Fibrillation: A Report of the American College of Cardiology/American Heart Association Task Force on Clinical Practice Guidelines and the Heart Rhythm Society. J. Am. Coll. Cardiol. 2019, 74, 104–132. [Google Scholar] [PubMed]
- Hindricks, G.; Potpara, T.; Dagres, N.; Arbelo, E.; Bax, J.J.; Blomström-Lundqvist, C.; Boriani, G.; Castella, M.; Dan, G.-A.; Dilaveris, P.E.; et al. 2020 ESC Guidelines for the diagnosis and management of atrial fibrillation developed in collaboration with the European Association of Cardio-Thoracic Surgery (EACTS): The Task Force for the diagnosis and management of atrial fibrillation of the European Society of Cardiology (ESC) Developed with the special contribution of the European Heart Rhythm Association (EHRA) of the ESC. Eur. Heart J. 2020. [Google Scholar] [CrossRef]
- Olesen, J.B.; Lip, G.Y.; Hansen, M.L.; Hansen, P.R.; Tolstrup, J.S.; Lindhardsen, J.; Selmer, C.; Ahlehoff, O.; Olsen, A.M.; Gislason, G.H.; et al. Validation of risk stratification schemes for predicting stroke and thromboembolism in patients with atrial fibrillation: Nationwide cohort study. BMJ 2011, 342, d124. [Google Scholar] [CrossRef] [PubMed] [Green Version]
- Renda, G.; Ricci, F.; Patti, G.; Aung, N.; Petersen, S.E.; Gallina, S.; Hamrefors, V.; Melander, O.; Sutton, R.; Engstrom, G.; et al. CHA2DS2VASc score and adverse outcomes in middle-aged individuals without atrial fibrillation. Eur. J. Prev. Cardiol. 2019, 26, 1987–1997. [Google Scholar] [CrossRef] [PubMed]
- Angiolillo, D.J.; Patti, G.; Chan, K.T.; Han, Y.; Huang, W.C.; Yakovlev, A.; Paek, D.; Del Aguila, M.; Girotra, S.; Sibbing, D. De-escalation from ticagrelor to clopidogrel in acute coronary syndrome patients: A systematic review and meta-analysis. J. Thromb. Thrombolysis 2019, 48, 1–10. [Google Scholar] [CrossRef] [PubMed] [Green Version]
- Melgaard, L.; Gorst-Rasmussen, A.; Lane, D.A.; Rasmussen, L.H.; Larsen, T.B.; Lip, G.Y. Assessment of the CHA2DS2-VASc score in predicting ischemic stroke, thromboembolism, and death in patients with heart failure with and without atrial fibrillation. JAMA 2015, 314, 1030–1038. [Google Scholar] [CrossRef] [PubMed] [Green Version]
- Lip, G.Y.; Lin, H.J.; Chien, K.L.; Hsu, H.C.; Su, T.C.; Chen, M.F.; Lee, Y.T. Comparative assessment of published atrial fibrillation stroke risk stratification schemes for predicting stroke, in a non-atrial fibrillation population: The Chin-Shan Community Cohort Study. Int. J. Cardiol. 2013, 168, 414–419. [Google Scholar] [CrossRef]
- Hrynkiewicz-Szymanska, A.; Dluzniewski, M.; Platek, A.E.; Szymanski, F.M.; Syska-Suminska, J.; Klos-Szadryn, A.; Glinka, M.; Strojek, M.; Kuciej, A.; Tomaszewska-Kiecana, M. Association of the CHADS2 and CHA 2DS 2-VASc scores with left atrial enlargement: A prospective cohort study of unselected atrial fibrillation patients. J. Thromb. Thrombolysis 2015, 40, 240–247. [Google Scholar] [CrossRef] [Green Version]
- Pisters, R.; Lane, D.A.; Nieuwlaat, R.; de Vos, C.B.; Crijns, H.J.; Lip, G.Y. A novel user-friendly score (HAS-BLED) to assess 1-year risk of major bleeding in patients with atrial fibrillation: The Euro Heart Survey. Chest 2010, 138, 1093–1100. [Google Scholar] [CrossRef] [Green Version]
- Kirchhof, P.; Ammentorp, B.; Darius, H.; De Caterina, R.; Le Heuzey, J.Y.; Schilling, R.J.; Schmitt, J.; Zamorano, J.L. Management of atrial fibrillation in seven European countries after the publication of the 2010 ESC Guidelines on atrial fibrillation: Primary results of the PREvention oF thromboemolic events—European Registry in Atrial Fibrillation (PREFER in AF). Europaceschu 2014, 16, 6–14. [Google Scholar] [CrossRef]
- Schulman, S.; Kearon, C.; Subcommittee on Control of Anticoagulation of the Scientific Standardization Committee of the International Society on Thrombosis and Haemostasis. Definition of major bleeding in clinical investigations of antihemostatic medicinal products in non-surgical patients. J. Thromb. Haemost. 2005, 3, 692–694. [Google Scholar] [CrossRef] [PubMed]
- Steyerberg, E.W.; Vickers, A.J.; Cook, N.R.; Gerds, T.; Gonen, M.; Obuchowski, N.; Pencina, M.J.; Kattan, M.W. Assessing the performance of prediction models: A framework for traditional and novel measures. Epidemiology 2010, 21, 128–138. [Google Scholar] [CrossRef] [PubMed] [Green Version]
- van Smeden, M.; Moons, K.G.M. Event rate net reclassification index and the integrated discrimination improvement for studying incremental value of risk markers. Stat. Med. 2017, 36, 4495–4497. [Google Scholar] [CrossRef] [PubMed]
- Nezic, D.G. Assessing the performance of risk prediction models. Eur. J. Cardio-Thorac. Surg. 2020, 58, 401. [Google Scholar] [CrossRef]
- Wolf, P.A.; D’Agostino, R.B.; Belanger, A.J.; Kannel, W.B. Probability of stroke: A risk profile from the Framingham Study. Stroke 1991, 22, 312–318. [Google Scholar] [CrossRef] [Green Version]
- Hauk, L. Newly Detected Atrial Fibrillation: AAFP Updates Guideline on Pharmacologic Management. Am. Fam. Phys. 2017, 96, 332–333. [Google Scholar]
- Apostolakis, S.; Lane, D.A.; Buller, H.; Lip, G.Y. Comparison of the CHADS2, CHA2DS2-VASc and HAS-BLED scores for the prediction of clinically relevant bleeding in anticoagulated patients with atrial fibrillation: The AMADEUS trial. Thromb. Haemost. 2013, 110, 1074–1079. [Google Scholar] [CrossRef]
- Yao, X.; Gersh, B.J.; Sangaralingham, L.R.; Kent, D.M.; Shah, N.D.; Abraham, N.S.; Noseworthy, P.A. Comparison of the CHA2DS2-VASc, CHADS2, HAS-BLED, ORBIT, and ATRIA risk scores in predicting non-vitamin K antagonist oral anticoagulants-associated bleeding in patients with atrial fibrillation. Am. J. Cardiol. 2017, 120, 1549–1556. [Google Scholar] [CrossRef]
- Gallego, P.; Roldan, V.; Torregrosa, J.M.; Galvez, J.; Valdes, M.; Vicente, V.; Marin, F.; Lip, G.Y. Relation of the HAS-BLED bleeding risk score to major bleeding, cardiovascular events, and mortality in anticoagulated patients with atrial fibrillation. Circ. Arrhythm. Electrophysiol. 2012, 5, 312–318. [Google Scholar] [CrossRef] [Green Version]
- Hsieh, M.J.; Lee, C.H.; Chen, C.C.; Chang, S.H.; Wang, C.Y.; Hsieh, I.C. Predictive performance of HAS-BLED risk score for long-term survival in patients with non-ST elevated myocardial infarction without atrial fibrillation. J. Cardiol. 2017, 69, 136–143. [Google Scholar] [CrossRef] [Green Version]
- Onuk, T.; Karatas, M.B.; Ipek, G.; Gungor, B.; Akyuz, S.; Canga, Y.; Uzun, A.O.; Avci, I.I.; Osken, A.; Kasikcioglu, H.; et al. Higher CHA2DS2-VASc score is associated with increased mortality in acute pulmonary embolism. Clin. Appl. Thromb. Hemost. 2017, 23, 631–637. [Google Scholar] [CrossRef] [PubMed] [Green Version]
- Paoletti Perini, A.; Bartolini, S.; Pieragnoli, P.; Ricciardi, G.; Perrotta, L.; Valleggi, A.; Vergaro, G.; Michelotti, F.; Boggian, G.; Sassone, B.; et al. CHADS2 and CHA2DS2-VASc scores to predict morbidity and mortality in heart failure patients candidates to cardiac resynchronization therapy. Europace 2014, 16, 71–80. [Google Scholar] [CrossRef] [PubMed] [Green Version]
- Temizer, O.; Acar, B.; Yayla, C.; Unal, S.; Goktug Ertem, A.; Gucuk Ipek, E.; Canpolat, U.; Senturk, B.; Selcuk, H.; Selcuk, T. The association between CHA2DS2-VASc score and mortality in patients with heart failure with reduced ejection fraction. Acta Cardiol. Sin. 2017, 33, 429–435. [Google Scholar] [PubMed]
- Fox, K.A.A.; Lucas, J.E.; Pieper, K.S.; Bassand, J.P.; Camm, A.J.; Fitzmaurice, D.A.; Goldhaber, S.Z.; Goto, S.; Haas, S.; Hacke, W.; et al. Improved risk stratification of patients with atrial fibrillation: An integrated GARFIELD-AF tool for the prediction of mortality, stroke and bleed in patients with and without anticoagulation. BMJ Open 2017, 7, e017157. [Google Scholar] [CrossRef] [Green Version]


| n | % | ||
| Patients | 5209 | 100.0 | |
| Age, mean (SD) | 71.76 | ||
| Male gender | 3145 | 60.4 | |
| Country | |||
| France | 1264 | 24.3 | |
| DACH | 543 | 10.4 | |
| Italy | 1088 | 20.9 | |
| Spain | 1399 | 26.9 | |
| UK | 915 | 17.6 | |
| Education | |||
| Primary school | 2500 | 48.0 | |
| Secondary school | 1651 | 31.7 | |
| University or above | 726 | 13.9 | |
| Missing | 332 | 6.4 | |
| AF Type | |||
| Paroxysmal | 1499 | 28.8 | |
| Persistent | 1239 | 23.8 | |
| Long-standing persistent | 391 | 7.5 | |
| Permanent | 2070 | 39.7 | |
| MIssing | 10 | 0.2 | |
| Medication at Baseline Visit | |||
| NOAC | 305 | 5.9 | |
| VKA | 3548 | 68.1 | |
| Antiplatelet | 540 | 10.4 | |
| VKA+Antiplatelet | 539 | 10.4 | |
| Neither NOAC nor VKA nor Antiplatelet | 277 | 5.3 | |
| Medication at Follow-up visits | |||
| NOAC | 637 | 12.2 | |
| VKA | 3284 | 63.0 | |
| Antiplatelet | 389 | 7.5 | |
| VKA + Antiplatelet | 306 | 5.9 | |
| Neither NOAC nor VKA nor Antiplatelet | 593 | 11.4 | |
| CHA2DS2VASc | |||
| 0 | 233 | 4.5 | |
| 1 | 517 | 9.9 | |
| 2 | 823 | 15.8 | |
| 3 | 1138 | 21.9 | |
| 4 | 1176 | 22.6 | |
| 5 | 722 | 13.9 | |
| 6 | 376 | 7.2 | |
| 7 | 151 | 2.9 | |
| 8 | 63 | 1.2 | |
| 9 | 10 | 0.2 | |
| HAS-BLED | |||
| 0 | 425 | 8.2 | |
| 1 | 1264 | 24.3 | |
| 2 | 1841 | 35.3 | |
| 3 | 1173 | 22.6 | |
| 4 | 396 | 7.6 | |
| 5 | 94 | 1.8 | |
| 6 | 14 | 0.3 | |
| 7 | 2 | 0.0 | |
| Additional comorbities | |||
| 5209 | 100.0 | ||
| Congestive heart failure | 1546 | 29.7 | |
| Hypertension | 3726 | 71.5 | |
| Diabetes mellitus | 1181 | 22.7 | |
| Stroke/TIA | 832 | 16.0 | |
| Vascular disease | 1177 | 22.6 | |
| Renal function | 696 | 13.4 | |
| Liver function | 103 | 2.0 | |
| Stroke | 475 | 9.1 | |
| Bleeding | 244 | 4.7 | |
| Labile INR | 692 | 13.3 | |
| Drug | 1387 | 26.6 | |
| Alcohol | 130 | 2.5 |
| Coefficient | p-Value | Bias | 95% CI (Bias-Corrected) | Log-Likelihood | Homes-LEWESHOW | C-Statistic | 95% CI (Bias-Corrected) | ||||
|---|---|---|---|---|---|---|---|---|---|---|---|
| −522.351 | 1.000 | 0.731 | 0.681 | 0.778 | |||||||
| Stroke/Systemic Embolic Events | |||||||||||
| Congestive heart failure | 0.643 | 0.002 | 0.015 | 0.234 | 1.038 | ||||||
| Hypertension | −0.082 | 0.714 | −0.016 | −0.467 | 0.362 | ||||||
| Age >75 years | 0.534 | 0.089 | 0.023 | −0.059 | 1.190 | ||||||
| Diabetes mellitus | 0.053 | 0.811 | −0.026 | −0.403 | 0.446 | ||||||
| Stroke/transient ischemic attack | 1.017 | 0.000 | 0.011 | 0.625 | 1.308 | ||||||
| Vascular disease | −0.344 | 0.144 | 0.017 | −0.840 | 0.071 | ||||||
| Age 65 to 74 years | 0.037 | 0.917 | 0.022 | −0.634 | 0.576 | ||||||
| Sex category | 0.283 | 0.218 | 0.003 | −0.231 | 0.648 | ||||||
| Abnormal renal function | −0.193 | 0.522 | −0.016 | −0.926 | 0.327 | ||||||
| Abnormal liver function | 1.014 | 0.010 | −0.041 | 0.087 | 1.686 | ||||||
| Bleeding | 0.375 | 0.345 | −0.117 | −0.282 | 1.019 | ||||||
| Labile INR | 0.920 | 0.000 | −0.004 | 0.460 | 1.237 | ||||||
| Drug | 0.872 | 0.000 | −0.024 | 0.494 | 1.312 | ||||||
| Alcohol | 0.690 | 0.183 | −0.020 | −0.502 | 1.551 | ||||||
| Constant | −5.079 | 0.000 | −0.059 | −5.740 | −4.328 | ||||||
| Major bleeding | −628.686 | 0.999 | 0.702 | 0.659 | 0.747 | ||||||
| Congestive heart failure | −0.138 | 0.487 | −0.005 | −0.581 | 0.221 | ||||||
| Hypertension | 0.030 | 0.887 | 0.011 | −0.353 | 0.472 | ||||||
| Age >75 years | 0.661 | 0.015 | 0.035 | 0.066 | 1.119 | ||||||
| Diabetes mellitus | −0.134 | 0.498 | −0.037 | −0.579 | 0.216 | ||||||
| Stroke/transient ischemic attack | −0.136 | 0.582 | 0.022 | −0.546 | 0.388 | ||||||
| Vascular disease | 0.637 | 0.001 | −0.015 | 0.299 | 1.069 | ||||||
| Age 65 to 74 years | −0.107 | 0.708 | 0.020 | −0.618 | 0.368 | ||||||
| Sex category | 0.035 | 0.868 | −0.016 | −0.305 | 0.453 | ||||||
| Abnormal renal function | 0.541 | 0.006 | 0.032 | 0.264 | 1.002 | ||||||
| Abnormal liver function | 0.890 | 0.022 | −0.045 | −0.005 | 1.654 | ||||||
| Bleeding | 1.425 | 0.000 | 0.018 | 0.947 | 1.804 | ||||||
| Labile INR | 0.417 | 0.059 | 0.007 | 0.119 | 0.937 | ||||||
| Drug | 0.219 | 0.263 | −0.013 | −0.043 | 0.677 | ||||||
| Alcohol | 0.904 | 0.023 | −0.077 | 0.174 | 1.527 | ||||||
| Constant | −4.428 | 0.000 | −0.061 | −4.976 | −3.905 | ||||||
| Mortality | −649.047 | 0.233 | 0.740 | 0.699 | 0.780 | ||||||
| Congestive heart failure | 0.802 | 0.000 | 0.001 | 0.365 | 1.075 | ||||||
| Hypertension | −0.453 | 0.013 | 0.015 | −0.811 | −0.129 | ||||||
| Age >75 years | 1.051 | 0.000 | 0.032 | 0.460 | 1.476 | ||||||
| Diabetes mellitus | 0.246 | 0.222 | −0.022 | −0.119 | 0.684 | ||||||
| Stroke/transient ischemic attack | 0.070 | 0.743 | 0.018 | −0.432 | 0.399 | ||||||
| Vascular disease | 0.082 | 0.705 | −0.028 | −0.335 | 0.459 | ||||||
| Age 65 to 74 years | 0.229 | 0.522 | 0.041 | −0.627 | 0.825 | ||||||
| Sex category | 0.010 | 0.958 | −0.032 | −0.365 | 0.333 | ||||||
| Abnormal renal function | 0.969 | 0.000 | 0.032 | 0.481 | 1.269 | ||||||
| Abnormal liver function | 1.003 | 0.001 | −0.032 | 0.399 | 1.602 | ||||||
| Bleeding | 0.420 | 0.152 | −0.047 | −0.229 | 0.829 | ||||||
| Labile INR | 0.111 | 0.661 | −0.009 | −0.411 | 0.539 | ||||||
| Drug | 0.259 | 0.178 | 0.003 | −0.080 | 0.593 | ||||||
| Alcohol | 0.126 | 0.812 | −0.120 | −0.918 | 0.945 | ||||||
| Constant | −4.625 | 0.000 | −0.061 | −5.200 | −4.130 | ||||||
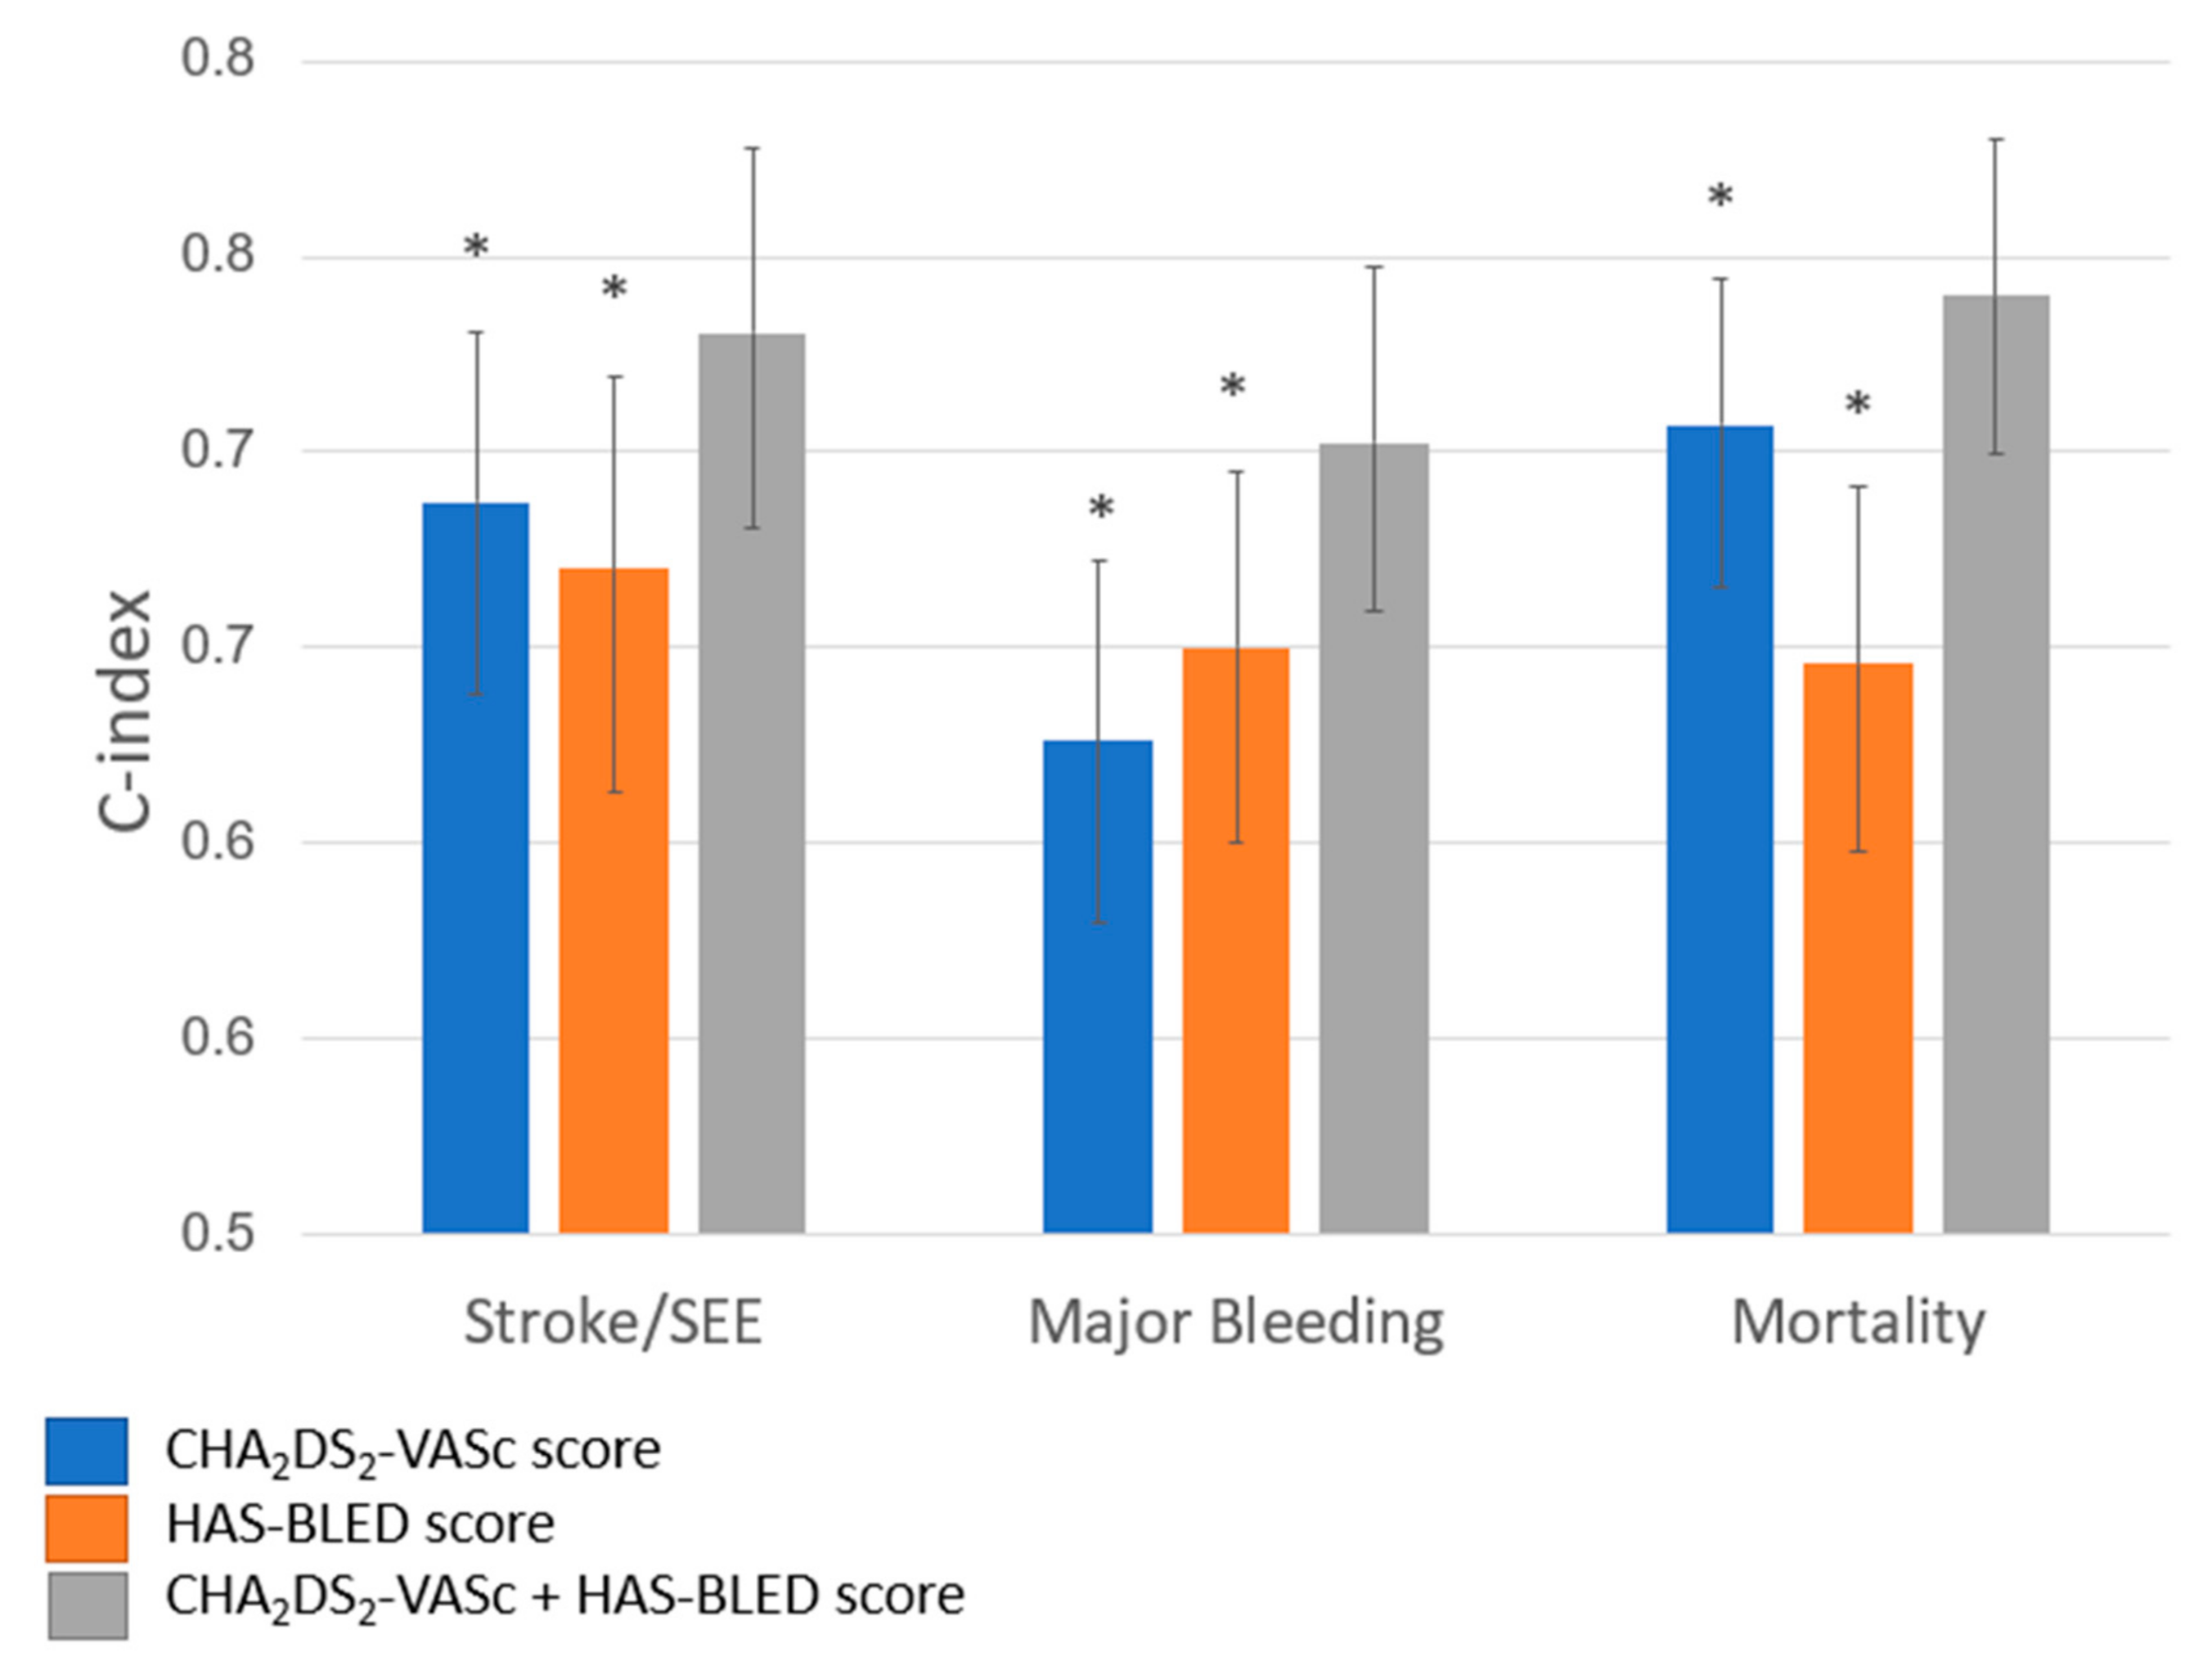
| Outcome | C-Statistic | 95% CI (Bias-Corrected) | p-Value | IDI, % | p-Value | ||
|---|---|---|---|---|---|---|---|
| Stroke/SSE | |||||||
| CHA2DS2-VASc | 0.687 | 0.638 | 0.730 | REF | |||
| CHA2DS2-VASc + HAS-BLED | 0.731 | 0.681 | 0.778 | 0.010 | 3.11 | 0.000 | |
| HAS-BLED | 0.670 | 0.613 | 0.719 | REF | |||
| CHA2DS2-VASc + HAS-BLED | 0.731 | 0.681 | 0.778 | 0.001 | 1.46 | 0.000 | |
| Major bleeding | |||||||
| CHA2DS2-VASc | 0.626 | 0.579 | 0.672 | REF | 2.11 | 0.000 | |
| CHA2DS2-VASc + HAS-BLED | 0.702 | 0.659 | 0.747 | 0.000 | |||
| HAS-BLED | 0.650 | 0.600 | 0.698 | REF | 0.88 | 0.000 | |
| CHA2DS2-VASc + HAS-BLED | 0.702 | 0.659 | 0.747 | 0.002 | |||
| Mortality | |||||||
| CHA2DS2-VASc | 0.707 | 0.666 | 0.744 | REF | |||
| CHA2DS2-VASc + HAS-BLED | 0.740 | 0.700 | 0.779 | 0.005 | 1.79 | 0.000 | |
| HAS-BLED | 0.646 | 0.598 | 0.691 | REF | |||
| CHA2DS2-VASc + HAS-BLED | 0.740 | 0.700 | 0.779 | 0.000 | 1.26 | 0.000 | |
Publisher’s Note: MDPI stays neutral with regard to jurisdictional claims in published maps and institutional affiliations. |
© 2020 by the authors. Licensee MDPI, Basel, Switzerland. This article is an open access article distributed under the terms and conditions of the Creative Commons Attribution (CC BY) license (http://creativecommons.org/licenses/by/4.0/).
Share and Cite
Morrone, D.; Kroep, S.; Ricci, F.; Renda, G.; Patti, G.; Kirchhof, P.; Chuang, L.-H.; van Hout, B.; De Caterina, R. Mortality Prediction of the CHA2DS2-VASc Score, the HAS-BLED Score, and Their Combination in Anticoagulated Patients with Atrial Fibrillation. J. Clin. Med. 2020, 9, 3987. https://doi.org/10.3390/jcm9123987
Morrone D, Kroep S, Ricci F, Renda G, Patti G, Kirchhof P, Chuang L-H, van Hout B, De Caterina R. Mortality Prediction of the CHA2DS2-VASc Score, the HAS-BLED Score, and Their Combination in Anticoagulated Patients with Atrial Fibrillation. Journal of Clinical Medicine. 2020; 9(12):3987. https://doi.org/10.3390/jcm9123987
Chicago/Turabian StyleMorrone, Doralisa, Sonja Kroep, Fabrizio Ricci, Giulia Renda, Giuseppe Patti, Paulus Kirchhof, Ling-Hsiang Chuang, Ben van Hout, and Raffaele De Caterina. 2020. "Mortality Prediction of the CHA2DS2-VASc Score, the HAS-BLED Score, and Their Combination in Anticoagulated Patients with Atrial Fibrillation" Journal of Clinical Medicine 9, no. 12: 3987. https://doi.org/10.3390/jcm9123987