Multi-Omics Characterization of the Spontaneous Mesenchymal–Epithelial Transition in the PMC42 Breast Cancer Cell Lines

 ,
,  ,
,
Abstract
: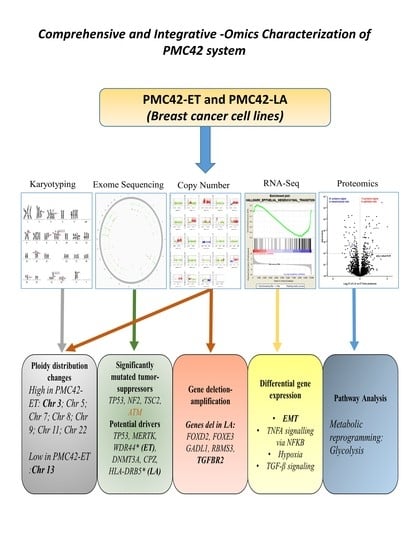
1. Introduction
2. Materials and Methods
2.1. Cell Lines and Cell Culture
2.2. Preparation of Metaphase Spread and Karyotyping
2.3. DNA Extraction, Whole Exome Sequencing and Processing of Sequencing Data
2.4. RNA Extraction, cDNA Synthesis and RT-qPCR
2.5. Whole Transcriptome Sequencing and Analysis of PMC42 Cell Lines
2.6. Data-Independent Acquisition (DIA) Mass Spectrometry of PMC42 Cell Lines
2.7. Fluorescence Activated Cell Sorting (FACS)
2.8. Immunocytochemistry
2.9. Seahorse Metabolic Analyser
2.10. Statistical Analysis
3. Results
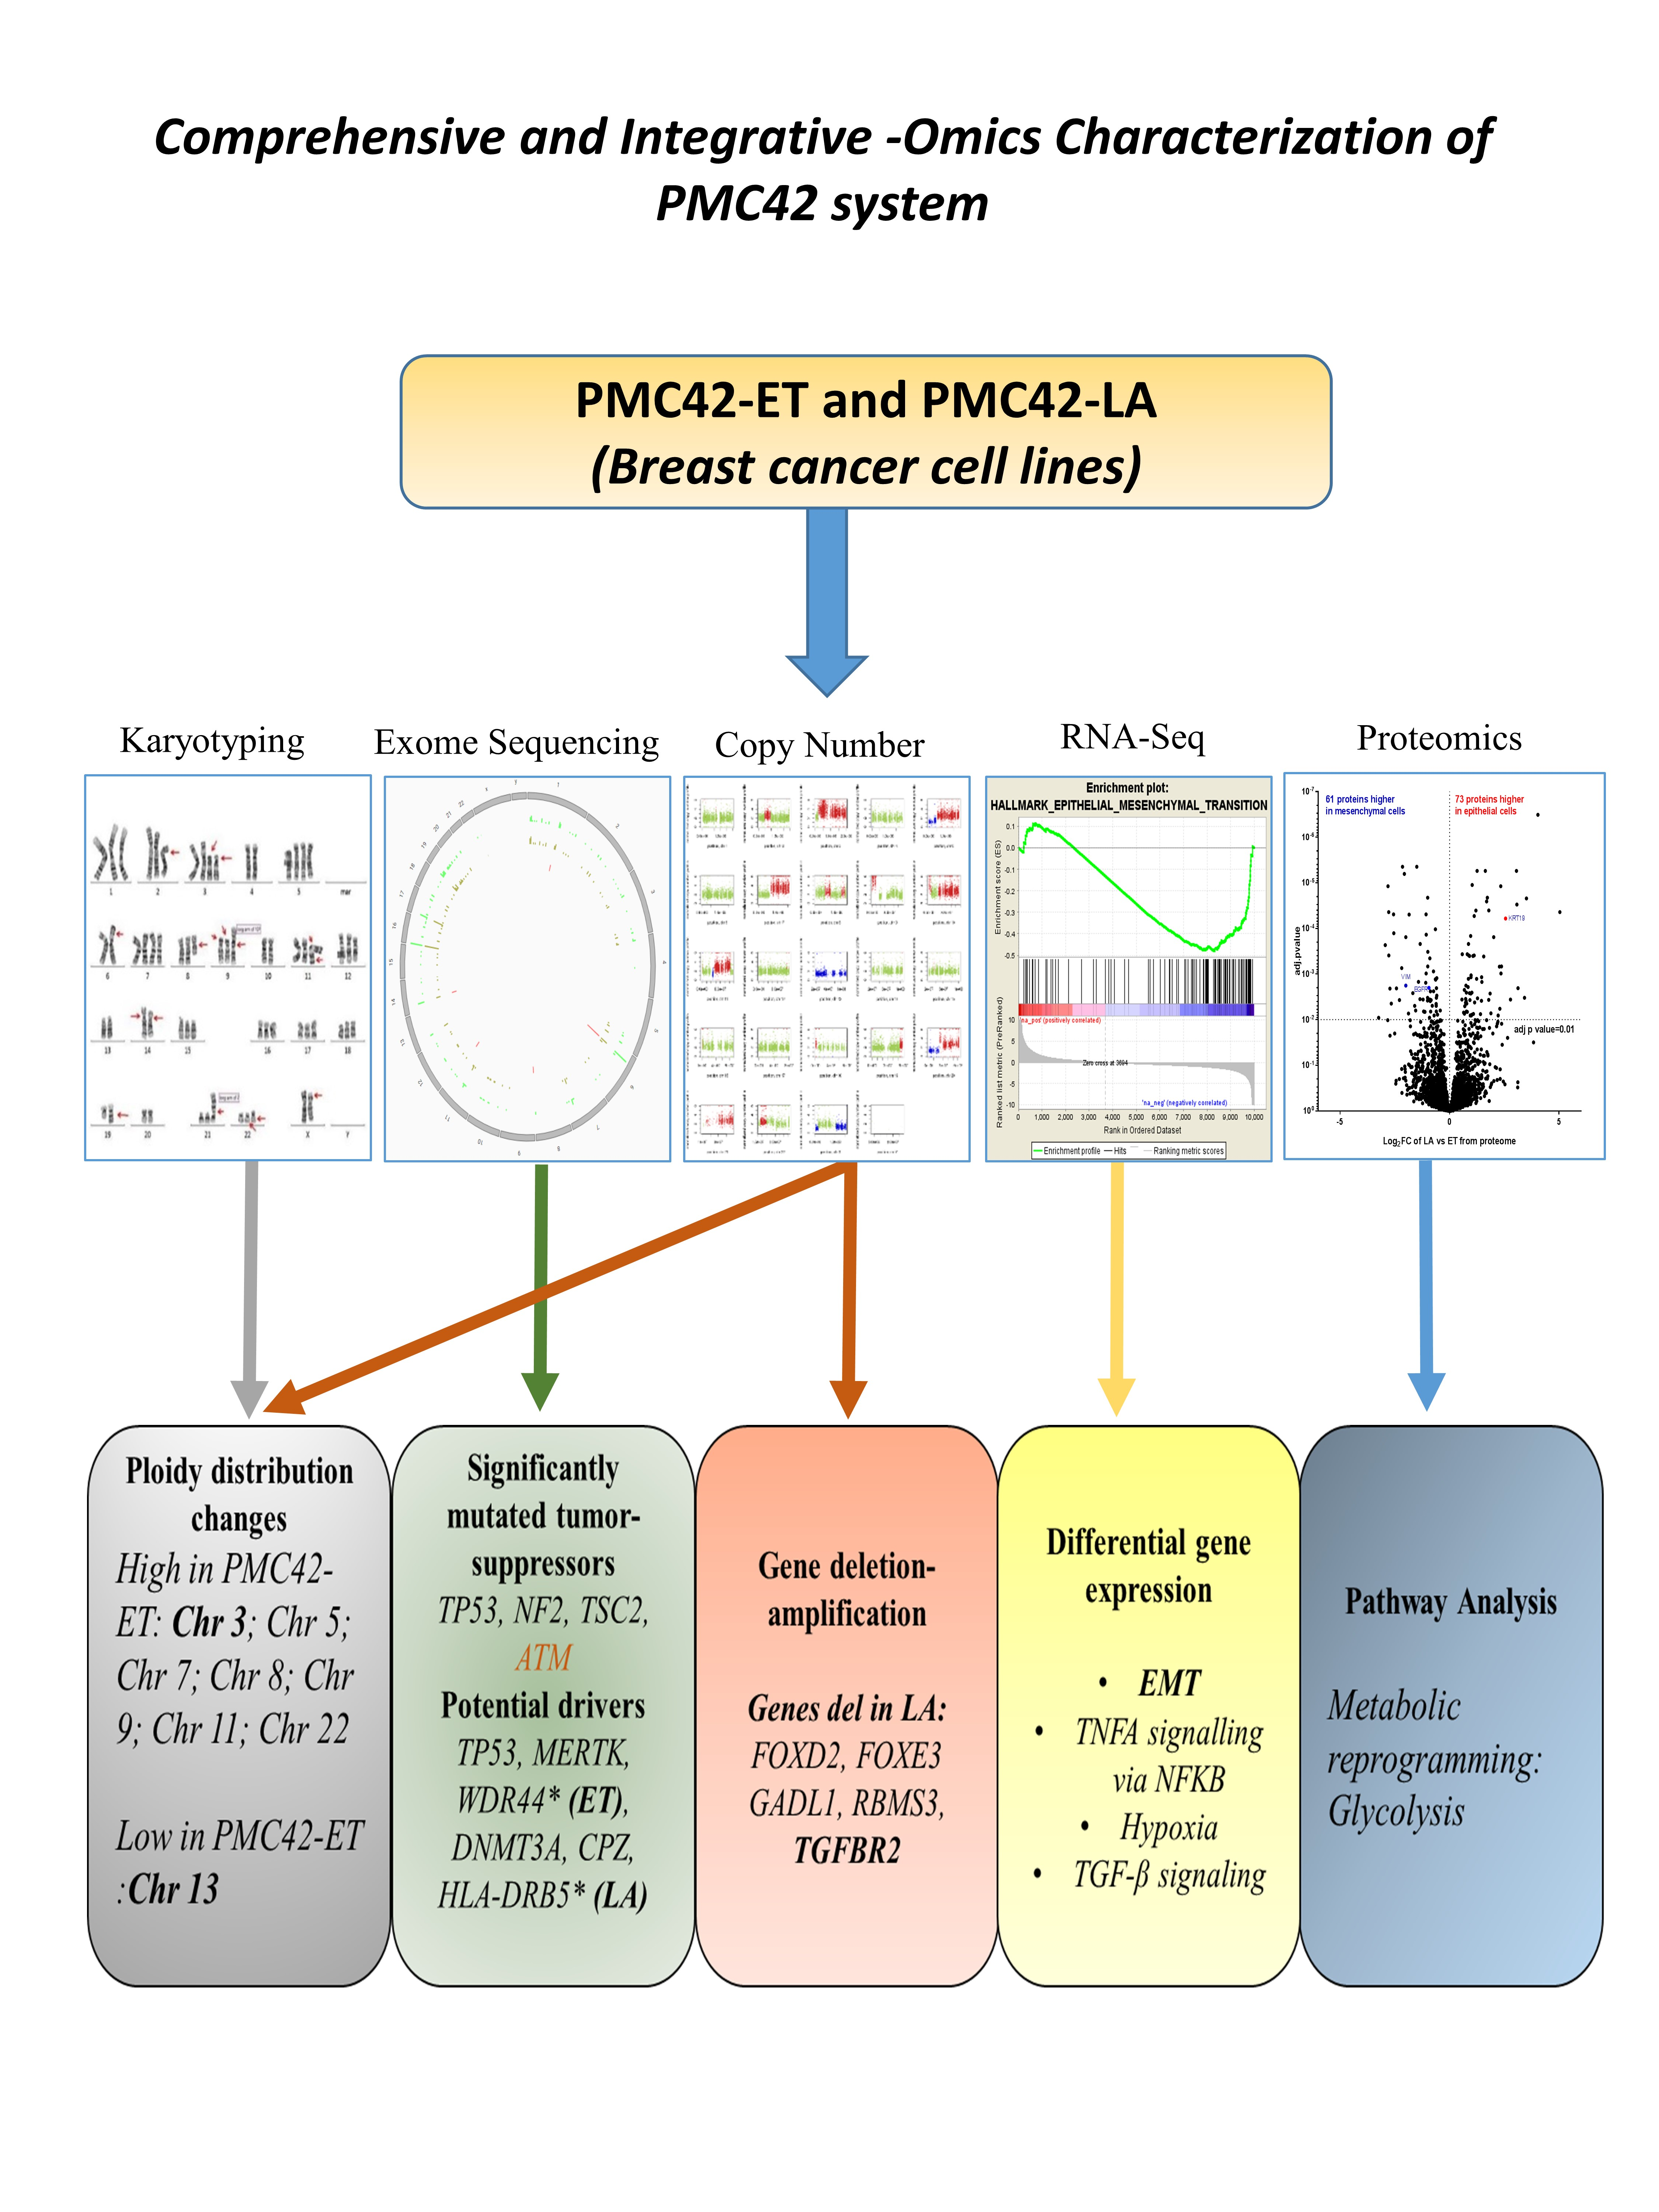
3.1. Comparison of PMC42 Cell Lines with Other BC Cell Lines (Luminal, Basal A and Basal B)
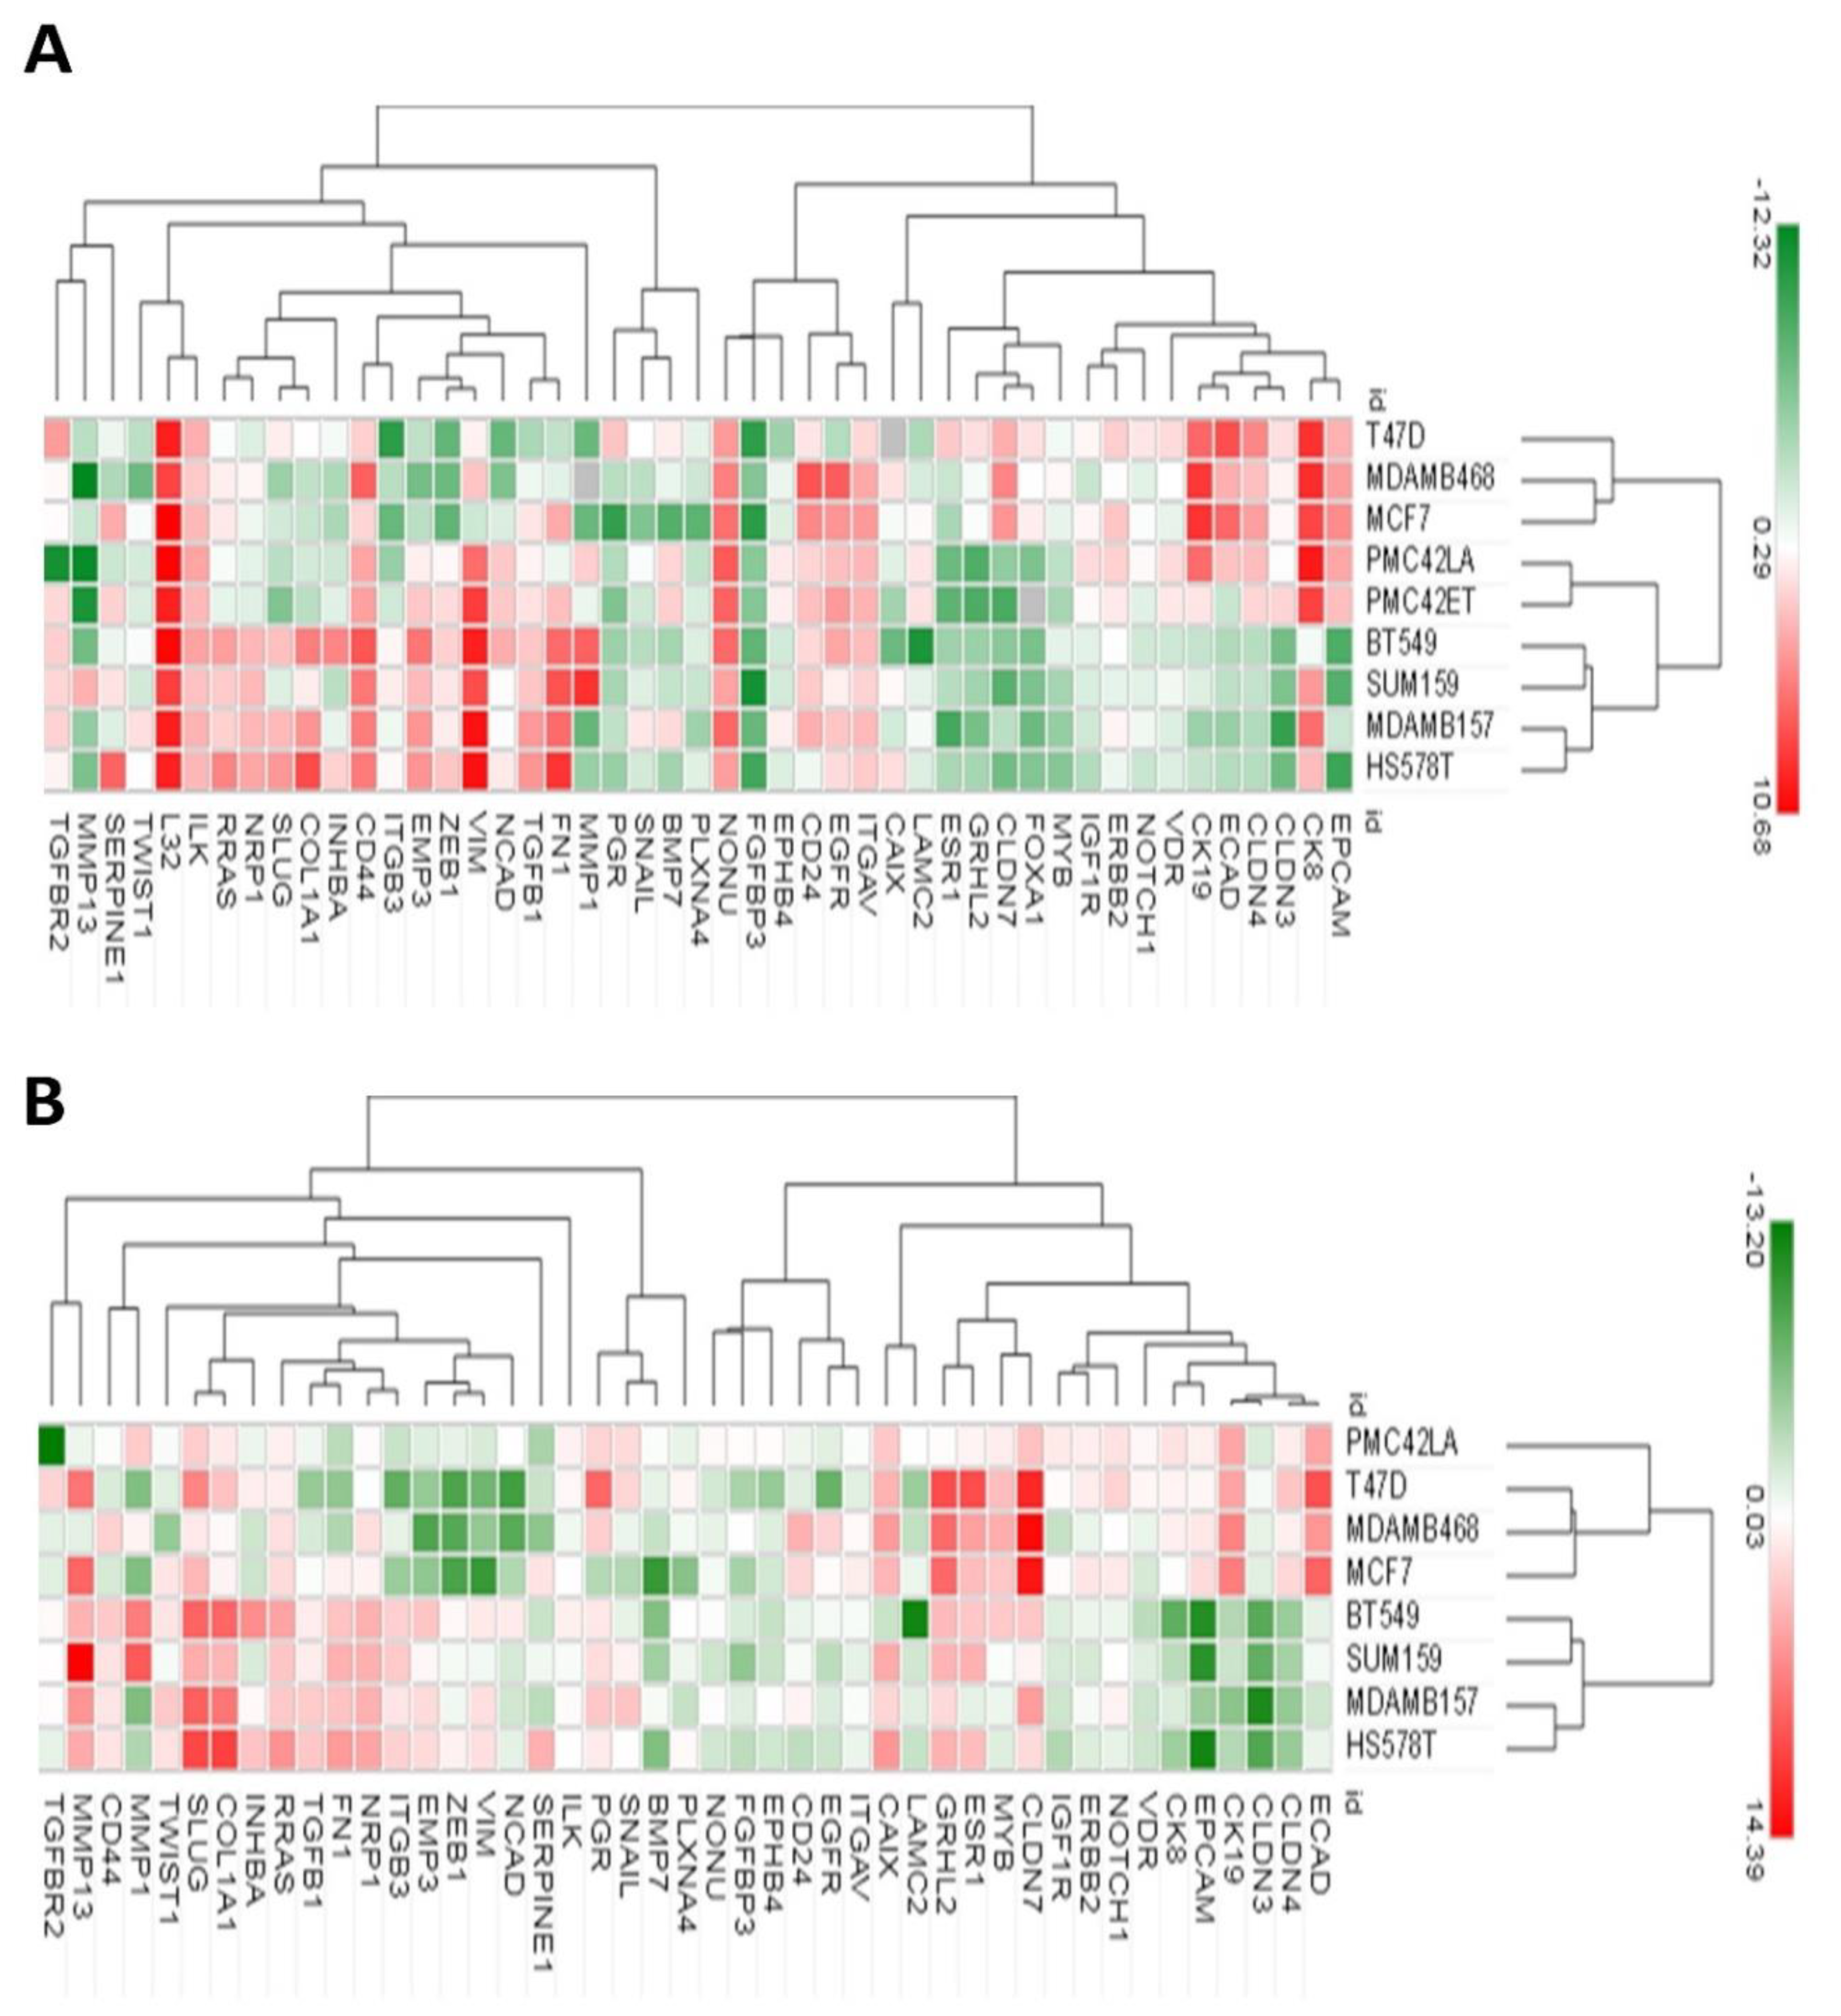
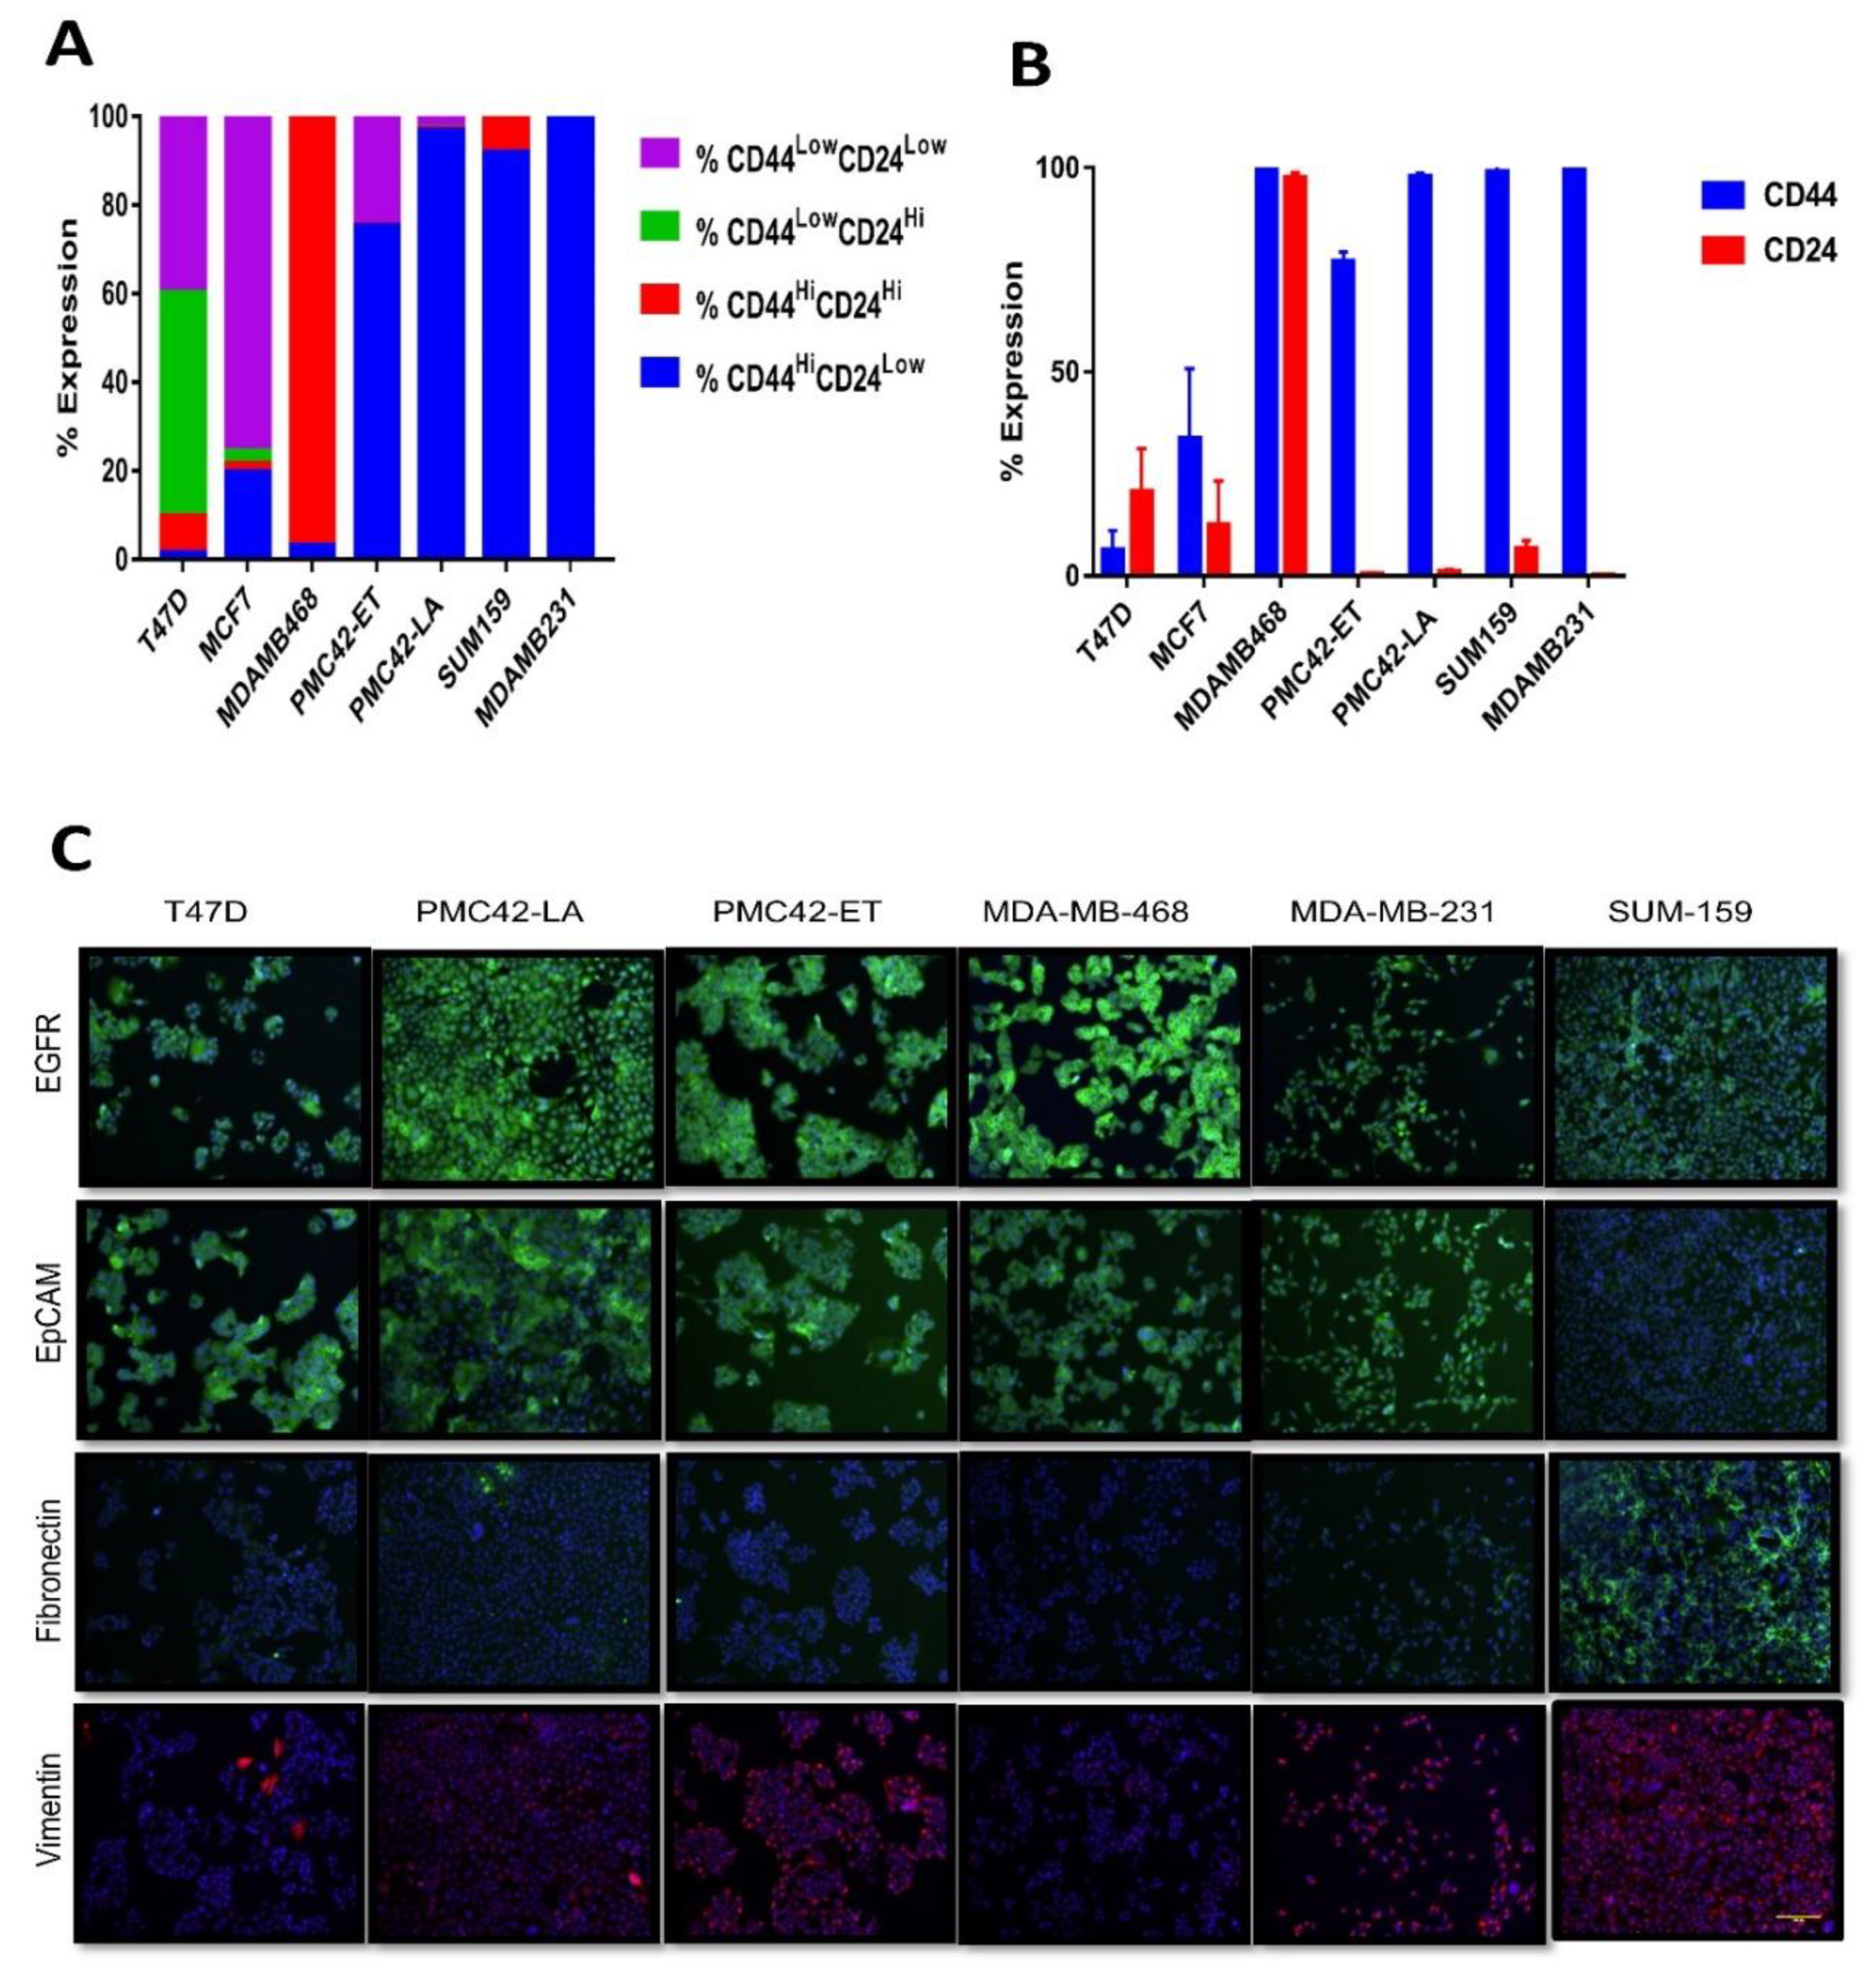
3.2. CD44+CD24−/low Phenotype Association with Breast Molecular Subtypes and Other EMT Markers
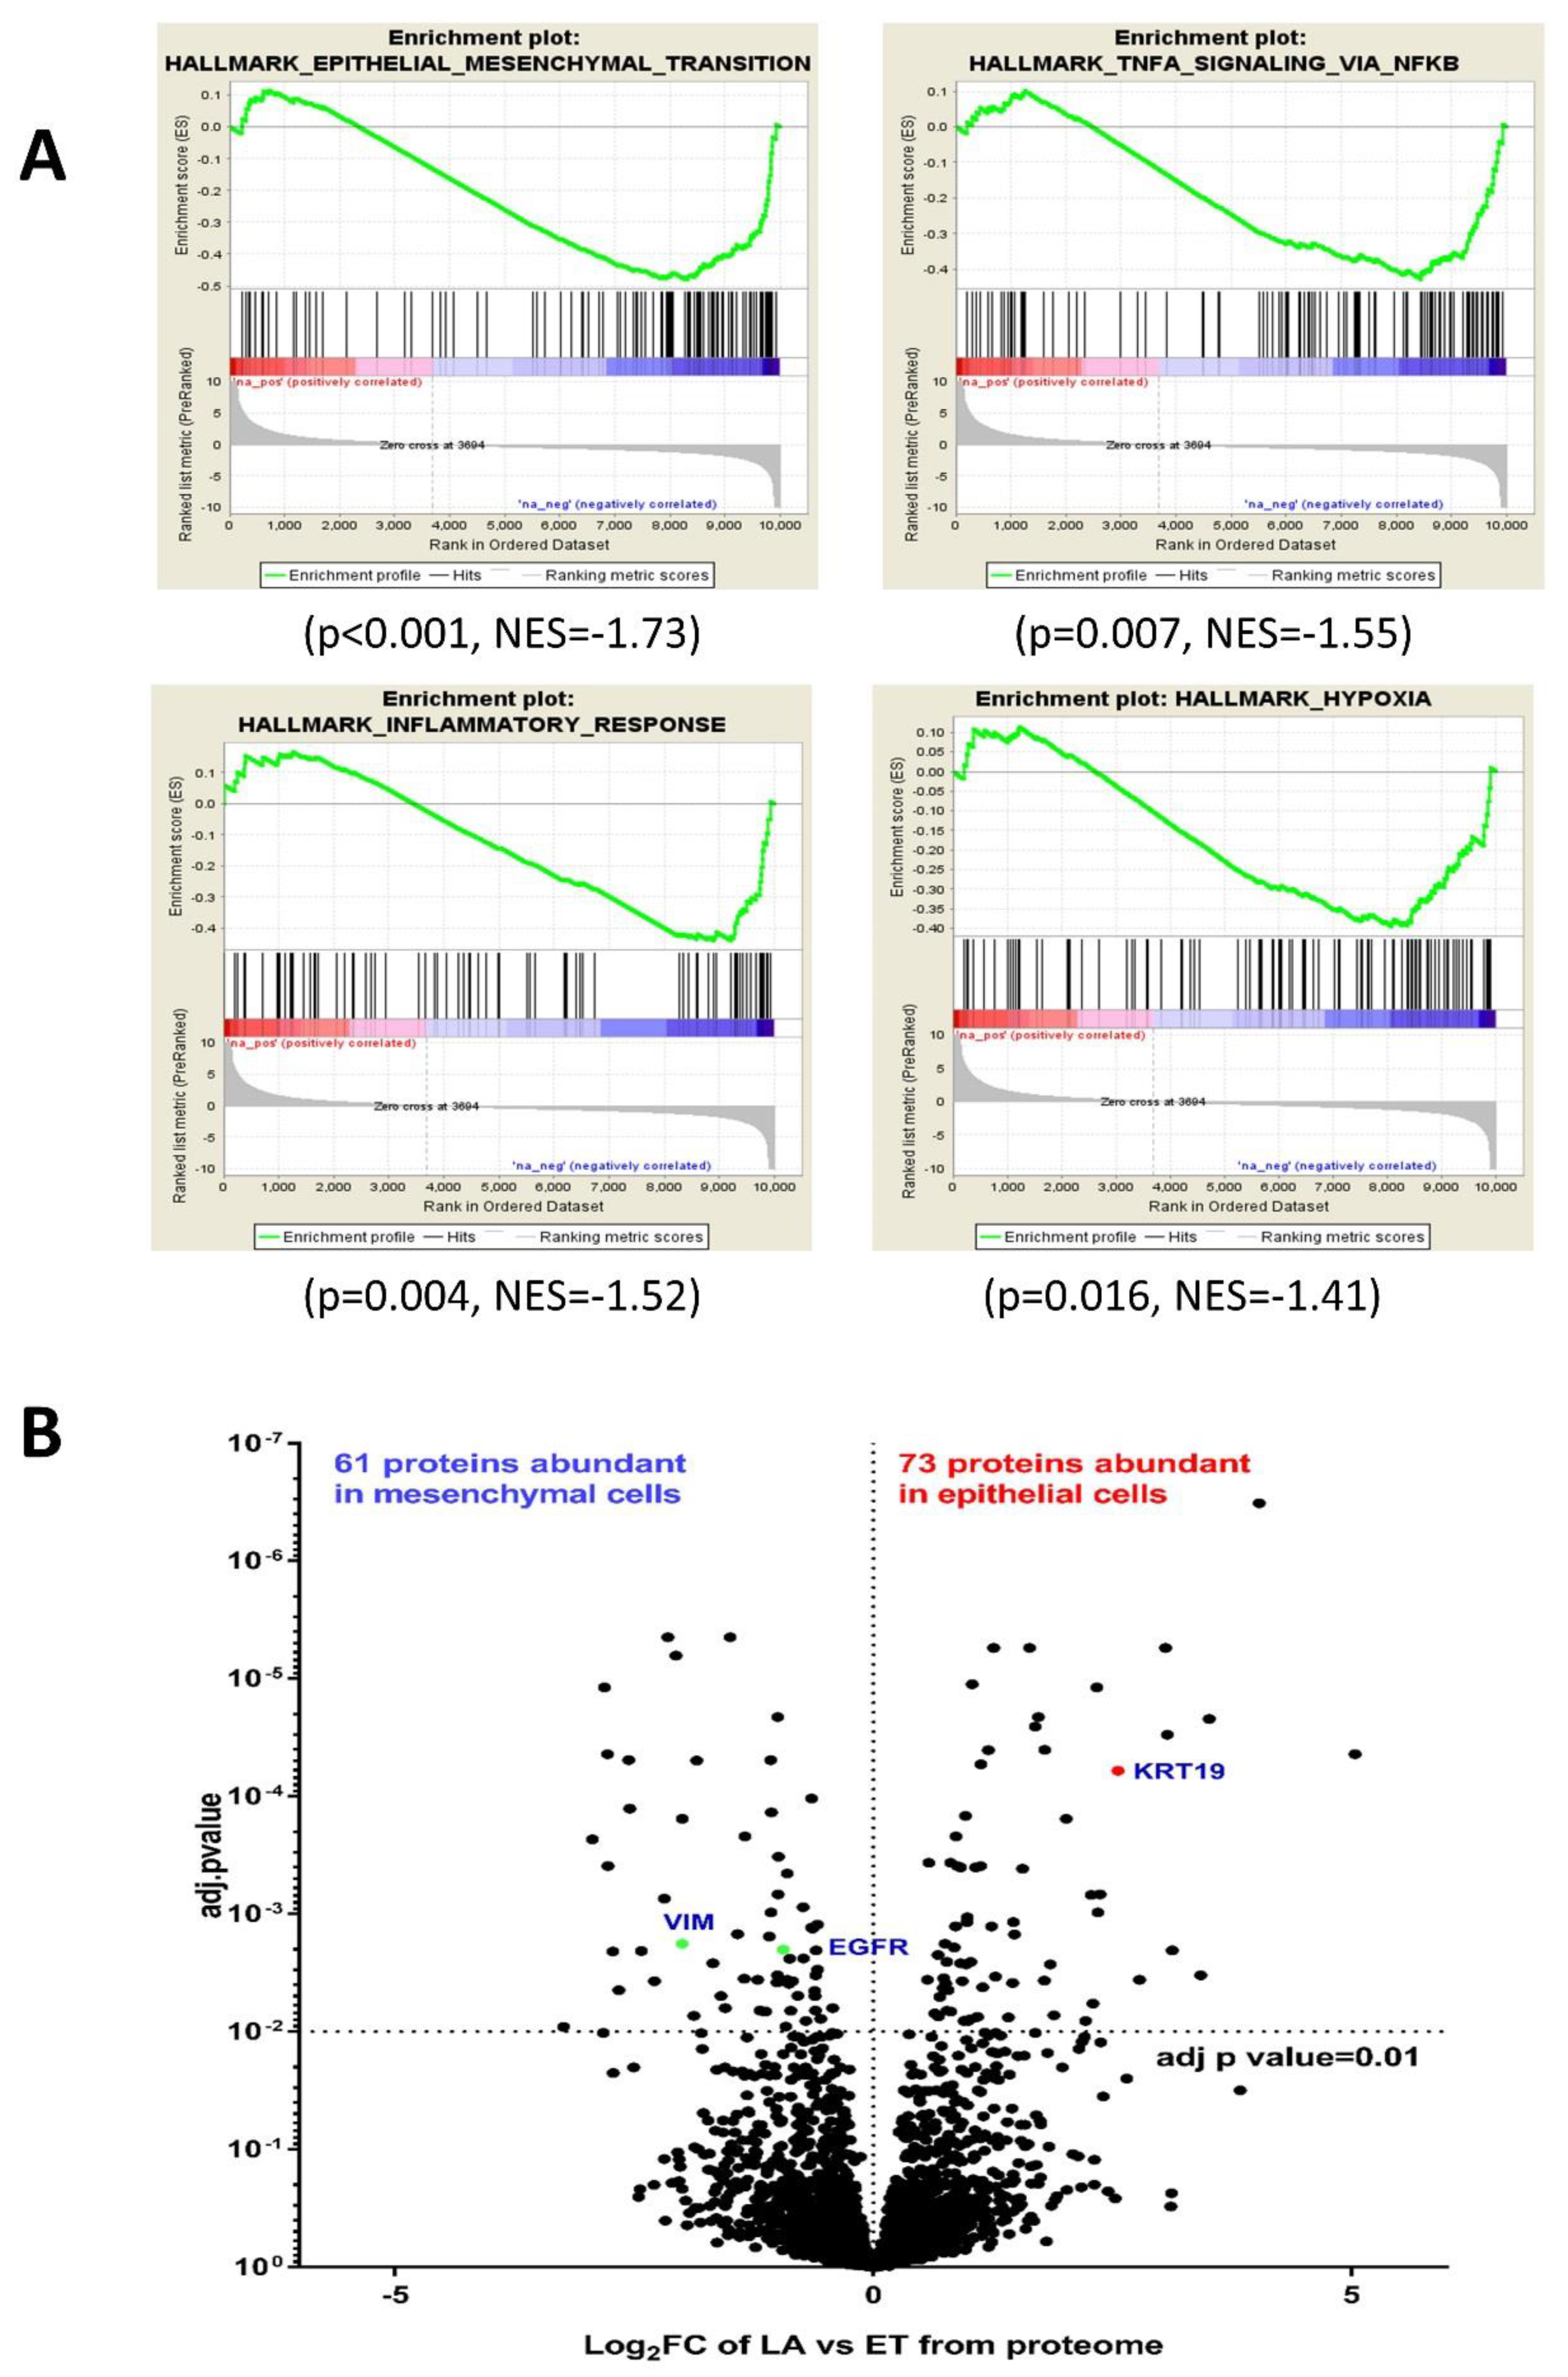
3.3. Comparative RNA-seq Analysis of PMC42 Cell Lines
3.4. Comparative Proteome Quantification of Alterations in the PMC42 Cell Line System
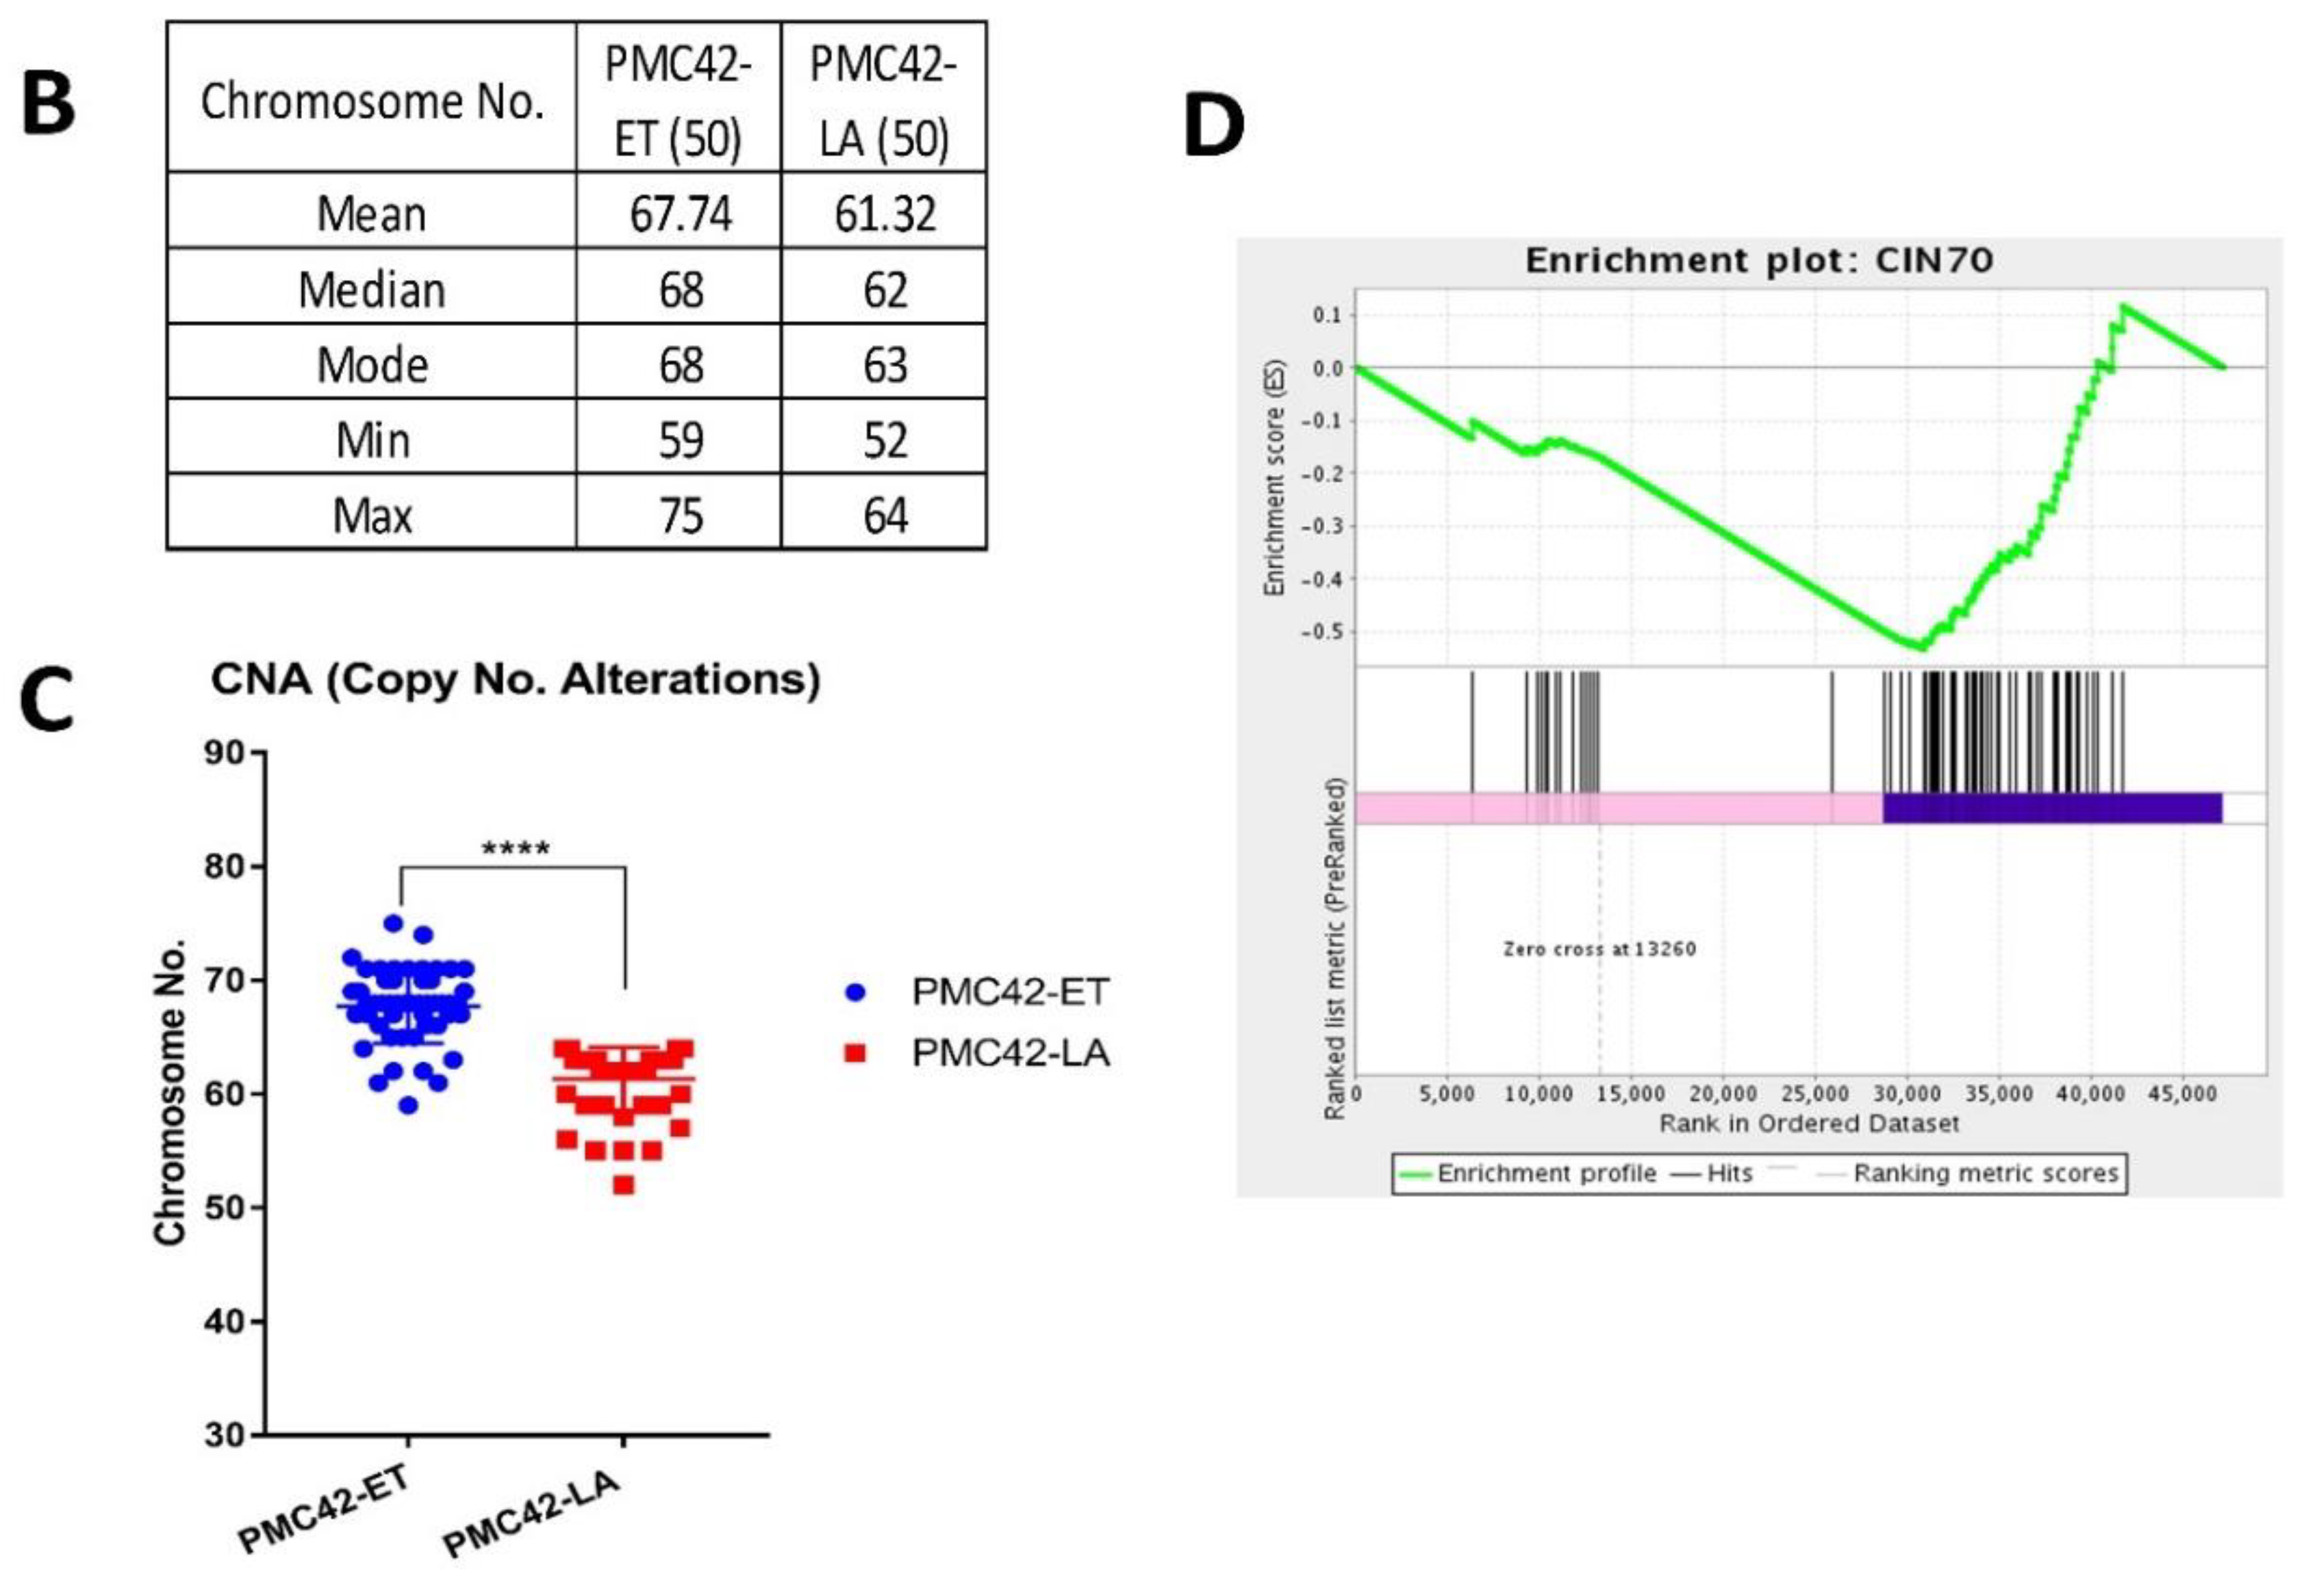
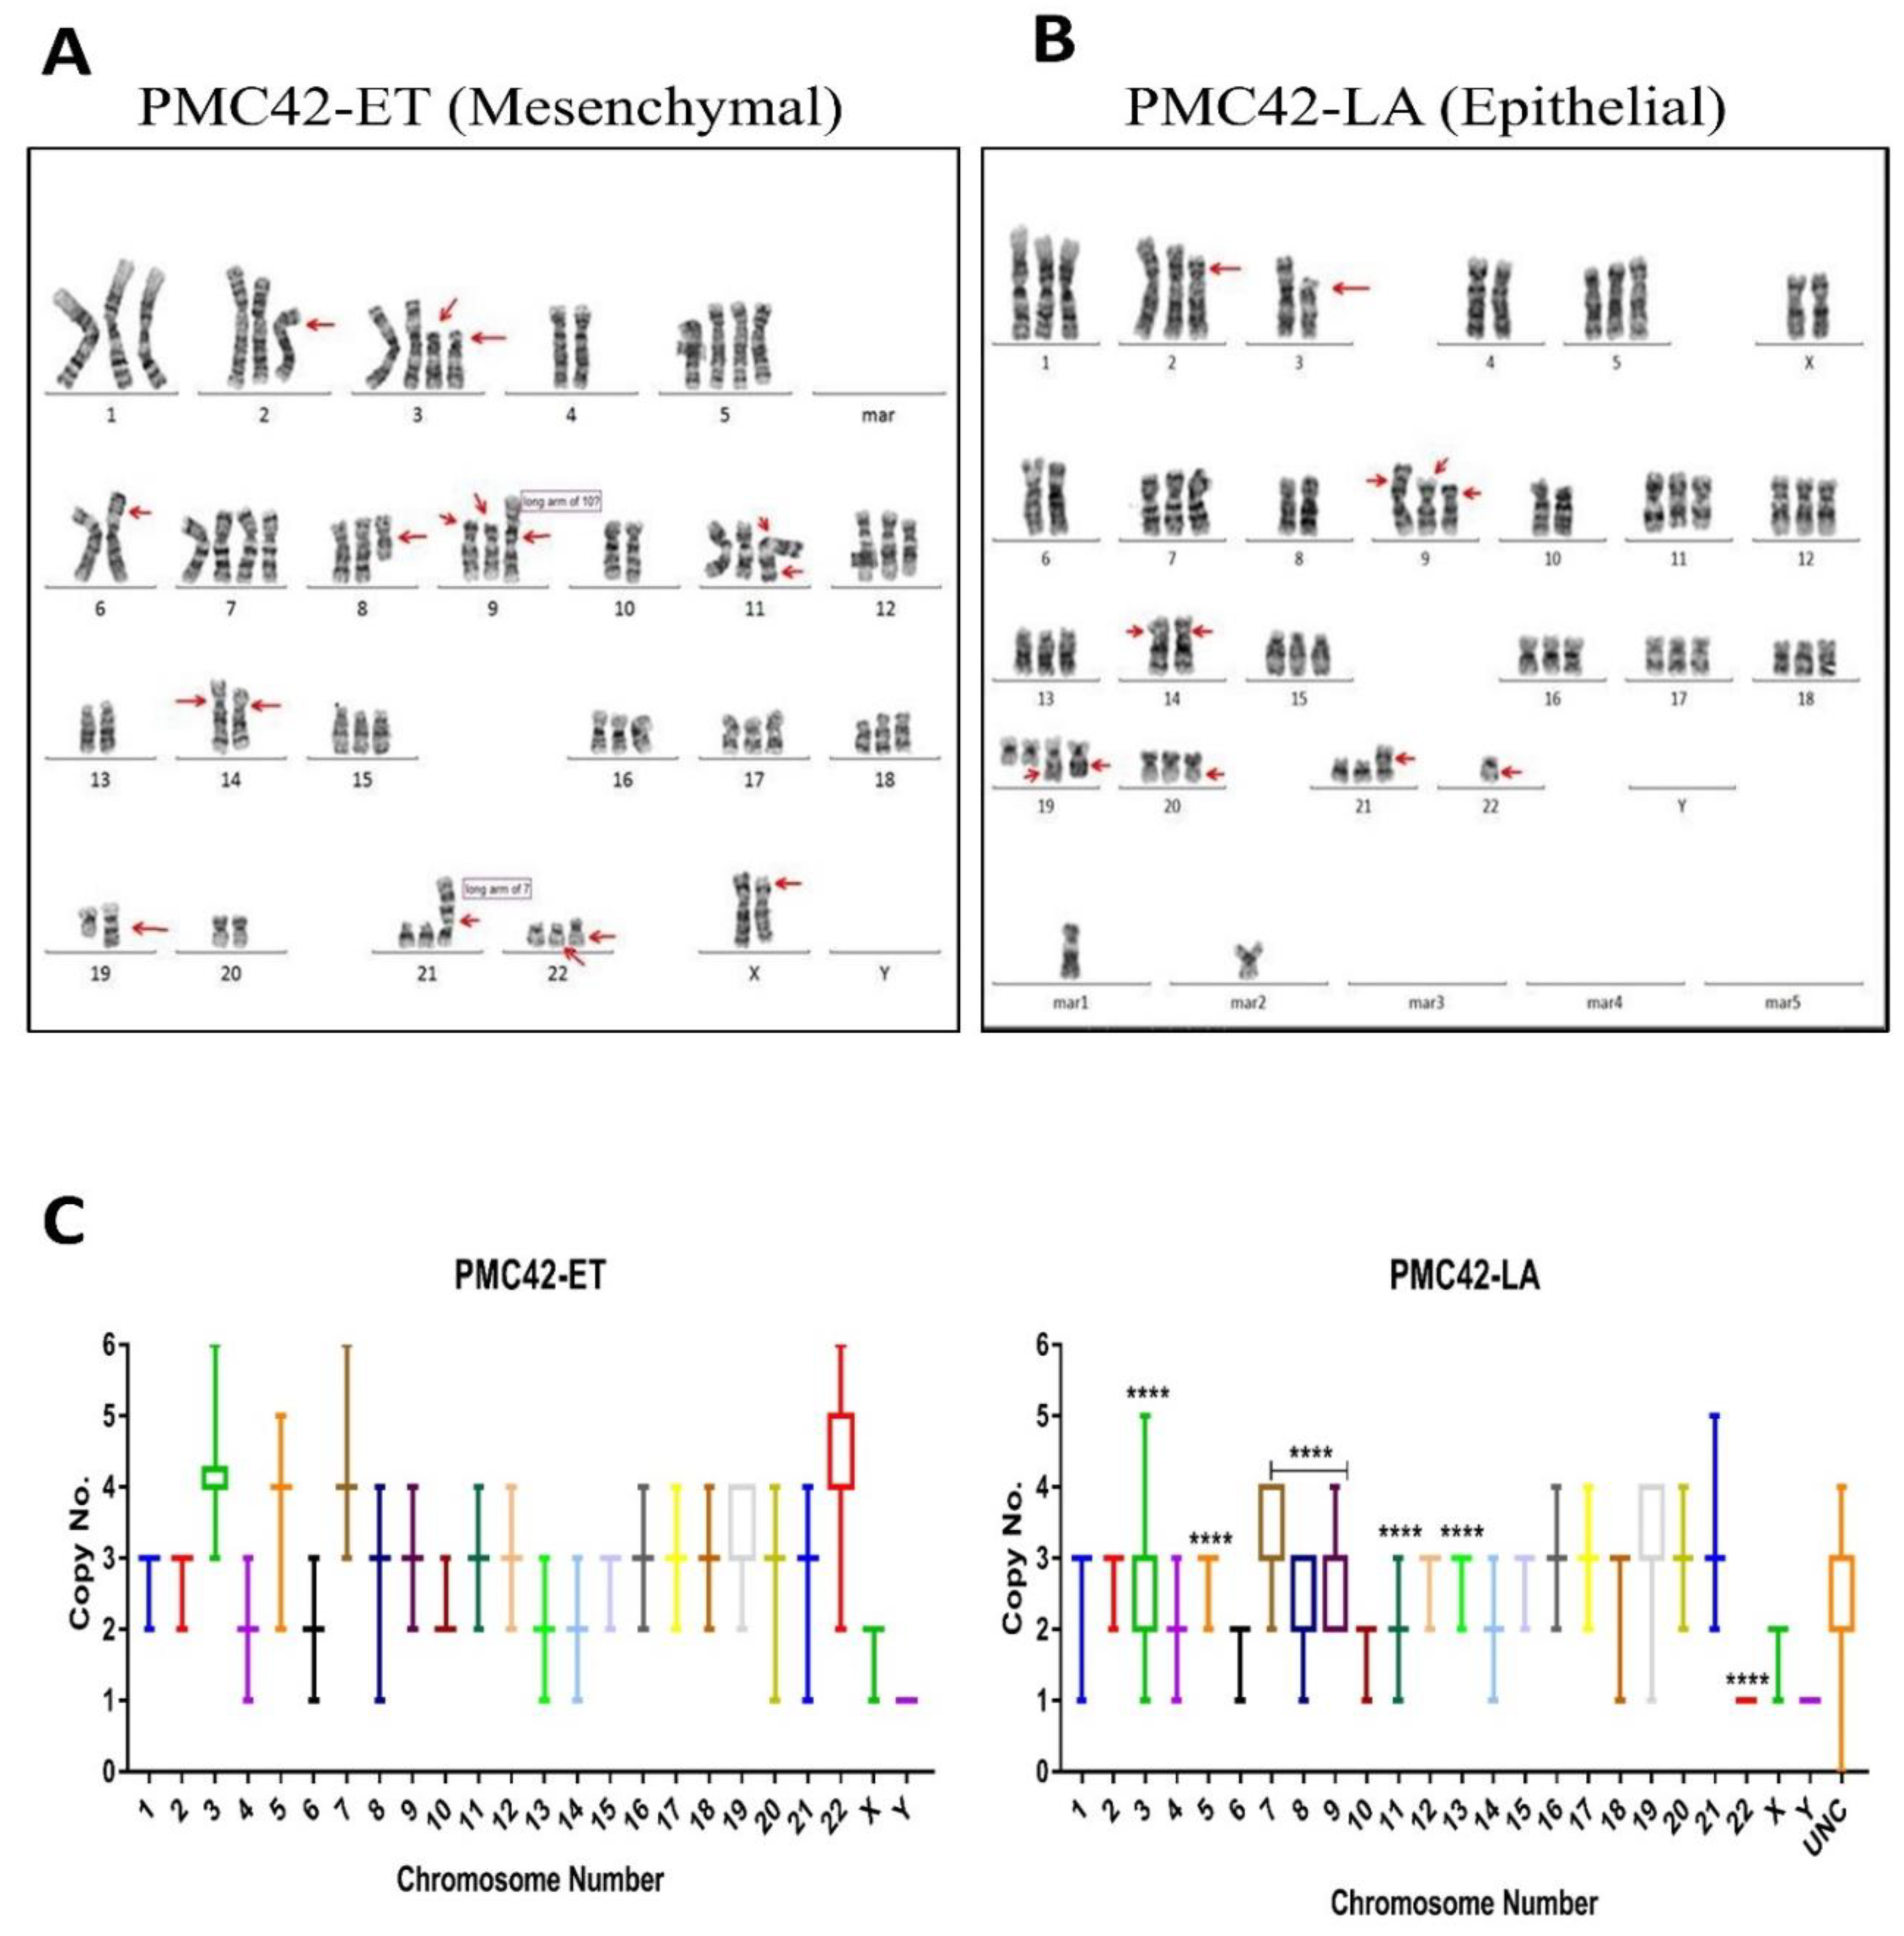
3.5. Karyotypic Heterogeneity Exists within and across the Sister Breast Cancer Cell Lines PMC42-ET and PMC42-LA
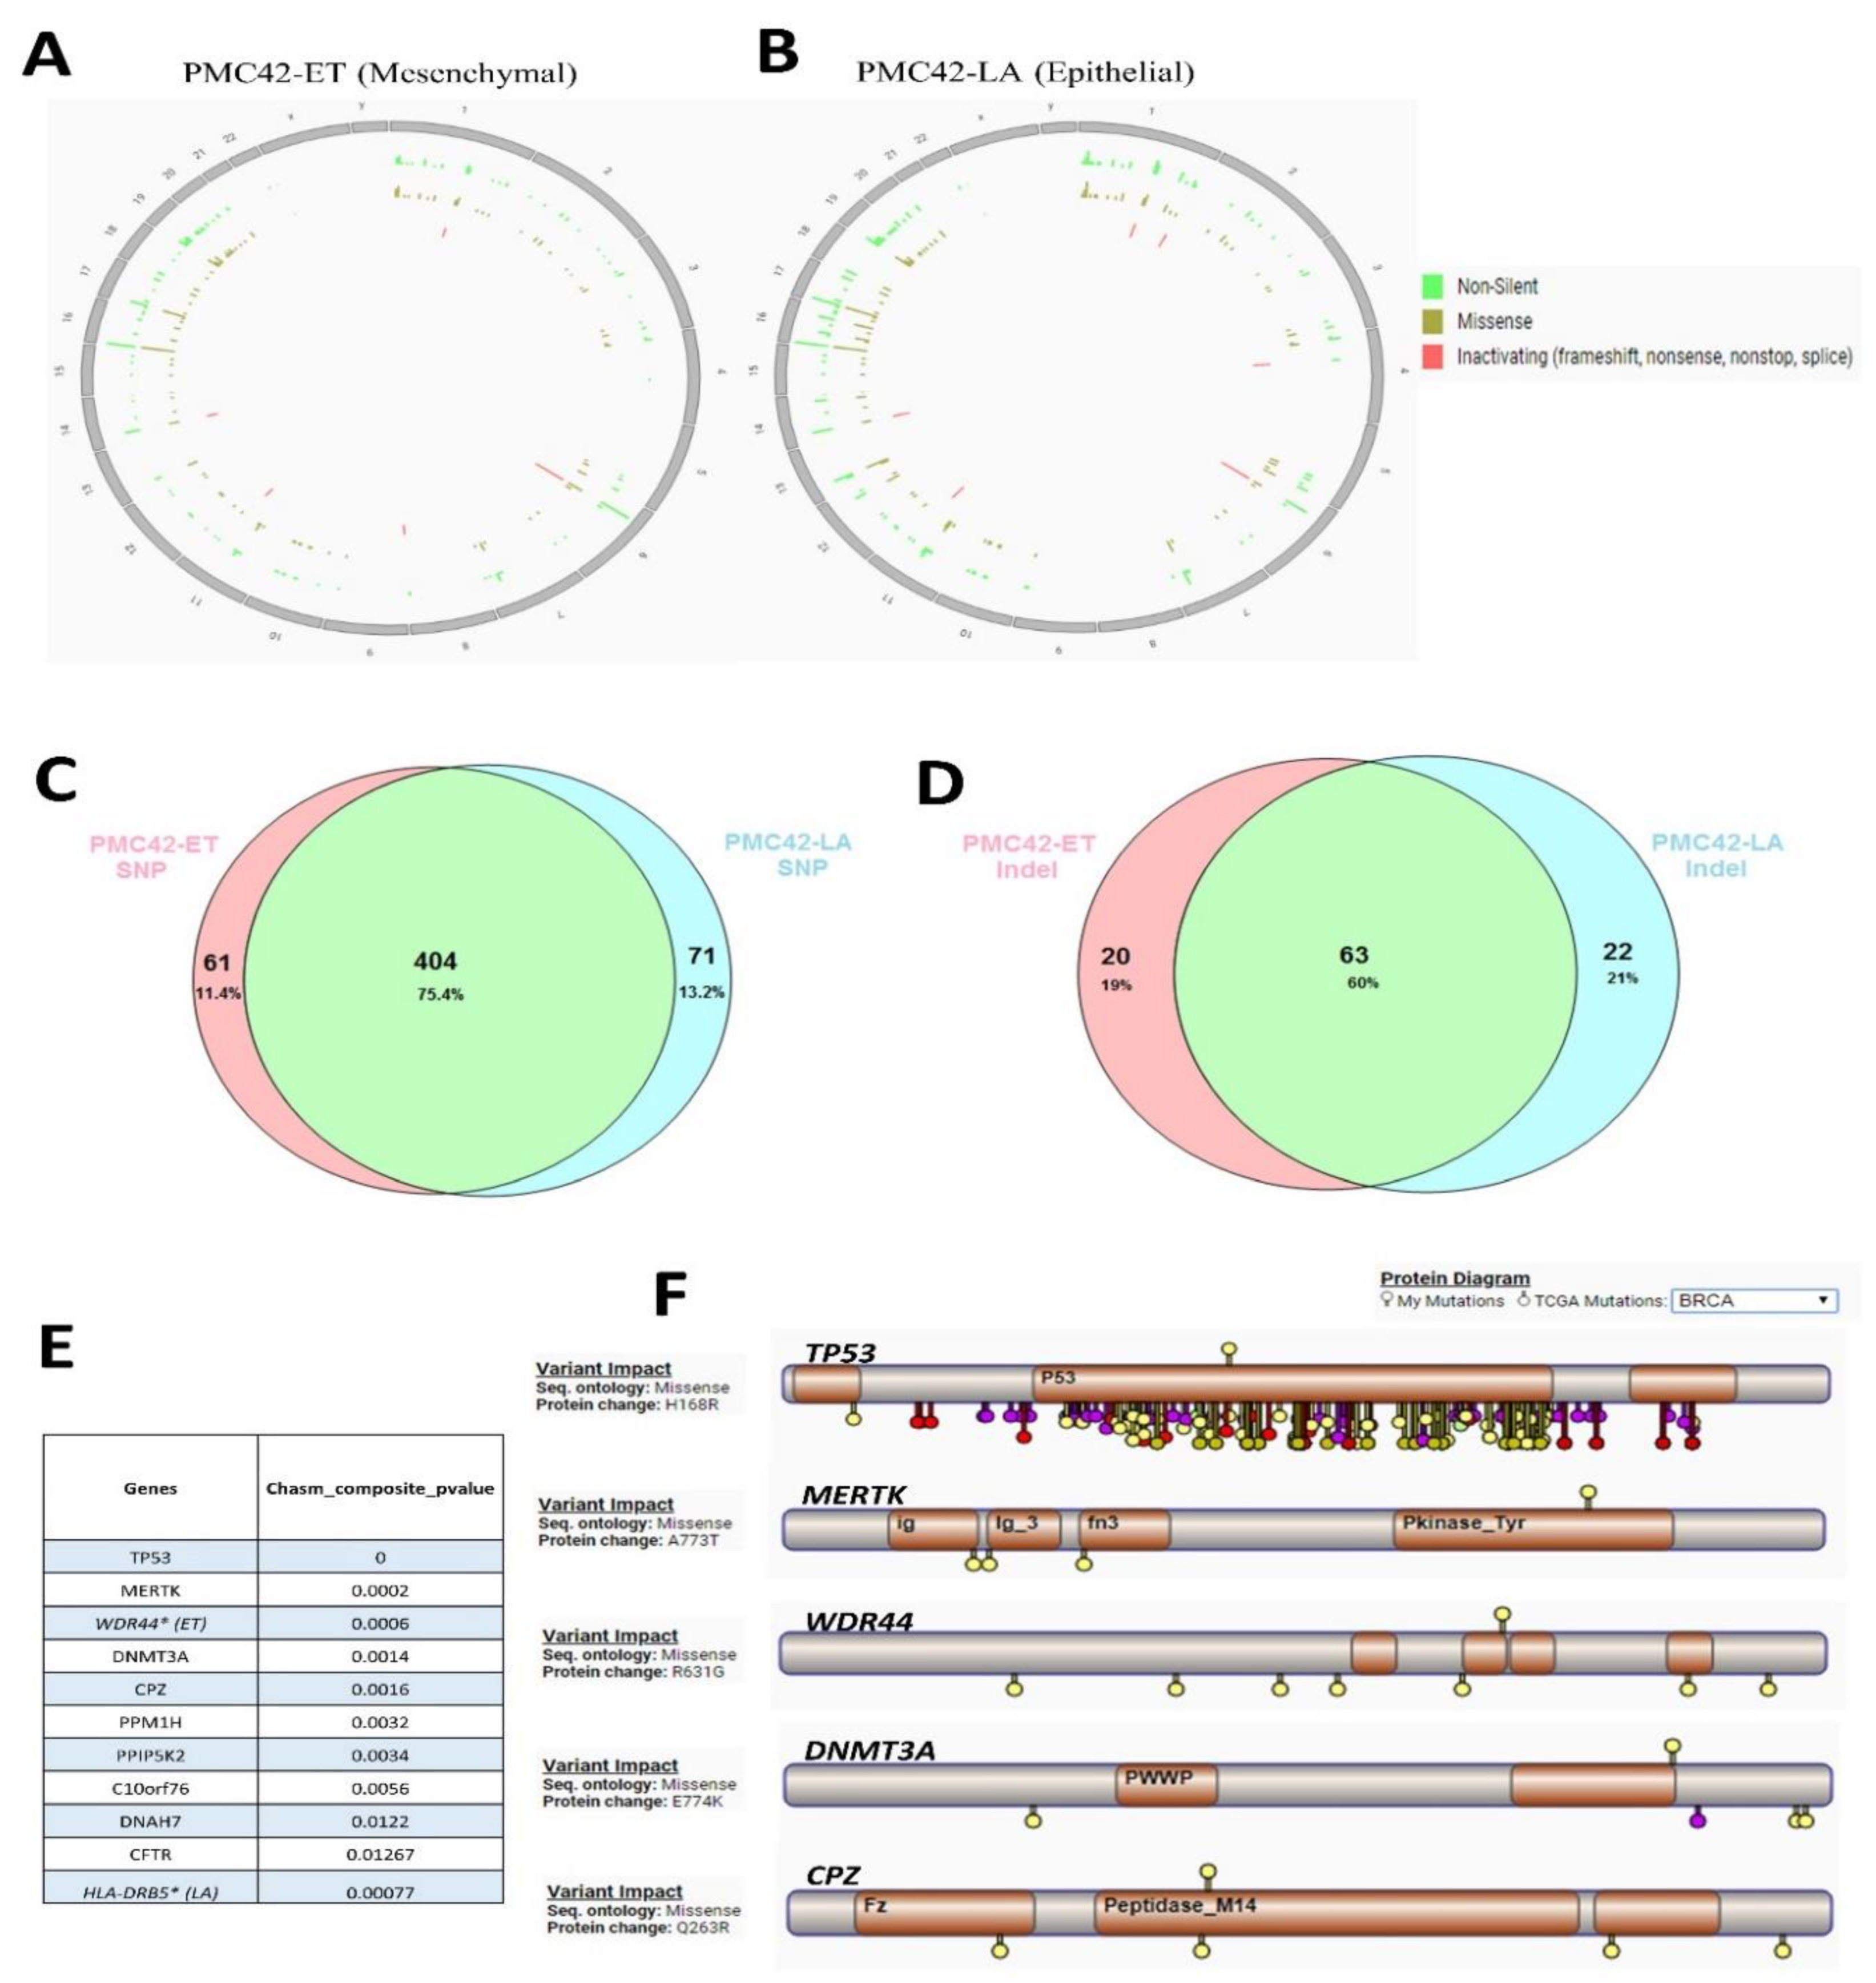
3.6. Cancer Driver Mutations in PMC42 Cell Lines
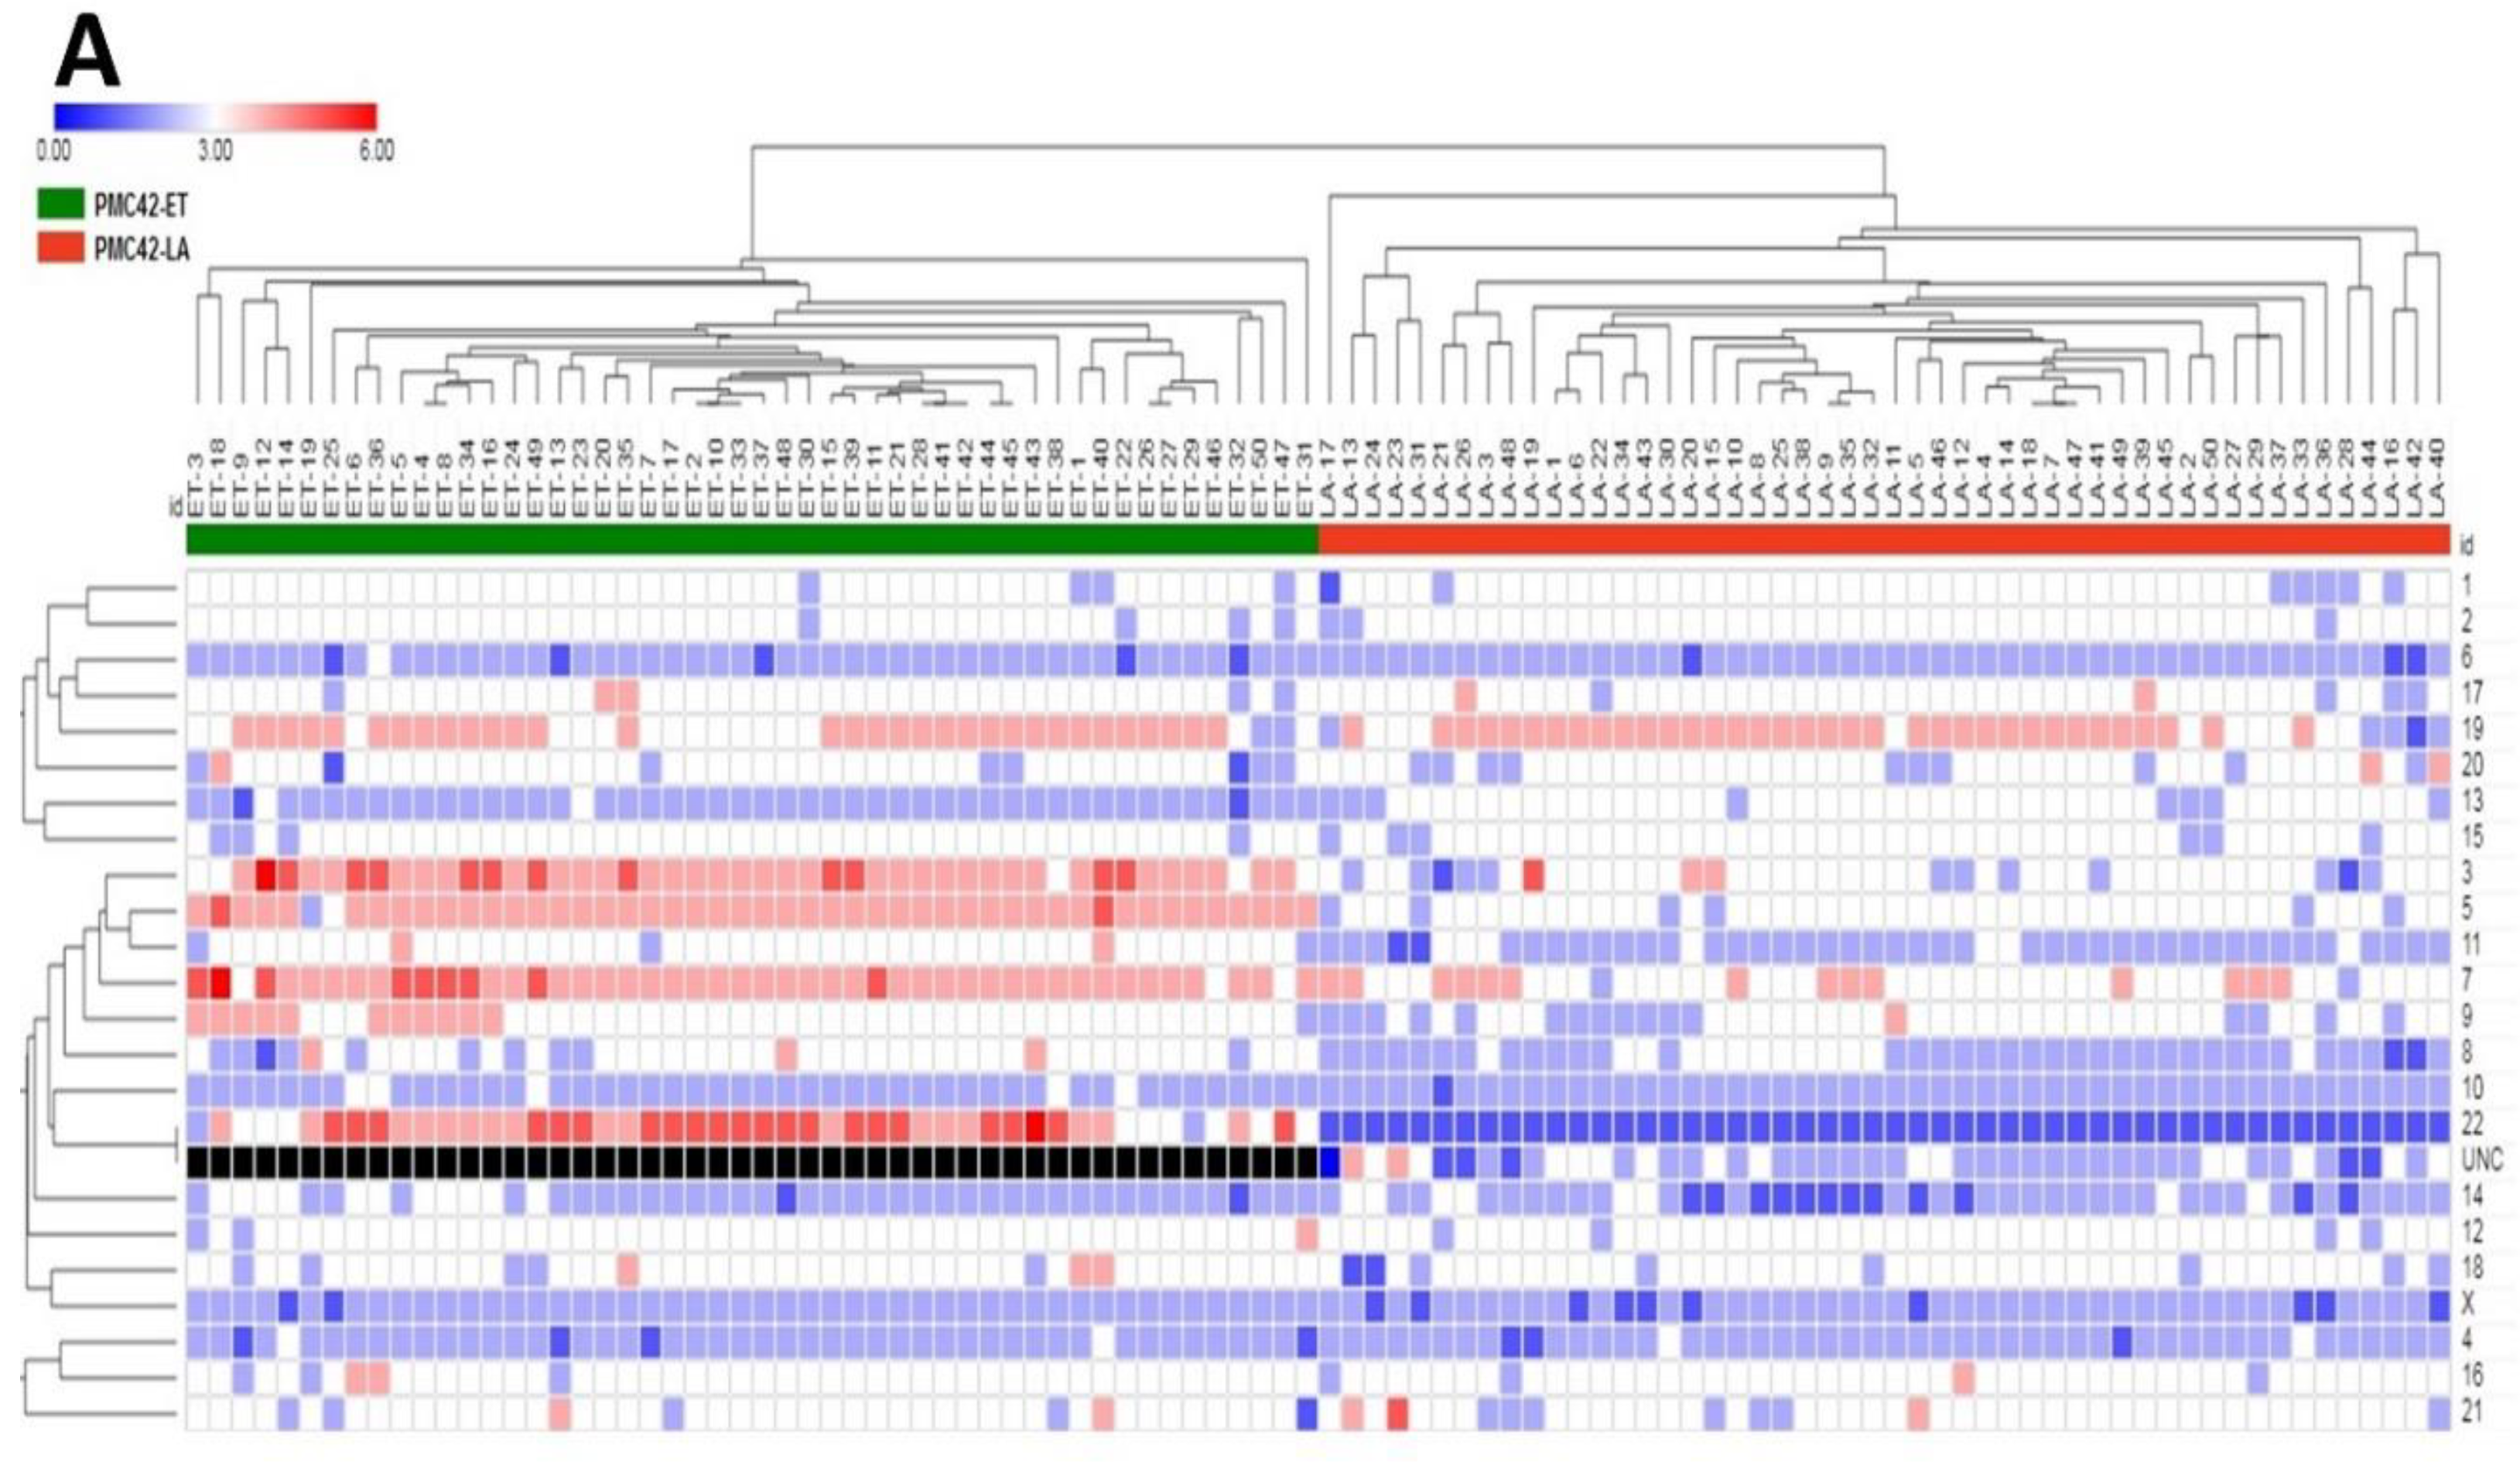
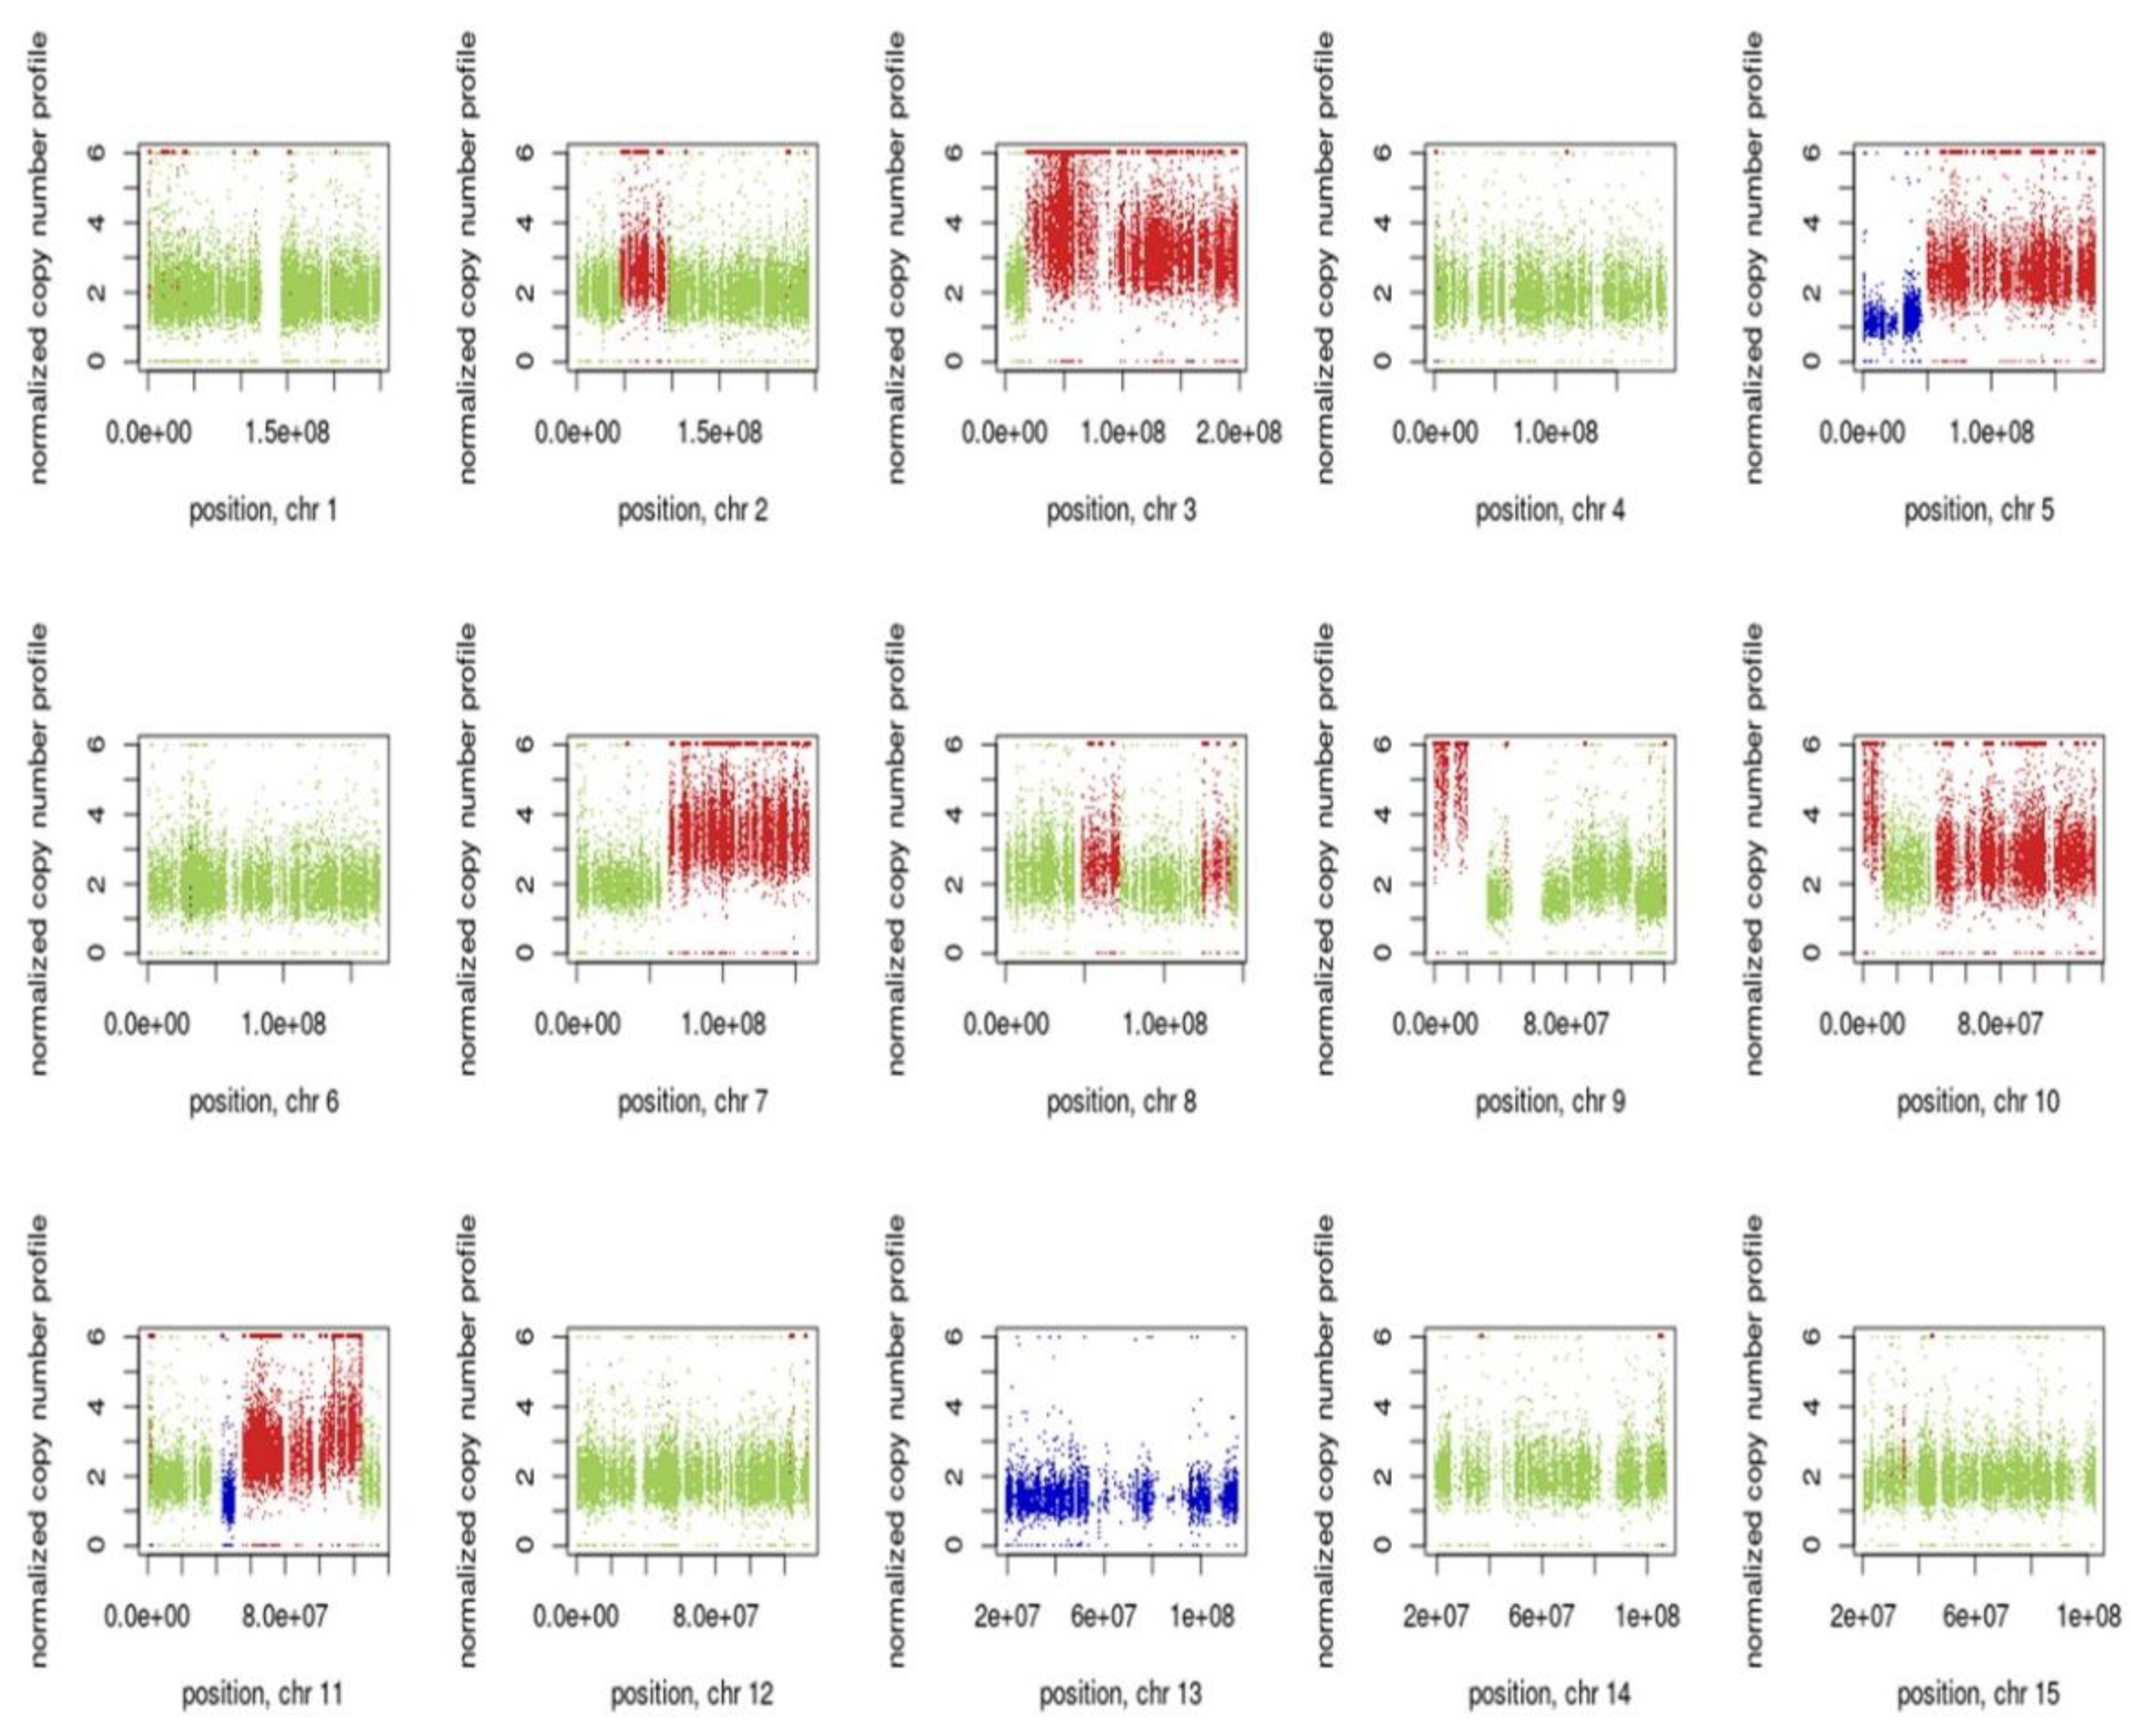
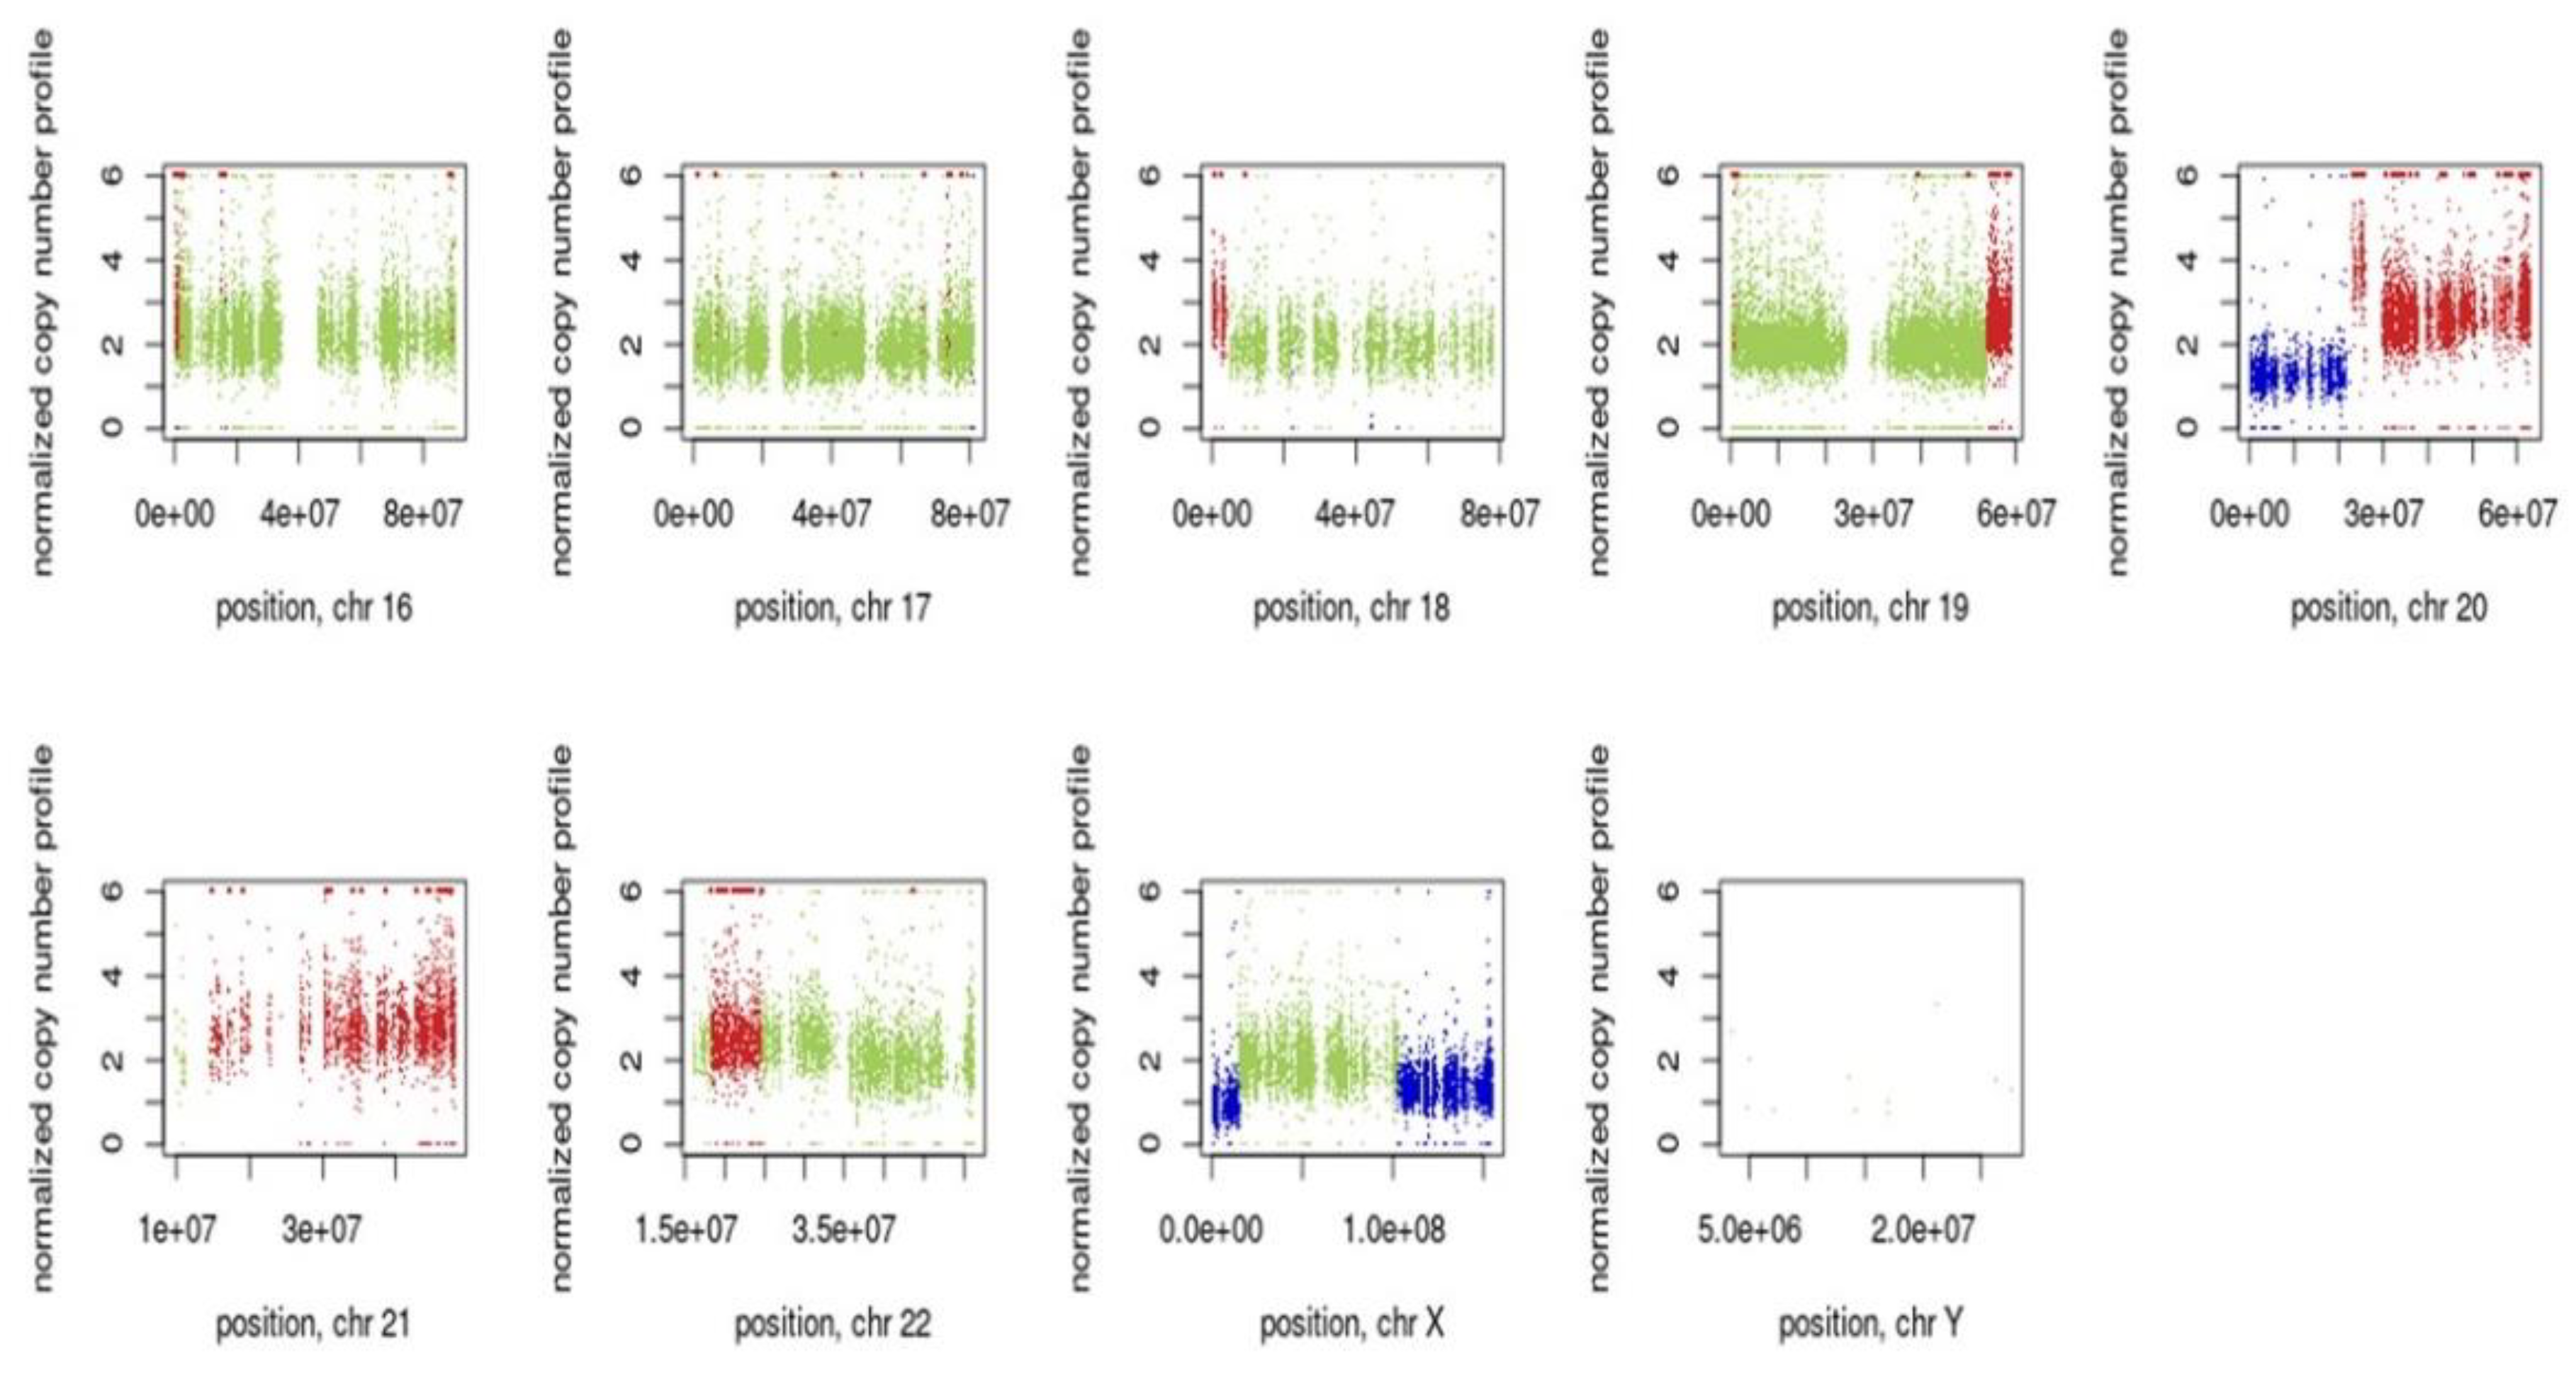
3.7. Inference of CNV from Exome Sequencing Data
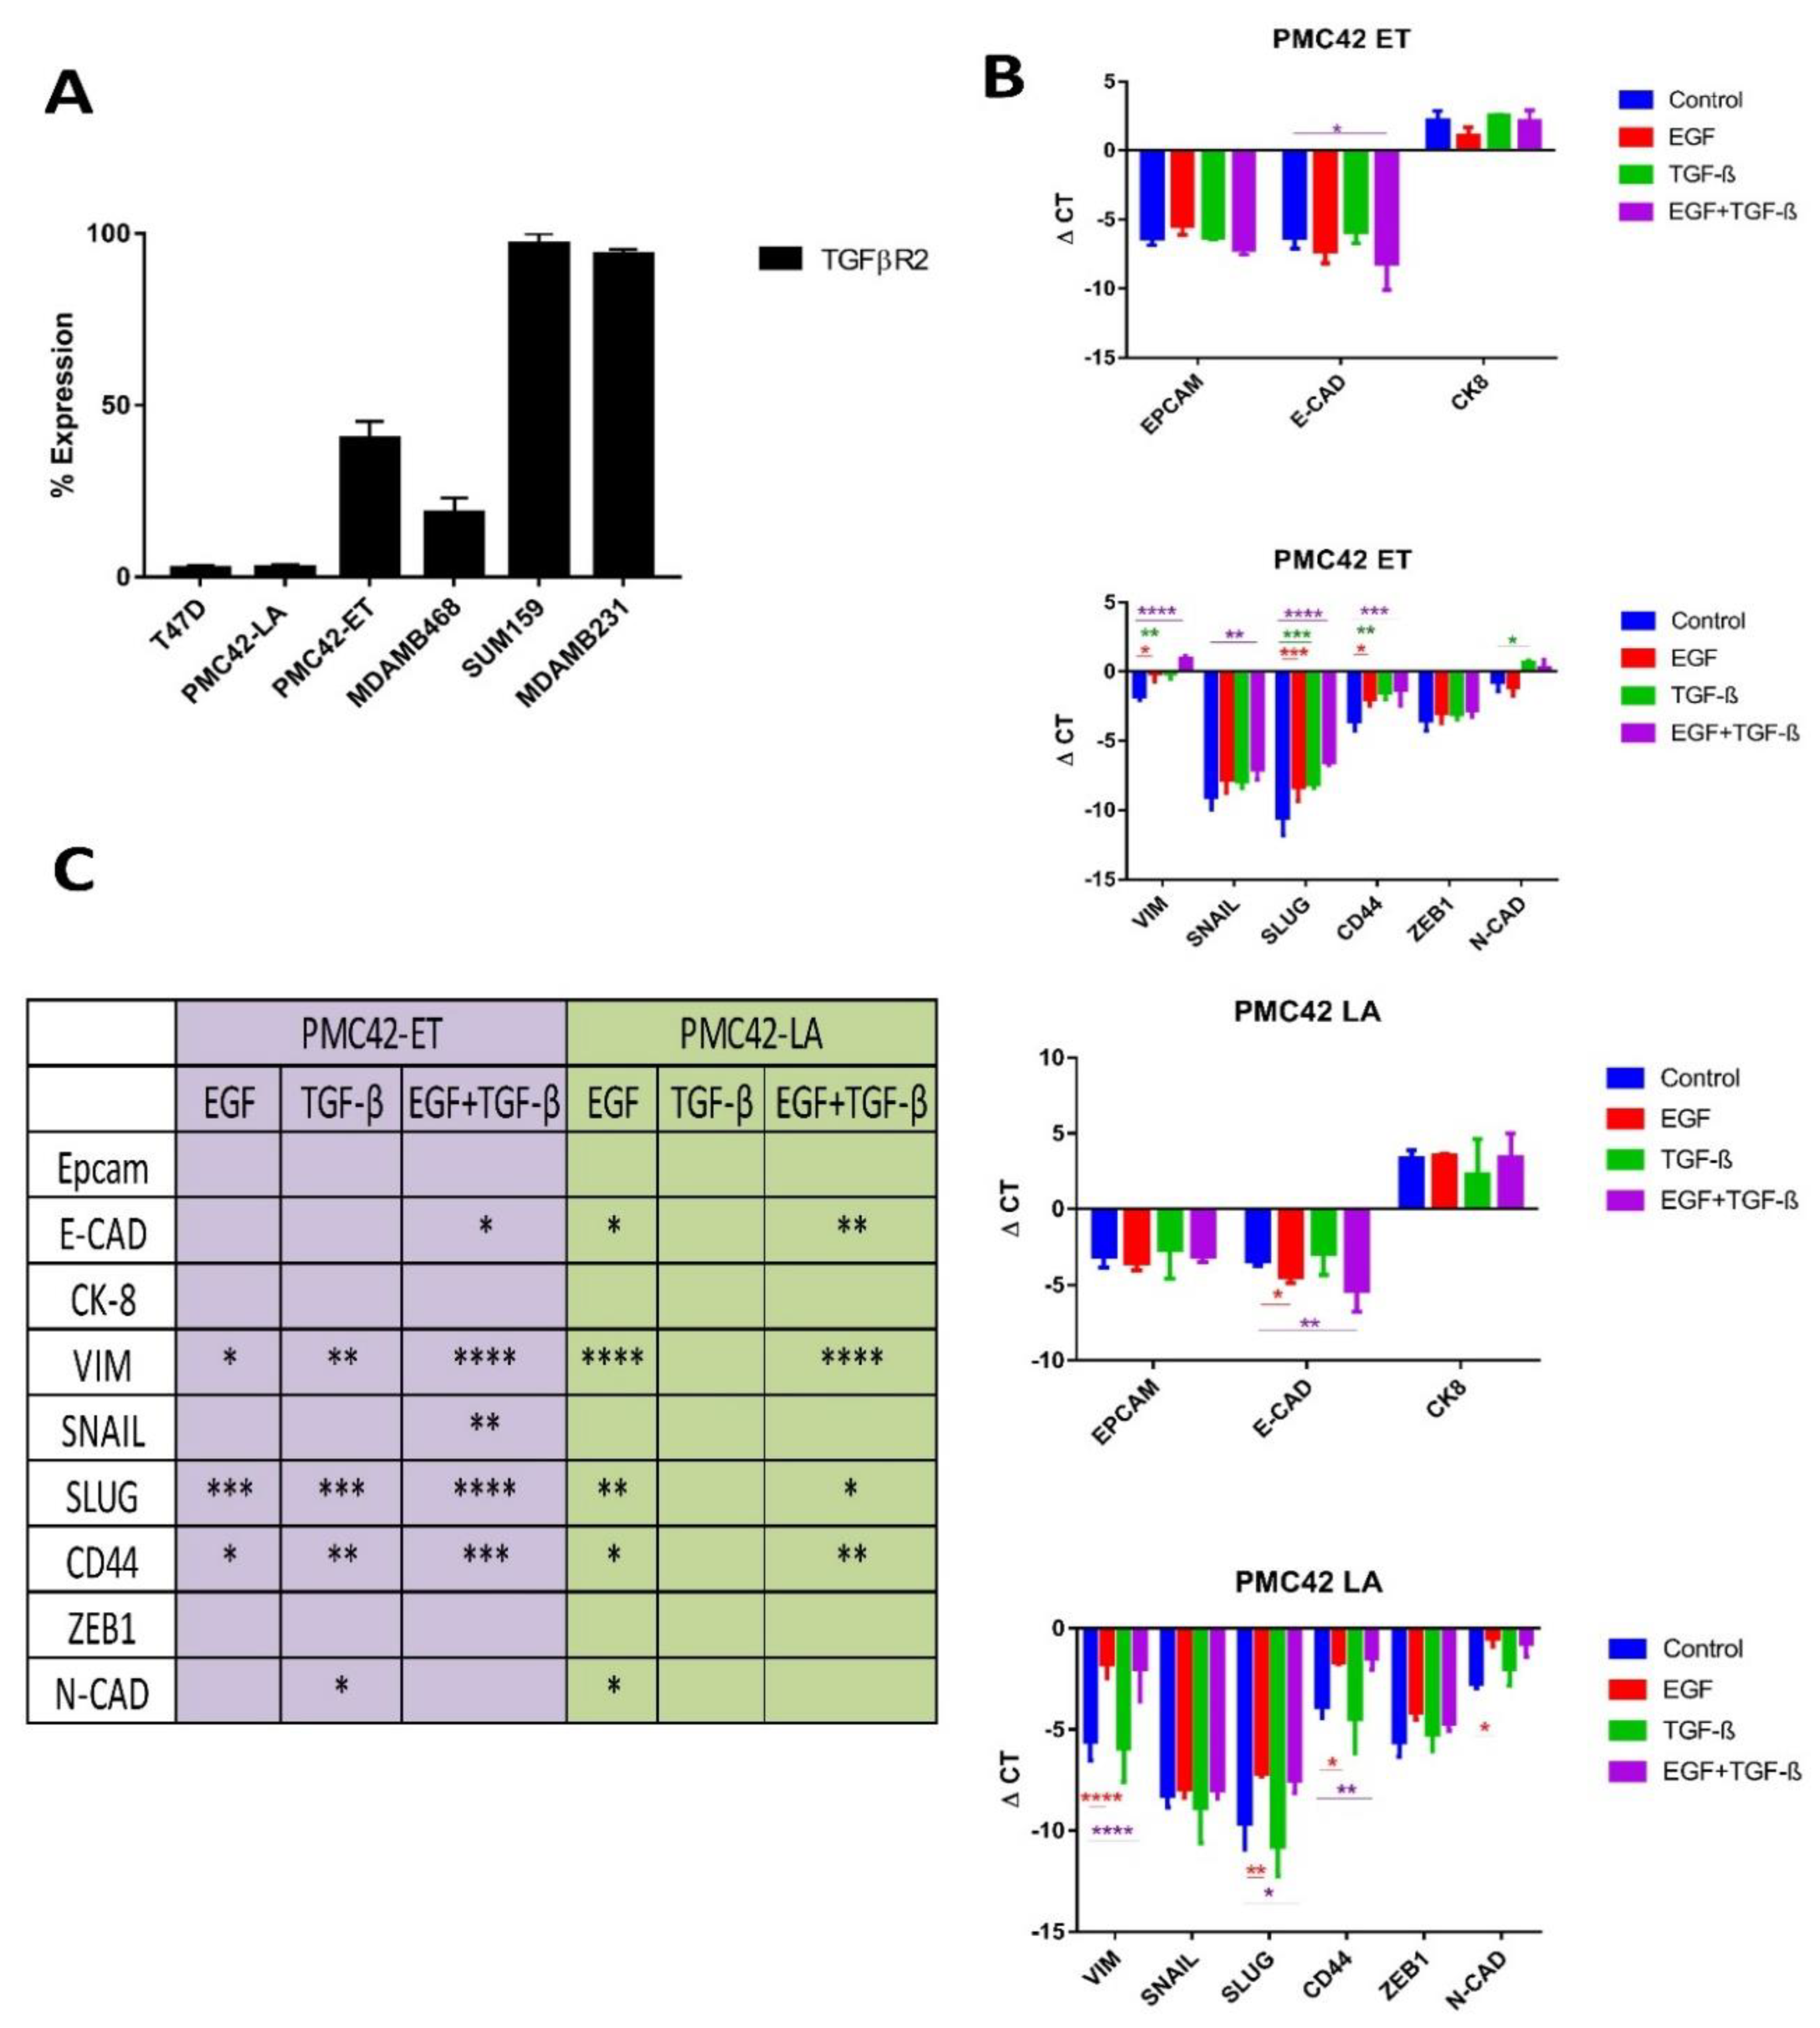
3.8. TGFBR2 Ablation and Influence on EMT Induction in PMC42-LA
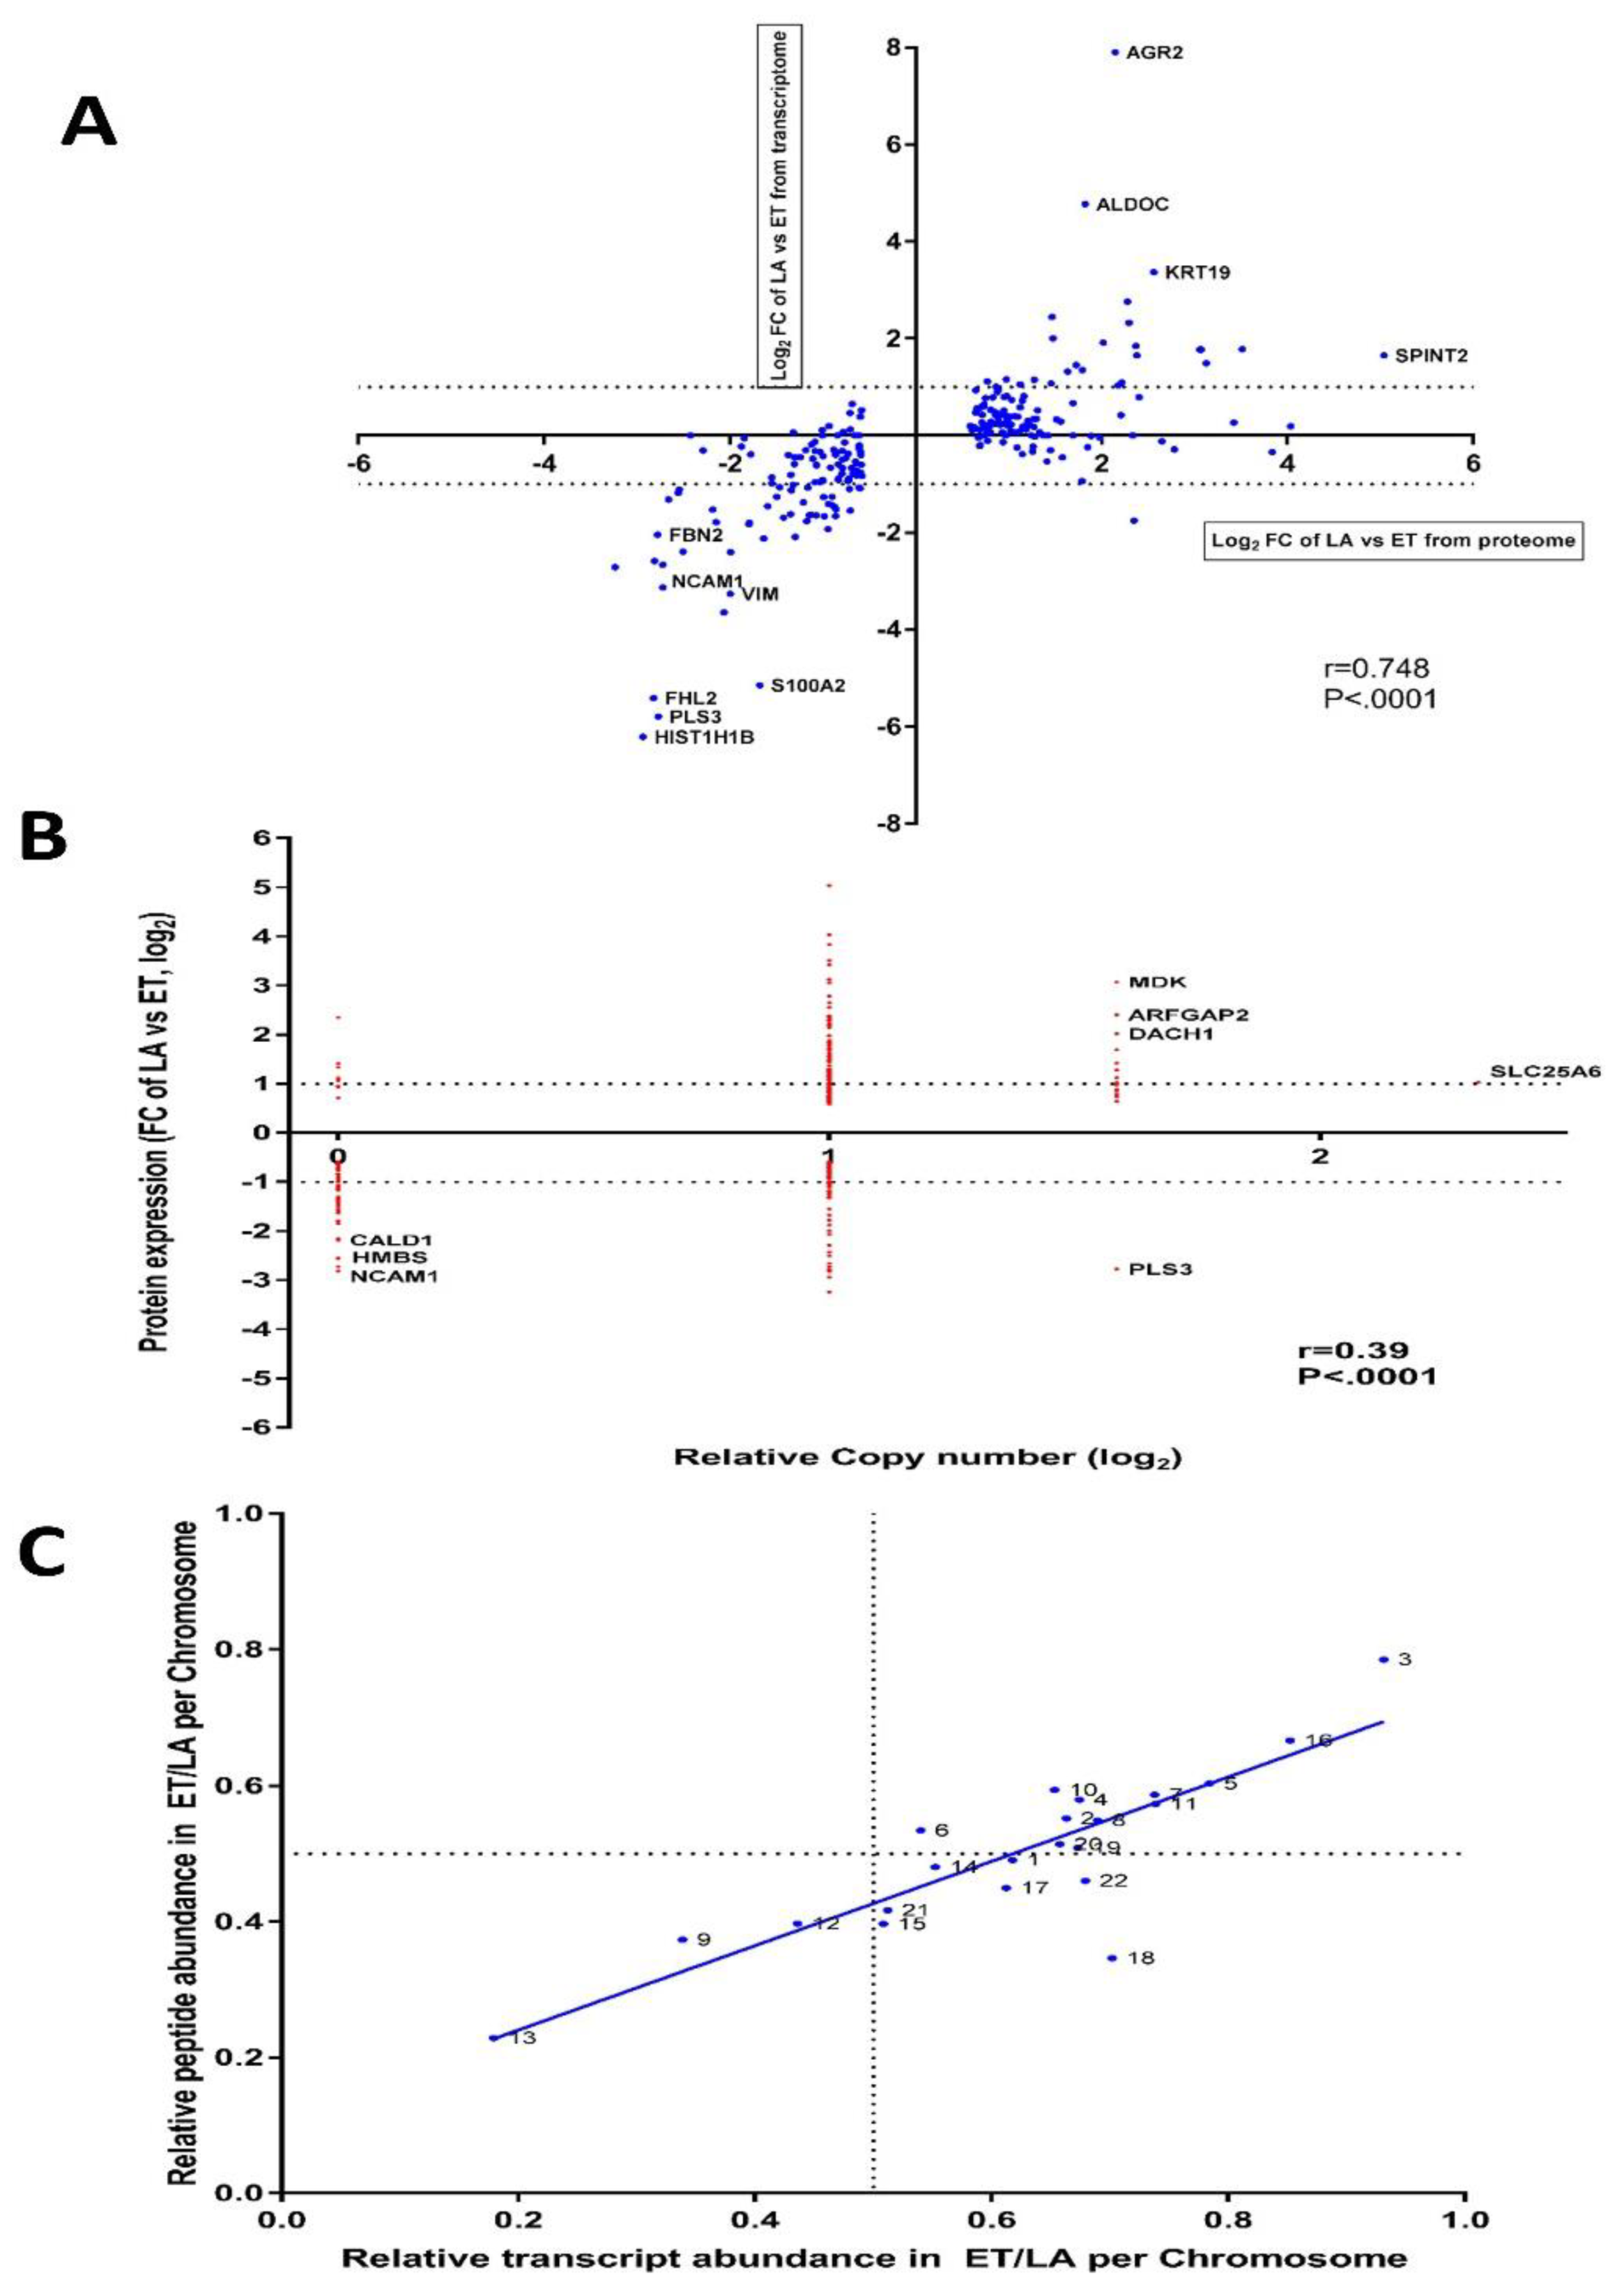
3.9. Inter-Data Relationships from CNV and RNA-seq with Proteome Data
3.10. The Differences in PMC42 Karyotypes are Reflected in Their Transcriptome and Proteome Ratios
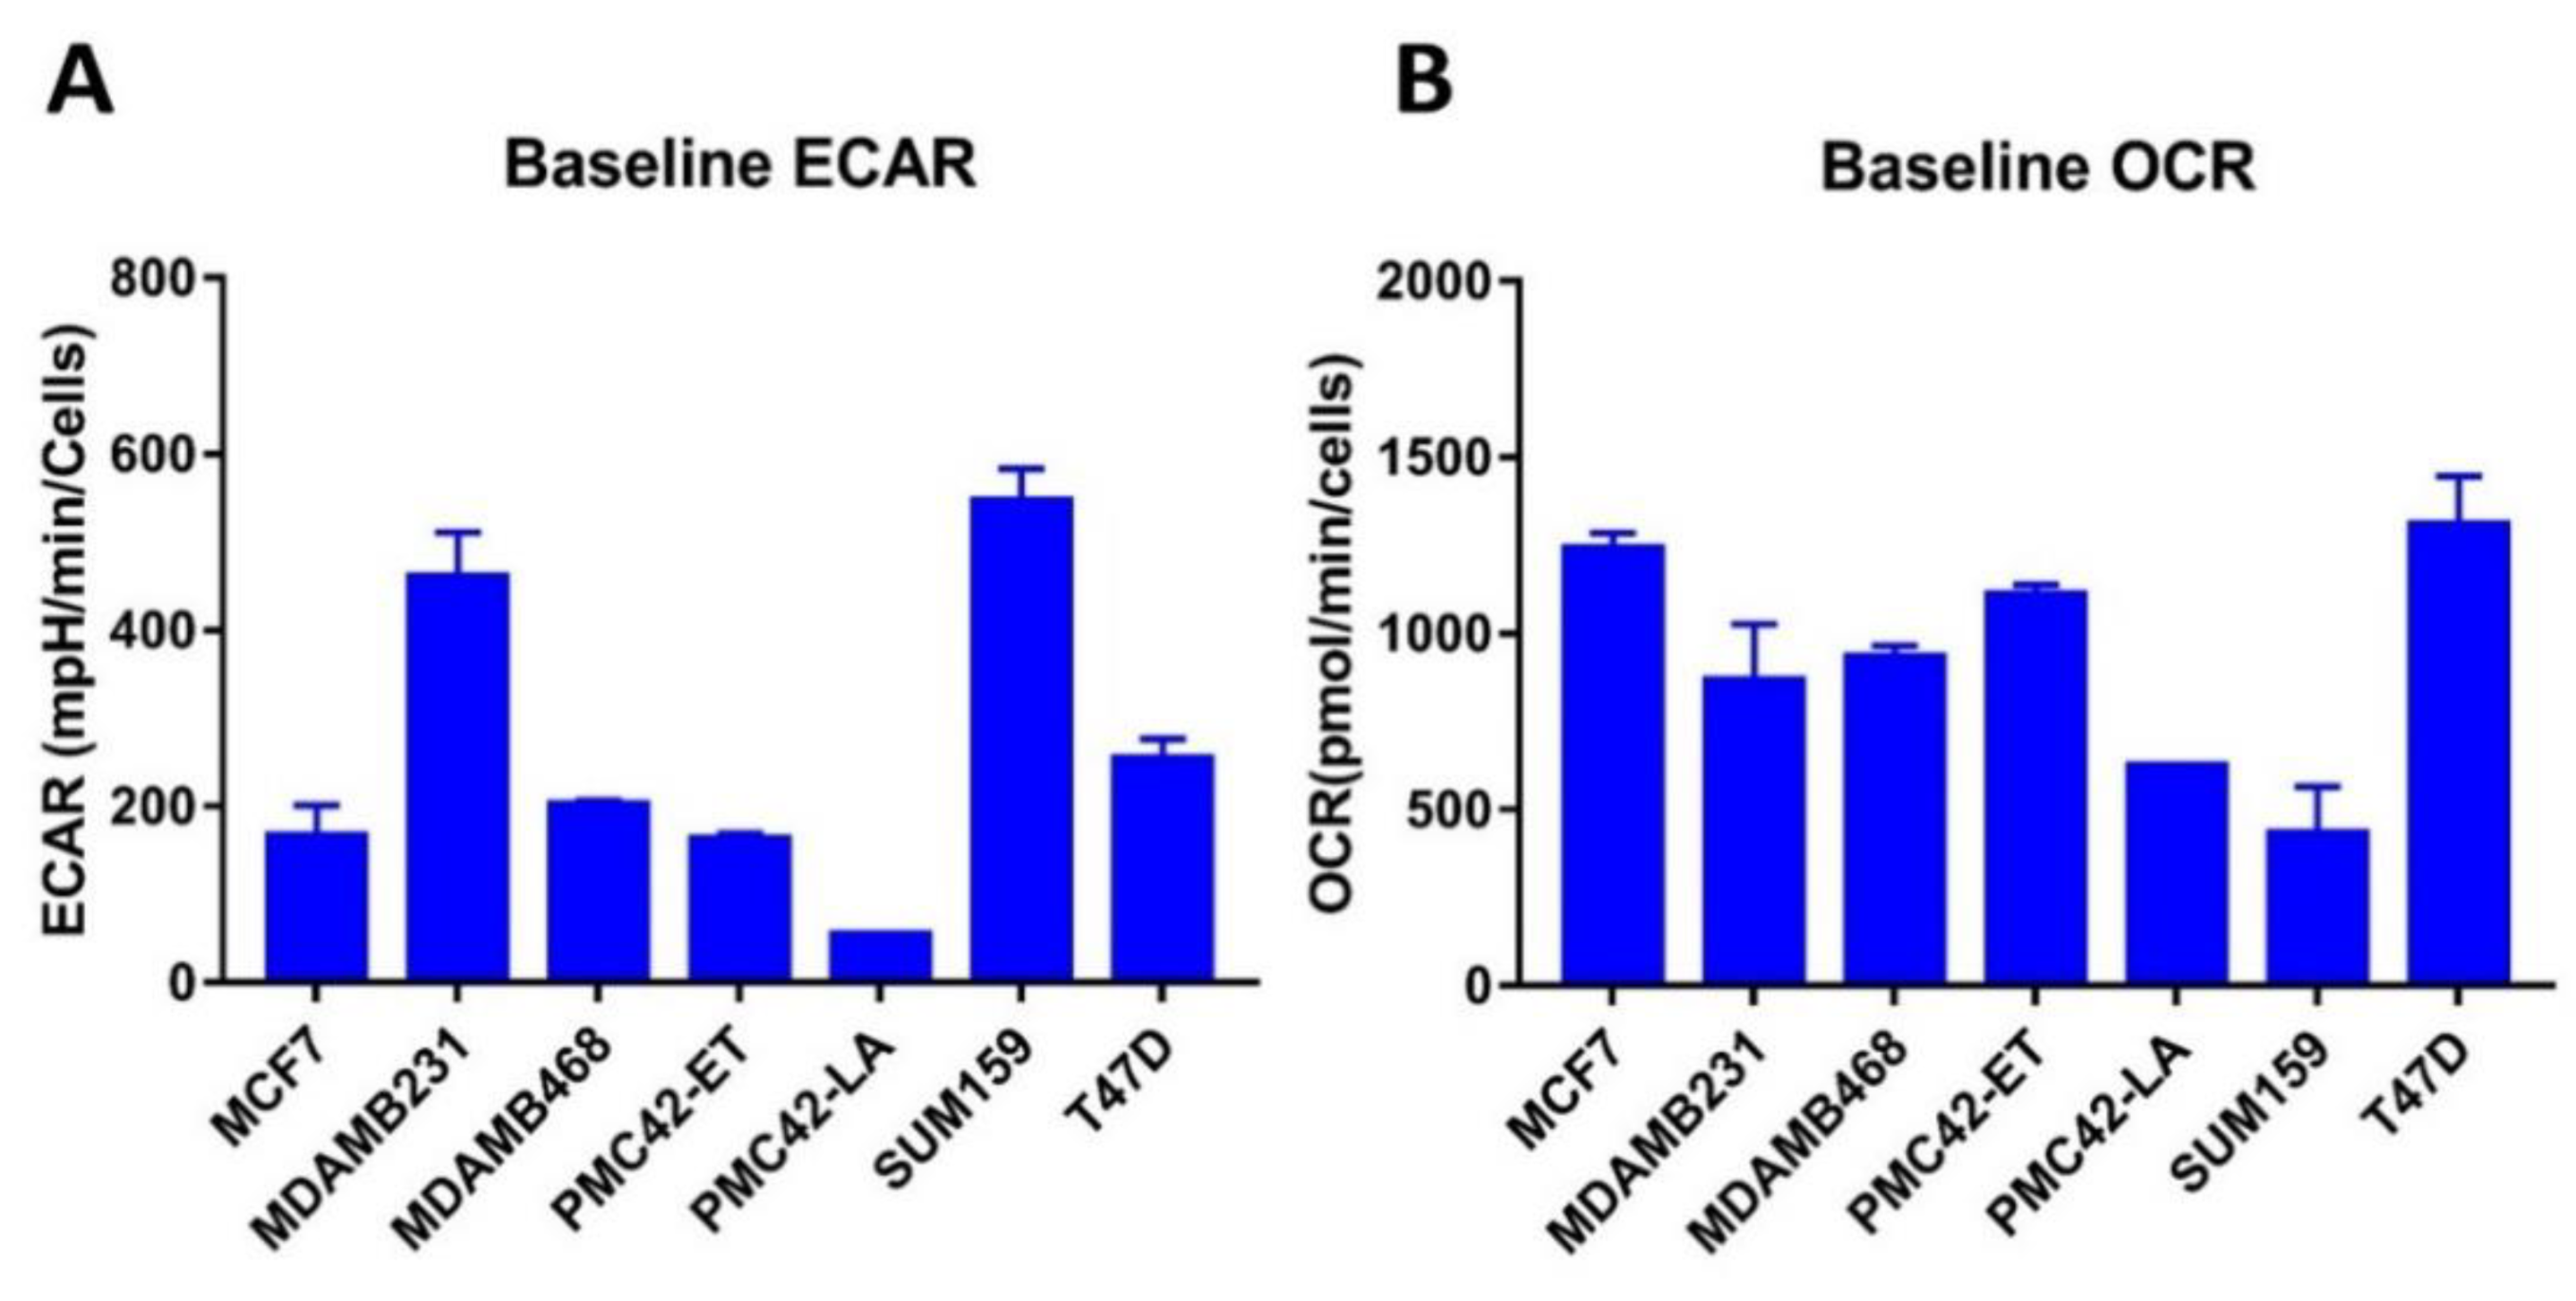
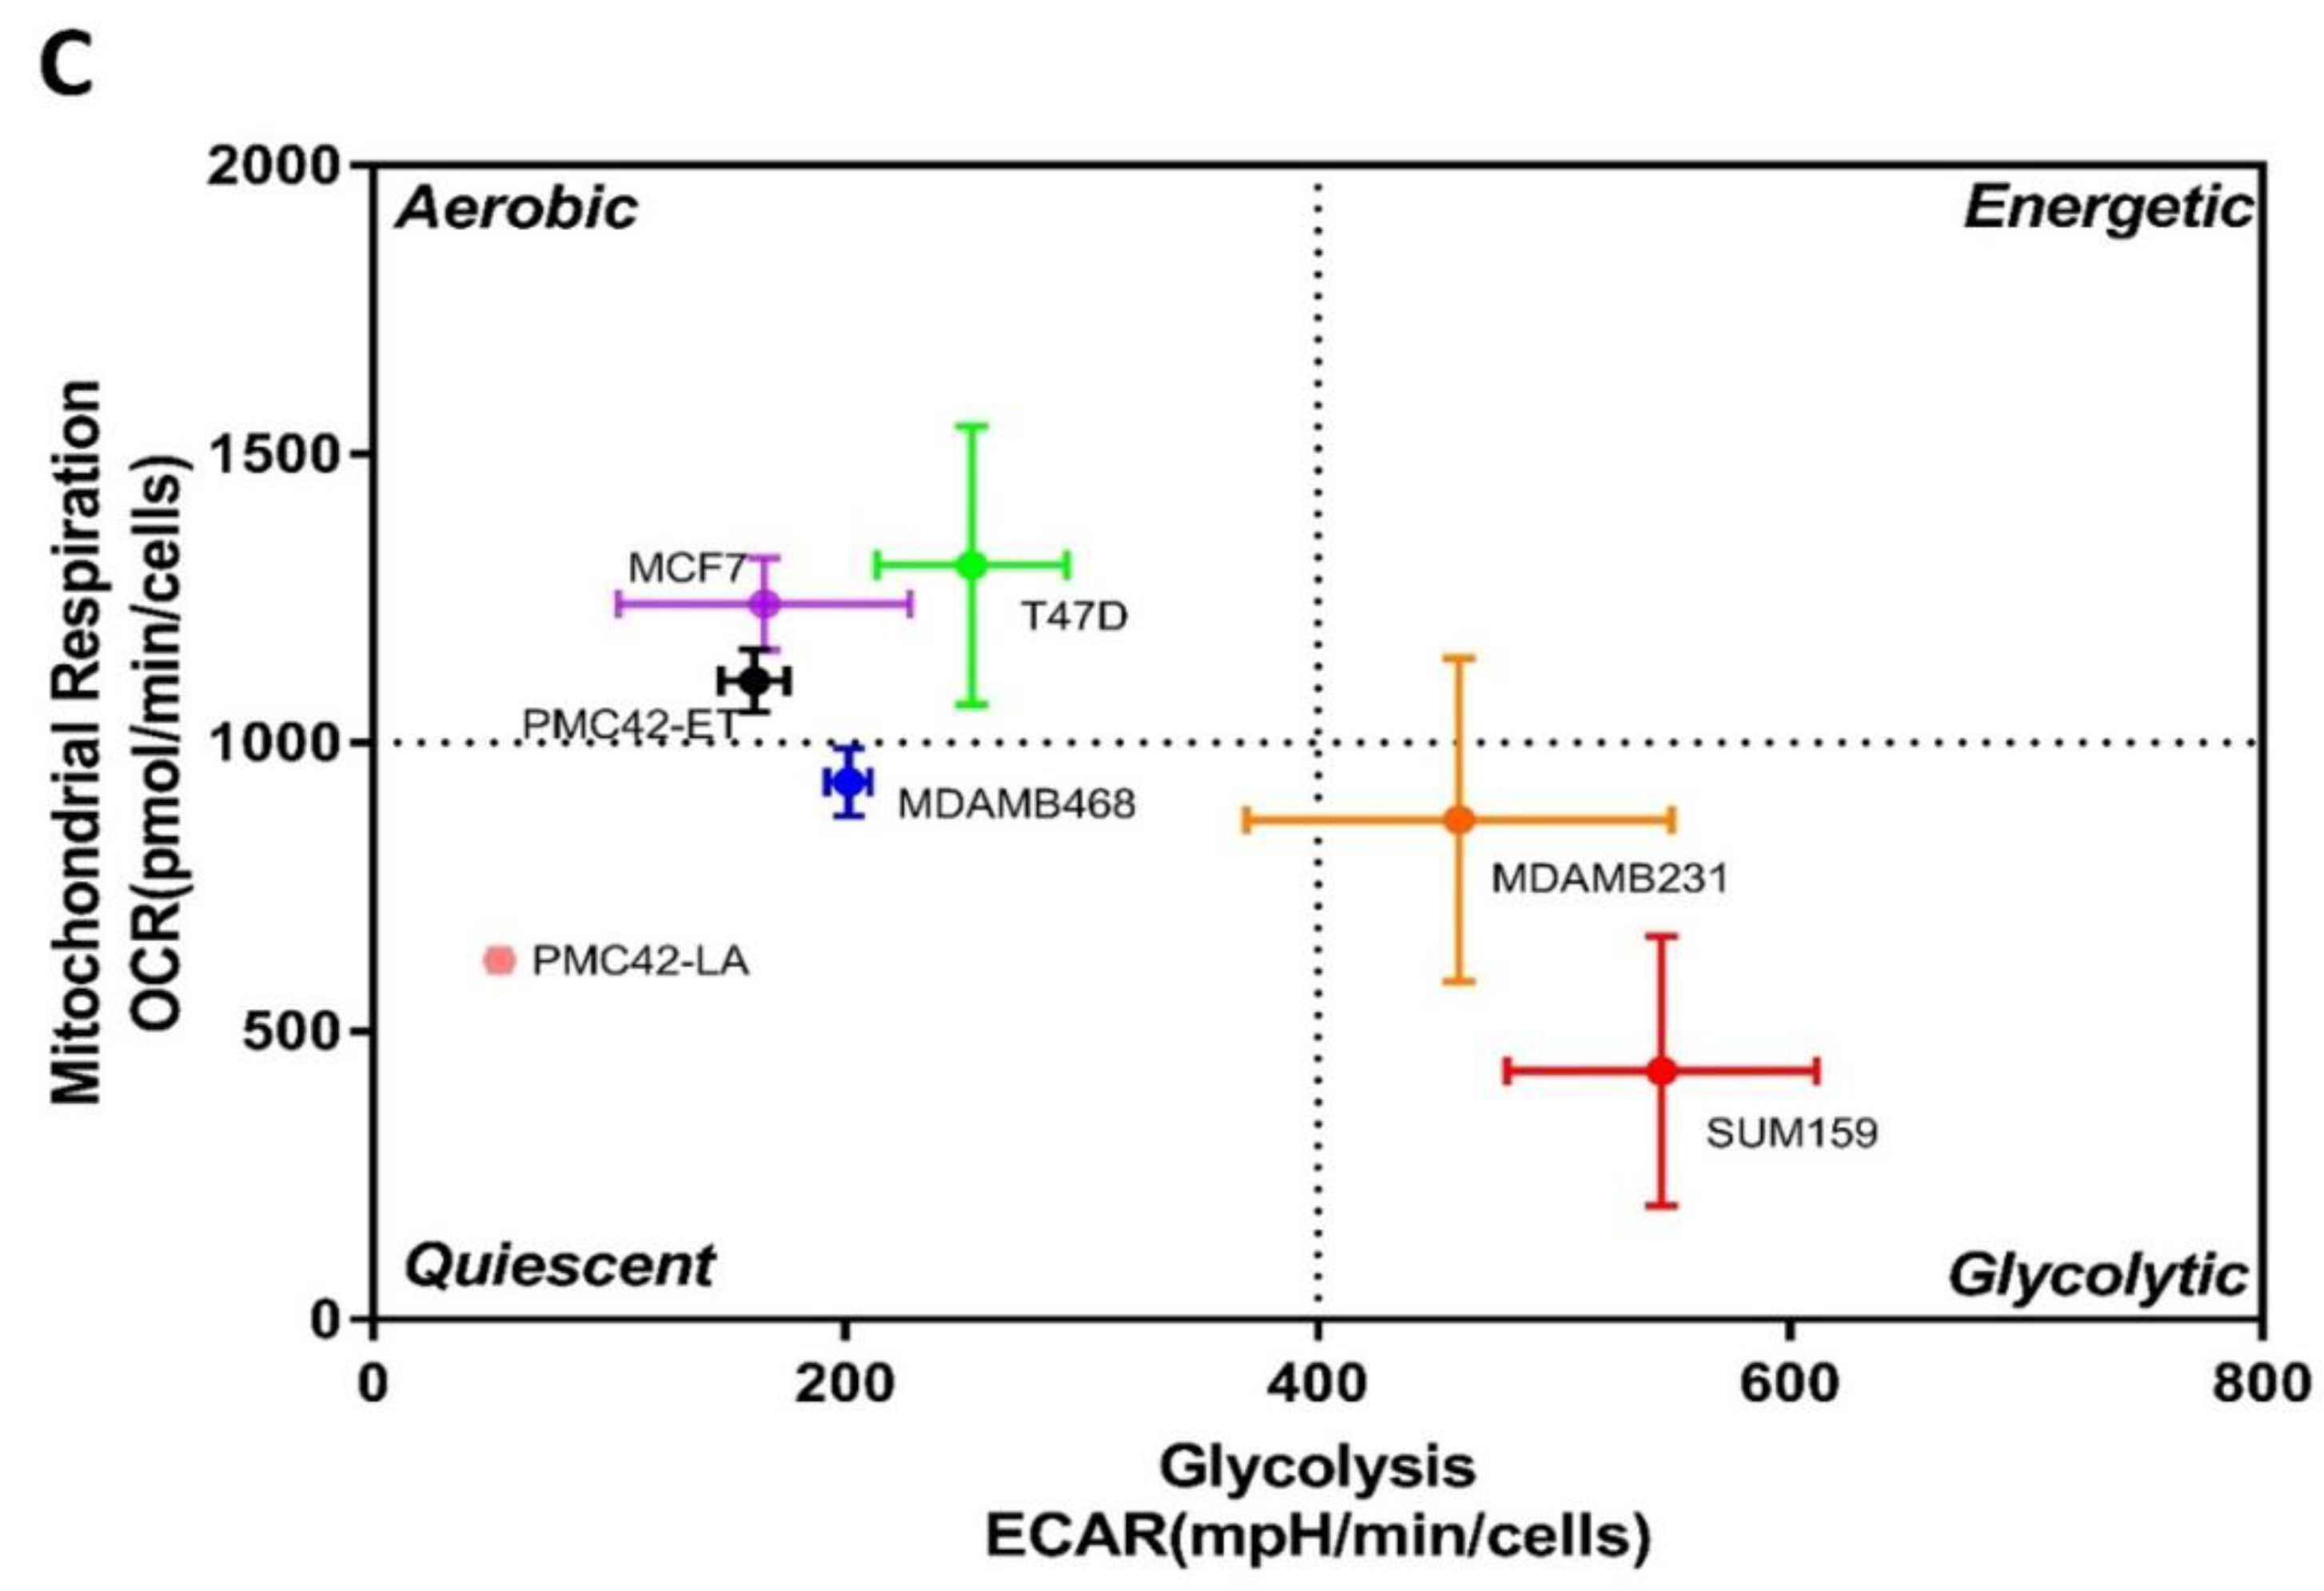
3.11. Bioenergetic Profiles of PMC42 Cells in Comparison with Other Breast Cancer Cell Lines
4. Discussion
5. Conclusions
Supplementary Materials
Author Contributions
Funding
Acknowledgments
Conflicts of Interest
References
- Turashvili, G.; Brogi, E. Tumor Heterogeneity in Breast Cancer. Front. Med. 2017, 4, 227. [Google Scholar] [CrossRef] [PubMed] [Green Version]
- Rivenbark, A.G.; O’Connor, S.M.; Coleman, W.B. Molecular and cellular heterogeneity in breast cancer: challenges for personalized medicine. Am. J. Pathol. 2013, 183, 1113–1124. [Google Scholar] [CrossRef] [PubMed]
- Saunus, J.M.; Smart, C.E.; Kutasovic, J.R.; Johnston, R.L.; Kalita-de Croft, P.; Miranda, M.; Rozali, E.N.; Vargas, A.C.; Reid, L.E.; Lorsy, E.; et al. Multidimensional phenotyping of breast cancer cell lines to guide preclinical research. Breast Cancer Res. Treat. 2018, 167, 289–301. [Google Scholar] [CrossRef] [PubMed]
- Keller, P.J.; Lin, A.F.; Arendt, L.M.; Klebba, I.; Jones, A.D.; Rudnick, J.A.; DiMeo, T.A.; Gilmore, H.; Jefferson, D.M.; Graham, R.A.; et al. Mapping the cellular and molecular heterogeneity of normal and malignant breast tissues and cultured cell lines. Breast Cancer Res. 2010, 12, R87. [Google Scholar] [CrossRef] [PubMed]
- Hollestelle, A.; Nagel, J.H.; Smid, M.; Lam, S.; Elstrodt, F.; Wasielewski, M.; Ng, S.S.; French, P.J.; Peeters, J.K.; Rozendaal, M.J.; et al. Distinct gene mutation profiles among luminal-type and basal-type breast cancer cell lines. Breast Cancer Res. Treat. 2010, 121, 53–64. [Google Scholar] [CrossRef] [PubMed]
- Lehmann, B.D.; Bauer, J.A.; Chen, X.; Sanders, M.E.; Chakravarthy, A.B.; Shyr, Y.; Pietenpol, J.A. Identification of human triple-negative breast cancer subtypes and preclinical models for selection of targeted therapies. J. Clin. Investig. 2011, 121, 2750–2767. [Google Scholar] [CrossRef] [PubMed] [Green Version]
- Neve, R.M.; Chin, K.; Fridlyand, J.; Yeh, J.; Baehner, F.L.; Fevr, T.; Clark, L.; Bayani, N.; Coppé, J.-P.; Tong, F.; et al. A collection of breast cancer cell lines for the study of functionally distinct cancer subtypes. Cancer Cell 2006, 10, 515–527. [Google Scholar] [CrossRef] [PubMed] [Green Version]
- Prat, A.; Parker, J.S.; Karginova, O.; Fan, C.; Livasy, C.; Herschkowitz, J.I.; He, X.; Perou, C.M. Phenotypic and molecular characterization of the claudin-low intrinsic subtype of breast cancer. Breast Cancer Res. 2010, 12, R68. [Google Scholar] [CrossRef]
- Smart, C.E.; Morrison, B.J.; Saunus, J.M.; Vargas, A.C.; Keith, P.; Reid, L.; Wockner, L.; Amiri, M.A.; Sarkar, D.; Simpson, P.T.; et al. In Vitro Analysis of Breast Cancer Cell Line Tumourspheres and Primary Human Breast Epithelia Mammospheres Demonstrates Inter- and Intrasphere Heterogeneity. PLoS ONE 2013, 8, e64388. [Google Scholar] [CrossRef]
- Kao, J.; Salari, K.; Bocanegra, M.; Choi, Y.-L.; Girard, L.; Gandhi, J.; Kwei, K.A.; Hernandez-Boussard, T.; Wang, P.; Gazdar, A.F.; et al. Molecular Profiling of Breast Cancer Cell Lines Defines Relevant Tumor Models and Provides a Resource for Cancer Gene Discovery. PLoS ONE 2009, 4, e6146. [Google Scholar] [CrossRef]
- Daemen, A.; Griffith, O.L.; Heiser, L.M.; Wang, N.J.; Enache, O.M.; Sanborn, Z.; Pepin, F.; Durinck, S.; Korkola, J.E.; Griffith, M.; et al. Modeling precision treatment of breast cancer. Genome Boil. 2013, 14, R110. [Google Scholar] [CrossRef]
- Barretina, J.; Caponigro, G.; Stransky, N.; Venkatesan, K.; Margolin, A.A.; Kim, S.; Wilson, C.J.; Lehár, J.; Kryukov, G.V.; Sonkin, D.; et al. Addendum: The Cancer Cell Line Encyclopedia enables predictive modelling of anticancer drug sensitivity. Nature 2012, 492, 290. [Google Scholar] [CrossRef]
- Subramanian, A.; Narayan, R.; Corsello, S.M.; Peck, D.D.; Natoli, T.E.; Lu, X.; Gould, J.; Davis, J.F.; Tubelli, A.A.; Asiedu, J.K.; et al. A Next Generation Connectivity Map: L1000 platform and the first 1,000,000 profiles. Cell 2017, 171, 1437–1452. [Google Scholar] [CrossRef]
- Cope, L.M.; Fackler, M.J.; Lopez-Bujanda, Z.; Wolff, A.C.; Visvanathan, K.; Gray, J.W.; Sukumar, S.; Umbricht, C.B. Do Breast Cancer Cell Lines Provide a Relevant Model of the Patient Tumor Methylome? PLoS ONE 2014, 9, e105545. [Google Scholar] [CrossRef]
- Jiang, G.; Zhang, S.; Yazdanparast, A.; Li, M.; Pawar, A.V.; Liu, Y.; Inavolu, S.M.; Cheng, L. Comprehensive comparison of molecular portraits between cell lines and tumors in breast cancer. BMC Genom. 2016, 17, 1079. [Google Scholar] [CrossRef]
- Heiser, L.M.; Sadanandam, A.; Kuo, W.L.; Benz, S.C.; Goldstein, T.C.; Ng, S.; Gibb, W.J.; Wang, N.J.; Ziyad, S.; Tong, F.; et al. Subtype and pathway specific responses to anticancer compounds in breast cancer. Proc. Natl. Acad. Sci. USA 2012, 109, 2724–2729. [Google Scholar] [CrossRef]
- Hugo, H.; Ackland, M.L.; Blick, T.; Lawrence, M.G.; Clements, J.A.; Williams, E.D.; Thompson, E.W. Epithelial—mesenchymal and mesenchymal—epithelial transitions in carcinoma progression. J. Cell. Physiol. 2007, 213, 374–383. [Google Scholar] [CrossRef]
- Nieto, M.A.; Huang, R.Y.J.; Jackson, R.A.; Thiery, J.P. EMT: 2016. Cell 2016, 166, 21–45. [Google Scholar] [CrossRef] [Green Version]
- Jolly, M.K.; Tripathi, S.C.; Jia, D.; Mooney, S.M.; Celiktas, M.; Hanash, S.M.; Mani, S.A.; Pienta, K.J.; Ben-Jacob, E.; Levine, H. Stability of the hybrid epithelial/mesenchymal phenotype. Oncotarget 2016, 7, 27067–27084. [Google Scholar] [CrossRef] [Green Version]
- Bhatia, S.; Monkman, J.; Toh, A.K.L.; Nagaraj, S.H.; Thompson, E.W. Targeting epithelial–mesenchymal plasticity in cancer: clinical and preclinical advances in therapy and monitoring. Biochem. J. 2017, 474, 3269–3306. [Google Scholar] [CrossRef]
- Fischer, K.R.; Durrans, A.; Lee, S.; Sheng, J.; Li, F.; Wong, S.T.; Choi, H.; El Rayes, T.; Ryu, S.; Troeger, J.; et al. Epithelial-to-mesenchymal transition is not required for lung metastasis but contributes to chemoresistance. Nature 2015, 527, 472–476. [Google Scholar] [CrossRef]
- Zheng, X.; Carstens, J.L.; Kim, J.; Scheible, M.; Kaye, J.; Sugimoto, H.; Wu, C.C.; LeBleu, V.S.; Kalluri, R. Epithelial-to-mesenchymal transition is dispensable for metastasis but induces chemoresistance in pancreatic cancer. Nature 2015, 527, 525–530. [Google Scholar] [CrossRef] [Green Version]
- Redfern, A.D.; Spalding, L.J.; Thompson, E.W. The Kraken Wakes: induced EMT as a driver of tumour aggression and poor outcome. Clin. Exp. Metastasis 2018, 35, 285–308. [Google Scholar] [CrossRef]
- Blick, T.; Widodo, E.; Hugo, H.; Waltham, M.; Lenburg, M.E.; Neve, R.M.; Thompson, E.W. Epithelial mesenchymal transition traits in human breast cancer cell lines. Clin. Exp. Metastasis 2008, 25, 629–642. [Google Scholar] [CrossRef]
- Blick, T.; Hugo, H.; Widodo, E.; Waltham, M.; Pinto, C.; Mani, S.A.; Weinberg, R.A.; Neve, R.M.; Lenburg, M.E.; Thompson, E.W. Epithelial Mesenchymal Transition Traits in Human Breast Cancer Cell Lines Parallel the CD44hi/CD24lo/- Stem Cell Phenotype in Human Breast Cancer. J. Mammary Gland. Boil. Neoplasia 2010, 15, 235–252. [Google Scholar] [CrossRef]
- Tan, T.Z.; Miow, Q.H.; Miki, Y.; Noda, T.; Mori, S.; Huang, R.Y.-J.; Thiery, J.P. Epithelial-mesenchymal transition spectrum quantification and its efficacy in deciphering survival and drug responses of cancer patients. EMBO Mol. Med. 2014, 6, 1279–1293. [Google Scholar] [CrossRef]
- Foroutan, M.; Cursons, J.; Hediyeh-Zadeh, S.; Thompson, E.W.; Davis, M.J. A Transcriptional Program for Detecting TGFbeta-Induced EMT in Cancer. Mol. Cancer Res. 2017, 15, 619–631. [Google Scholar] [CrossRef]
- Foroutan, M.; Bhuva, D.D.; Lyu, R.; Horan, K.; Cursons, J.; Davis, M.J. Single sample scoring of molecular phenotypes. BMC Bioinform. 2018, 19, 404. [Google Scholar] [CrossRef]
- George, J.T.; Jolly, M.K.; Xu, S.; Somarelli, J.A.; Levine, H. Survival outcomes in cancer patients predicted by a partial EMT gene expression scoring metric. Cancer Res. 2017, 77, 6415–6428. [Google Scholar] [CrossRef]
- Cursons, J.; Leuchowius, K.-J.; Waltham, M.; Tomaskovic-Crook, E.; Foroutan, M.; Bracken, C.P.; Redfern, A.; Crampin, E.J.; Street, I.; Davis, M.J.; et al. Stimulus-dependent differences in signalling regulate epithelial-mesenchymal plasticity and change the effects of drugs in breast cancer cell lines. Cell Commun. Signal. 2015, 13, 26. [Google Scholar] [CrossRef]
- Buonato, J.M.; Lan, I.S.; Lazzara, M.J. EGF augments TGFβ-induced epithelial–mesenchymal transition by promoting SHP2 binding to GAB1. J. Cell Sci. 2015, 128, 3898–3909. [Google Scholar] [CrossRef]
- Hugo, H.J.; Wafai, R.; Blick, T.; Thompson, E.W.; Newgreen, D.F. Staurosporine augments EGF-mediated EMT in PMC42-LA cells through actin depolymerisation, focal contact size reduction and Snail1 induction—A model for cross-modulation. BMC Cancer 2009, 9, 235. [Google Scholar] [CrossRef]
- Kurimoto, R.; Iwasawa, S.; Ebata, T.; Ishiwata, T.; Sekine, I.; Tada, Y.; Tatsumi, K.; Koide, S.; Iwama, A.; Takiguchi, Y. Drug resistance originating from a TGF-beta/FGF-2-driven epithelial-to-mesenchymal transition and its reversion in human lung adenocarcinoma cell lines harboring an EGFR mutation. Int. J. Oncol. 2016, 48, 1825–1836. [Google Scholar] [CrossRef]
- Tiwari, N.; Tiwari, V.K.; Waldmeier, L.; Balwierz, P.J.; Arnold, P.; Pachkov, M.; Meyer-Schaller, N.; Schübeler, D.; Van Nimwegen, E.; Christofori, G. Sox4 Is a Master Regulator of Epithelial-Mesenchymal Transition by Controlling Ezh2 Expression and Epigenetic Reprogramming. Cancer Cell 2013, 23, 768–783. [Google Scholar] [CrossRef] [Green Version]
- Yamamoto, M.; Sakane, K.; Tominaga, K.; Gotoh, N.; Niwa, T.; Kikuchi, Y.; Tada, K.; Goshima, N.; Semba, K.; Inoue, J. Intratumoral bidirectional transitions between epithelial and mesenchymal cells in triple-negative breast cancer. Cancer Sci. 2017, 108, 1210–1222. [Google Scholar] [CrossRef] [Green Version]
- Taube, J.H.; Herschkowitz, J.I.; Komurov, K.; Zhou, A.Y.; Gupta, S.; Yang, J.; Hartwell, K.; Onder, T.T.; Gupta, P.B.; Evans, K.W.; et al. Core epithelial-to-mesenchymal transition interactome gene-expression signature is associated with claudin-low and metaplastic breast cancer subtypes. Proc. Natl. Acad. Sci. USA 2010, 107, 15449–15454. [Google Scholar] [CrossRef] [Green Version]
- Morel, A.-P.; Lièvre, M.; Thomas, C.; Hinkal, G.; Ansieau, S.; Puisieux, A. Generation of Breast Cancer Stem Cells through Epithelial-Mesenchymal Transition. PLoS ONE 2008, 3, e2888. [Google Scholar] [CrossRef]
- Briem, E.; Ingthorsson, S.; Traustadottir, G.A.; Hilmarsdottir, B.; Gudjonsson, T. Application of the D492 Cell Lines to Explore Breast Morphogenesis, EMT and Cancer Progression in 3D Culture. J. Mammary Gland. Boil. Neoplasia 2019, 24, 139–147. [Google Scholar] [CrossRef] [Green Version]
- Mani, S.A.; Guo, W.; Liao, M.-J.; Eaton, E.N.; Ayyanan, A.; Zhou, A.Y.; Brooks, M.; Reinhard, F.; Zhang, C.C.; Shipitsin, M.; et al. The epithelial-mesenchymal transition generates cells with properties of stem cells. Cell 2008, 133, 704–715. [Google Scholar] [CrossRef]
- Hugo, H.J.; Kokkinos, M.I.; Blick, T.; Ackland, M.L.; Thompson, E.W.; Newgreen, D.F. Defining the E-Cadherin Repressor Interactome in Epithelial-Mesenchymal Transition: The PMC42 Model as a Case Study. Cells Tissues Organs 2011, 193, 23–40. [Google Scholar] [CrossRef]
- Whitehead, R.H.; Bertoncello, I.; Webber, L.M.; Pedersen, J.S. A new human breast carcinoma cell line (PMC42) with stem cell characteristics. I. Morphologic characterization. J. Natl. Cancer Inst. 1983, 70, 649–661. [Google Scholar]
- Whitehead, R.H.; Webber, L.M.; Bertoncello, I.; Vitali, A.A.; Monaghan, P. A New Human Breast Carcinoma Cell Line (PMC42) With Stem Cell Characteristics. II. Characterization of Cells Growing as Organoids. J. Natl. Cancer Inst. 1983, 71, 1193–1203. [Google Scholar]
- Whitehead, R.H.; Quirk, S.J.; Vitali, A.A.; Funder, J.W.; Sutherland, R.L.; Murphy, L.C. A new human breast carcinoma cell line (PMC42) with stem cell characteristics. III. Hormone receptor status and responsiveness. J. Natl. Cancer Inst. 1984, 73, 643–648. [Google Scholar]
- Ackland, M.L.; Newgreen, D.F.; Fridman, M.; Waltham, M.C.; Arvanitis, A.; Minichiello, J.; Price, J.T.; Thompson, E.W. Epidermal Growth Factor-Induced Epithelio-Mesenchymal Transition in Human Breast Carcinoma Cells. Lab. Investig. 2003, 83, 435–448. [Google Scholar] [CrossRef] [Green Version]
- Ackland, M.; Michalczyk, A.; Whitehead, R. PMC42, A Novel Model for the Differentiated Human Breast. Exp. Cell Res. 2001, 263, 14–22. [Google Scholar] [CrossRef]
- Li, H.; Durbin, R. Fast and accurate short read alignment with Burrows–Wheeler transform. Bioinformatics 2009, 25, 1754–1760. [Google Scholar] [CrossRef]
- Li, H.; Handsaker, B.; Wysoker, A.; Fennell, T.; Ruan, J.; Homer, N.; Marth, G.; Abecasis, G.; Durbin, R. The Sequence Alignment/Map format and SAMtools. Bioinformatics 2009, 25, 2078–2079. [Google Scholar] [CrossRef] [Green Version]
- McKenna, A.; Hanna, M.; Banks, E.; Sivachenko, A.; Cibulskis, K.; Kernytsky, A.; Garimella, K.; Altshuler, D.; Gabriel, S.; Daly, M.; et al. The Genome Analysis Toolkit: A MapReduce framework for analyzing next-generation DNA sequencing data. Genome Res. 2010, 20, 1297–1303. [Google Scholar] [CrossRef] [Green Version]
- Wang, K.; Li, M.; Hakonarson, H. ANNOVAR: functional annotation of genetic variants from high-throughput sequencing data. Nucleic Acids Res. 2010, 38, e164. [Google Scholar] [CrossRef]
- ANNOVAR. Available online: http://openbioinformatics.org/annovar/ (accessed on 30 January 2019).
- Boeva, V.; Popova, T.; Bleakley, K.; Chiche, P.; Cappo, J.; Schleiermacher, G.; Janoueix-Lerosey, I.; Delattre, O.; Barillot, E. Control-FREEC: A tool for assessing copy number and allelic content using next-generation sequencing data. Bioinformatics 2012, 28, 423–425. [Google Scholar] [CrossRef]
- Douville, C.; Carter, H.; Kim, R.; Niknafs, N.; Diekhans, M.; Stenson, P.D.; Cooper, D.N.; Ryan, M.; Karchin, R. CRAVAT: cancer-related analysis of variants toolkit. Bioinformatics 2013, 29, 647–648. [Google Scholar] [CrossRef]
- Carter, H.; Samayoa, J.; Hruban, R.H.; Karchin, R. Prioritization of driver mutations in pancreatic cancer using cancer-specific high-throughput annotation of somatic mutations (CHASM). Cancer Boil. Ther. 2010, 10, 582–587. [Google Scholar] [CrossRef] [Green Version]
- Carter, H.; Chen, S.; Isik, L.; Tyekucheva, S.; Velculescu, V.E.; Kinzler, K.W.; Vogelstein, B.; Karchin, R. Cancer-specific High-throughput Annotation of Somatic Mutations: computational prediction of driver missense mutations. Cancer Res. 2009, 69, 6660–6667. [Google Scholar] [CrossRef]
- Carter, H.; Douville, C.; Stenson, P.D.; Cooper, D.N.; Karchin, R. Identifying Mendelian disease genes with the Variant Effect Scoring Tool. BMC Genom. 2013, 14, S3. [Google Scholar] [CrossRef]
- Morpheus. Available online: https://software.broadinstitute.org/morpheus/ (accessed on 25 Febrary 2019).
- Mar, J.C.; Kimura, Y.; Schroder, K.; Irvine, K.M.; Hayashizaki, Y.; Suzuki, H.; Hume, D.; Quackenbush, J. Data-driven normalization strategies for high-throughput quantitative RT-PCR. BMC Bioinform. 2009, 10, 110. [Google Scholar] [CrossRef]
- Trapnell, C.; Roberts, A.; Goff, L.; Pertea, G.; Kim, D.; Kelley, D.R.; Pimentel, H.; Salzberg, S.L.; Rinn, J.L.; Pachter, L. Differential gene and transcript expression analysis of RNA-seq experiments with TopHat and Cufflinks. Nat. Protoc. 2012, 7, 562–578. [Google Scholar] [CrossRef] [Green Version]
- GSEA. Available online: http://www.broad.mit.edu/gsea (accessed on 24 April 2019).
- Wiśniewski, J.R.; Zougman, A.; Nagaraj, N.; Mann, M. Universal sample preparation method for proteome analysis. Nat. Methods 2009, 6, 359–362. [Google Scholar] [CrossRef]
- UniProt. Available online: https://www.uniprot.org/ (accessed on 25 November 2018).
- PeakView Software. Available online: https://sciex.com/products/software/peakview-software (accessed on 25 November 2018).
- Clough, T.; Thaminy, S.; Ragg, S.; Aebersold, R.; Vitek, O. Statistical protein quantification and significance analysis in label-free LC-MS experiments with complex designs. BMC Bioinform. 2012, 13, S6. [Google Scholar] [CrossRef]
- Ricardo, S.; Vieira, A.F.; Gerhard, R.; Leitão, D.; Pinto, R.; Cameselle-Teijeiro, J.F.; Milanezi, F.; Schmitt, F.; Paredes, J. Breast cancer stem cell markers CD44, CD24 and ALDH1: expression distribution within intrinsic molecular subtype. J. Clin. Pathol. 2011, 64, 937–946. [Google Scholar] [CrossRef]
- Matalkah, F.; Martin, E.; Zhao, H.; Agazie, Y.M. SHP2 acts both upstream and downstream of multiple receptor tyrosine kinases to promote basal-like and triple-negative breast cancer. Breast Cancer Res. 2016, 18, 25. [Google Scholar] [CrossRef]
- Bhatia, S.; Monkman, J.; Blick, T.; Pinto, C.; Waltham, M.; Nagaraj, S.H.; Thompson, E.W. Interrogation of Phenotypic Plasticity between Epithelial and Mesenchymal States in Breast Cancer. J. Clin. Med. 2019, 8, 893. [Google Scholar] [CrossRef]
- Carter, S.L.; Eklund, A.C.; Kohane, I.S.; Harris, L.N.; Szallasi, Z. A signature of chromosomal instability inferred from gene expression profiles predicts clinical outcome in multiple human cancers. Nat. Genet. 2006, 38, 1043–1048. [Google Scholar] [CrossRef]
- Gunasinghe, N.P.A.D.; Wells, A.; Thompson, E.W.; Hugo, H.J. Mesenchymal–epithelial transition (MET) as a mechanism for metastatic colonisation in breast cancer. Cancer Metastasis Rev. 2012, 31, 469–478. [Google Scholar] [CrossRef]
- Tsubakihara, Y.; Moustakas, A. Epithelial–mesenchymal Transition and Metastasis under the Control of Transforming Growth Factor beta. Int. J. Mol. Sci. 2018, 19, 3672. [Google Scholar] [CrossRef]
- Pino, M.S.; Kikuchi, H.; Zeng, M.; Herraiz, M.T.; Sperduti, I.; Berger, D.; Park, D.Y.; Iafrate, A.J.; Zukerberg, L.R.; Chung, D.C. Epithelial to mesenchymal transition is impaired in colon cancer cells with microsatellite instability. Gastroenterology 2010, 138, 1406–1417. [Google Scholar] [CrossRef]
- Sommerova, L.; Ondrouskova, E.; Vojtesek, B.; Hrstka, R. Suppression of AGR2 in a TGF-β-induced Smad regulatory pathway mediates epithelial-mesenchymal transition. BMC Cancer 2017, 17, 546. [Google Scholar] [CrossRef]
- Gozgit, J.M.; Pentecost, B.T.; Marconi, S.A.; Ricketts-Loriaux, R.S.J.; Otis, C.N.; Arcaro, K.F. PLD1 is overexpressed in an ER-negative MCF-7 cell line variant and a subset of phospho-Akt-negative breast carcinomas. Br. J. Cancer 2007, 97, 809–817. [Google Scholar] [CrossRef]
- Ye, X.; Brabletz, T.; Kang, Y.; Longmore, G.D.; Nieto, M.A.; Stanger, B.Z.; Yang, J.; Weinberg, R.A. Upholding a role for EMT in breast cancer metastasis. Nature 2017, 547, E1–E3. [Google Scholar] [CrossRef]
- Fischer, K.R.; Altorki, N.K.; Mittal, V.; Gao, D. Fischer et al. reply. Nature 2017, 547, E5. [Google Scholar] [CrossRef]
- Brabletz, T.; Kalluri, R. EMT in cancer. Nat. Rev. Cancer 2018, 18, 128–134. [Google Scholar] [CrossRef]
- Beerling, E.; Seinstra, D.; De Wit, E.; Kester, L.; Van Der Velden, D.; Maynard, C.; Schäfer, R.; Van Diest, P.; Voest, E.; Van Oudenaarden, A.; et al. Plasticity between Epithelial and Mesenchymal States Unlinks EMT from Metastasis-Enhancing Stem Cell Capacity. Cell Rep. 2016, 14, 2281–2288. [Google Scholar] [CrossRef] [Green Version]
- Brabletz, T. To differentiate or not—Routes towards metastasis. Nat. Rev. Cancer 2012, 12, 425–436. [Google Scholar] [CrossRef]
- van Denderen, B.J.; Thompson, E.W. Cancer: The to and fro of tumour spread. Nature 2013, 493, 487–488. [Google Scholar] [CrossRef]
- Savagner, P.; Kusewitt, D.F.; Carver, E.A.; Magnino, F.; Choi, C.; Gridley, T.; Hudson, L.G. Developmental transcription factor slug is required for effective re-epithelialization by adult keratinocytes. J. Cell. Physiol. 2005, 202, 858–866. [Google Scholar] [CrossRef]
- Vicentic, J.M.; Drakulic, D.; Garcia, I.; Vukovic, V.; Aldaz, P.; Puskas, N.; Nikolic, I.; Tasic, G.; Raicevic, S.; Garros-Regulez, L.; et al. SOX3 can promote the malignant behavior of glioblastoma cells. Cell Oncol. 2019, 42, 41–54. [Google Scholar] [CrossRef]
- Guo, Y.; Yin, J.; Tang, M.; Yu, X. Downregulation of SOX3 leads to the inhibition of the proliferation, migration and invasion of osteosarcoma cells. Int. J. Oncol. 2018, 52, 1277–1284. [Google Scholar] [CrossRef] [Green Version]
- Qiu, M.; Chen, D.; Shen, C.; Shen, J.; Zhao, H.; He, Y. Sex-determining region Y-box protein 3 induces epithelial-mesenchymal transition in osteosarcoma cells via transcriptional activation of Snail1. J. Exp. Clin. Cancer Res. 2017, 36, 46. [Google Scholar] [CrossRef]
- Rudin, C.M.; Durinck, S.; Stawiski, E.W.; Poirier, J.T.; Modrusan, Z.; Shames, D.S.; Bergbower, E.A.; Guan, Y.; Shin, J.; Guillory, J.; et al. Comprehensive genomic analysis identifies SOX2 as a frequently amplified gene in small-cell lung cancer. Nat. Genet. 2012, 44, 1111–1116. [Google Scholar] [CrossRef]
- Badve, S.; Turbin, D.; Thorat, M.A.; Morimiya, A.; Nielsen, T.O.; Perou, C.M.; Dunn, S.; Huntsman, D.G.; Nakshatri, H. FOXA1 Expression in Breast Cancer Correlation with Luminal Subtype A and Survival. Clin. Cancer Res. 2007, 13, 4415–4421. [Google Scholar] [CrossRef]
- Rangel, N.; Fortunati, N.; Osella-Abate, S.; Annaratone, L.; Isella, C.; Catalano, M.G.; Rinella, L.; Metovic, J.; Boldorini, R.; Balmativola, D.; et al. FOXA1 and AR in invasive breast cancer: new findings on their co-expression and impact on prognosis in ER-positive patients. BMC Cancer 2018, 18, 703. [Google Scholar] [CrossRef]
- Fu, X.; Jeselsohn, R.; Pereira, R.; Hollingsworth, E.F.; Creighton, C.J.; Li, F.; Shea, M.; Nardone, A.; De Angelis, C.; Heiser, L.M.; et al. FOXA1 overexpression mediates endocrine resistance by altering the ER transcriptome and IL-8 expression in ER-positive breast cancer. Proc. Natl. Acad. Sci. USA 2016, 113, E6600–E6609. [Google Scholar] [CrossRef] [Green Version]
- Bernardo, G.M.; Bebek, G.; Ginther, C.L.; Sizemore, S.T.; Lozada, K.L.; Miedler, J.D.; Anderson, L.A.; Godwin, A.K.; Abdul-Karim, F.W.; Slamon, D.J.; et al. FOXA1 represses the molecular phenotype of basal breast cancer cells. Oncogene 2013, 32, 554–563. [Google Scholar] [CrossRef]
- Al Moustafa, A.-E.; Ala-Eddin, A.M. EGF-receptor signaling and epithelial-mesenchymal transition in human carcinomas. Front. Biosci. 2012, 4, 671–684. [Google Scholar] [CrossRef]
- Lo, H.-W.; Hsu, S.-C.; Xia, W.; Cao, X.; Shih, J.-Y.; Wei, Y.; Abbruzzese, J.L.; Hortobagyi, G.N.; Hung, M.-C. Epidermal Growth Factor Receptor Cooperates with Signal Transducer and Activator of Transcription 3 to Induce Epithelial-Mesenchymal Transition in Cancer Cells via Up-regulation of TWIST Gene Expression. Cancer Res. 2007, 67, 9066–9076. [Google Scholar] [CrossRef]
- Mizumoto, A.; Yamamoto, K.; Nakayama, Y.; Takara, K.; Nakagawa, T.; Hirano, T.; Hirai, M. Induction of epithelial–mesenchymal transition via activation of epidermal growth factor receptor contributes to sunitinib resistance in human renal cell carcinoma cell lines. J. Pharmacol. Exp. Ther. 2015, 355, 152–158. [Google Scholar] [CrossRef]
- Nie, F.; Yang, J.; Wen, S.; An, Y.-L.; Ding, J.; Ju, S.-H.; Zhao, Z.; Chen, H.-J.; Peng, X.-G.; Wong, S.T.C.; et al. Involvement of epidermal growth factor receptor overexpression in the promotion of breast cancer brain metastasis. Cancer 2012, 118, 5198–5209. [Google Scholar] [CrossRef] [Green Version]
- Tang, D.; Tao, D.; Fang, Y.; Deng, C.; Xu, Q.; Zhou, J. TNF-Alpha Promotes Invasion and Metastasis via NF-Kappa B Pathway in Oral Squamous Cell Carcinoma. Med Sci. Monit. Basic Res. 2017, 23, 141–149. [Google Scholar] [CrossRef]
- Li, C.W.; Xia, W.; Huo, L.; Lim, S.O.; Wu, Y.; Hsu, J.L.; Chao, C.H.; Yamaguchi, H.; Yang, N.K.; Ding, Q.; et al. Epithelial–mesenchymal transition induced by TNF-alpha requires NF-kappaB-mediated transcriptional upregulation of Twist1. Cancer Res. 2012, 72, 1290–1300. [Google Scholar] [CrossRef]
- Marcucci, F.; Stassi, G.; De Maria, R. Epithelial–mesenchymal transition: a new target in anticancer drug discovery. Nat. Rev. Drug Discov. 2016, 15, 311–325. [Google Scholar] [CrossRef]
- Ohshima, K.; Hatakeyama, K.; Nagashima, T.; Watanabe, Y.; Kanto, K.; Doi, Y.; Ide, T.; Shimoda, Y.; Tanabe, T.; Ohnami, S.; et al. Integrated analysis of gene expression and copy number identified potential cancer driver genes with amplification-dependent overexpression in 1,454 solid tumors. Sci. Rep. 2017, 7, 1546. [Google Scholar] [CrossRef]
- Hurt, E.M.; Kawasaki, B.T.; Klarmann, G.J.; Thomas, S.B.; Farrar, W.L. CD44+ CD24− prostate cells are early cancer progenitor/stem cells that provide a model for patients with poor prognosis. Br. J. Cancer 2008, 98, 756–765. [Google Scholar] [CrossRef]
- Klonisch, T.; Wiechec, E.; Hombach-Klonisch, S.; Ande, S.R.; Wesselborg, S.; Schulze-Osthoff, K.; Los, M. Cancer stem cell markers in common cancers—Therapeutic implications. Trends Mol. Med. 2008, 14, 450–460. [Google Scholar] [CrossRef]
- Li, W.; Ma, H.; Zhang, J.; Zhu, L.; Wang, C.; Yang, Y. Unraveling the roles of CD44/CD24 and ALDH1 as cancer stem cell markers in tumorigenesis and metastasis. Sci. Rep. 2017, 7, 13856. [Google Scholar] [CrossRef]
- Fillmore, C.M.; Kuperwasser, C. Human breast cancer cell lines contain stem-like cells that self-renew, give rise to phenotypically diverse progeny and survive chemotherapy. Breast Cancer Res. 2008, 10, R25. [Google Scholar] [CrossRef]
- Bane, A.; Viloria-Petit, A.; Pinnaduwage, D.; Mulligan, A.M.; O’Malley, F.P.; Andrulis, I.L. Clinical–pathologic significance of cancer stem cell marker expression in familial breast cancers. Breast Cancer Res. Treat. 2013, 140, 195–205. [Google Scholar] [CrossRef]
- Jaggupilli, A.; Elkord, E. Significance of CD44 and CD24 as Cancer Stem Cell Markers: An Enduring Ambiguity. Clin. Dev. Immunol. 2012, 2012, 1–11. [Google Scholar] [CrossRef] [Green Version]
- Jones, N.P.; Schulze, A. Targeting cancer metabolism—Aiming at a tumour’s sweet-spot. Drug Discov. Today 2012, 17, 232–241. [Google Scholar] [CrossRef]
- Heiden, M.G.V. Targeting cancer metabolism: a therapeutic window opens. Nat. Rev. Drug Discov. 2011, 10, 671–684. [Google Scholar] [CrossRef] [Green Version]
- Meijer, T.W.; Peeters, W.J.; Dubois, L.J.; Van Gisbergen, M.W.; Biemans, R.; Venhuizen, J.-H.; Span, P.N.; Bussink, J. Targeting glucose and glutamine metabolism combined with radiation therapy in non-small cell lung cancer. Lung Cancer 2018, 126, 32–40. [Google Scholar] [CrossRef]
- Chao, T.-K.; Huang, T.-S.; Liao, Y.-P.; Huang, R.-L.; Su, P.-H.; Shen, H.-Y.; Lai, H.-C.; Wang, Y.-C. Pyruvate kinase M2 is a poor prognostic marker of and a therapeutic target in ovarian cancer. PLoS ONE 2017, 12, e0182166. [Google Scholar] [CrossRef]
- Shackelford, D.B.; Abt, E.; Gerken, L.; Vasquez, D.S.; Seki, A.; Leblanc, M.; Wei, L.; Fishbein, M.C.; Czernin, J.; Mischel, P.S.; et al. LKB1 inactivation dictates therapeutic response of non-small cell lung cancer to the metabolism drug phenformin. Cancer Cell 2013, 23, 143–158. [Google Scholar] [CrossRef]
- Hardie, R.-A.; Van Dam, E.; Cowley, M.; Han, T.-L.; Balaban, S.; Pajic, M.; Pinese, M.; Iconomou, M.; Shearer, R.F.; McKenna, J.; et al. Mitochondrial mutations and metabolic adaptation in pancreatic cancer. Cancer Metab. 2017, 5, 7. [Google Scholar] [CrossRef]
- Pelicano, H.; Zhang, W.; Liu, J.; Hammoudi, N.; Dai, J.; Xu, R.-H.; Pusztai, L.; Huang, P. Mitochondrial dysfunction in some triple-negative breast cancer cell lines: role of mTOR pathway and therapeutic potential. Breast Cancer Res. 2014, 16, 434. [Google Scholar] [CrossRef]


| Chromosome No. | p-Value across ET vs. LA |
|---|---|
| 22 | 5.28847 × 10−45 |
| 5 | 1.50398 × 10⁻²⁸ |
| 13 | 7.71473 × 10⁻²³ |
| 11 | 9.42164 × 10⁻²⁰ |
| 3 | 3.33503 × 10⁻¹⁸ |
| 7 | 8.49205 × 10⁻¹⁴ |
| 8 | 3.73987 × 10⁻⁸ |
| 9 | 1.08547 × 10⁻⁶ |
| 10 | 0.012162341 |
| X | 0.0151172 |
| 14 | 0.022502942 |
| 18 | 0.083804992 |
| 12 | 0.260603283 |
| 1 | 0.278286015 |
| 15 | 0.531258862 |
| 2 | 0.678929758 |
| 6 | 0.717332498 |
| 16 | 0.748135128 |
| 4 | 0.75812698 |
| 17 | 0.771687988 |
| 20 | 0.814301536 |
| 21 | 0.823855275 |
| 19 | 0.928168854 |
| Cytokines and Growth Factors (CGF) | Transcription Factor (TF) | Homeodomain Proteins (HP) | Cell Differentiation Markers (CM) | Protein Kinases (PK) | Translocated Cancer Genes (TCG) | Oncogenes | Tumour Suppressors | |
|---|---|---|---|---|---|---|---|---|
| Tumour suppressors | 0 | 1 | 0 | 0 | 1 | 0 | 0 | 4* |
| Oncogenes | 1 | 4 | 1 | 1 | 1 | 8 | 10& | |
| Translocated cancer genes | 0 | 4 | 1 | 0 | 1 | 8* | ||
| Protein kinases | 0 | 0 | 0 | 0 | 17# | |||
| Cell differentiation markers | 2 | 0 | 0 | 8! | ||||
| Homeodomain proteins | 0 | 4 | 4@ | |||||
| Transcription factor | 0 | 28$ | ||||||
| Cytokines and Growth Factors | 6^ |
| Cytokines and Growth Factors | Transcription Factor | Homeodomain Proteins | Cell Differentiation Markers | Protein Kinases | Translocated Cancer Genes | Oncogenes | Tumour Suppressors | |
|---|---|---|---|---|---|---|---|---|
| Tumour suppressors | 0 | 1 | 0 | 0 | 0 | 0 | 0 | 3* |
| Oncogenes | 0 | 3 | 1 | 0 | 1 | 7 | 8& | |
| Translocated cancer genes | 0 | 3 | 1 | 0 | 1 | 7* | ||
| Protein kinases | 0 | 0 | 0 | 0 | 15# | |||
| Cell differentiation markers | 1 | 0 | 0 | 6! | ||||
| Homeodomain proteins | 0 | 3 | 3@ | |||||
| Transcription factor | 0 | 24$ | ||||||
| Cytokines and Growth Factors | 5^ |
© 2019 by the authors. Licensee MDPI, Basel, Switzerland. This article is an open access article distributed under the terms and conditions of the Creative Commons Attribution (CC BY) license (http://creativecommons.org/licenses/by/4.0/).
Share and Cite
Bhatia, S.; Monkman, J.; Blick, T.; Duijf, P.H.; Nagaraj, S.H.; Thompson, E.W. Multi-Omics Characterization of the Spontaneous Mesenchymal–Epithelial Transition in the PMC42 Breast Cancer Cell Lines. J. Clin. Med. 2019, 8, 1253. https://doi.org/10.3390/jcm8081253
Bhatia S, Monkman J, Blick T, Duijf PH, Nagaraj SH, Thompson EW. Multi-Omics Characterization of the Spontaneous Mesenchymal–Epithelial Transition in the PMC42 Breast Cancer Cell Lines. Journal of Clinical Medicine. 2019; 8(8):1253. https://doi.org/10.3390/jcm8081253
Chicago/Turabian StyleBhatia, Sugandha, James Monkman, Tony Blick, Pascal HG Duijf, Shivashankar H. Nagaraj, and Erik W. Thompson. 2019. "Multi-Omics Characterization of the Spontaneous Mesenchymal–Epithelial Transition in the PMC42 Breast Cancer Cell Lines" Journal of Clinical Medicine 8, no. 8: 1253. https://doi.org/10.3390/jcm8081253