Could Neutrophil-to-Lymphocyte Ratio (NLR) Serve as a Potential Marker for Delirium Prediction in Patients with Acute Ischemic Stroke? A Prospective Observational Study


Abstract
:1. Introduction
2. Materials and Methods
2.1. Data Collection
2.2. Delirium Monitoring
2.3. Ethical Consideration
2.4. Statistical Analysis
3. Results
4. Discussion
5. Conclusions
Author Contributions
Conflicts of Interest
Data and Materials Availability
References
- Barr, J.; Fraser, G.L.; Puntillo, K.; Ely, E.W.; Gélinas, C.; Dasta, J.F.; Davidson, J.E.; Devlin, J.W.; Kress, J.P.; Joffe, A.M.; et al. Clinical Practice Guidelines for the Management of Pain, Agitation, and Delirium in Adult Patients in the Intensive Care Unit. Crit. Care Med. 2013, 41, 263–306. [Google Scholar] [CrossRef] [PubMed]
- Hayhurst, C.J.; Pandharipande, P.P.; Hughes, C.G. Intensive care unit delirium: A review of diagnosis, prevention, and treatment. Anesthesiology 2016, 125, 1229–1241. [Google Scholar] [CrossRef] [PubMed]
- Kotfis, K.; Szylińska, A.; Listewnik, M.; Strzelbicka, M.; Brykczyński, M.; Rotter, I.; Żukowski, M. Early delirium after cardiac surgery: An analysis of incidence and risk factors in elderly (≥65 years) and very elderly (≥80 years) patients. Clin. Interv. Aging 2018, 13, 1061–1070. [Google Scholar] [CrossRef] [PubMed]
- American Psychiatric Association. Diagnostic and Statistical Manual of Mental Disorders: DSM-5, 5th ed.; American Psychiatric Association: Philadelphia, PA, USA, 2013. [Google Scholar]
- Carin-Levy, G.; Mead, G.E.; Nicol, K.; Rush, R.; van Wijck, F. Delirium in acute stroke: Screening tools, incidence rates and predictors: A systematic review. J. Neurol. 2012, 259, 1590–1599. [Google Scholar] [CrossRef] [PubMed]
- Oldenbeuving, A.W.; De Kort, P.L.M.; Jansen, B.P.W.; Algra, A.; Kappelle, L.J.; Roks, G. Delirium in the acute phase after stroke: Incidence, risk factors, and outcome. Neurology 2011, 76, 993–999. [Google Scholar] [CrossRef] [PubMed]
- Gustafson, Y.; Olsson, T.; Eriksson, S.; Asplund, K.; Bucht, G. Acute confusional states (delirium) in stroke patients. Cerebrovasc. Dis. 1991, 1, 257–264. [Google Scholar] [CrossRef]
- Caeiro, L.; Ferro, J.M.; Albuquerque, R.; Figueira, M.L. Delirium in the first days of acute stroke. J. Neurol. 2004, 251, 171–178. [Google Scholar] [CrossRef]
- Qu, J.; Chen, Y.; Luo, G.; Zhong, H.; Xiao, W.; Yin, H. Delirium in the Acute Phase of Ischemic Stroke: Incidence, Risk Factors, and Effects on Functional Outcome. J. Stroke Cerebrovasc. Dis. 2018, 27, 2641–2647. [Google Scholar] [CrossRef]
- Klimiec, E.; Dziedzic, T.; Kowalska, K.; Szyper, A.; Pera, J.; Potoczek, P.; Slowik, A.; Klimkowicz-Mrowiec, A. PRospective Observational POLIsh Study on post-stroke delirium (PROPOLIS): Methodology of hospital-based cohort study on delirium prevalence, predictors and diagnostic tools. BMC Neurol. 2015, 15, 94. [Google Scholar] [CrossRef]
- Pasinska, P.; Kowalska, K.; Klimiec, E.; Szyper-Maciejowska, A.; Wilk, A.; Klimkowicz-Mrowiec, A. Frequency and predictors of post-stroke delirium in PRospective Observational POLIsh Study (PROPOLIS). J. Neurol. 2018, 265, 863–870. [Google Scholar] [CrossRef]
- Marra, A.; Kotfis, K.; Hosie, A.; MacLullich, A.M.J.; Pandharipande, P.P.; Ely, E.W.; Pun, B.T. Delirium Monitoring: Yes or No? That is the Question. Am. J. Crit. Care 2019, 28, 127–135. [Google Scholar] [CrossRef] [PubMed]
- Kotfis, K.; Marra, A.; Ely, E.W. ICU delirium a diagnostic and therapeutic challenge in the intensive care unit. Anaesthesiol. Intensive Ther. 2018, 50, 160–167. [Google Scholar] [CrossRef] [PubMed]
- Mitasova, A.; Kostalova, M.; Bednarik, J.; Michalcakova, R.; Kasparek, T.; Balabanova, P.; Dusek, L.; Vohanka, S.; Ely, E.W. Poststroke delirium incidence and outcomes: Validation of the Confusion Assessment Method for the Intensive Care Unit (CAM-ICU). Crit. Care Med. 2012, 40, 484–490. [Google Scholar] [CrossRef] [PubMed]
- Patel, M.B.; Bednarik, J.; Lee, P.; Shehabi, Y.; Salluh, J.I.; Slooter, A.J.; Klein, K.E.; Skrobik, Y.; Morandi, A.; Spronk, P.E.; et al. Delirium Monitoring in Neurocritically Ill Patients: A Systematic Review. Crit. Care Med. 2018, 46, 1832–1841. [Google Scholar] [CrossRef] [PubMed]
- Khan, B.A.; Zawahiri, M.; Campbell, N.L.; Boustani, M.A. Biomarkers for delirium—A review. J. Am. Geriatr. Soc. 2011, 59, S256–S261. [Google Scholar] [CrossRef] [PubMed]
- Zaal, I.J.; Slooter, A.J. Delirium in critically ill patients: Epidemiology, pathophysiology, diagnosis and management. Drugs 2012, 72, 1457–1471. [Google Scholar] [CrossRef] [PubMed]
- Maldonado, J.R. Neuropathogenesis of delirium: Review of current etiologic theories and common pathways. Am. J. Geriatr. Psychiatry 2013, 21, 1190–1222. [Google Scholar] [CrossRef]
- Egberts, A.; Mattace-Raso, F.U.S. Increased neutrophil-lymphocyte ratio in delirium: A pilot study. Clin. Interv. Aging 2017, 12, 1115–1121. [Google Scholar] [CrossRef] [PubMed]
- Celikbilek, M.; Dogan, S.; Ozbakır, O.; Zararsız, G.; Kücük, H.; Gürsoy, S.; Yurci, A.; Güven, K.; Yücesoy, M. Neutrophil-lymphocyte ratio as a predictor of disease severity in ulcerative colitis. J. Clin. Lab. Anal. 2013, 27, 72–76. [Google Scholar] [CrossRef]
- Tamhane, U.U.; Aneja, S.; Montgomery, D.; Rogers, E.K.; Eagle, K.A.; Gurm, H.S. Association between admission neutrophil to lymphocyte ratio and outcomes in patients with acute coronary syndrome. Am. J. Cardiol. 2008, 102, 653–657. [Google Scholar] [CrossRef]
- Mercan, R.; Bitik, B.; Tufan, A.; Bozbulut, U.B.; Atas, N.; Ozturk, M.A.; Haznedaroglu, S.; Goker, B. The Association Between Neutrophil/Lymphocyte Ratio and Disease Activity in Rheumatoid Arthritis and Ankylosing Spondylitis. J. Clin. Lab. Anal. 2016, 30, 597–601. [Google Scholar] [CrossRef] [PubMed]
- Bonaventura, A.; Liberale, L.; Carbone, F.; Vecchié, A.; Bonomi, A.; Scopinaro, N.; Camerini, G.B.; Papadia, F.S.; Maggi, D.; Cordera, R.; et al. Baseline neutrophil-to-lymphocyte ratio is associated with long-term T2D remission after metabolic surgery. Acta Diabetol. 2019, 16, 741–748. [Google Scholar] [CrossRef] [PubMed]
- Halazun, H.J.; Mergeche, J.L.; Mallon, K.A.; Connolly, E.S.; Heyer, E.J. Neutrophil-lymphocyte ratio as a predictor of cognitive dysfunction in carotid endarterectomy patients. J. Vasc. Surg. 2014, 59, 768–773. [Google Scholar] [CrossRef] [PubMed] [Green Version]
- Kulaksizoglu, B.; Kulaksizoglu, S. Relationship between neutrophil/lymphocyte ratio with oxidative stress and psychopathology in patients with schizophrenia. Neuropsychiatr. Dis. Treat. 2016, 12, 1999–2005. [Google Scholar] [CrossRef] [PubMed]
- Gökhan, S.; Ozhasenekler, A.; Mansur Durgun, H.; Akil, E.; Ustündag, M.; Orak, M. Neutrophil lymphocyte ratios in stroke subtypes and transient ischemic attack. Eur. Rev. Med. Pharmacol. Sci. 2013, 17, 653–657. [Google Scholar] [PubMed]
- Yesil, Y.; Halil, M.; Ulger, Z.; Cankurtaran, M.; Kuyumcu, M.; Öztürk, Z.; Kizilarslanoğlu, C.; Etgül, S.; Arıoğul, S. The evaluation of neutrophil-lymphocyte ratio in Alzheimer’s disease. Dement. Geriatr. Cogn. Disord. 2012, 34, 69–74. [Google Scholar]
- Xue, J.; Huang, W.; Chen, X.; Li, Q.; Cai, Z.; Yu, T.; Shao, B. Neutrophil-to lymphocyte ratio is a prognostic marker in acute ischemic stroke. J. Stroke Cerebrovasc. Dis. 2017, 26, 650–657. [Google Scholar] [CrossRef] [PubMed]
- MacLullich, A.M.; Edelshain, B.T.; Hall, R.J.; De Vries, A.; Howie, S.E.; Pearson, A.; Middleton, S.D.; Gillies, F.; Armstrong, I.R.; White, T.O.; et al. Cerebrospinal fluid interleukin-8 levels are higher in people with hip fracture with perioperative delirium than in controls. J. Am. Geriatr. Soc. 2011, 59, 1151–1153. [Google Scholar] [CrossRef]
- Egberts, A.; Wijnbeld, E.H.; Fekkes, D.; Der Ploeg, M.A.; Ziere, G.; Hooijkaas, H.; Van Der Cammen, T.J.; Mattace-Raso, F.U. Neopterin: A potential biomarker for delirium in elderly patients. Dement. Geriatr. Cognit. Disord. 2015, 39, 116–124. [Google Scholar] [CrossRef]
- Hall, R.J.; Watne, L.O.; Idland, A.V.; Raeder, J.; Frihagen, F.; MacLullich, A.M.; Staff, A.C.; Wyller, T.B.; Fekkes, D. Cerebrospinal fluid levels of neopterin are elevated in delirium after hip fracture. J. Neuroinflamm. 2016, 13, 170. [Google Scholar] [CrossRef]
- Dhabhar, F.S.; Malarkey, W.B.; Neri, E.; McEwen, B.S. Stress-induced redistribution of immune cells from barracks to boulevards to battlefields: A tale of three hormones Curt Richter Award winner. Psychoneuroendocrinology 2012, 37, 1345–1368. [Google Scholar] [CrossRef] [PubMed]
- Kolaczkowska, E.; Kubes, P. Neutrophil recruitment and function in health and inflammation. Nat. Rev. Immunol. 2013, 13, 159–175. [Google Scholar] [CrossRef] [PubMed]
- Summers, C.; Rankin, S.M.; Condliffe, A.M.; Singh, N.; Peters, A.M.; Chilvers, E.R. Neutrophil kinetics in health and disease. Trends Immunol. 2010, 31, 318–324. [Google Scholar] [CrossRef] [PubMed] [Green Version]
- Zahorec, R. Ratio of neutrophil to lymphocyte counts rapid and simple parameter of systemic inflammation and stress in critically ill. Bratisl. Lek. Listy 2001, 102, 5–14. [Google Scholar] [PubMed]
- Simone, M.J.; Tan, Z.S. The role of inflammation in the pathogenesis of delirium and dementia in older adults: A review. CNS Neurosci. Ther. 2011, 17, 506–513. [Google Scholar] [CrossRef] [PubMed]
- Yu, H.; Jiang, L.; Yao, L.; Gan, C.; Han, X.; Liu, R.; Su, N. Predictive value of the neutrophil-to-lymphocyte ratio and hemoglobin in systemic lupus erythematosus. Exp. Ther. Med. 2018, 16, 1547–1553. [Google Scholar] [PubMed]
- Wu, Y.; He, Q.; Wei, Y.; Zhu, J.; He, Z.; Zhang, X.; Guo, Z.; Xu, R.; Cheng, C.; Huang, Z.; et al. The association of neutrophil-to-lymphocyte ratio and delayed cerebral ischemia in patients with aneurysmal subarachnoid hemorrhage: Possible involvement of cerebral blood perfusion. Neuropsychiatr. Dis. Treat. 2019, 15, 1001–1007. [Google Scholar] [CrossRef]
- Kotfis, K.; Biernawska, J.; Zegan-Barańska, M.; Żukowski, M. Peripheral Blood Lymphocyte Subsets (CD4+, CD8+ T Cells, NK Cells) in Patients with Cardiovascular and Neurological Complications after Carotid Endarterectomy. Int. J. Mol. Sci. 2015, 16, 10077–10094. [Google Scholar] [CrossRef]
- Chung, H.Y.; Kim, D.H.; Lee, E.K.; Chung, K.W.; Chung, S.; Lee, B.; Seo, A.Y.; Chung, J.H.; Jung, Y.S.; Im, E.; et al. Redefining Chronic Inflammation in Aging and Age-Related Diseases: Proposal of the Senoinflammation Concept. Aging Dis. 2019, 10, 367–382. [Google Scholar] [CrossRef] [Green Version]
- Inoue, S.; Vasilevskis, E.E.; Pandharipande, P.P.; Girard, T.D.; Graves, A.J.; Thompson, J.; Shintani, A.; Ely, E.W. The impact of lymphopenia on delirium in ICU patients. PLoS ONE 2015, 10, e0126216. [Google Scholar] [CrossRef]


| Variables | Total (n = 1001) | No Delirium (n = 829) | Delirium (n = 172) | p-Value |
|---|---|---|---|---|
| Demographic data | ||||
| Age (years), Me (IQR) | 71.00 (64.00–82.00) | 70.00 (63.00–81.00) | 79.00 (67.50–87.00) | <0.001 |
| Gender (male), n (%) | 523 (52.25) | 445 (53.68) | 78 (45.35) | 0.047 |
| BMI (kg/m2), Me (IQR) | 26.03 (24.02–29.05) | 25.95 (23.95–29.05) | 26.64 (24.22–28.67) | 0.496 |
| Smoking, n (%) | 417 (41.66) | 343 (41.38) | 74 (43.01) | 0.689 |
| Comorbidities | ||||
| Arterial hypertension, n (%) | 869 (86.81) | 721 (86.97) | 148 (86.05) | 0.744 |
| Ischemic heart diseases, n (%) | 258 (25.77) | 198 (23.88) | 60 (34.88) | 0.003 |
| Myocardial infarction, n (%) | 107 (10.69) | 88 (10.62) | 19 (11.05) | 0.868 |
| Previous ischemic stroke, n (%) | 222 (22.18) | 172 (20.75) | 50 (29.07) | 0.017 |
| Previous hemorrhagic stroke, n (%) | 24 (2.39) | 23 (2.77) | 1 (0.58) | 0.151 |
| TIA last 30 days, n (%) | 129 (12.89) | 101 (12.18) | 28 (16.28) | 0.145 |
| TIA earlier than last 30 days, n (%) | 107 (10.69) | 83 (10.01) | 24 (13.95) | 0.128 |
| CT post-stroke lesions, n (%) | 324 (32.37) | 252 (30.4) | 72 (41.86) | 0.003 |
| Acute renal failure, n (%) | 9 (0.89) | 5 (0.6) | 4 (2.33) | 0.083 |
| Chronic renal failure, n (%) | 143 (14.29) | 109 (13.15) | 34 (19.77) | 0.024 |
| Dialysis, n (%) | 2 (0.19) | 2 (0.24) | 0 (0) | 0.769 |
| Impaired insulin tolerance, n (%) | 48 (4.79) | 29 (3.5) | 19 (11.05) | <0.001 |
| Diabetes (oral medications), n (%) | 205 (20.48) | 166 (20.02) | 39 (22.67) | 0.433 |
| Diabetes (insulin), n (%) | 129 (12.89) | 101 (12.2) | 28 (16.28) | 0.146 |
| Atrial fibrillation, n (%) | 293 (29.27) | 210 (25.36) | 83 (48.26) | <0.001 |
| AF paroxysmal, n (%) | 61 (6.09) | 51 (6.15) | 10 (5.81) | 0.866 |
| AF persistent, n (%) | 163 (16.28) | 107 (12.91) | 56 (32.56) | <0.001 |
| ICA stenosis, n (%) | 87 (8.69) | 70 (38.67) | 17 (47.22) | 0.339 |
| LICA, Me (IQR) | 50 (0.0–50.0) | 50 (0.0–50.0) | 50 (0.0–50.0) | 0.288 |
| RICA, Me (IQR) | 50 (0.0–50.0) | 50 (0.0–50.0) | 50 (0.0–50.0) | 0.453 |
| COPD | 95 (9.49) | 77 (9.29) | 18 (10.47) | 0.632 |
| Peripheral vascular disease, n (%) | 454 (45.35) | 348 (41.98) | 106 (61.63) | <0.001 |
| Variables | No Delirium (n = 829) | Delirium (n = 172) | p-Value | |
|---|---|---|---|---|
| NIHSS at admission, Me (IQR) | 8.00 (4.00–14.00) | 18.00 (12.00–21.50) | <0.001 | |
| Rankin score at admission, Me (IQR) | 3.00 (1.00–4.00) 2.86 ± 1.56 | 5.00 (4.00–5.00) 4.37 ± 1.12 | <0.001 | |
| Hemianopia, n (%) | 242 (29.19) | 127 (73.84) | <0.001 | |
| Dysphasia, n (%) | 434 (52.35) | 113 (65.70) | 0.001 | |
| Brainstem stroke, n (%) | 39 (4.70) | 8 (4.65) | 0.867 | |
| CT imaging-lesion, n (%) | No lesion | 55 (6.63) | 8 (4.65) | <0.001 |
| Lesion < 2.5 cm | 378 (45.60) | 29 (16.86) | ||
| Lesion > 2.5 cm | 371 (44.75) | 135 (78.49) | ||
| Lacunar stroke | 25 (3.02) | 0 (0) | ||
| Cerebral artery involvement, n (%) | Anterior CA | 186 (22.68) | 9 (5.29) | <0.001 |
| Middle CA | 513 (62.56) | 140 (82.35) | ||
| Posterior CA | 121 (14.76) | 21 (12.35) | ||
| Carotid artery stenosis, n (%) | No changes | 29 (3.6) | 3 (1.83) | <0.001 |
| Up to 50% | 506 (62.86) | 75 (45.73) | ||
| 50–70% | 169 (20.99) | 63 (38.41) | ||
| >70% | 50 (6.21) | 6 (3.66) | ||
| Occlusion | 51 (6.34) | 17 (10.37) | ||
| AIS treatment, n (%) | Conservative | 638 (80.35) | 145 (84.8) | 0.178 |
| Thrombolysis | 156 (19.65) | 26 (15.20) | ||
| Variables | No Delirium (n = 829) | Delirium (n = 172) | p-Value | |
|---|---|---|---|---|
| Hospital LOS (days), Me (IQR) OR | 9.00 (8.00–11.0) 0.977 | 10.00 (8.00–14.00) 1.023 | <0.001 | |
| Time from stroke to death (days), Me (IQR) OR | 29.00 (11.00–87.00) 1.002 | 25.00 (8.00–50.00) 0.998 | 0.161 | |
| Rankin score at discharge, Me (IQR) OR | 2.00 (1.00–4.00) 0.664 | 5.00 (3.00–5.00) 1.506 | <0.001 | |
| NIHSS at discharge, Me (IQR) OR | 4.00 (2.00–12.00) 0.951 | 18.00 (6.00–29.00) 1.052 | <0.001 | |
| Mortality at day 7, n (%) OR | 41 (4.94) 0.279 | 27 (15.69) 3.579 | <0.001 | |
| Mortality at day 30, n (%) OR | 101 (12.18) 0.223 | 66 (38.37) 4.488 | <0.001 | |
| Mortality at 1 year, n (%) OR | 197 (23.76) 0.189 | 107 (62.21) 5.281 | <0.001 | |
| Discharge | Death, n (%) OR | 67 (8.08) 0.823 | 37 (21.51) 1.215 | <0.001 |
| Home, n (%) OR | 513 (61.88) 3.990 | 71 (41.28) 0.251 | ||
| Nursing home, n (%) OR | 63 (7.60) 1.200 | 29 (16.86) 0.834 | ||
| Rehabilitation center, n (%) OR | 175 (21.11) 3.221 | 30 (17.44) 0.310 | ||
| Other, n (%) OR | 11 (1.33) 1.215 | 5 (2.91) 0.823 | ||
| Variables | No Delirium (n = 829) | Delirium (n = 172) | p-Value |
|---|---|---|---|
| Leucocyte count (×109/L); Me (IQR) | 8.97 (7.33–11.27) | 9.73 (7.67–11.91) | 0.006 |
| Neutrophil count (×109/L); Me (IQR) | 5.91 (4.47–7.92) | 7.12 (4.99–9.52) | <0.001 |
| Lymphocyte count (×109/L); Me (IQR) | 1.86 (1.38–2.46) | 1.66 (1.13–2.31) | 0.006 |
| NLR; Me (IQR) | 3.14 (2.06–5.09) | 3.92 (2.44–7.87) | <0.001 |
| CRP (mg/L); Me (IQR) | 3.00 (1.10–9.69) | 7.58 (2.25–30.00) | <0.001 |
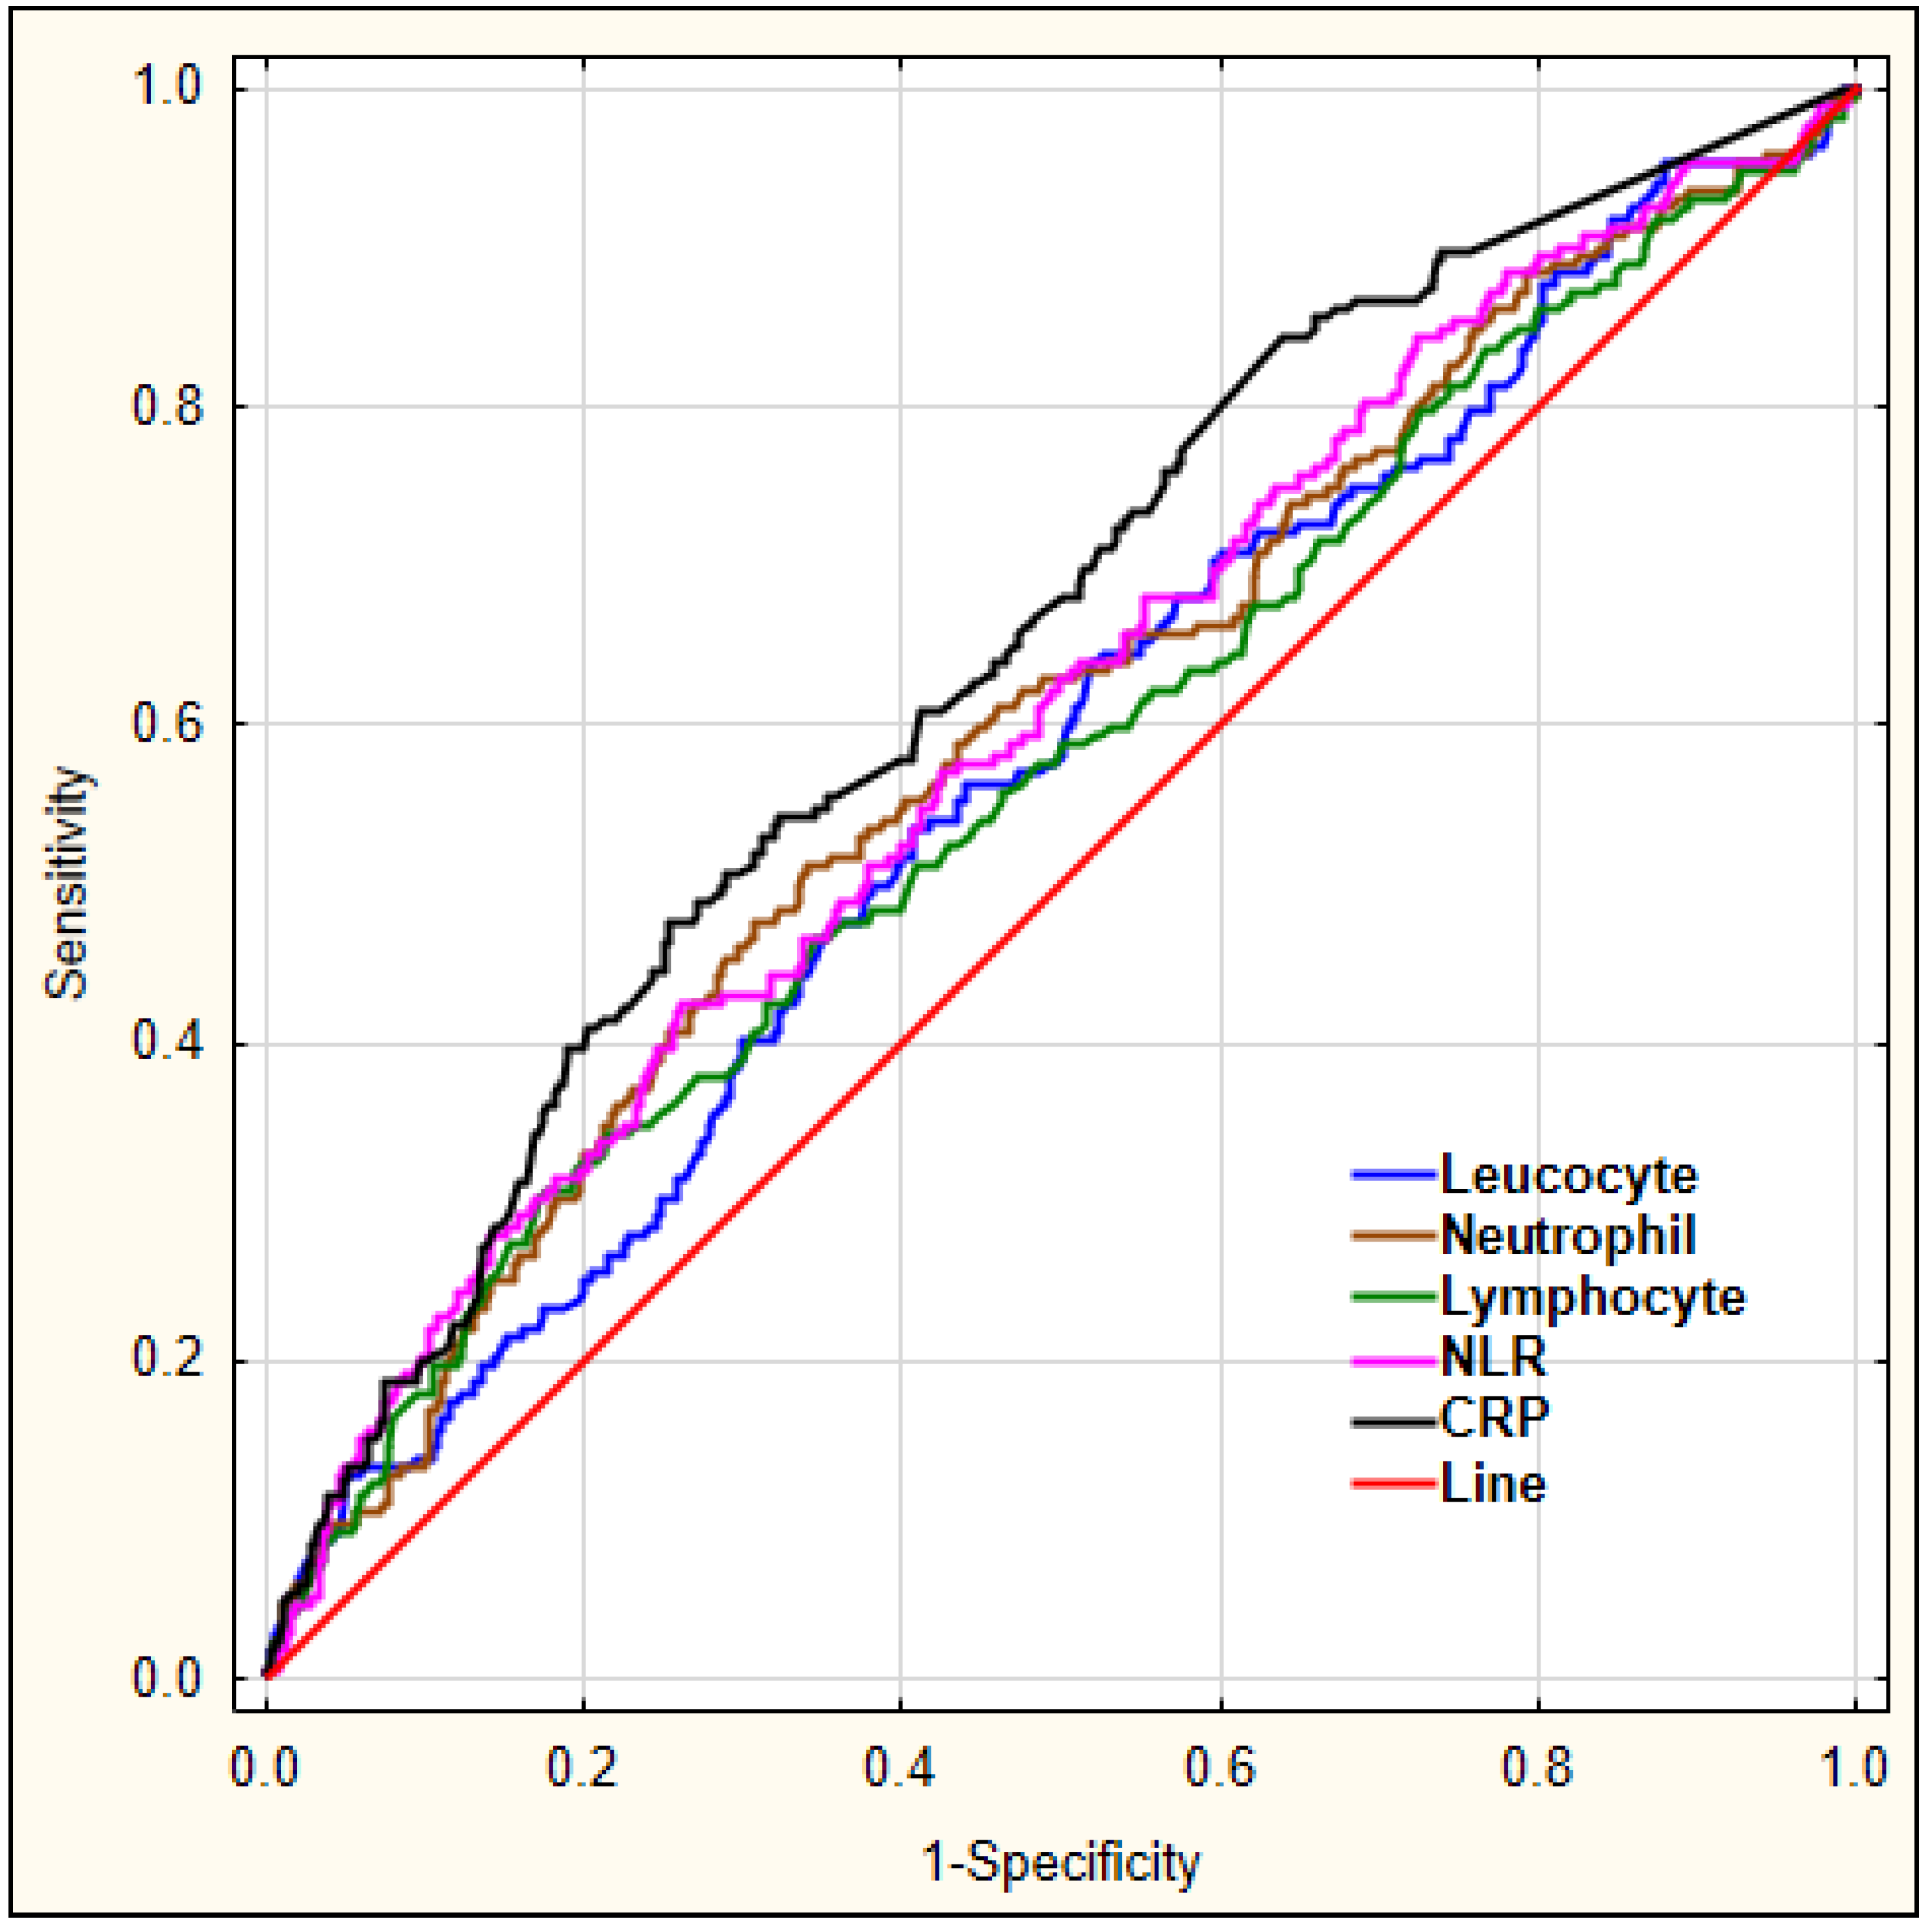
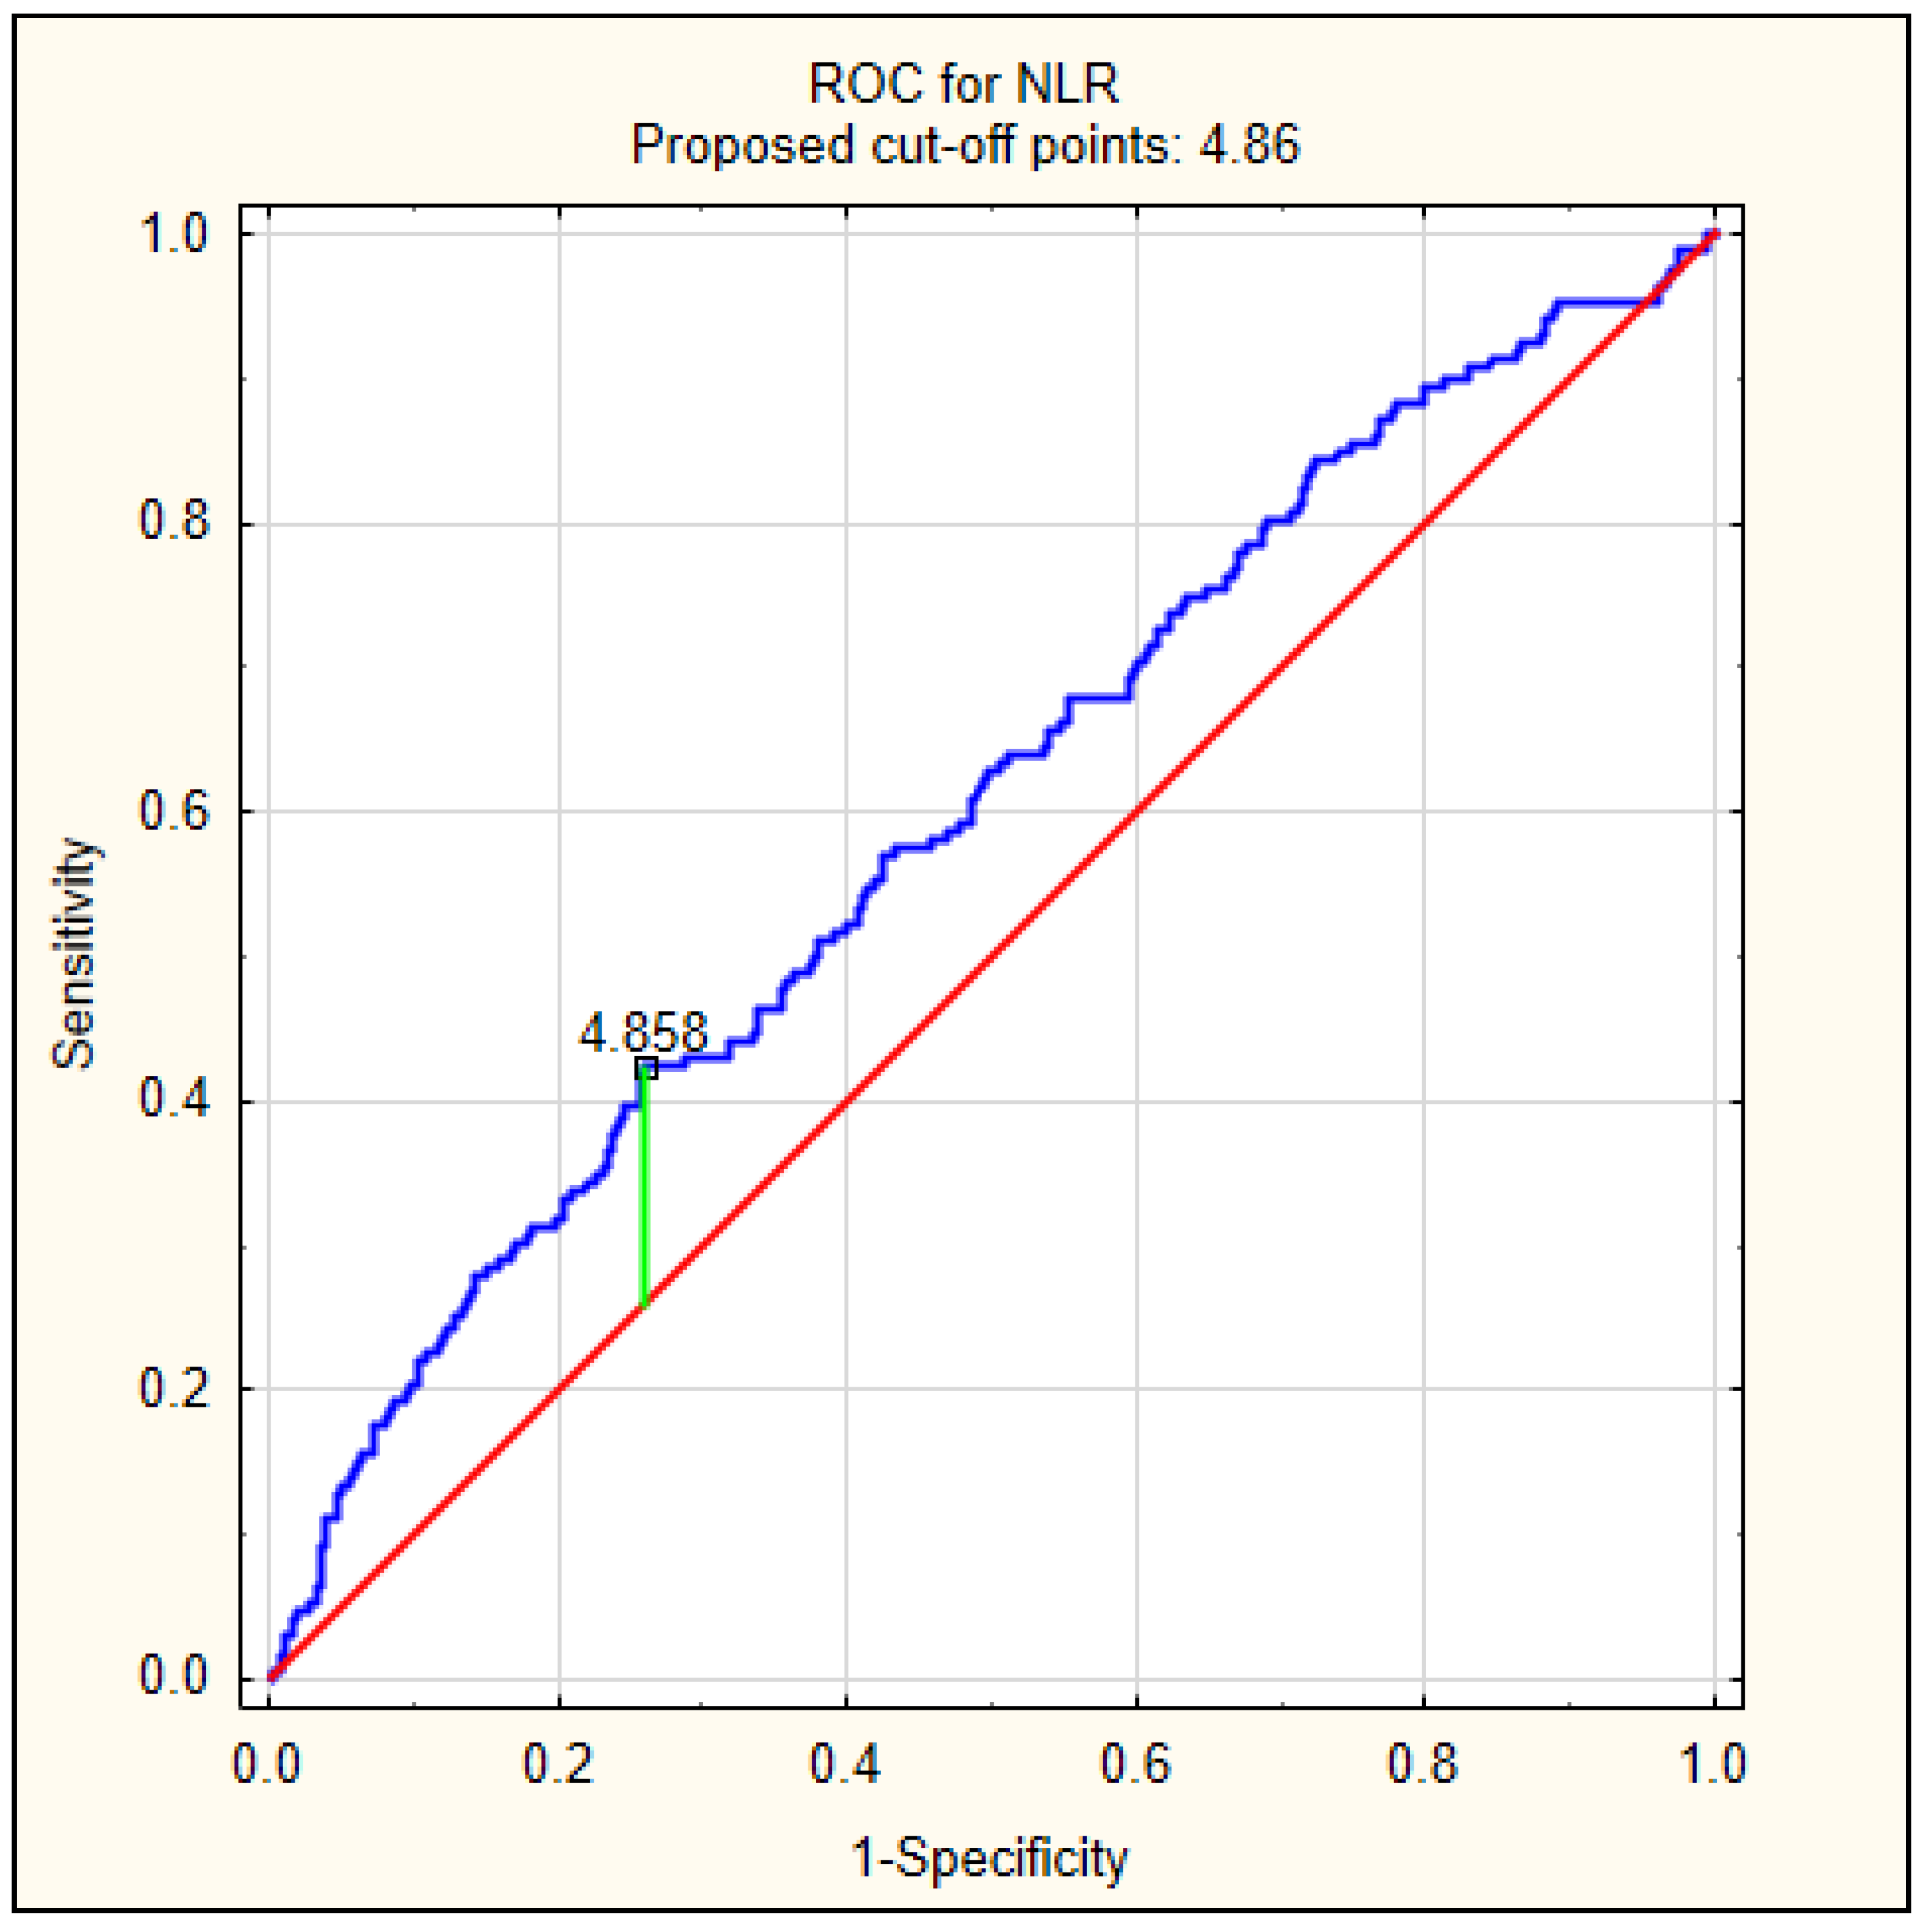
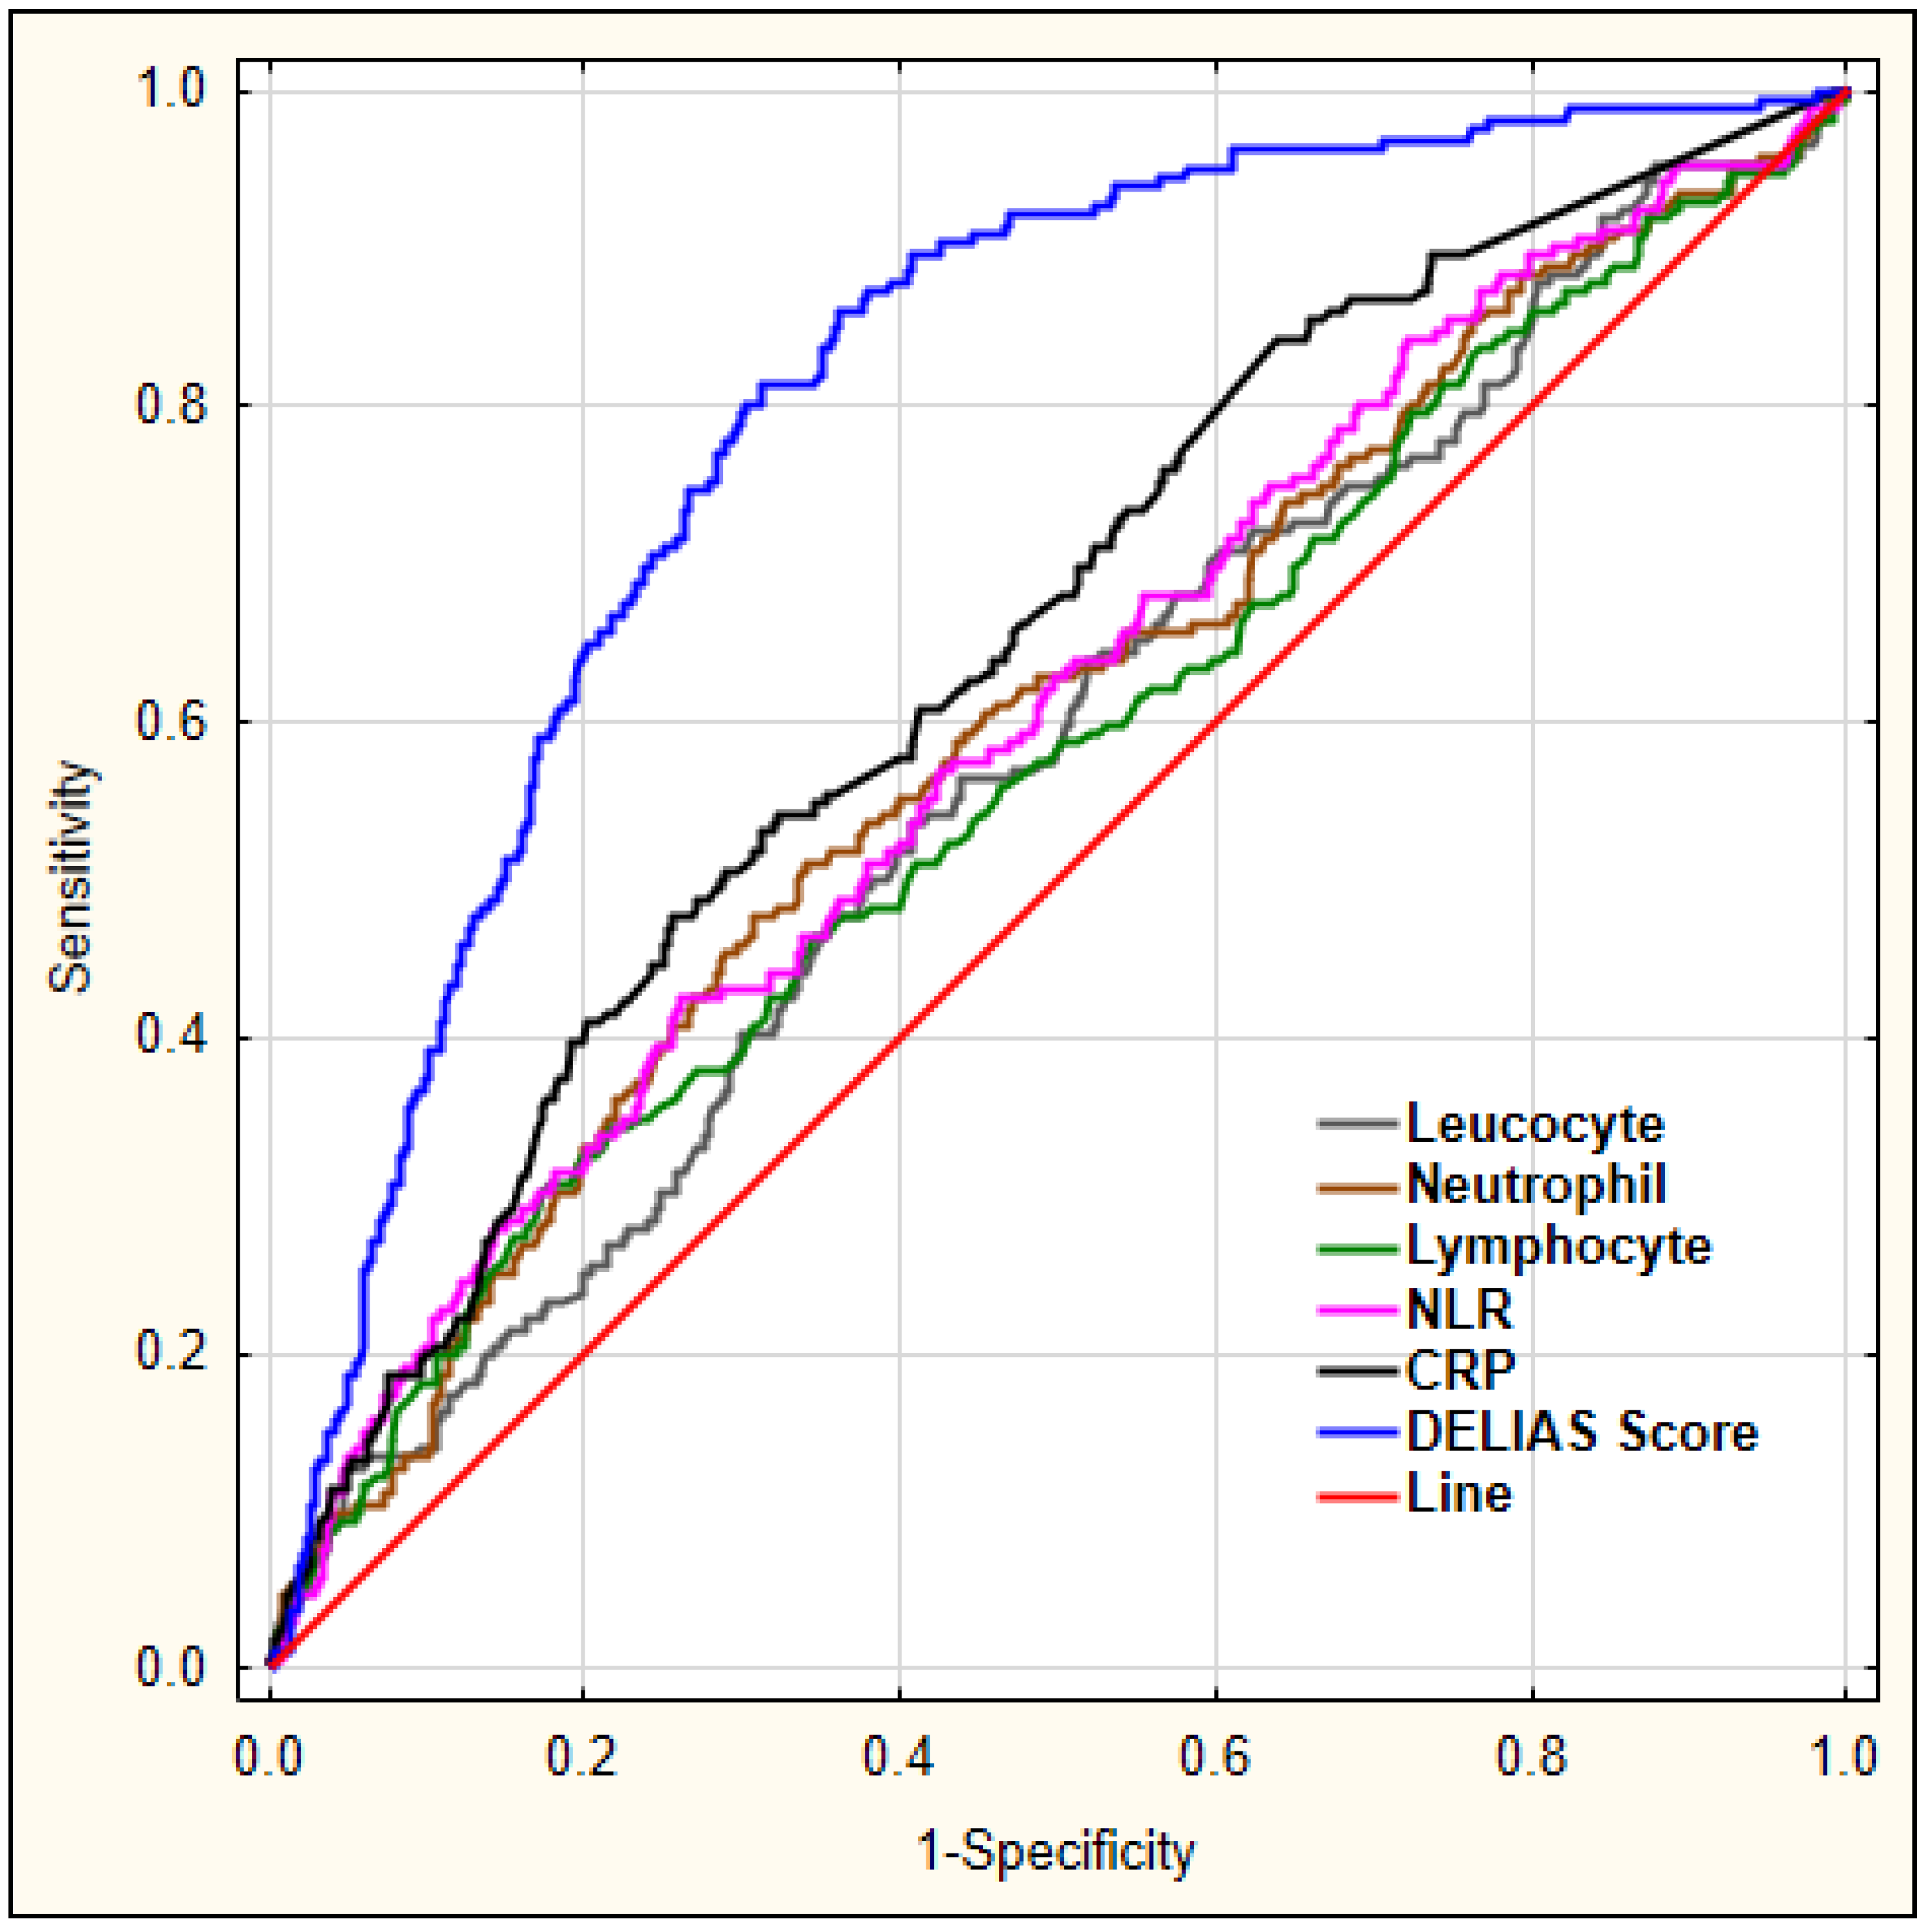
| Variable | AUC | Youden’s Index | Cut-Off Value | Sensitivity | Specificity | p-Value |
|---|---|---|---|---|---|---|
| Leucocyte | 0.566 | 0.13 | 9.53 | 0.535 | 0.592 | 0.006 |
| Neutrophil | 0.590 | 0.17 | 7.07 | 0.512 | 0.659 | <0.001 |
| Lymphocyte | 0.567 | 0.13 | 1.23 | 0.308 | 0.823 | 0.008 |
| NLR | 0.597 | 0.16 | 4.86 | 0.424 | 0.739 | <0.001 |
| CRP | 0.644 | 0.22 | 9.10 | 0.476 | 0.746 | <0.001 |
| Independent Variable | Unadjusted | Adjusted | ||
|---|---|---|---|---|
| OR (95% CI) | p-Value | OR (95% CI) | p-Value | |
| Leucocyte count (×109/L) | 1.064 (1.026–1.103) | <0.001 | 1.068 (1.028–1.110) | 0.001 |
| Neutrophil count (×109/L) | 1.047 (1.010–1.085) | 0.012 | 1.043 (1.003–1.084) | 0.035 |
| Lymphocyte count (×109/L) | 0.918 (0.780–1.082) | 0.307 | 0.959 (0.867–1.062) | 0.424 |
| NLR (mean) | 1.036 (1.011–1.061) | 0.005 | 1.025 (1.000–1.050) | 0.049 |
| NLR > 4.86 | 2.056 (1.463–2.890) | <0.001 | 1.875 (1.314–2.675) | 0.001 |
| CRP | 1.007 (1.004–1.010) | <0.001 | 1.006 (1.003–1.010) | <0.001 |
| CRP > 9.10 | 2.662 (1.888–3.753) | <0.001 | 2.132 (1.482–3.066) | <0.001 |
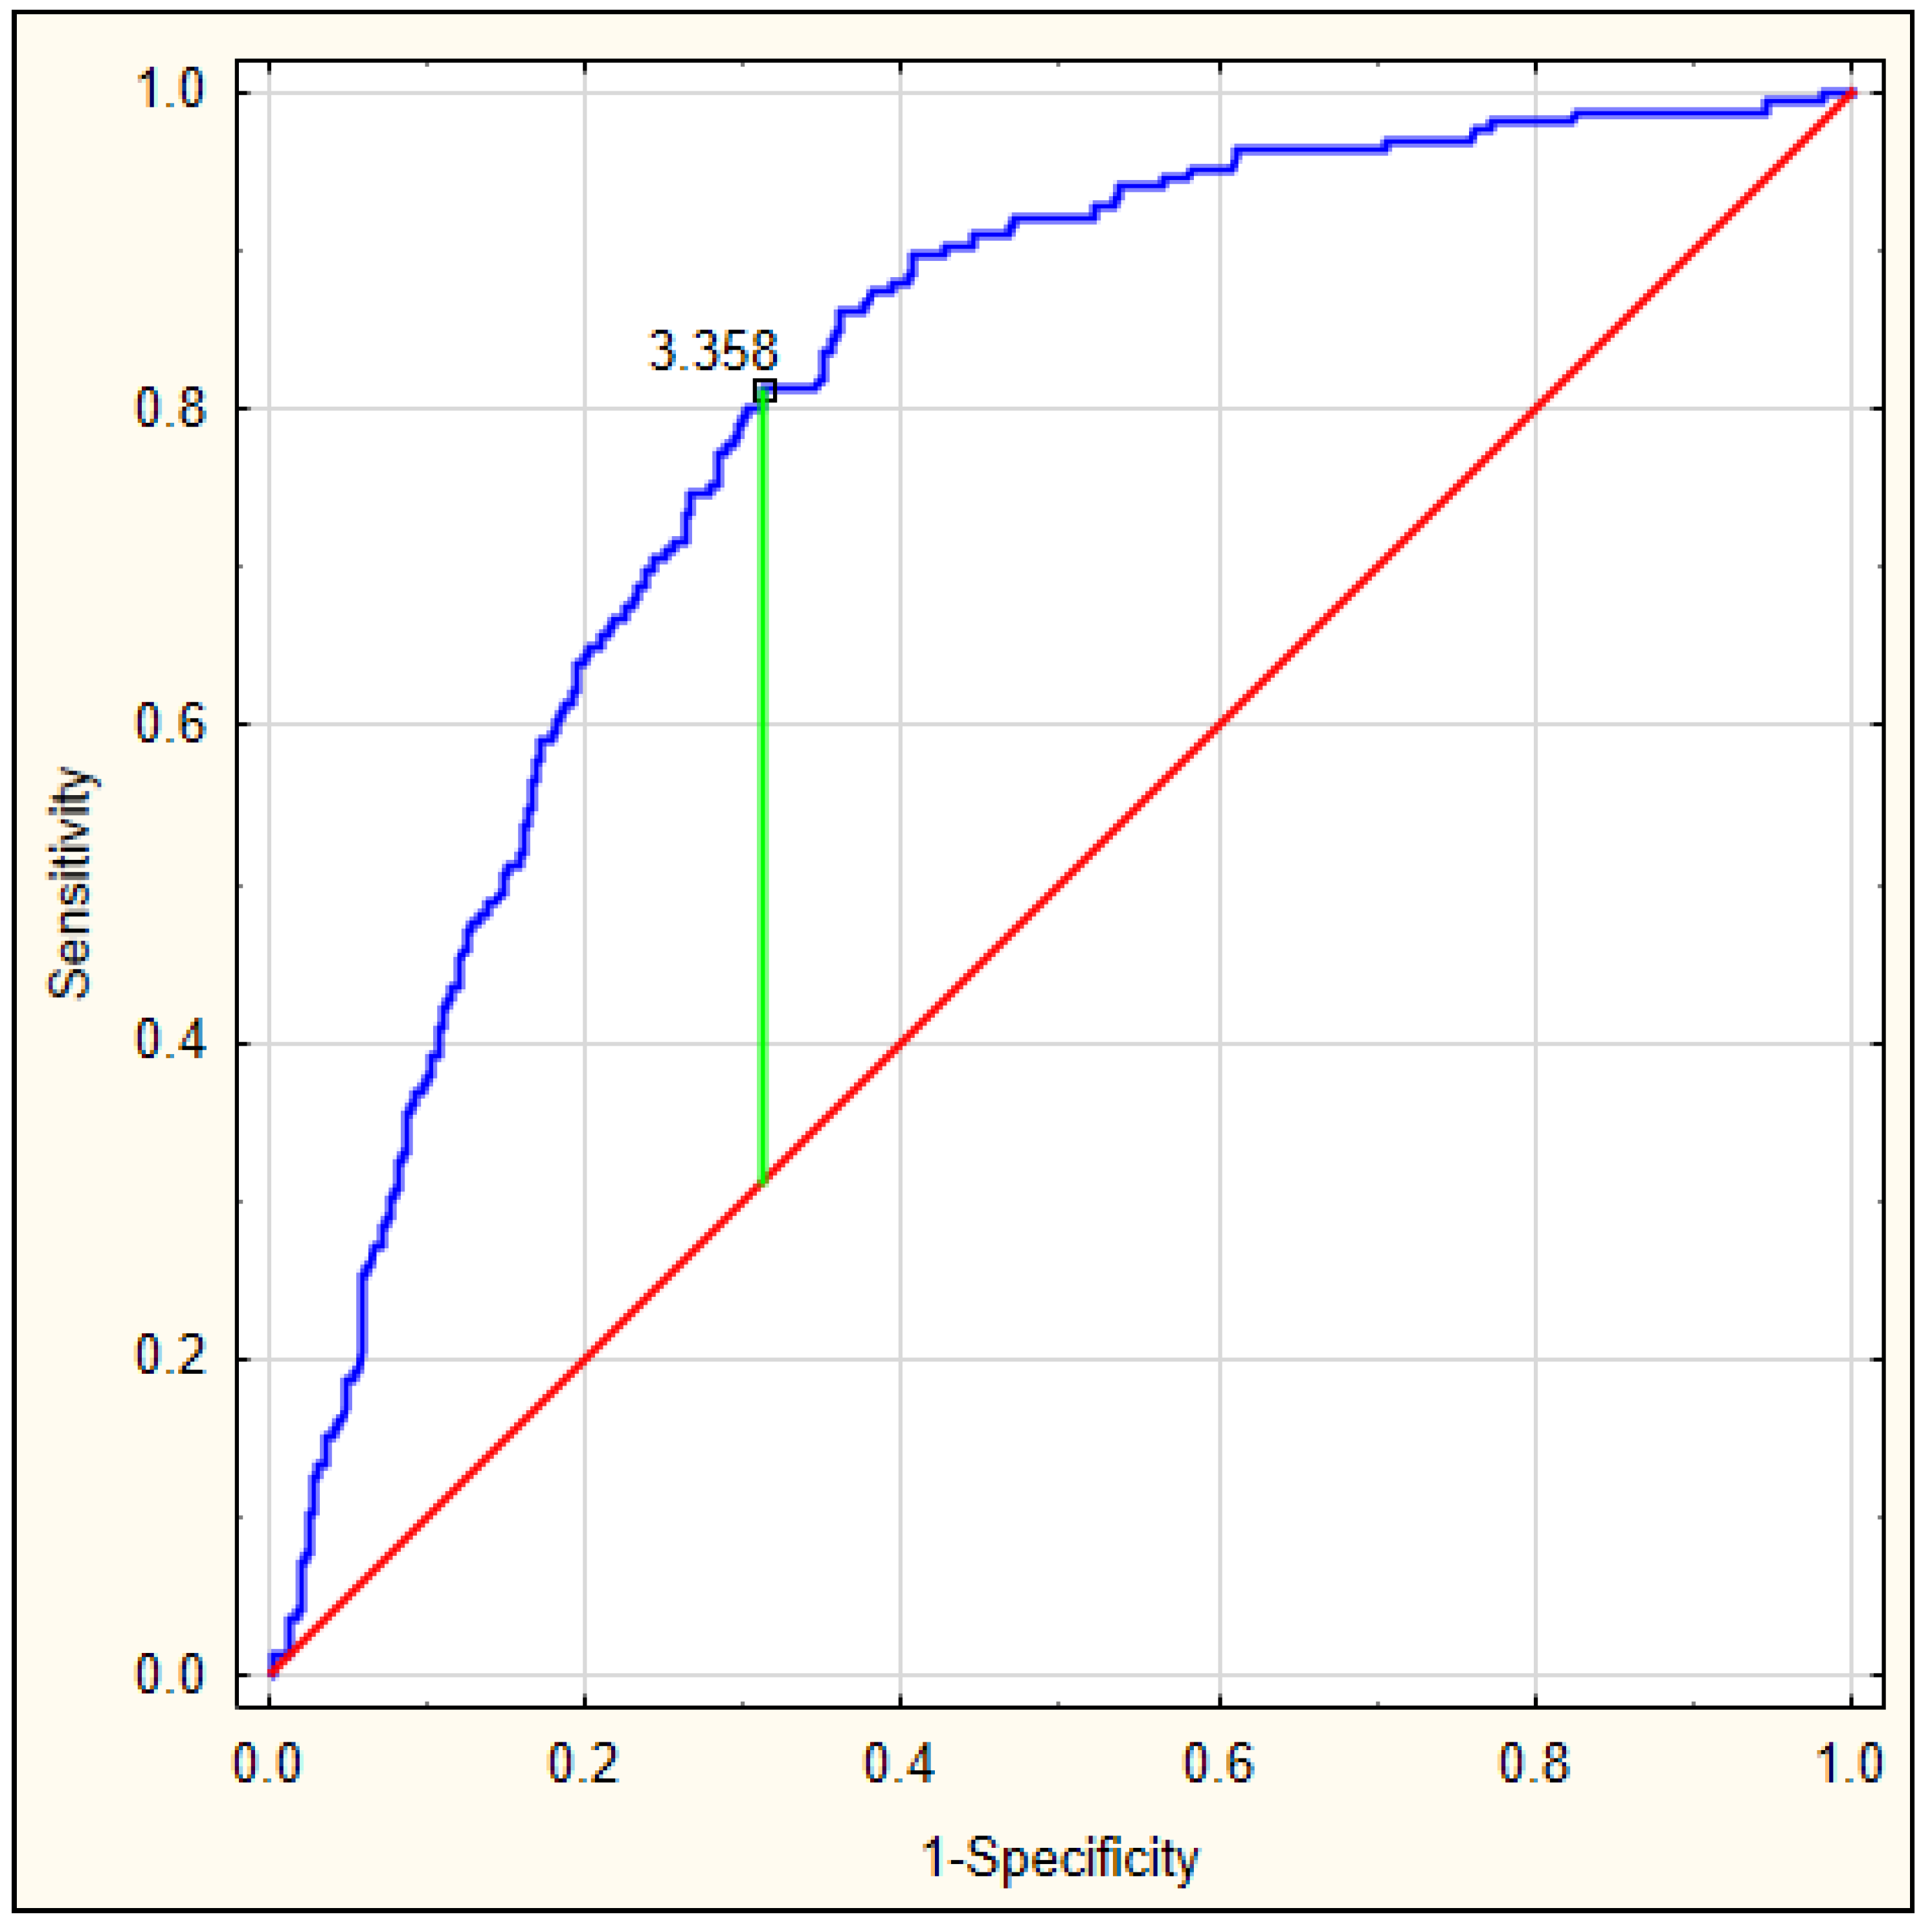
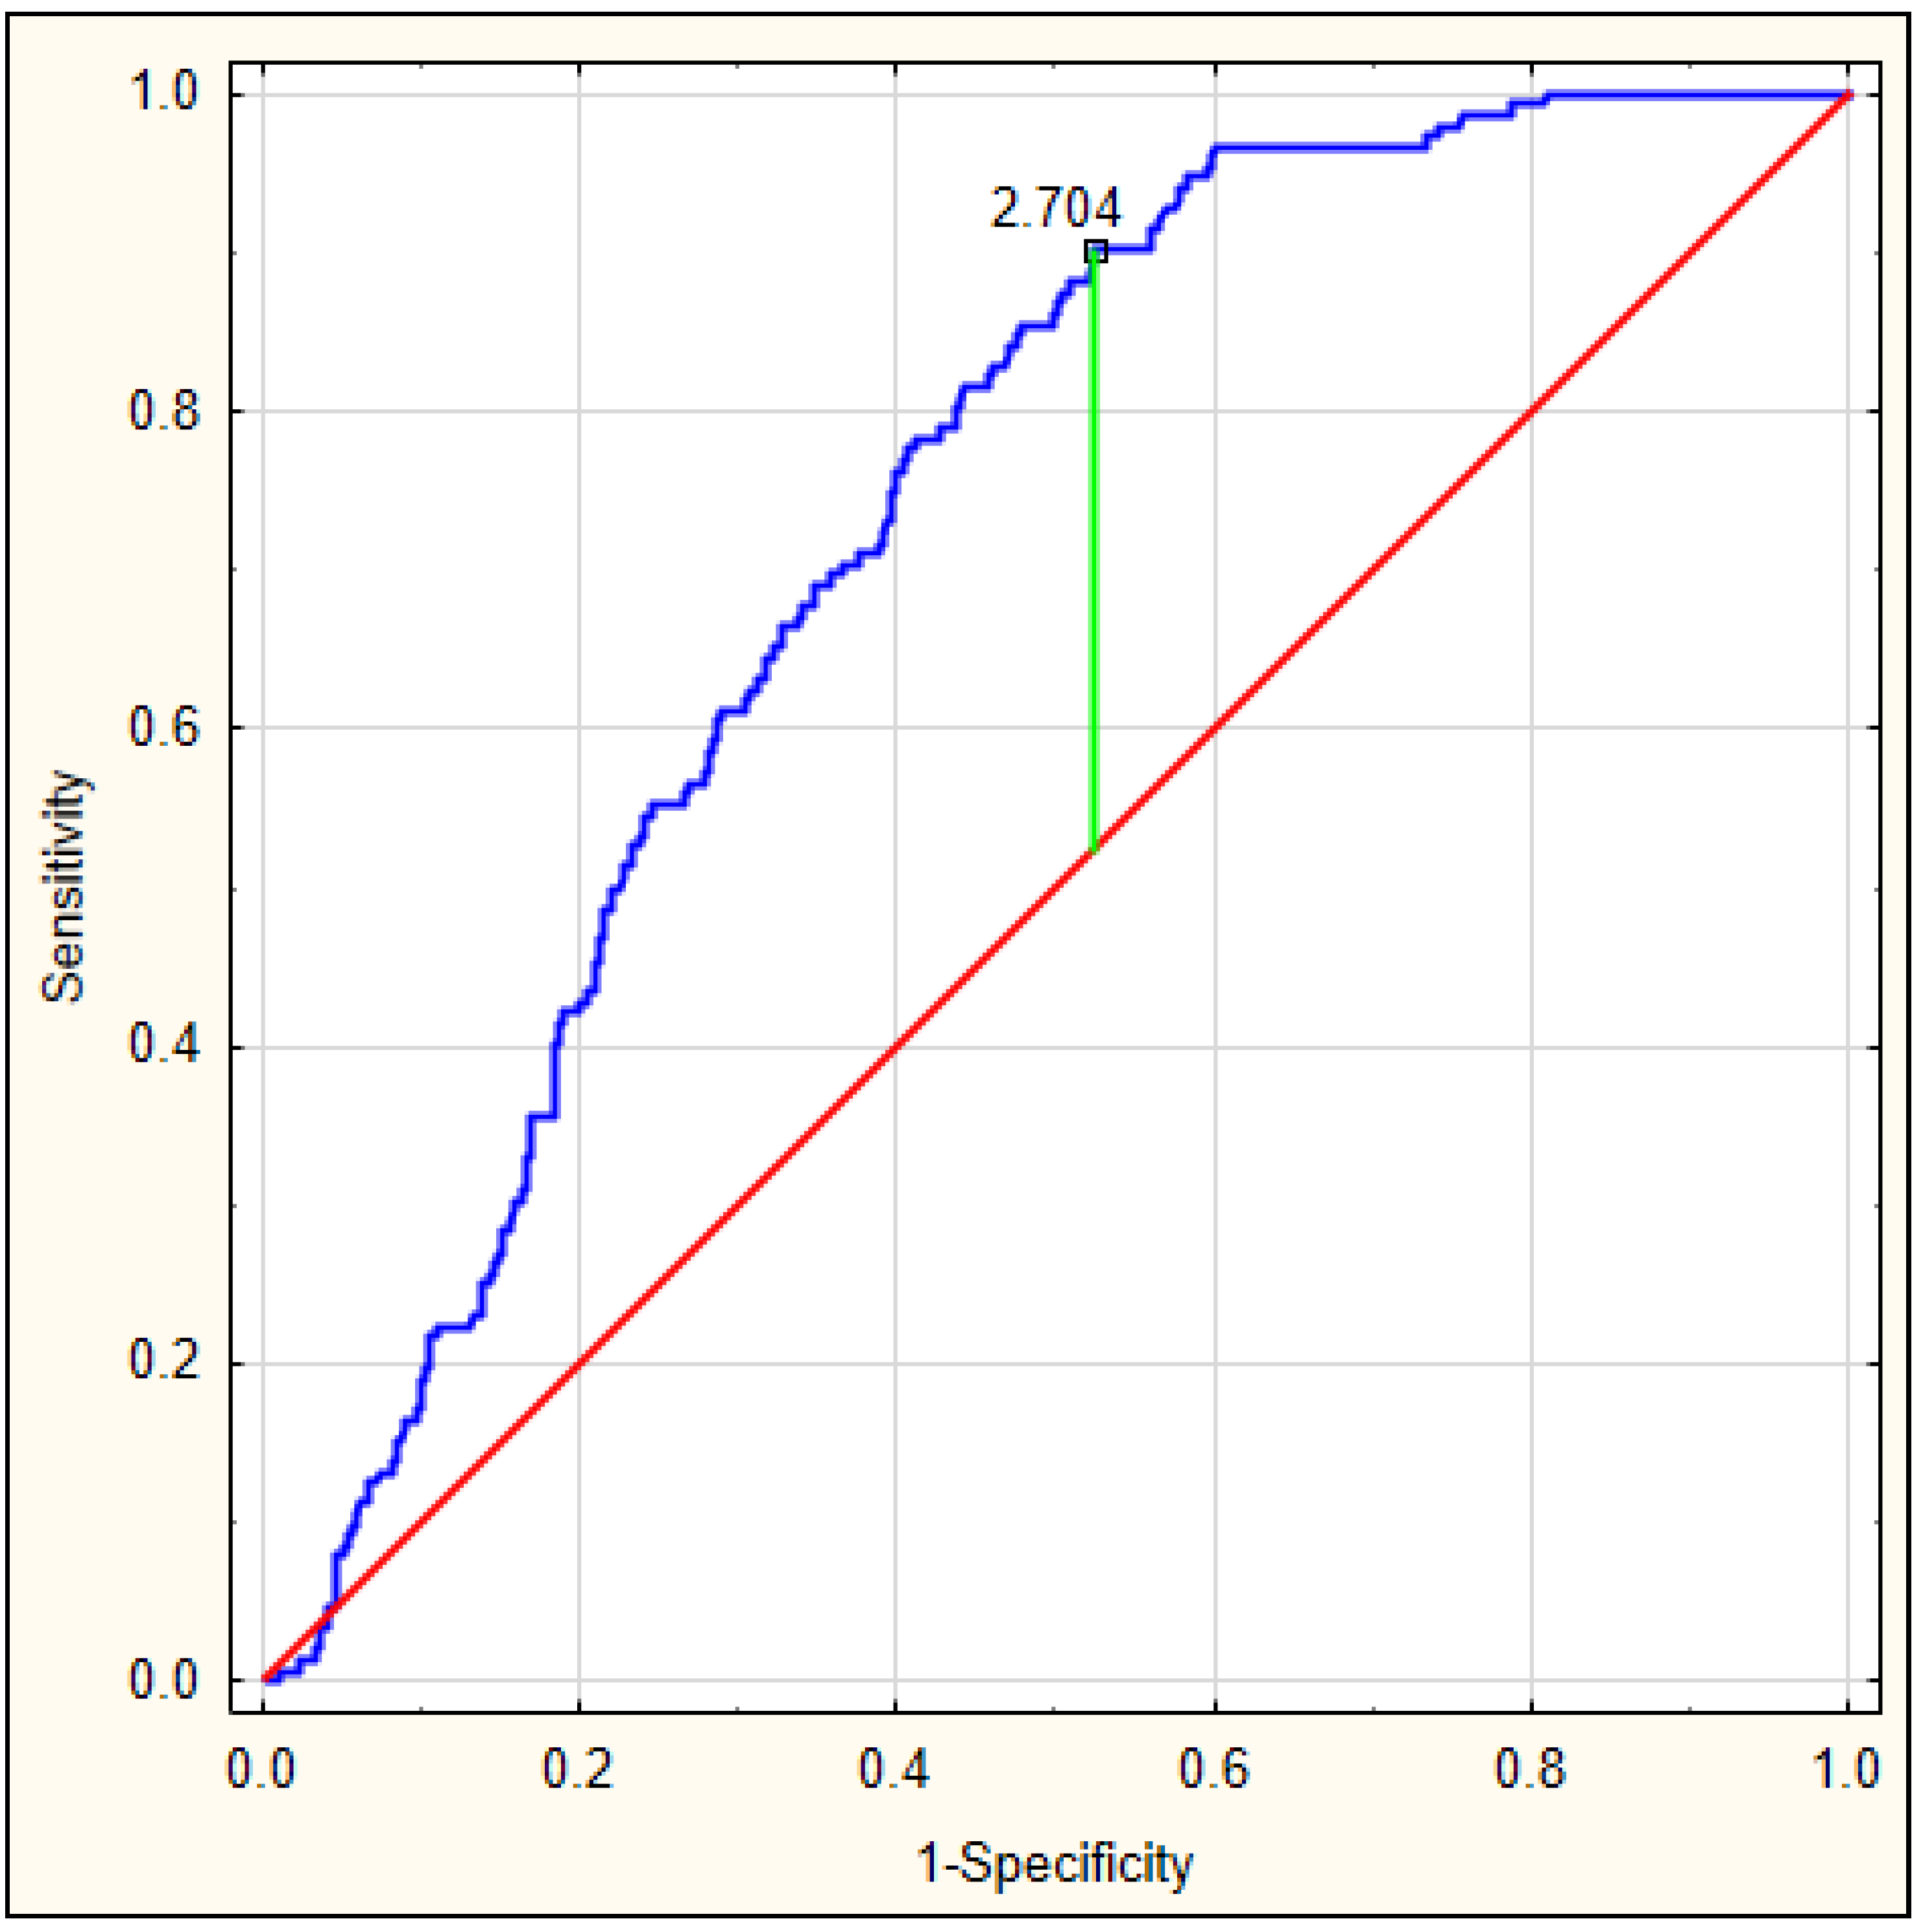
| AUC | Youden’s Index | Cut-Off Value | Sensitivity | Specificity | p-Value | |
|---|---|---|---|---|---|---|
| DELIAS score for early-onset delirium (up to 24 hours) | 0.801 | 0.50 | 3.358 | 0.813 | 0.673 | <0.001 |
| DELIAS score for delirium up to 5 days | 0.725 | 0.38 | 2.704 | 0.901 | 0.477 | <0.001 |
| OR (95% CI) | p-Value | |
|---|---|---|
| DELIAS score for early-onset delirium (up to 24 hours) for cut-off point > 3.358 | 8.976 (5.913–13.624) | <0.001 |
| DELIAS score for delirium up to 5 days for cut-off point > 2.704 | 7.744 (4.531–13.234) | <0.001 |
© 2019 by the authors. Licensee MDPI, Basel, Switzerland. This article is an open access article distributed under the terms and conditions of the Creative Commons Attribution (CC BY) license (http://creativecommons.org/licenses/by/4.0/).
Share and Cite
Kotfis, K.; Bott-Olejnik, M.; Szylińska, A.; Rotter, I. Could Neutrophil-to-Lymphocyte Ratio (NLR) Serve as a Potential Marker for Delirium Prediction in Patients with Acute Ischemic Stroke? A Prospective Observational Study. J. Clin. Med. 2019, 8, 1075. https://doi.org/10.3390/jcm8071075
Kotfis K, Bott-Olejnik M, Szylińska A, Rotter I. Could Neutrophil-to-Lymphocyte Ratio (NLR) Serve as a Potential Marker for Delirium Prediction in Patients with Acute Ischemic Stroke? A Prospective Observational Study. Journal of Clinical Medicine. 2019; 8(7):1075. https://doi.org/10.3390/jcm8071075
Chicago/Turabian StyleKotfis, Katarzyna, Marta Bott-Olejnik, Aleksandra Szylińska, and Iwona Rotter. 2019. "Could Neutrophil-to-Lymphocyte Ratio (NLR) Serve as a Potential Marker for Delirium Prediction in Patients with Acute Ischemic Stroke? A Prospective Observational Study" Journal of Clinical Medicine 8, no. 7: 1075. https://doi.org/10.3390/jcm8071075