Article

Expression of PD-1 and CTLA-4 Are Negative Prognostic Markers in Renal Cell Carcinoma

1
Department of Urology and Pediatric Urology, University Hospital Erlangen, Friedrich Alexander-University Erlangen-Nuernberg, 91054 Erlangen, Germany
2
Institute of Pathology, University Hospital Erlangen, Friedrich Alexander-University Erlangen-Nuernberg, 91054 Erlangen, Germany
3
Pathology Muenchen-Nord, 80992 Munich, Germany
*
Author to whom correspondence should be addressed.
J. Clin. Med. 2019, 8(5), 743; https://doi.org/10.3390/jcm8050743
Submission received: 24 April 2019 / Revised: 17 May 2019 / Accepted: 22 May 2019 / Published: 24 May 2019
(This article belongs to the Section Clinical Laboratory Medicine)

Abstract

:
Immuno-oncological therapy with checkpoint inhibition (CI) has become a new standard treatment in metastatic renal cell carcinoma (RCC), but the prognostic value of the expression of CI therapy target molecules is still controversial. 342 unselected consecutive RCC tumor samples were analyzed regarding their PD-1, PD-L1, and CTLA-4 expression by immunohistochemistry (IHC). The prognostic values for cancer-specific survival (CSS) and overall survival (OS) were analyzed for those not exposed to CI therapy. The expression of PD-1 in tumor-infiltrating mononuclear cells (TIMC) and PD-L1 in tumor cells was detected in 9.4% and 12.3%, respectively (Immune reactive score (IRS) > 0). Furthermore, PD-L1 expression in TIMC (IRS > 0) and CTLA-4 expression in TIMC (>1% positive cells) was detected in 4.8% and 6.3%. PD-1 expression and CTLA-4 expression were significantly associated with a worse OS and CSS in log rank survival analysis and univariate Cox regression analysis. CTLA-4 expression is a prognostic marker that is independently associated with a worse outcome in multivariate Cox regression analysis in the whole cohort (OS: p = 0.013; CSS: p = 0.048) as well as in a non-metastatic subgroup analysis (OS: p = 0.028; CSS: p = 0.022). Patients with combined CTLA-4 expression and PD-1-expression are at highest risk in OS and CSS. In RCC patients, PD-1 expression in TIMC and CTLA-4 expression in TIMC are associated with a worse OS and CSS. The combination of PD-1 expression in TIMC and CTLA-4 expression in TIMC might identify high risk patients. This is, to our knowledge, the first description of CTLA-4 expression to be a prognostic marker in RCC.

1. Introduction

With a worldwide incidence of about 338,000 in 2012, kidney cancer accounts for 2–3% of all malignant tumors [1,2]. Approximately 85–95% are renal cell carcinomas (RCC), with an increasing incidence worldwide [3]. 75–80% are clear cell renal cell carcinomas (ccRCC), followed by papillary, chromophobe, and other histological subtypes [4,5]. The five-year overall survival (OS) in localized RCC is approximately 90%, but the median OS in metastatic diseases is only about 18–22 months [6,7,8]. Renal cell carcinoma is considered to be an immunogenic tumor [9]. The characterization of immune subtypes has revealed that renal cell carcinoma belongs mainly to the inflammatory subtype with an increased leukocyte fraction [10], and enhanced MHC-I expression is a good prognostic factor in ccRCC [11]. Accordingly, current checkpoint inhibition (CI) therapies show promising effects in RCC patients by inhibiting two of the immune escape mechanisms addressing the differentiation and activity of effector T cells [12].
The most targeted immune escape mechanism is the down-regulation of T cell activity by a programmed cell death protein 1/programmed cell death ligand 1 (PD-1/PD-L1) interaction in the tumor microenvironment. Tumor-infiltrating mononuclear cells (TIMC) in RCC show an increased expression of PD-1 in comparison to lymphocytes in peripheral blood. This is considered to be a marker for limited cytotoxic activity in the tumor [13,14], but retrospective analyses to the prognostic value of PD-1 expression in RCC are contradictory [15,16].
The expression of PD-L1 on tumor cells in RCC is associated with a higher tumor stage, a worse response to tyrosine kinase inhibitor (TKI) therapy, and a worse prognosis [17,18,19,20,21,22,23]. The expression of PD-L1 in TIMC in RCC is associated with a worse prognosis in ccRCC [17], but the relevance of PD-L1 expression in TIMC in other histological subtypes remains unknown [19].
The second frequently targeted pathway is the regulation of the initial priming of naive T cells in lymph nodes via cytotoxic T-lymphocyte-associated Protein 4/B7 protein (CTLA4/B7) signaling [24,25,26]. The interaction of CTLA-4, expressed by activated T cells and regulatory T cells [27], with B7-1 and B7-2 on T cells can limit or decrease their activation [28,29] and downregulate proliferation and interleukin-2 (IL-2) secretion [24]. In RCC, about 1% of TIMC express CTLA-4, and expression increases with higher tumor stages. In papillary RCC, up to 2·7% of TIMC express CTLA-4 [30]. Polymorphisms in the CTLA-4 gene are associated with a higher risk for high-stage ccRCC [31] and are associated with better OS in metastatic patients treated with TKI [32].
The aim of the study was to assess the prognostic value of the expression of checkpoint inhibitor targets in a population not treated with CI. The published prognostic significance of the expression of CI therapy targets in populations under checkpoint inhibition therapy [33] can also be better assessed.

2. Experimental Section

Consecutive and unselected tumor specimens from 453 patients undergoing radical or partial nephrectomy for RCC between 1998 and 2011 at the Department of Urology and Pediatric Urology at the University Hospital Erlangen were collected. No tissue samples of renal metastases from renal cell carcinomas or from carcinomas of other origin were included. Tumors already metastasized at the time of surgery are referred to as primary metastatic diseases; tumors metastasized during follow-up are referred to as secondary metastatic diseases. Tumors have been reevaluated independently by two experienced pathologists (AH, FE), and the histological subtype was reclassified according to the UICC 2010 TNM tumor staging system. Construction of the tissue microarray (TMA) has been described in detail previously [34]. All patients, beginning from 2008, gave informed consent. For samples before the 2008 Ethic Commission in Erlangen, all patients waived the need for informed individual consent. The study is based on the approvals of the Ethic Commissions of the University Hospital Erlangen (No.3755). The study was carried out according to the latest version of the Declaration of Helsinki and is approved by the institutional ethics committee.
The expression of PD-1, PD-L1, CD3, and CTLA-4 was investigated by immunohistochemistry (IHC) on 3 µm sections from formalin-fixed paraffin-embedded TMA tissue blocks. For CTLA4-staining, we used a mouse monoclonal anti-CTLA4/CD152 antibody (clone BSB-88, BSB2883, dilution 1:50, BioSB, Santa Barbara, CA, USA). The CTLA4/CD152 antibody was validated on a multi tissue TMA containing colon, breast, small intestine, adrenal, uterus, prostate, ovary, liver, tonsil, salivary gland, brain, heart, renal, appendix, skin, nerve, lung, testis, placenta, spleen, pancreas, endometrium, stomach, and parotid tissue. The CTLA4/CD152 antibody demonstrated specific staining in lymphatic tissue. Therefore, lymphatic tissue in a normal tonsil was used as a positive control. Upon evaluation of the CTLA4-stained TMAs, negative control slides without the addition of the primary antibody were added as internal negative controls. For enhancement and visualization, we used an EnVision + System, HRP (Dako, Agilent Technologies GmbH & CoKG, Hamburg, Germany) according to the manufacturer’s instructions. PD1, PD-L1, and CD3 stainings were performed on a Ventana Benchmark ULTRA staining system using standard protocols and a mouse monoclonal anti-PD1 antibody (clone NAT105, Ventana 760-4895, ready to use, Cell MarqueTM, Merck KGaA, Darmstadt, Germany), a rabbit monoclonal anti-PD-L1antibody (clone28-8, ab205921, 1:200, Abcam plc, Cambridge, UK), and a rabbit monoclonal anti-CD3-antibody (clone SP7, RBG024, 1:150, Zytomed-Systems GmbH, Berlin, Germany), respectively. The secondary reaction was performed using a Ventana ultraView Universal DAB Detection Kit (Ventana Medical Systems, Tucson, AZ, USA) for anti-PD1 and anti-CD3 and a Ventana OptiView DAB IHC Detection Kit (Ventana Medical Systems, Tucson, AZ, USA) for anti PD-L1. All procedures were performed according to the manufacturer’s instructions. We used hematoxylin for counterstaining. IHC-staining was semi quantitatively assessed using the immunoreactivity score (IRS) [35]. The intensity of the staining was classified in 4 categories (no staining (0), weak staining (1), moderate staining (2), and strong staining (3)) and multiplied by the categorized proportion of positive cells (no (0), <10% (1), 10–50% (2), 51–80% (3) and >80% (4)). An IRS = 0 was considered as negative, and an IRS > 0 was counted as positive. PD1 staining was analyzed on TIMC. PD-L1 staining on tumor cells and on TIMC was assessed separately. As no cut-off value for CLTA-4 expression in IHC in RCC is defined, and CTLA-4 expression has been described in about 1% of TIMC in RCC [30], we defined a cut off at ≥2% CTLA-4 positive cells in tumor tissue infiltrating TIMC for defining a tumor as CTLA-4 positive. CD3 positive cells were counted in 4 high power fields, and the number of CD3 positive cells per high power field was recorded. Thirty additional controls revealed no PD1-, PD-L1, or CTLA-4 staining in corresponding normal renal tissue distant to RCC. All stained TMAs were assessed independently by two experienced pathologists (AH, FE), both blinded for clinical data. In cases for which the results were inconsistent, the pathologists worked to reach a consensus.
After the exclusion of missing tissue, missing tumors, and incomplete survival data, 342 tumor-representative specimens could be assessed. There were no differences in the clinical and histopathological features between evaluable cases and the entire tumor cohort. Statistical analyses was performed using IBM SPSS Statistics 21 (IBM-Corporation Germany GmbH, Ehningen, Germany). The nonparametric correlation was assessed by the two-sided Spearman Rho test. Survival analysis was done with the log-rank test, and Kaplan-Meier survival curves were drawn. The association of marker expression and survival was assessed by univariate and multivariate Cox regression analysis. Differences were regarded statistically significant at p < 0.05.
Individual participant data that underlie the results reported in this article will be shared after de-identification in the supplementary files. Data will be available immediately following publication for 5 years.

3. Results

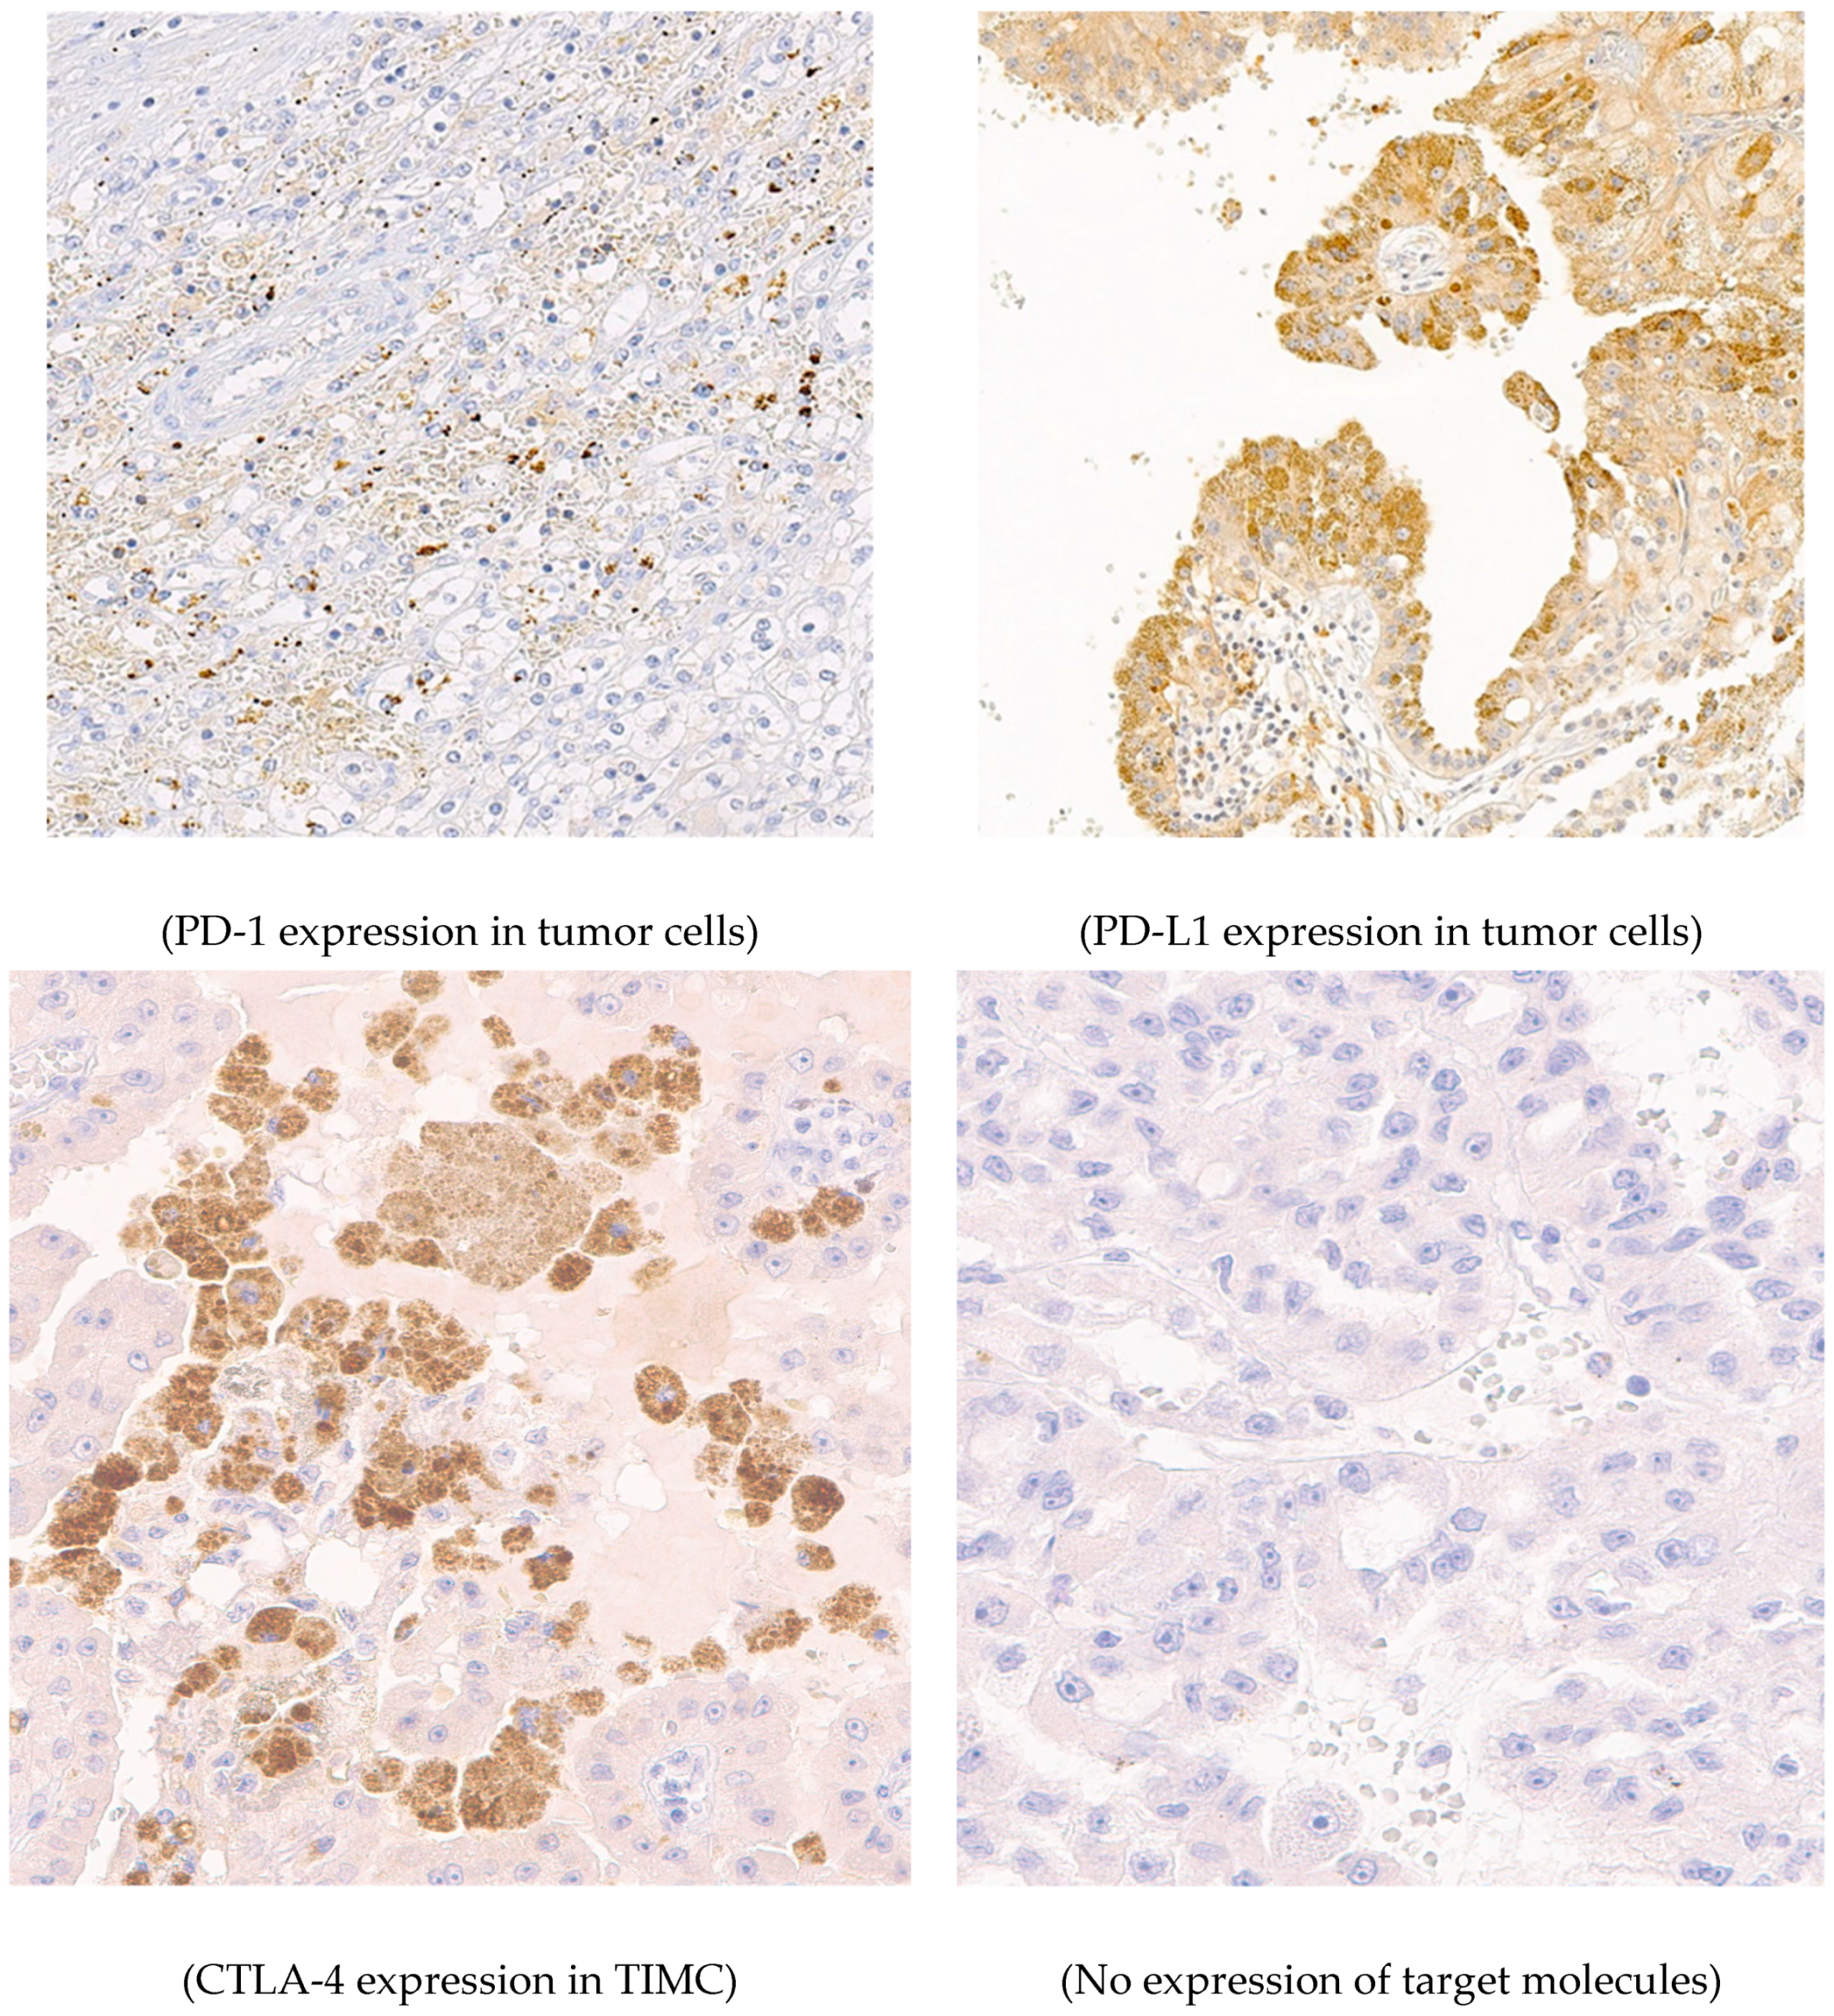
3.1. Patients’ Characteristics and Expression of Target Molecules of CI Therapies

Three hundred forty-two tumor specimens were analyzed, with 64.6% (221) from male patients (Table 1). The median age at surgery was 66 years (23–92 years). 10.8% (37) of the patients presented with primary metastatic diseases, and 12.6% (43) developed secondary metastases within a median follow up period of 38 months (1–160 months). A histopathological evaluation showed that 78.9% (270) were clear cell RCC, 12.0% (41) were papillary RCC, 7.0% (24) were chromophobe RCC, and 2% (7) were other histopathological subtypes (five hybrid mixed tumors, two sarcomatoid dedifferentiated tumors) (Table 1). The expression of PD-1 in TIMC, PD-L1 in tumor cells, PD-L1 in TIMC, and CTLA-4 in TIMC was detected in 9.4% (31), 12.3% (41), 4.8% (16), and 6.3% (20), respectively (Figure 1, Table 1). PD-1 expression in TIMC is associated with a high grade tumor (G3, p < 0.001, correlation coefficient 0.215) or primary metastatic diseases (p = 0.007, not significant with Bonferroni correction, correlation coefficient 0.149). PD-L1 staining in tumor cells is associated with the papillary subtype (p < 0.001, correlation coefficient 0.242), a high grade tumor (G3, p = 0.029, not significant with Bonferroni correction, correlation coefficient 0.120), or secondary metastatic diseases (p = 0.030, not significant with Bonferroni correction, correlation coefficient 0.125). The CTLA-4 expression in TIMC is associated with primary metastatic diseases (p = 0.006, not significant with Bonferroni correction correlation coefficient 0.153). The simultaneous expression of PD-1 and CTLA-4 is associated with a higher tumor stage (p ≥ T3, p = 0.037, not significant with Bonferroni correction, correlation coefficient 0.119) and a high grade tumor (G3, p = 0.005, not significant with Bonferroni correction, correlation coefficient 0.159), as well as with primary metastatic diseases (p < 0.001, correlation coefficient 0.200). Tumor immune infiltration assessed by CD3 rate is higher in male patients (p = 0.026, not significant with Bonferroni correction, correlation coefficient 0.122), ccRCC (p = 0.035, not significant with Bonferroni correction, correlation coefficient 0.122), or high grade diseases (G3, p = 0.013, not significant with Bonferroni correction, correlation coefficient 0.137) (Table 1). A nonparametric correlation revealed a significant association between PD-1, PD-L1, and CTLA-4 expressions (Table 2).

3.2. Survival Analysis

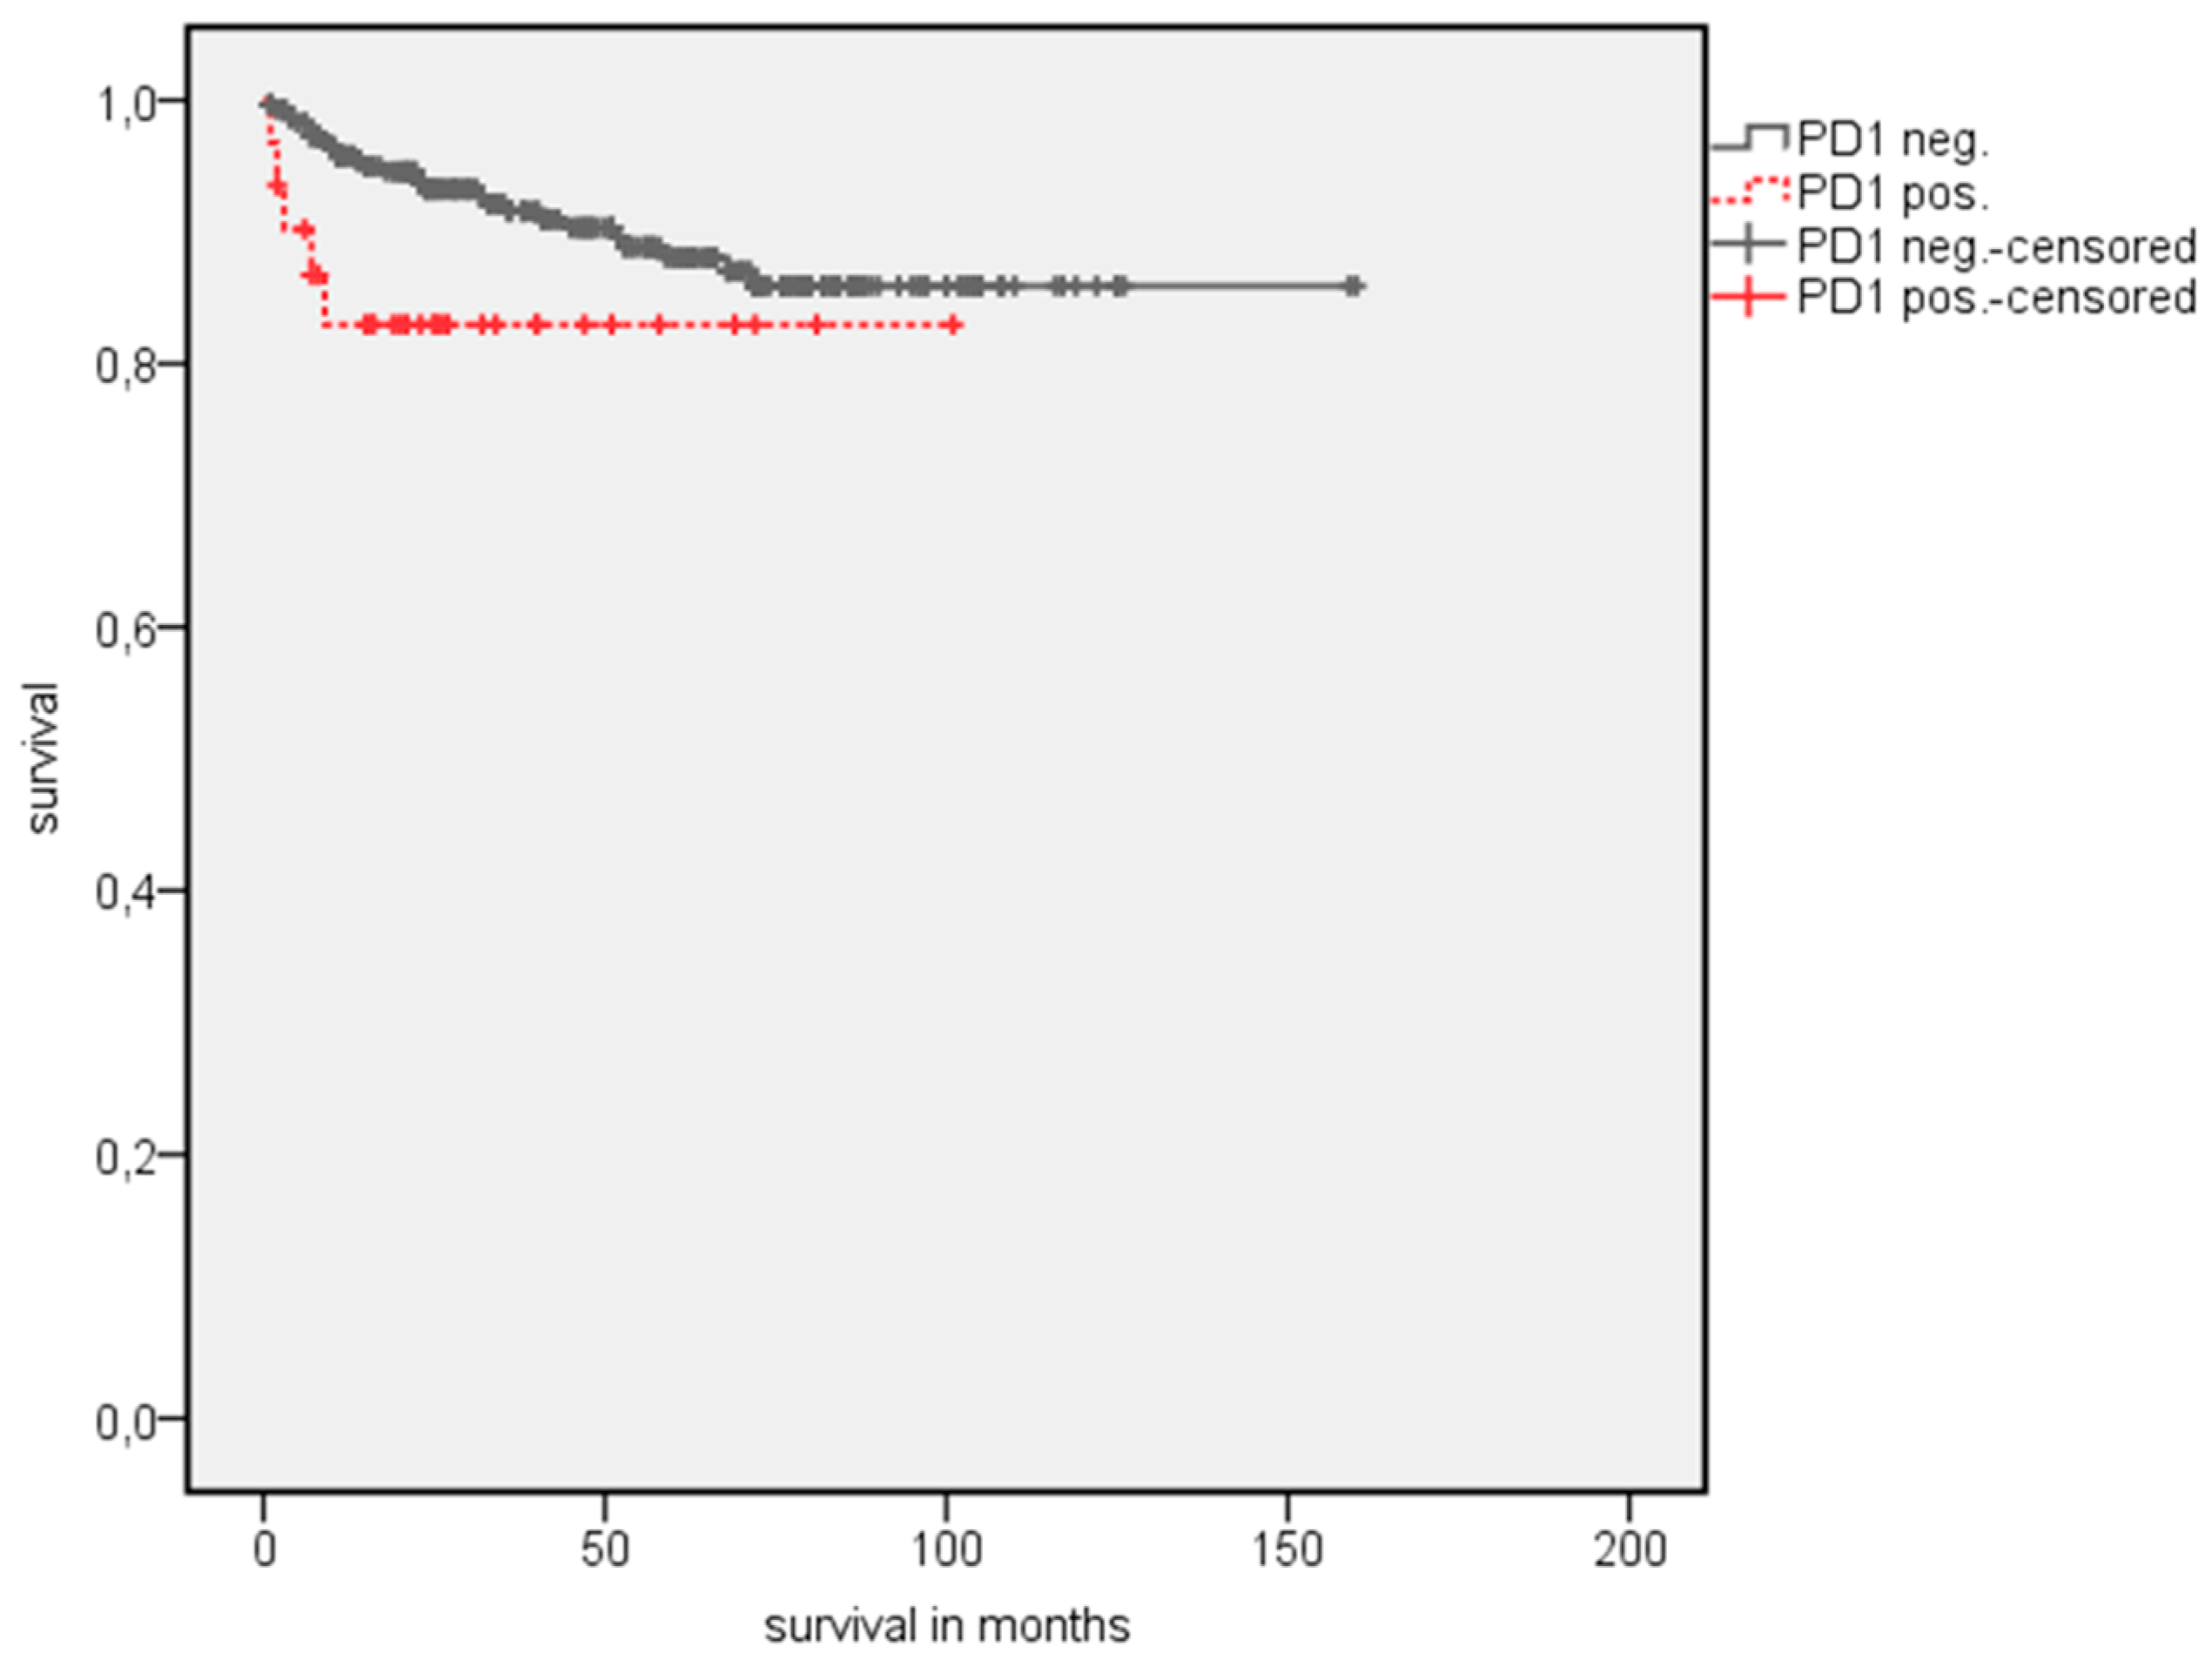
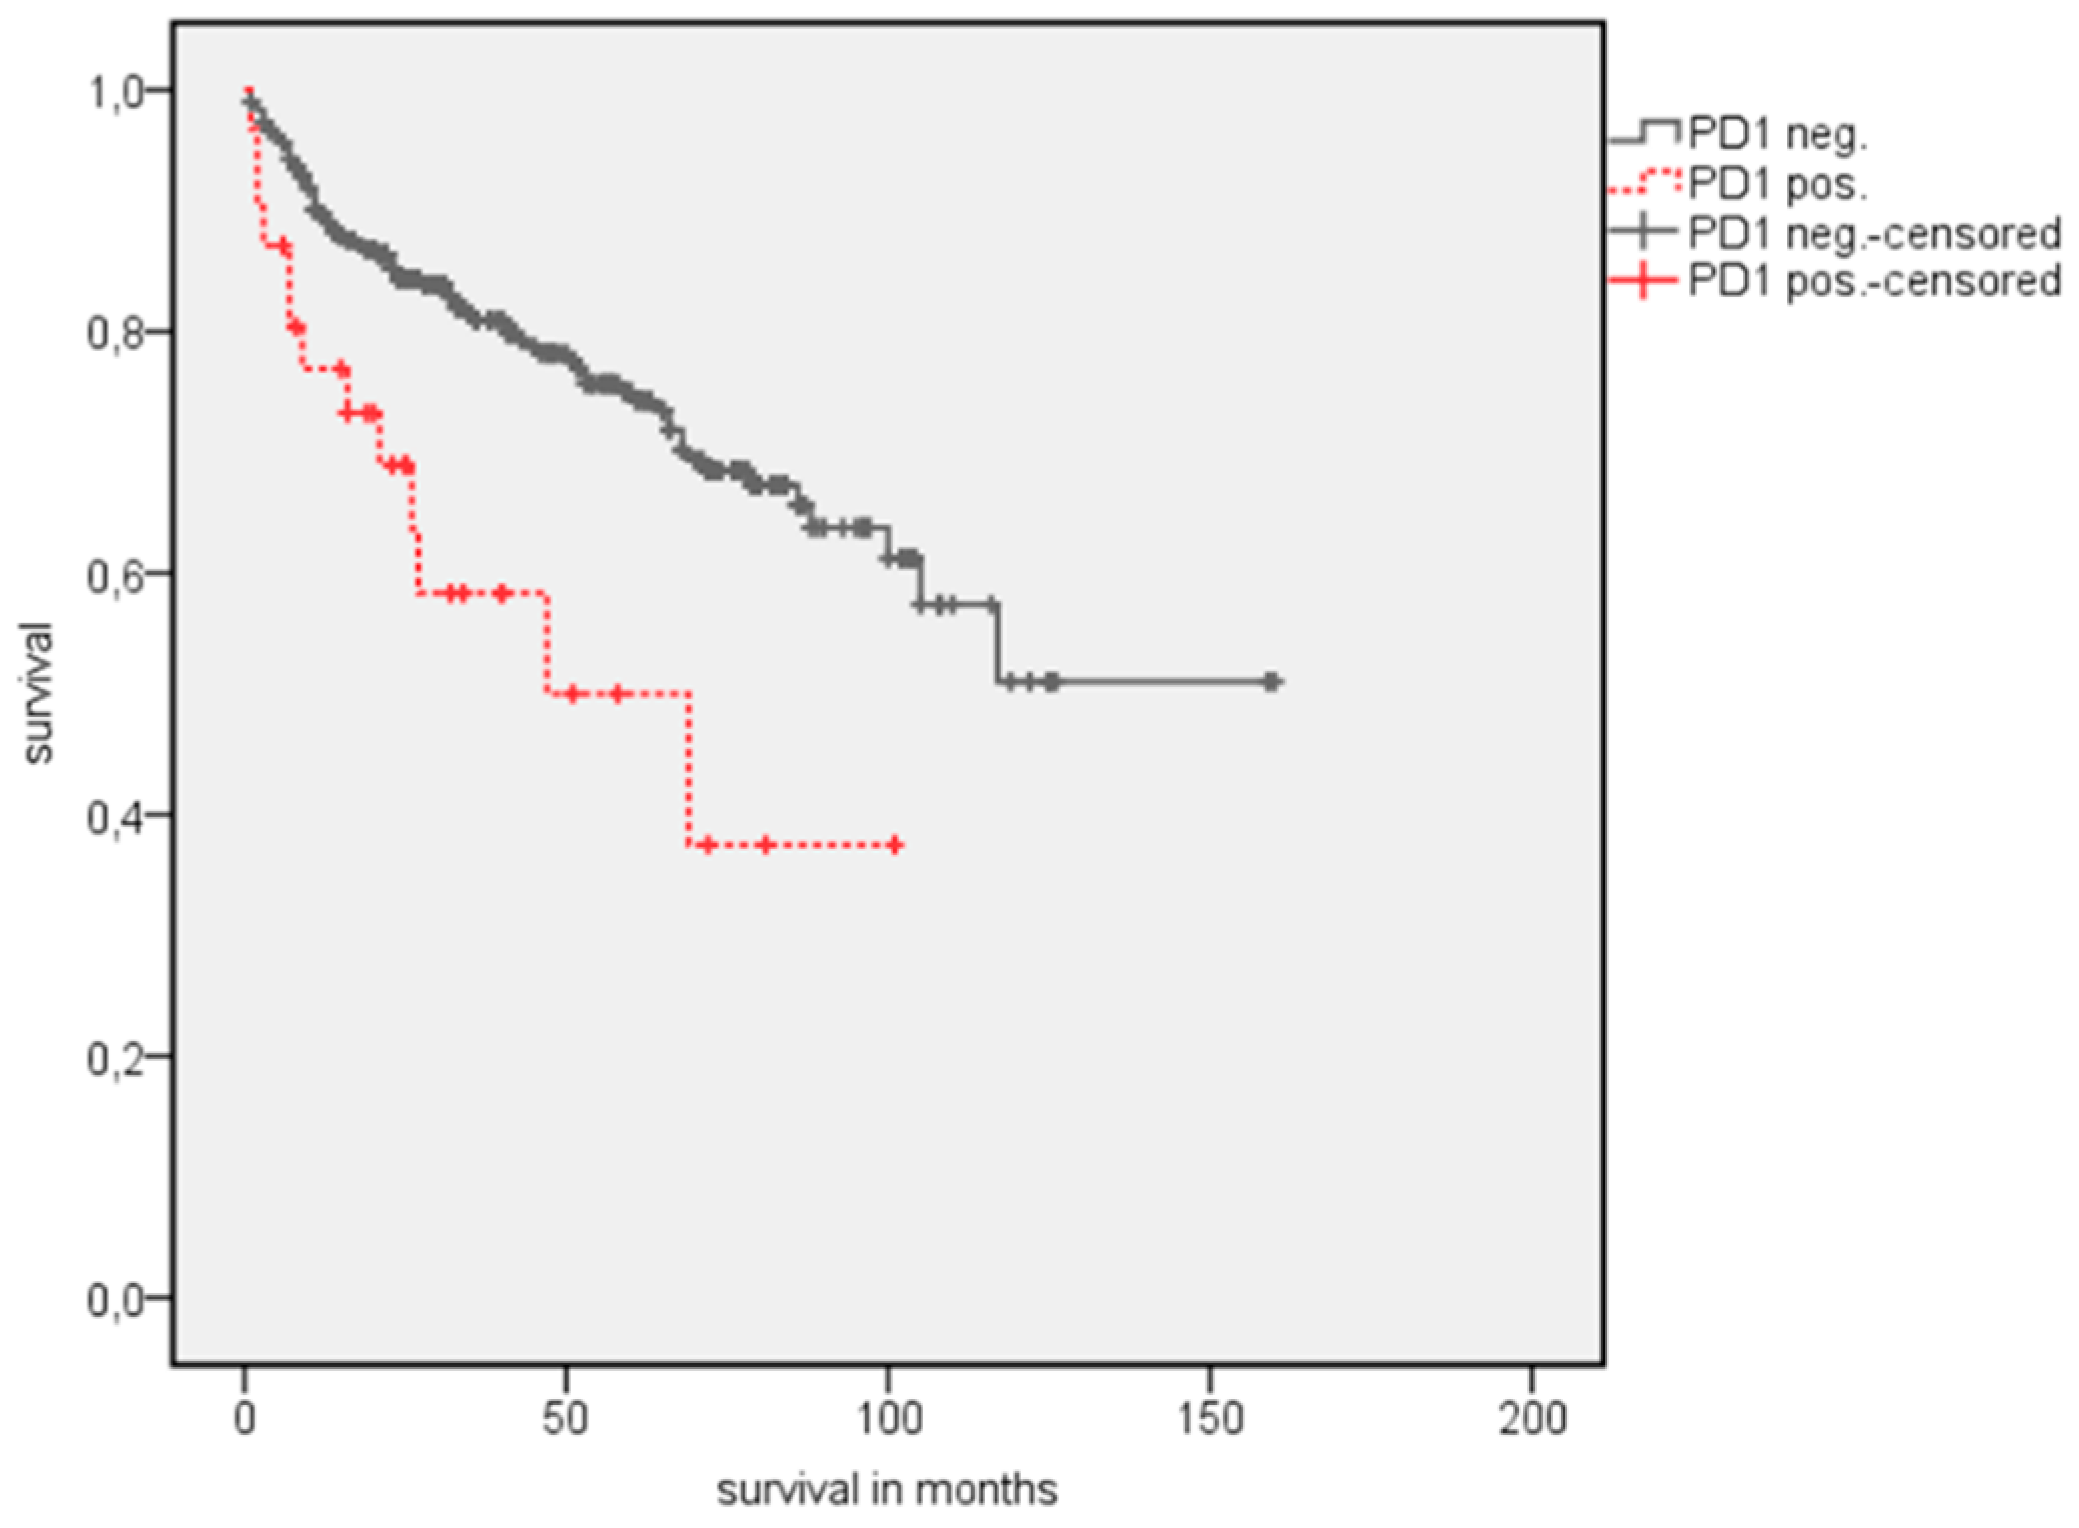
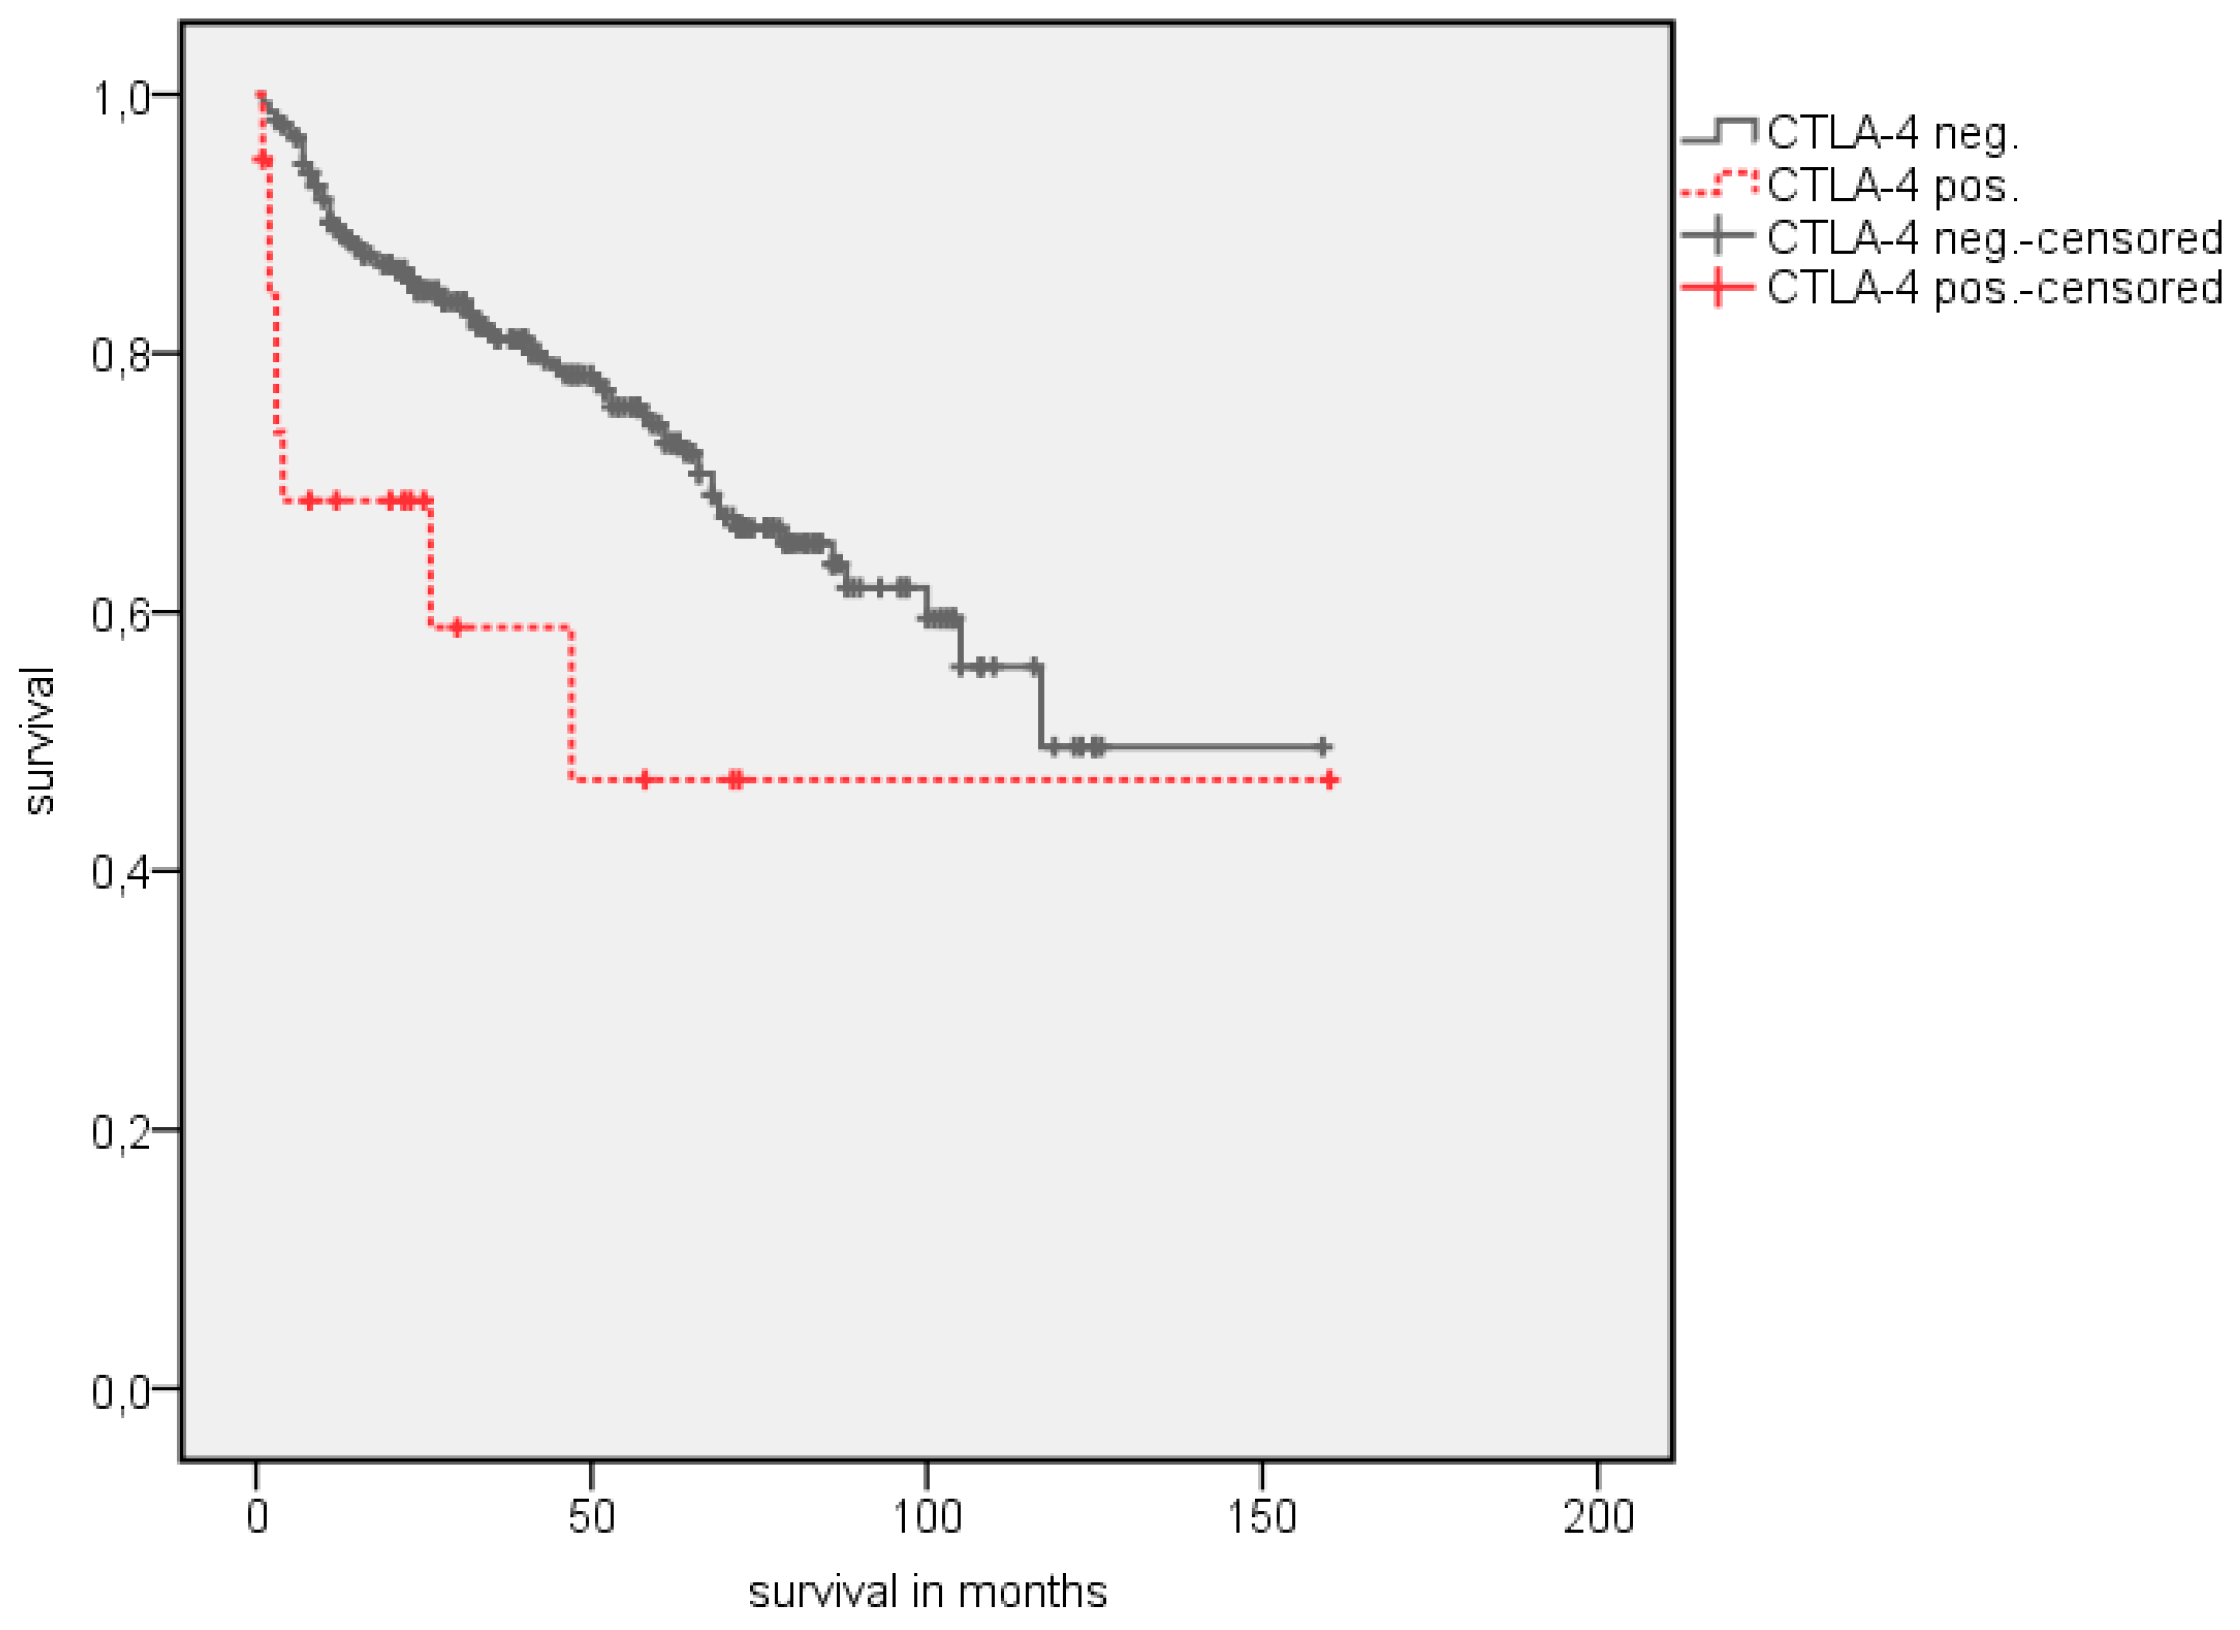
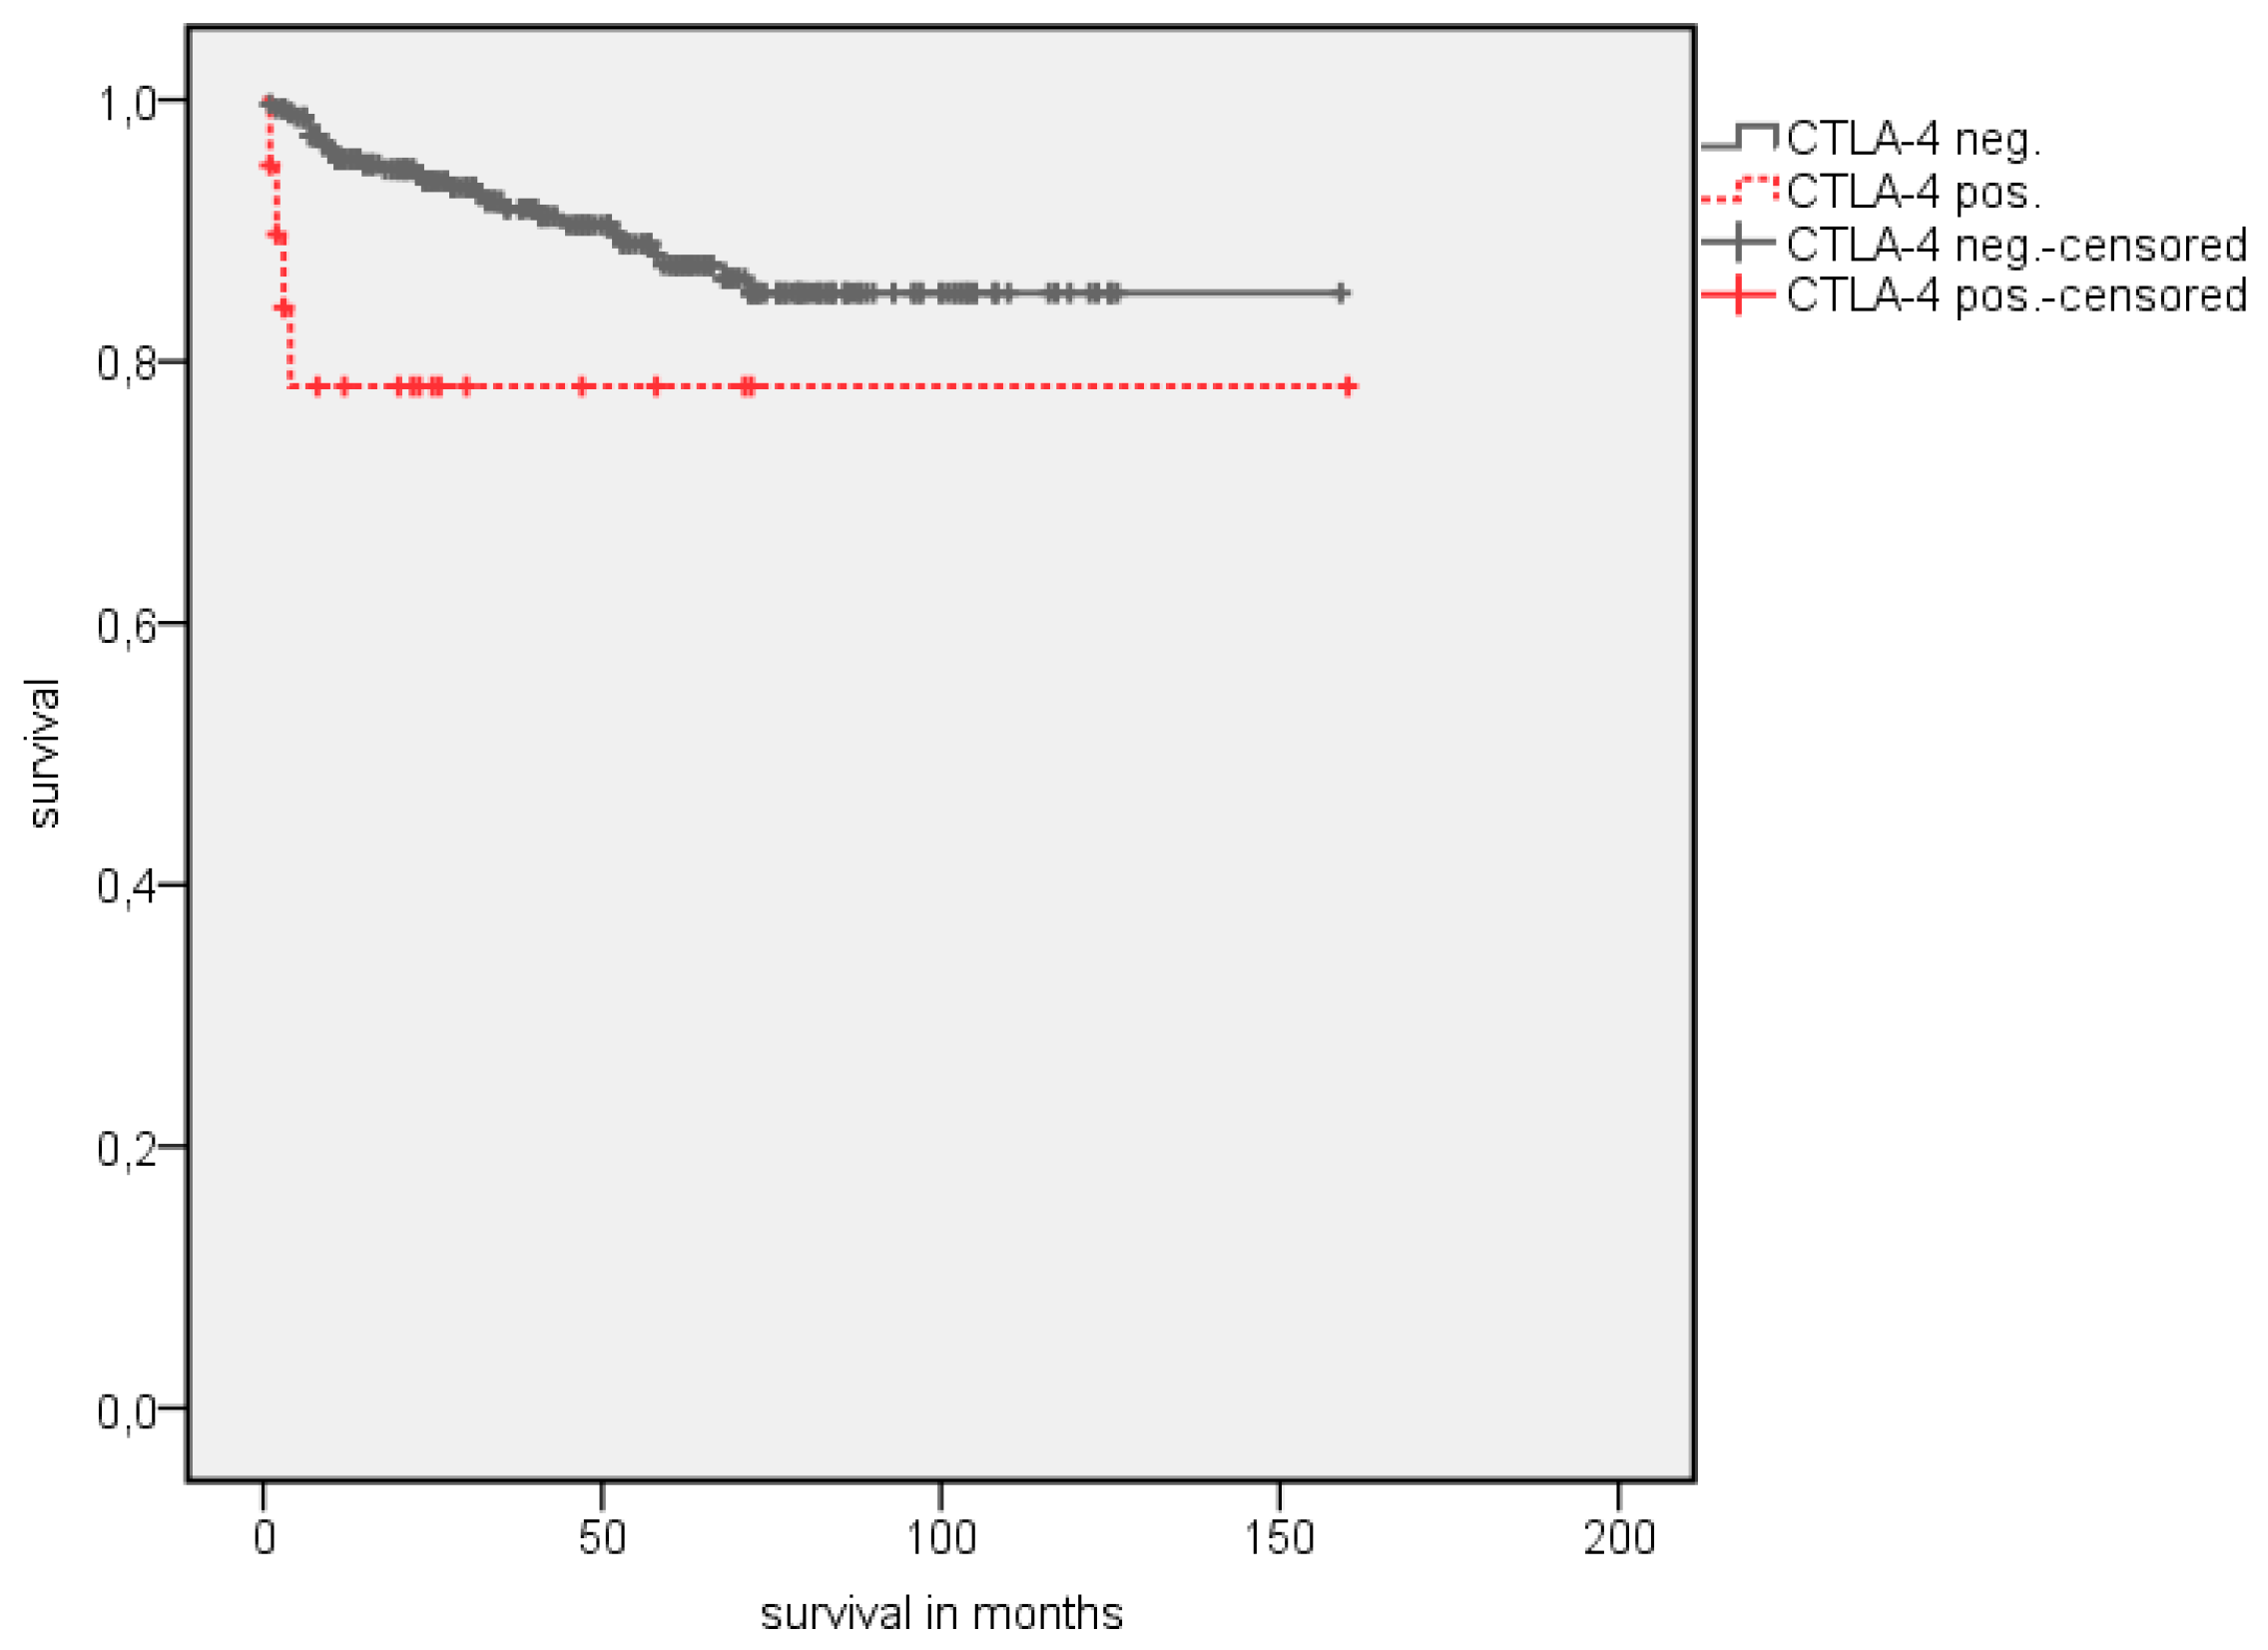
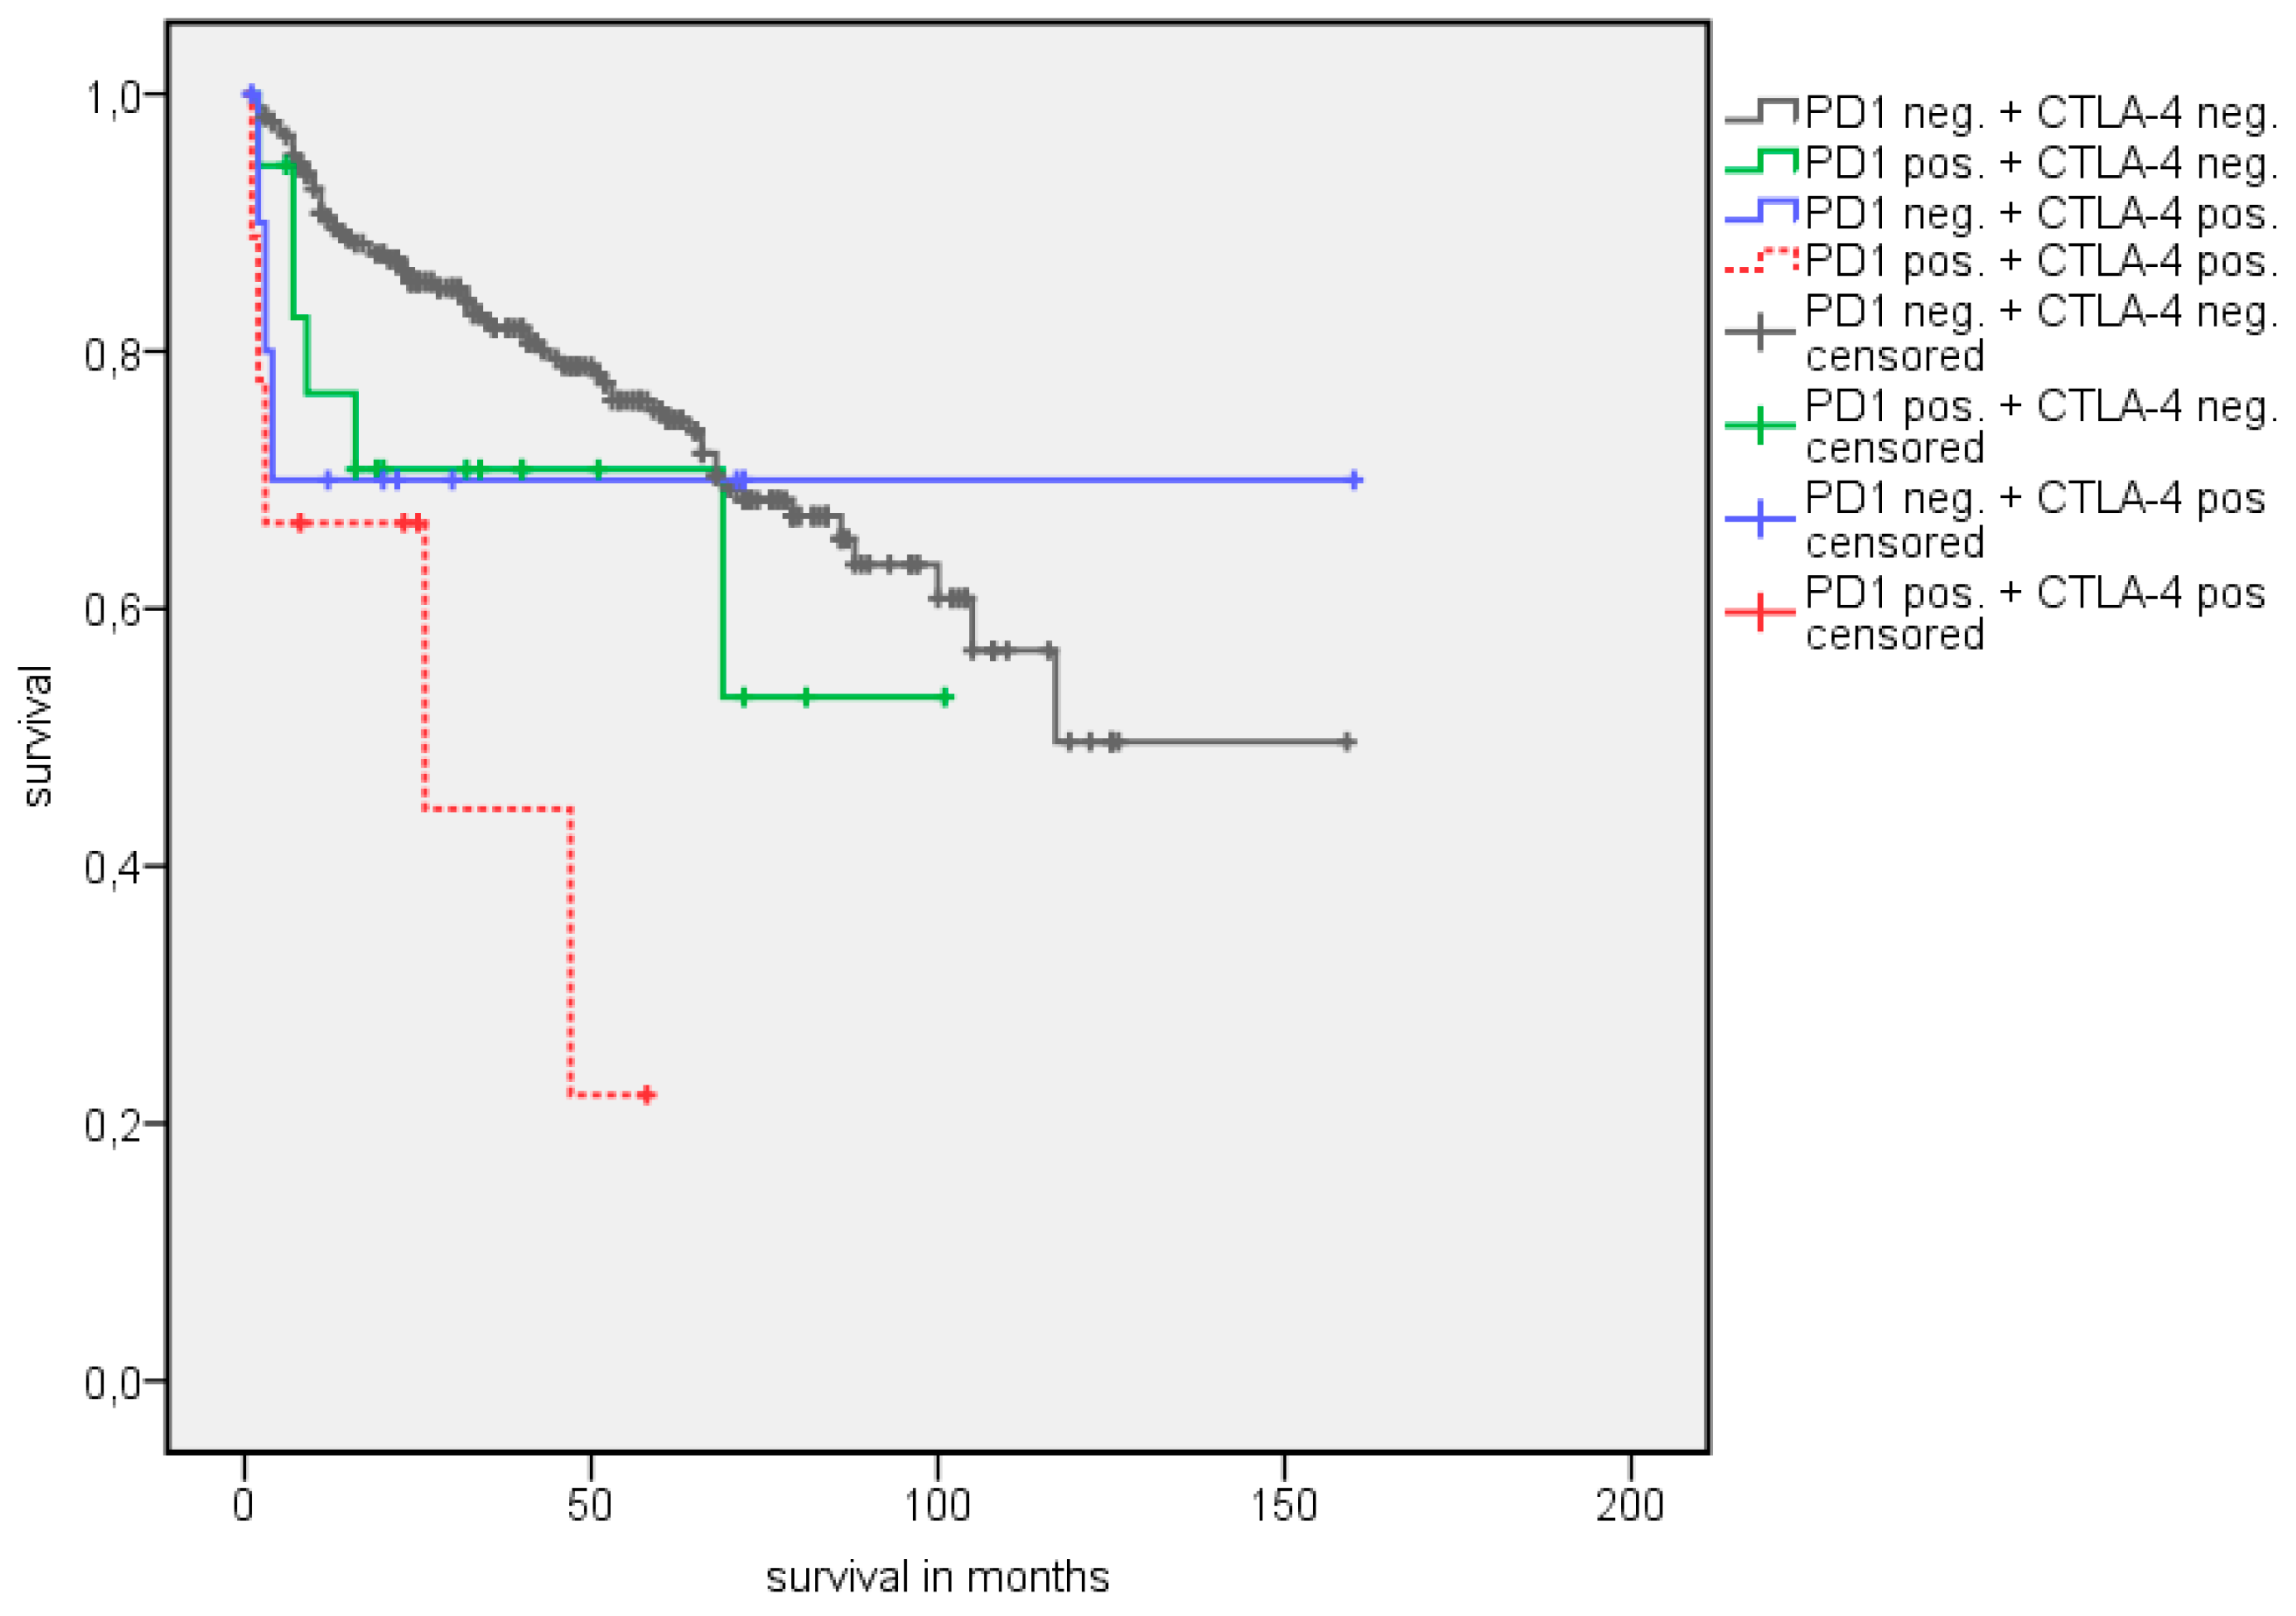
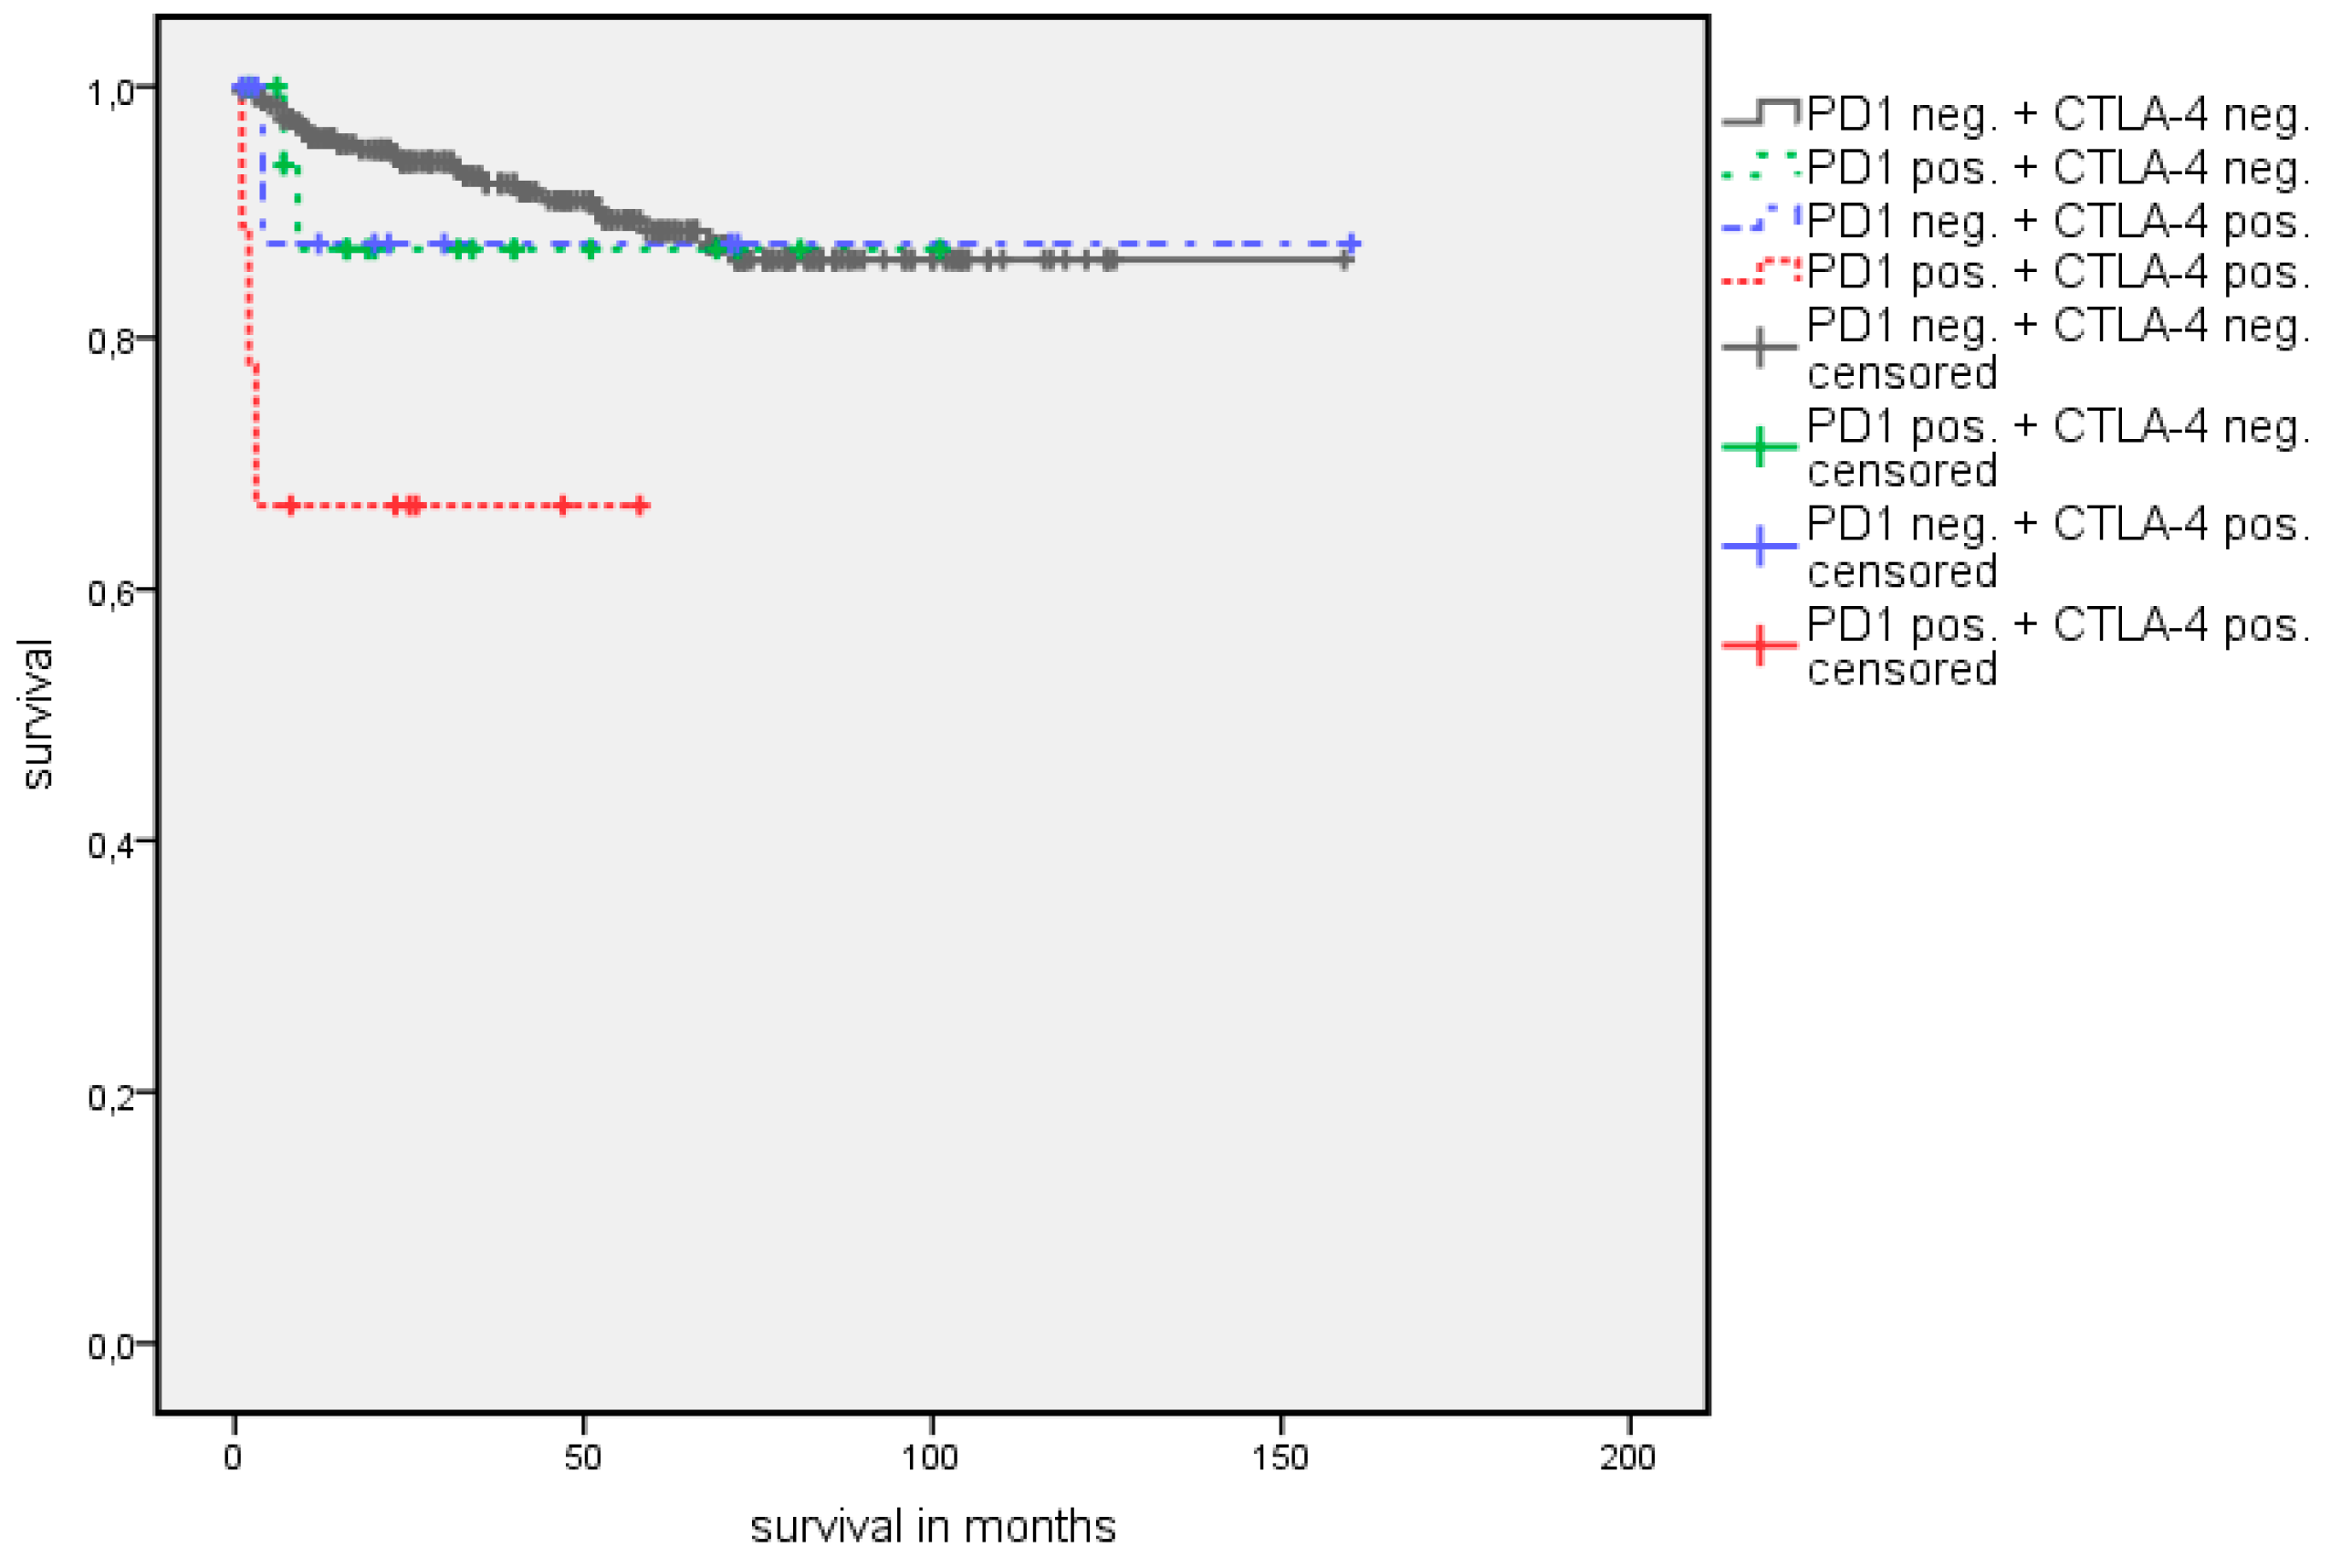
3.2.1. Log Rank Test

A survival analysis showed a significantly longer estimated OS in patients with PD-1 negative TIMC (Table 3). The estimated mean OS advantage was 109.7 vs. 55.8 months (p = 0.002) (Figure 2). A similar trend was detected in estimated mean cancer specific survival (CSS), although this did not reach statistical significance (142.1 vs. 84.5 months, p = 0.072) (Figure 3). The positive CTLA-4 expression in TIMC shows a significant association with a poor estimated mean OS (84.1 vs. 107.76 months, p = 0.013) (Figure 4) and CSS (125.5 vs. 140.6 months, p = 0.019) (Figure 5). Especially within the first year after a resection, CTLA-4 positive patients performed worse. A small subgroup of patients with a positive PD-1 expression in TIMC and a positive CTLA-4 expression in TIMC are at high risk in their estimated mean OS (29.8 vs. 108.8 months, p < 0.001) (Figure 6) and CSS (39.3 vs. 142.4 months, p < 0.001) (Figure 7).
A subgroup analysis with clear-cell histology tumors only shows comparable results regarding the prognostic value of PD-1 and CTLA-4 expression (Table 4). Though PD-1 expression in TIMC is not associated with an estimated mean OS (65.9 vs. 116.2 months, p = 0.058) and CSS (92.4 vs. 148.0 months, p = 0.329) in primary non-metastatic patients, CTLA-4 expression in TIMC (OS 94.9 vs. 114.8 months, p = 0.041; CSS 125.3 vs. 146.8 months, p = 0.001), and the combination of PD-1 expression in TIMC and CTLA-4 expression in TIMC are significantly associated with a worse estimated mean OS (32.0 vs. 116.2 months, p = 0.001) and CSS (32.0 vs. 148.7 months, p = 0.001) (Table 5). For PD-L1-expression in tumor cells and TIMC, as well as for infiltration by CD3 positive cells, no association with an estimated mean OS or CSS was found.

3.2.2. Univariate Cox Regression Analysis

A univariate Cox regression analysis shows a significant prognostic value with regard to OS and CCS for a high tumor stage (≥pT3; OS: HR = 3.4, p < 0.001; CSS: HR = 3.0, p = 0.001), a high tumor grade ( = G3; OS: HR = 3.5, p < 0.001; CSS: HR = 6.7, p < 0.001), and an advanced age at diagnosis (>65 years; OS: HR = 2.7, p < 0.001; CSS: HR = 2.3, p = 0.023). The male gender (OS: HR = 1.8, p = 0.016) and a higher eastern cooperative oncology group (ECOG) performance status (ECOG > 0; OS: HR = 2.3, p < 0.001) were associated with a worse OS but not with CSS. As shown in the log rank test, PD-1 expression in TIMC (HR = 2.5, p = 0.003) and CTLA-4 expression in TIMC (HR = 2.4, p = 0.017) are significantly associated with a worse OS. CTLA-4 expression in TIMC is the only prognostic IHC marker for CSS (HR = 3.3, p = 0.027). The PD-1 and CTLA-4 double positive subgroup is again associated with a worse OS (HR = 4.3, p = 0.002) and a worse CSS (HR = 6.3, p = 0.003) (Table S1). In primary non metastatic patients, only a high tumor grade (G3, HR = 4.4, p = 0.001), CTLA-4 expression (HR = 2.5, p = 0.005), and the combination of PD-1 and CTLA-4 expression (HR = 16.3, p < 0.001) are significantly associated with a worse CSS (Table S2).

3.2.3. Multivariate Cox Regression Analysis

After controlling for the univariately significant parameters age, gender, tumor grade, tumor stage, and ECOG performance status, CTLA-4 expression in TIMC remains independently prognostic for OS (HR = 2.8, p = 0.013) and CSS (HR = 3.7, p = 0.048) in the whole cohort (Table 6), as well as in the ccRCC-only subgroup analysis (HR = 4.1, OS p = 0.006; CSS HR = 8.2, p = 0.003) (Table 7) and in the primary non-metastatic subgroup analysis (OS HR = 3.4, p = 0.028; CSS HR = 7.4, p = 0.022) (Table 8). PD-1 expression in TIMC alone and in combination with CTLA-4 expression in TIMC is not an independent prognostic factor in multivariate Cox regression analysis.

4. Discussion

As part of the anti-tumor immune response, naive T cells are activated by the presentation of tumor antigens from dendritic cells and other antigen-presenting cells via Major Histocompatibility Complex (MHC) molecules. In this immunological checkpoint, costimulatory signals for the activation or anergy of the effector T cell are crucial. Two of these immunosuppressive costimulatory pathways are the PD-1/PD-L1 interaction and the activation of CTLA-4 via B7-1 or B7-2. Recently, the combination of checkpoint inhibitors ipilimumab (anti-CTLA-4 antibody) and nivolumab (anti-PD-1 antibody) in the phase III Checkmate 214 study (NCT02210117) in advanced RCC demonstrated the statistically significant improvement of overall response rate (ORR) compared to the standard of care with sunitinib in first line therapy in intermediate and poor risk patients [36]. Though checkpoint inhibitors targeting these pathways are changing therapy in metastatic renal cell carcinoma [12,36], the prognostic value of PD-1, PD-L1, and CTLA-4 expression in localized renal cell carcinoma remains unclear.
PD-1 on the cell surface of activated T cells is immunosuppressive when it is activated in peripheral tissue by tumor cells via PD-L1 or PD-L2 expression. In our analysis, PD-1 expression was detected in TIMC in about 9.4% of our tumor specimens, with significantly higher expression in high grade tumors and primary metastatic diseases. Previous studies on the prognostic value of PD-1 expression in TIMC in ccRCC are contradictory [15,16,37]. In our cohort, we found a significant association with OS and CSS by univariate Cox regression analysis, but, after an adjustment to tumor stage, tumor grade, gender, age, and ECOG performance status, multivariate Cox regression analysis revealed that it is not an independent prognostic factor.
PD-1 expression on TIMC and PD-L1 expression in tumor cells are considered to be markers of reduced T cell function in the tumor microenvironment [14]. An association of PD-L1 expression and a poor prognosis is described in ccRCC as well as in other histological subtypes [17,18,20,21,23,37], and recently published data show an association with a worse OS and progression free survival (PFS) in high risk non metastatic diseases [38]. In our analysis, PD-L1 expression is significantly correlated with high grade diseases and non-metastatic diseases and lower in secondary metastatic diseases. However, no association with OS or CSS could be detected.
CTLA-4 is the second target of checkpoint inhibition therapies in renal cell carcinoma. Antibodies to CTLA-4 were the first checkpoint inhibitors with anti-tumor activity [39,40]. CTLA-4 expression was significantly correlated with primary metastatic diseases and associated with a a reduced OS and CSS in the whole cohort, as well as in a ccRCC-only subgroup. Though associated with primary metastatic diseases, CTLA-4 expression in a non-metastatic disease subgroup is still significantly associated with a worse OS and CSS. Multivariate analysis revealed CTLA-4 expression as an independent prognostic factor after an adjustment to tumor grade, tumor stage, age, gender, and ECOG performance status. This is, to our knowledge, the first description of CTLA-4 expression to be a prognostic marker in RCC.
As there is significant cross correlation, the synchronous expression of PD-1 in TIMC and of CTLA-4 in TIMC identifies patients with a worse outcome. The estimated median OS is more than six years shorter in this subgroup (29.8 vs. 108.8 months, p = 0.001) in the whole cohort and more than seven years shorter (32.0 vs. 116.2 months, p < 0.001) in the primary non-metastatic subgroup. The simultaneous expression of PD-1 in TIMC and CTLA-4 in TIMC seems to be a predictor for rapid disease progression and death, even in localized diseases. As we showed that the combination of PD-1 and CTLA-4 expression is correlated to metastatic diseases, we hypothesize that the expression of these checkpoint molecules may be an early marker for micro metastatic diseases undetectable by cross-sectional imaging. Local therapy alone therefore is not sufficient for long term tumor control, and adjuvant therapy may be considered.
In metastatic diseases, PD-L1 expression in tumor cells or TIMC is the most studied biomarker for the prediction of a response to PD-1/PD-L1 CI therapy [33,41,42]. Response rates are better in PD-L1 positive tumors, but, as there are relevant response rates in PD-L1 negative subgroups, PD-L1 expression still is regarded as a prognostic but not predictive marker and, therefore, cannot be recommended for therapy allocation [43,44]. Major problems in the development of predictive biomarkers for CI therapy are the dynamic expression, the heterogeneity within the primary tumor, and the low correlation between the primary and metastatic sites [45,46,47]. In primary non-metastatic diseases, the whole tumor could be assessed after a resection directly prior to allocation to adjuvant therapy. The expression of key molecules for immune escape mechanisms could therefore be more representative for the immune status of the whole disease. In our view, inhibition of tumor specific immune escape mechanisms in high risk patients at a non-metastatic stage could become an important part of RCC therapy. Large scale trials on adjuvant CI therapies in RCC with antibodies targeting PD-1 and CTLA-4 (NCT03138512; NCT03142334; NCT03288532; NCT03024996) are initiated or ongoing. These studies contain large biomarker arms and may reveal predictive markers in the near future [33]. Exploratory analyses in metastatic renal cell carcinoma already show that gene expression analyses allow the classification into new subgroups which may have an association to responses across different treatments [48].
In reflection of an analysis by Choueri et al., we have evaluated the influence of the localization (left vs. right), but neither OS (p = 0.165) nor CSS (p = 0.10) demonstrated a significant correlation [49]. Thus, we did not consider localization as a separate factor in our multivariate analysis. The limitations of our study are the restriction to IHC expression analysis and the non-interventional retrospective design. There is no reliable information on treatment after a tumor resection, which may bias survival analysis. We were able to show that CTLA-4 expression is an independent marker for high risk of early cancer specific death after local therapy, but evidence for efficiency of CTLA-4 targeting therapy in an adjuvant setting is still missing. Furthermore, our analysis does not contain a comprehensive assessment of the tumor immune status, and the regulation of anti-tumor cytotoxicity in RCC is much more heterogeneous and diverse [50,51]. It would also be desirable to validate the results of our study in an independent cohort.
Another limitation is the relatively small number of patients with non-clear cell histology. Though PD-L1 expression is associated with papillary RCC, no correlation to OS or CSS was detected. For chromophobe RCC, no association of PD-1 and PD-L1 expression with OS was reported previously in a different chromophobe RCC-only cohort by Erlmeier and colleagues [52].
In conclusion, to our knowledge, this is the first description of CTLA-4 expression as an independent prognostic marker for OS and CSS in RCC. It is of special note that the combination of PD-1 and CTLA-4 expression identifies high risk patients with poor OS and CSS.

Supplementary Materials

The following are available online at https://www.mdpi.com/2077-0383/8/5/743/s1, supplementary document: Data, Table S1: Univariate Cox regression analysis: Association of clinical parameters and immunological markers with OS or CSS in all RCC patients, Table S2: Univariate Cox regression analysis: Association of clinical parameters and immunological markers with OS or CSS in the no primary metastases subgroup.

Author Contributions

Conceptualization, A.K., C.G.S., A.H., B.W., S.W., H.T., and F.E.; methodology, A.K., C.G.S., A.H., B.W., S.W., H.T., and F.E.; validation, C.G.S., A.H., and F.E.; formal analysis, A.K., P.J.G., S.W., and H.T.; investigation, A.H., A.K., F.E.; resources, A.H., B.W., and F.E.; data curation, A.K., S.W., H.T.; writing—original draft preparation, A.K. and F.E.; writing—review and editing, A.K., C.G.S., A.H., P.J.G., B.W., S.W., H.T., and F.E.; visualization, A.K.; supervision, P.J.G., B.W., and H.T.; project administration, A.K. and F.E.; funding acquisition, B.W., A.H., and F.E.

Acknowledgments

The authors thank the study participants for their important contribution to this study. Additionally, we thank Rudolf Jung and the staff of the immunohistochemistry laboratories at the Institute of Pathology, Friedrich Alexander-University Erlangen-Nuernberg and the Institute of Pathology, Technische Universitaet Munich for excellent technical support with immunohistochemistry work.

Conflicts of Interest

A.K. reports personal fees and non-financial support from Bayer, personal fees and non-financial support from Pfizer, non-financial support from Novartis, non-financial support from Sanofi Aventis, non-financial support from BMS, and non-financial support from Ipsen; all outside the submitted work. A.H. reports grants, personal fees, and non-financial support from Roche, personal fees from Astra Zeneca, personal fees and non-financial support from BMS, personal fees and non-financial support from MSD, grants and personal fees from Cepheid, grants and personal fees from Biontech, grants and personal fees from Qiagen, personal fees from Abbvie, grants and personal fees from Novartis, personal fees from Boehringer Ingelheim, and grants and personal fees from Janssen; all outside the submitted work. P.J.G. reports personal fees and non-financial support from BMS, personal fees and non-financial support from Roche, personal fees and non-financial support from Novartis, personal fees and non-financial support from Bayer, personal fees and non-financial support from AstraZeneca, personal fees and non-financial support from Janssen-Cilag, personal fees and non-financial support from Ipsen, and personal fees and non-financial support from Eisal; all outside the submitted work. BW reports personal fees from Astellas and personal fees from Janssen-Cilag; all outside the submitted work. C.G.S., S.W., H.T., and F.E. have nothing to disclose.

References

  1. Siegel, R.; Naishadham, D.; Jemal, A. Cancer statistics, 2012. CA Cancer J. Clin. 2012, 62, 10–29. [Google Scholar] [CrossRef] [PubMed] [Green Version]
  2. Siegel, R.L.; Miller, K.D.; Jemal, A. Cancer statistics, 2015. CA Cancer J. Clin. 2015, 65, 5–29. [Google Scholar] [CrossRef] [PubMed]
  3. Ljungberg, B.; Bensalah, K.; Canfield, S.; Dabestani, S.; Hofmann, F.; Hora, M.; Kuczyk, M.A.; Lam, T.; Marconi, L.; Merseburger, A.S.; et al. EAU guidelines on renal cell carcinoma: 2014 update. Eur. Urol. 2015, 67, 913–924. [Google Scholar] [CrossRef] [PubMed]
  4. Lipworth, L.; Tarone, R.E.; Lund, L.; McLaughlin, J.K. Epidemiologic characteristics and risk factors for renal cell cancer. Clin. Epidemiol. 2009, 1, 33–43. [Google Scholar] [PubMed] [Green Version]
  5. Rini, B.I.; Campbell, S.C.; Escudier, B. Renal cell carcinoma. Lancet 2009, 373, 1119–1132. [Google Scholar] [CrossRef]
  6. Heng, D.Y.; Xie, W.; Regan, M.M.; Warren, M.A.; Golshayan, A.R.; Sahi, C.; Eigl, B.J.; Ruether, J.D.; Cheng, T.; North, S.; et al. Prognostic factors for overall survival in patients with metastatic renal cell carcinoma treated with vascular endothelial growth factor-targeted agents: Results from a large, multicenter study. J. Clin. Oncol. 2009, 27, 5794–5799. [Google Scholar] [CrossRef] [PubMed]
  7. Shah, B.K.; Ghimire, K.B. Survival trends among patients with advanced renal cell carcinoma in the United States. Urol. Int. 2015, 94, 133–136. [Google Scholar] [CrossRef]
  8. Marschner, N.; Staehler, M.; Muller, L.; Nusch, A.; Harde, J.; Koska, M.; Janicke, M.; Goebell, P.J. Survival of Patients with Advanced or Metastatic Renal Cell Carcinoma in Routine Practice Differs from That in Clinical Trials-Analyses From the German Clinical RCC Registry. Clin. Genitourin. Cancer 2017, 15, e209–e215. [Google Scholar] [CrossRef]
  9. Mazza, C.; Escudier, B.; Albiges, L. Nivolumab in renal cell carcinoma: Latest evidence and clinical potential. Ther. Adv. Med. Oncol. 2017, 9, 171–181. [Google Scholar] [CrossRef]
  10. Thorsson, V.; Gibbs, D.L.; Brown, S.D.; Wolf, D.; Bortone, D.S.; Ou Yang, T.H.; Porta-Pardo, E.; Gao, G.F.; Plaisier, C.L.; Eddy, J.A.; et al. The Immune Landscape of Cancer. Immunity 2018, 48, 812–830. [Google Scholar] [CrossRef] [PubMed]
  11. Holzman, S.A.; de la Calle, C.M.; Kissick, H.T.; Osunkoya, A.O.; Pollack, B.P.; Patil, D.; Ogan, K.; Master, V.A. High Expression of Major Histocompatibility Complex Class I in Clear Cell Renal Cell Carcinoma Is Associated with Improved Prognosis. Urol. Int. 2015, 95, 72–78. [Google Scholar] [CrossRef]
  12. Bedke, J.; Stuhler, V.; Stenzl, A.; Brehmer, B. Immunotherapy for kidney cancer: Status quo and the future. Curr. Opin. Urol. 2018, 28, 8–14. [Google Scholar] [CrossRef]
  13. Sittig, S.P.; Kollgaard, T.; Gronbaek, K.; Idorn, M.; Hennenlotter, J.; Stenzl, A.; Gouttefangeas, C.; Thor Straten, P. Clonal expansion of renal cell carcinoma-infiltrating T lymphocytes. Oncoimmunology 2013, 2, e26014. [Google Scholar] [CrossRef] [Green Version]
  14. Hegde, N.; Melanson, E.; Sazonov, E. Development of a real time activity monitoring Android application utilizing SmartStep. In Proceedings of the 2016 38th Annual International Conference of the IEEE Engineering in Medicine and Biology Society (EMBC), Orlando, FL, USA, 16–20 August 2016; pp. 1886–1889. [Google Scholar] [CrossRef]
  15. Kim, K.S.; Sekar, R.R.; Patil, D.; Dimarco, M.A.; Kissick, H.T.; Bilen, M.A.; Osunkoya, A.O.; Master, V.A. Evaluation of programmed cell death protein 1 (PD-1) expression as a prognostic biomarker in patients with clear cell renal cell carcinoma. Oncoimmunology 2018, 7, e1413519. [Google Scholar] [CrossRef] [PubMed]
  16. Kang, M.J.; Kim, K.M.; Bae, J.S.; Park, H.S.; Lee, H.; Chung, M.J.; Moon, W.S.; Lee, D.G.; Jang, K.Y. Tumor-infiltrating PD1-Positive Lymphocytes and FoxP3-Positive Regulatory T Cells Predict Distant Metastatic Relapse and Survival of Clear Cell Renal Cell Carcinoma. Transl. Oncol. 2013, 6, 282–289. [Google Scholar] [CrossRef] [Green Version]
  17. Thompson, R.H.; Gillett, M.D.; Cheville, J.C.; Lohse, C.M.; Dong, H.; Webster, W.S.; Krejci, K.G.; Lobo, J.R.; Sengupta, S.; Chen, L.; et al. Costimulatory B7-H1 in renal cell carcinoma patients: Indicator of tumor aggressiveness and potential therapeutic target. Proc. Natl. Acad. Sci. USA 2004, 101, 17174–17179. [Google Scholar] [CrossRef] [PubMed] [Green Version]
  18. Thompson, R.H.; Kuntz, S.M.; Leibovich, B.C.; Dong, H.; Lohse, C.M.; Webster, W.S.; Sengupta, S.; Frank, I.; Parker, A.S.; Zincke, H.; et al. Tumor B7-H1 is associated with poor prognosis in renal cell carcinoma patients with long-term follow-up. Cancer Res. 2006, 66, 3381–3385. [Google Scholar] [CrossRef] [PubMed]
  19. Choueiri, T.K.; Fay, A.P.; Gray, K.P.; Callea, M.; Ho, T.H.; Albiges, L.; Bellmunt, J.; Song, J.; Carvo, I.; Lampron, M.; et al. PD-L1 expression in nonclear-cell renal cell carcinoma. Ann. Oncol. 2014, 25, 2178–2184. [Google Scholar] [CrossRef]
  20. Choueiri, T.K.; Figueroa, D.J.; Fay, A.P.; Signoretti, S.; Liu, Y.; Gagnon, R.; Deen, K.; Carpenter, C.; Benson, P.; Ho, T.H.; et al. Correlation of PD-L1 tumor expression and treatment outcomes in patients with renal cell carcinoma receiving sunitinib or pazopanib: Results from COMPARZ, a randomized controlled trial. Clin. Cancer Res. 2015, 21, 1071–1077. [Google Scholar] [CrossRef]
  21. Xu, F.; Xu, L.; Wang, Q.; An, G.; Feng, G.; Liu, F. Clinicopathological and prognostic value of programmed death ligand-1 (PD-L1) in renal cell carcinoma: A meta-analysis. Int. J. Clin. Exp. Med. 2015, 8, 14595–14603. [Google Scholar]
  22. Fukuda, T.; Kamai, T.; Masuda, A.; Nukui, A.; Abe, H.; Arai, K.; Yoshida, K. Higher preoperative serum levels of PD-L1 and B7-H4 are associated with invasive and metastatic potential and predictable for poor response to VEGF-targeted therapy and unfavorable prognosis of renal cell carcinoma. Cancer Med. 2016, 5, 1810–1820. [Google Scholar] [CrossRef]
  23. Iacovelli, R.; Nole, F.; Verri, E.; Renne, G.; Paglino, C.; Santoni, M.; Cossu Rocca, M.; Giglione, P.; Aurilio, G.; Cullura, D.; et al. Prognostic Role of PD-L1 Expression in Renal Cell Carcinoma. A Systematic Review and Meta-Analysis. Targeted Oncol. 2016, 11, 143–148. [Google Scholar] [CrossRef] [PubMed]
  24. Krummel, M.F.; Allison, J.P. CD28 and CTLA-4 have opposing effects on the response of T cells to stimulation. J. Exp. Med. 1995, 182, 459–465. [Google Scholar] [CrossRef]
  25. Fife, B.T.; Bluestone, J.A. Control of peripheral T-cell tolerance and autoimmunity via the CTLA-4 and PD-1 pathways. Immunol. Rev. 2008, 224, 166–182. [Google Scholar] [CrossRef] [PubMed]
  26. Buchbinder, E.I.; Desai, A. CTLA-4 and PD-1 Pathways: Similarities, Differences, and Implications of Their Inhibition. Am. J. Clin. Oncol. 2016, 39, 98–106. [Google Scholar] [CrossRef] [PubMed]
  27. Brunet, J.F.; Denizot, F.; Luciani, M.F.; Roux-Dosseto, M.; Suzan, M.; Mattei, M.G.; Golstein, P. A new member of the immunoglobulin superfamily—CTLA-4. Nature 1987, 328, 267–270. [Google Scholar] [CrossRef] [PubMed]
  28. Walunas, T.L.; Bakker, C.Y.; Bluestone, J.A. CTLA-4 ligation blocks CD28-dependent T cell activation. J. Exp. Med. 1996, 183, 2541–2550. [Google Scholar] [CrossRef] [PubMed]
  29. Zou, W.; Chen, L. Inhibitory B7-family molecules in the tumour microenvironment. Nat. Rev. Immunol. 2008, 8, 467–477. [Google Scholar] [CrossRef]
  30. Geissler, K.; Fornara, P.; Lautenschlager, C.; Holzhausen, H.J.; Seliger, B.; Riemann, D. Immune signature of tumor infiltrating immune cells in renal cancer. Oncoimmunology 2015, 4, e985082. [Google Scholar] [CrossRef]
  31. Tupikowski, K.; Partyka, A.; Kolodziej, A.; Dembowski, J.; Debinski, P.; Halon, A.; Zdrojowy, R.; Frydecka, I.; Karabon, L. CTLA-4 and CD28 genes’ polymorphisms and renal cell carcinoma susceptibility in the Polish population—A prospective study. Tissue Antigens 2015, 86, 353–361. [Google Scholar] [CrossRef]
  32. Liu, X.; Swen, J.J.; Diekstra, M.H.M.; Boven, E.; Castellano, D.; Gelderblom, H.; Mathijssen, R.H.J.; Vermeulen, S.H.; Oosterwijk, E.; Junker, K.; et al. A Genetic Polymorphism in CTLA-4 Is Associated with Overall Survival in Sunitinib-Treated Patients with Clear Cell Metastatic Renal Cell Carcinoma. Clin. Cancer Res. 2018. [Google Scholar] [CrossRef]
  33. Zhu, J.; Armstrong, A.J.; Friedlander, T.W.; Kim, W.; Pal, S.K.; George, D.J.; Zhang, T. Biomarkers of immunotherapy in urothelial and renal cell carcinoma: PD-L1, tumor mutational burden, and beyond. J. Immunother. Cancer 2018, 6, 4. [Google Scholar] [CrossRef] [Green Version]
  34. Jasinski-Bergner, S.; Stoehr, C.; Bukur, J.; Massa, C.; Braun, J.; Huttelmaier, S.; Spath, V.; Wartenberg, R.; Legal, W.; Taubert, H.; et al. Clinical relevance of miR-mediated HLA-G regulation and the associated immune cell infiltration in renal cell carcinoma. Oncoimmunology 2015, 4, e1008805. [Google Scholar] [CrossRef] [PubMed] [Green Version]
  35. Thomas, L. Labor und Diagnose; Th-Books Gmbh: Frankfurt am Main, Germany, 2005. [Google Scholar]
  36. Motzer, R.J.; Tannir, N.M.; McDermott, D.F.; Aren Frontera, O.; Melichar, B.; Choueiri, T.K.; Plimack, E.R.; Barthelemy, P.; Porta, C.; George, S.; et al. Nivolumab plus Ipilimumab versus Sunitinib in Advanced Renal-Cell Carcinoma. N. Engl. J. Med. 2018, 378, 1277–1290. [Google Scholar] [CrossRef]
  37. Erlmeier, F.; Weichert, W.; Schrader, A.J.; Autenrieth, M.; Hartmann, A.; Steffens, S.; Ivanyi, P. Prognostic impact of PD-1 and its ligands in renal cell carcinoma. Med. Oncol. 2017, 34, 99. [Google Scholar] [CrossRef]
  38. George, D.J.; Martini, J.F.; Staehler, M.; Motzer, R.J.; Magheli, A.; Escudier, B.; Gerletti, P.; Li, S.; Casey, M.; Laguerre, B.; et al. Immune Biomarkers Predictive for Disease-Free Survival with Adjuvant Sunitinib in High-Risk Locoregional Renal Cell Carcinoma: From Randomized Phase III S-TRAC Study. Clin. Cancer Res. 2018. [Google Scholar] [CrossRef]
  39. Leach, D.R.; Krummel, M.F.; Allison, J.P. Enhancement of antitumor immunity by CTLA-4 blockade. Science 1996, 271, 1734–1736. [Google Scholar] [CrossRef]
  40. Lipson, E.J.; Drake, C.G. Ipilimumab: An anti-CTLA-4 antibody for metastatic melanoma. Clin. Cancer Res. 2011, 17, 6958–6962. [Google Scholar] [CrossRef] [PubMed]
  41. Ribas, A.; Tumeh, P.C. The future of cancer therapy: Selecting patients likely to respond to PD1/L1 blockade. Clin. Cancer Res. 2014, 20, 4982–4984. [Google Scholar] [CrossRef]
  42. Rodriguez-Vida, A.; Strijbos, M.; Hutson, T. Predictive and prognostic biomarkers of targeted agents and modern immunotherapy in renal cell carcinoma. ESMO Open 2016, 1, e000013. [Google Scholar] [CrossRef] [Green Version]
  43. Motzer, R.J.; Escudier, B.; McDermott, D.F.; George, S.; Hammers, H.J.; Srinivas, S.; Tykodi, S.S.; Sosman, J.A.; Procopio, G.; Plimack, E.R.; et al. Nivolumab versus Everolimus in Advanced Renal-Cell Carcinoma. N. Engl. J. Med. 2015, 373, 1803–1813. [Google Scholar] [CrossRef] [PubMed]
  44. Gandini, S.; Massi, D.; Mandala, M. PD-L1 expression in cancer patients receiving anti PD-1/PD-L1 antibodies: A systematic review and meta-analysis. Crit. Rev. Oncol. Hematol. 2016, 100, 88–98. [Google Scholar] [CrossRef]
  45. Thompson, R.H.; Dong, H.; Kwon, E.D. Implications of B7-H1 expression in clear cell carcinoma of the kidney for prognostication and therapy. Clin. Cancer Res. 2007, 13, 709s–715s. [Google Scholar] [CrossRef] [PubMed]
  46. Jilaveanu, L.B.; Shuch, B.; Zito, C.R.; Parisi, F.; Barr, M.; Kluger, Y.; Chen, L.; Kluger, H.M. PD-L1 Expression in Clear Cell Renal Cell Carcinoma: An Analysis of Nephrectomy and Sites of Metastases. J. Cancer 2014, 5, 166–172. [Google Scholar] [CrossRef] [PubMed] [Green Version]
  47. Callea, M.; Albiges, L.; Gupta, M.; Cheng, S.C.; Genega, E.M.; Fay, A.P.; Song, J.; Carvo, I.; Bhatt, R.S.; Atkins, M.B.; et al. Differential Expression of PD-L1 between Primary and Metastatic Sites in Clear-Cell Renal Cell Carcinoma. Cancer Immunol. Res. 2015, 3, 1158–1164. [Google Scholar] [CrossRef] [PubMed] [Green Version]
  48. McDermott, D.F.; Huseni, M.A.; Atkins, M.B.; Motzer, R.J.; Rini, B.I.; Escudier, B.; Fong, L.; Joseph, R.W.; Pal, S.K.; Reeves, J.A.; et al. Clinical activity and molecular correlates of response to atezolizumab alone or in combination with bevacizumab versus sunitinib in renal cell carcinoma. Nat. Med. 2018, 24, 749–757. [Google Scholar] [CrossRef]
  49. Choueiri, T.K.; Rini, B.; Garcia, J.A.; Baz, R.C.; Abou-Jawde, R.M.; Thakkar, S.G.; Elson, P.; Mekhail, T.M.; Zhou, M.; Bukowski, R.M. Prognostic factors associated with long-term survival in previously untreated metastatic renal cell carcinoma. Ann. Oncol. 2007, 18, 249–255. [Google Scholar] [CrossRef]
  50. Noessner, E.; Brech, D.; Mendler, A.N.; Masouris, I.; Schlenker, R.; Prinz, P.U. Intratumoral alterations of dendritic-cell differentiation and CD8(+) T-cell anergy are immune escape mechanisms of clear cell renal cell carcinoma. Oncoimmunology 2012, 1, 1451–1453. [Google Scholar] [CrossRef]
  51. Perez-Gracia, J.L.; Labiano, S.; Rodriguez-Ruiz, M.E.; Sanmamed, M.F.; Melero, I. Orchestrating immune check-point blockade for cancer immunotherapy in combinations. Curr. Opin. Immunol. 2014, 27, 89–97. [Google Scholar] [CrossRef]
  52. Erlmeier, F.; Hartmann, A.; Autenrieth, M.; Wiedemann, M.; Ivanyi, P.; Steffens, S.; Weichert, W. PD-1/PD-L1 expression in chromophobe renal cell carcinoma: An immunological exception? Med. Oncol. 2016, 33, 120. [Google Scholar] [CrossRef]
Figure 1. Distribution and morphology of PD-1, PD-L1, and CTLA-4 staining.
Jcm 08 00743 g001
Figure 2. Kaplan Meier analysis: Association of PD1 expression in tumor-infiltrating mononuclear cells (TIMC) with overall survival (OS) in all RCC patients.
Jcm 08 00743 g002
Figure 3. Kaplan Meier analysis: Association of PD1 expression in TIMC with cancer-specific survival (CSS) in all RCC patients.
Jcm 08 00743 g003
Figure 4. Kaplan Meier analysis: Association of CTLA-4 expression in TIMC with OS in all RCC patients.
Jcm 08 00743 g004
Figure 5. Kaplan Meier analysis: Association of CTLA-4 expression in TIMC with CSS in all RCC patients.
Jcm 08 00743 g005
Figure 6. Kaplan Meier analysis: Association of combined PD-1 and CTLA-4 expression with OS in all RCC patients.
Jcm 08 00743 g006
Figure 7. Kaplan Meier analysis: Association of combined PD-1 and CTLA-4 expression with CSS in all RCC patients.
Jcm 08 00743 g007
Table 1. Patient characteristics and protein expression of immunological markers.
All RCCPD-1 Positive in TIMCPD-L1 Positive in Tumor CellsPD-L1 Positive in TIMCCTLA-4 ≥ 2% in TIMCPD-1 in TIMC Positive and CTLA-4 in TIMC ≥ 2%
n = 342n = 31 (9.4%)p-Valuen = 41 (12.3%)p-Valuen = 16 (4.8%)p-Valuen = 20 (6.3%)p-Valuen = 9 (2.9%)p-Value
Age median66.069 67.0 67.5 69.5 73
(range)(23–92)(40–84)0.576(28–83)0.842(46–80)0.887(46–79)0.191(57–79)0.339
Gender
female121 (35.4%)7 (5.9%) 11 (9.2%) 8 (6.7%) 4 (3.6%) 4 (3.6%)
male221 (64.6%)24 (11.3%)0.10830 (14%)0.2108 (3.7%)0.22416 (7.7%)0.1475 (2.5%)0.064
Histology
clear cell270 (78.9%)25 (9.6%) 24 (9.1%) 10 (3.8%) 15 (6.0%) 7 (2.8%)
papillary41 (12.0%)5 (12.8%)0.53613 (32.5%)<0.001 **3 (7.7%)0.2653 (7.9%)0.6502 (5.4%)0.037
chromophobe24 (7.0%)0 (0%)0.1121 (4.2%)0.4111 (4.2%)0.9290 (0%)0.2200 (0%)0.095
other7 (2%)1 (14.3%)0.6823 (42.9%)0.003 *2 (28.6%)0.002 *2 (28.6%)0.017 *0 (0%)0.088
Grade
G143 (12.6%)2 (5.0%) 3 (7.5%) 1 (2.5%) 2 (5.1%) 2 (5.1%)
G2219 (64.2%)13 (6.1%)0.78223 (10.6%)0.5479 (4.2%)0.61612 (5.9%)0.8594 (2.0%)0.862
G379 (23.2%)16 (20.8%)<0.001 **15 (19.5%)0.029*6 (7.8%)0.1666 (8.0%)0.4813 (4.1%)0.005 *
Stage
pT1 and pT2247 (74.6%)18 (7.6%) 29 (12.1%) 12 (5.0%) 12 (5.2%) 4 (1.8%)
pT3 and pT484 (25.4%)12 (14.3%)0.07110 (11.9%)0.9564 (4.8%)0.9428 (10.0%)0.1355 (6.3%)0.037 *
Metastases
non-metastatic262 (76.6%)18 (7.2%) 37 (14.4%) 15 (5.8%) 12 (4.9%) 5 (2.1%)
primary metastatic37 (10.8%)8 (21.6%)0.007*3 (8.1%)0.4820 (0%)0.1616 (16.7%)0.006 **3 (8.3%)<0.001 **
secondary metastatic43 (12.6%)5 (11.6%)0.3201 (2.4%)0.030 *1 (2.4%)0.3722 (4.9%)0.9871 (2.4%)0.620
ECOG
0209 (73.6%)17 (8.3%) 28 (13.7%) 11 (5.4%) 11 (5.7%) 3 (1.6%)
>075 (26.4%)10 (13.9%)0.1749 (12.2%)0.7364 (5.4%)0.9976 (8.3%)0.4324 (5.7%)0.186
Survival
OS250 (73.1%)18 (58.1%)0.044 *29 (70.7%)0.68612 (75%)0.89512 (60%)0.1734 (44%)0.050 *
CSS307 (89.8%)26 (83.9%)0.23337 (90.2%)0.92416 (100%)0.17516 (80%)0.1426 (66%)0.055
* Correlation significant at 0.05 level (2-tailed); ** correlation significant with Bonferroni corrections al 0.001 level (2-tailed).
Table 2. Non-parametric correlation of PD-1, PD-L1, and CTLA-4 expression.
PD-1 Positive in TIMCPD-L1 Positive in Tumor CellsPD-L1 Positive in TIMCCTLA-4 ≥2 % in TIMCPD-1 in TIMC Positive and CTLA-4 in TIMC ≥ 2%
Pearson CorrelationPD-1 positive in TIMC10.171 **0.0300.339 **0.845 **
Significance (p-value) 0.002 **0.588<0.001 **<0.001 **
Pearson CorrelationPD-L1 positive in tumor cells0.171 **10.0440.281 **0.273 **
Significance (p-value)0.002 ** 0.423<0.001 **<0.001 **
Pearson CorrelationPD-L1 positive in TIMC0.0300.04410.131 *0.106
Significance (p-value)0.5880.423 0.020 *0.063
Pearson CorrelationCTLA-4 ≥ 2% in TIMC0.339 **0.281 **0.131 *10.789 **
Significance (p-value)<0.001 **<0.001 **0.020 * <0.001 **
Pearson CorrelationPD-1 in TIMC positive and CTLA-4 in TIMC ≥ 2%0.845 **0.273 **0.1060.789 **1
Significance (p-value)<0.001 **<0.001 **0.063<0.001 **
* Correlation is significant at 0.05 level (2-tailed); ** correlation significant with Bonferroni corrections at 0.002 level (2-tailed).
Table 3. Survival analysis (Log rank test) in all renal cell carcinoma (RCC) patients.
All RCCEstimated Mean OS (months)Estimated Mean CSS (months)
neg.pos.p-Valueneg.pos.p-Value
PD-1 TIMC109.70755.7530.002 **142.07184.5760.072
PD-L1 TU108.92386.6610.694140.353105.1480.964
PD-L1 TIMC106.277119.9320.649No cancer specific death
CTLA-4107.75884.1420.013 *140.590125.5340.019 *
PD-1 + CTLA-4108.77929.7780.001 **142.38839.3330.001 **
CD3103.920112.4130.628142.116138.0450.390
** Correlation is significant at 0.01 level (2-tailed); * correlation is significant at 0.05 level (2-tailed). neg. negative; pos. positive.
Table 4. Survival analysis (Log rank test) in clear cell renal cell carcinomas (ccRCC) patients.
ccRCCEstimated Mean OS (months)Estimated Mean CSS (months)
neg.pos.p-Valueneg.pos.p-Value
PD-1 TIMC108.79656.3040.009 **139.56184.6900.180
PD-L1 TU108.89486.8410.691138.745102.3060.883
PD-L1 TIMC105.603121.3500.484No cancer specific death
CTLA-4107.00586.9240.020 *138.789113.5420.004 **
PD-1 + CTLA-4107.77824.857<0.001 **139.73734.000<0.001 **
CD3102.642111.8600.602138.746137.0610.712
** Correlation is significant at 0.01 level (2-tailed); * correlation is significant at 0.05 level (2-tailed).
Table 5. Survival analysis (Log rank test) in the no primary metastases subgroup.
No Primary MetastasesEstimated Mean OS (months)Estimated Mean CSS (months)
neg.pos.p-Valueneg.pos.p-Value
PD-1 TIMC116.19065.9370.058147.97192.3910.329
PD-L1 TU115.84892.8120.737146.010110.6740.738
PD-L1 TIMC113.784119.9321.000No cancer specific death
CTLA-4114.78194.8930.041 *146.821125.2730.001 **
PD-1 + CTLA-4116.21632.000<0.001 **148.70532.000<0.001 **
CD3108.641124.2150.165146.946146.1860.979
** Correlation is significant at 0.01 level (2-tailed); * correlation is significant at 0.05 level (2-tailed).
Table 6. Multivariate Cox regression analysis: Association of clinical parameters and CTLA-4 expression with OS or CSS in all RCC patients.
All RCCOSCSS
Hazard RatioRangep-ValueHazard RatioRangep-Value
CTLA-42.8381.248–6.4510.013 *3.7261.011–13.7270.048 *
Age > 65 years2.5011.436–4.3560.001 **1.8180.736–4.4870.195
Gender male1.3360.764–2.3350.3090.7970.333–1.9120.612
Stage > pT23.4502.119–5.617<0.001 **2.5201.096–5.7910.030 *
Grade = G32.8281.724–4.641<0.001 **9.5873.689–24.931<0.001 **
ECOG > 01.5760.952–2.6080.0770.4772.701–1.1350.775
** Correlation is significant at 0.01 level (2-tailed); * correlation is significant at 0.05 level (2-tailed).
Table 7. Multivariate Cox regression analysis: Association of clinical parameters and CTLA-4 expression with OS or CSS in the ccRCC patients.
ccRCCOSCSS
Hazard RatioRangep-ValueHazard RatioRangep-Value
CTLA-44.0591.506–10.9400.006 **8.1612.003–33.260.003 *
Age > 65 years2.1321.182–3.8460.012 *2.1620.843–5.5460.109
Gender male1.2200.662–2.2490.5240.7530.313–1.810.526
Stage > pT23.0261.786–5.301<0.001 **1.5680.623–3.9440.339
Grade = G33.1321.796–5.462<0.001 **11.3414.108–30.676<0.001 **
ECOG > 01.6300.928–2.8640.089 *1.5450.612–3.8990.357
** Correlation is significant at 0.01 level (2-tailed); * correlation is significant at 0.05 level (2-tailed).
Table 8. Multivariate Cox regression analysis: Association of clinical parameters and CTLA-4 expression with OS or CSS in the no primary metastases subgroup.
No Primary MetastasesOSCSS
Hazard RatioRangep-ValueHazard RatioRangep-Value
CTLA-43.3701.144–9.9240.028 *7.3511.337–40.420.022 *
Age > 65 years2.6431.395–5.0080.003 **1.6000.437–5.8610.478
Gender male1.7940.906–3.5540.0940.9830.236–4.1040.981
Stage > pT24.1152.247–7.537<0.001 **2.4570.681–8.8680.170
Grade = G31.6050.854–3.0150.1426.2721.71–23.010.006 **
ECOG > 02.0711.135–3.7840.018 *1.2610.34–4.6730.729
** Correlation is significant at 0.01 level (2-tailed); * correlation is significant at 0.05 level (2-tailed).

