Retinal Nerve Fiber Layer Thickness and Higher Relapse Frequency May Predict Poor Recovery after Optic Neuritis in MS Patients

 , , ,
, , ,  , ,
, ,
Abstract
:1. Introduction
2. Materials and Methods
2.1. Study Population
2.2. Clinical Assessment
2.3. Ophthalmological Evaluation
2.4. Statistical Analysis
3. Results
3.1. Clinical and Demographic Characteristics
3.2. Ophthalmological Evaluation and OCT Parameters
4. Discussion
5. Conclusions
Author Contributions
Funding
Conflicts of Interest
References
- Dutta, R.; Trapp, B.D. Mechanisms of neuronal dysfunction and degeneration in multiple sclerosis. Prog. Neurobiol. 2011, 93, 1–12. [Google Scholar] [CrossRef] [PubMed]
- Tallantyre, E.C.; Bo, L.; Al-Rawashdeh, O.; Owens, T.; Polman, C.H.; Lowe, J.S.; Evangelou, N. Clinico-pathological evidence that axonal loss underlies disability in progressive multiple sclerosis. Mult. Scler. J. 2010, 16, 406–411. [Google Scholar] [CrossRef] [PubMed]
- Katz, B. The dyschromatopsia of optic neuritis: A descriptive analysis of data from the optic neuritis treatment trial. Trans. Am. Ophthalmol. Soc. 1995, 93, 685–708. [Google Scholar] [PubMed]
- Castro, S.M.; Damasceno, A.; Damasceno, B.P.; Vasconcellos, J.P.; Reis, F.; Iyeyasu, J.N.; Carvalho, K.M. Visual pathway abnormalities were found in most multiple sclerosis patients despite history of previous optic neuritis. Arq. Neuropsiquiatr. 2013, 71, 437–441. [Google Scholar] [CrossRef] [PubMed]
- Shaygannejad, V.; Golabchi, K.; Dehghani, A.; Ashtari, F.; Haghighi, S.; Mirzendehdel, M.; Ghasemi, M. Color blindness among multiple sclerosis patients in Isfahan. J. Res. Med. Sci. 2012, 17, 254–257. [Google Scholar]
- Garrett, B.; Dmytriw, A.A.; Maxner, C. Acute optic neuritis in multiple sclerosis. CMAJ 2016, 188, E199. [Google Scholar] [CrossRef]
- Green, A.J.; McQuaid, S.; Hauser, S.L.; Allen, I.V.; Lyness, R. Ocular pathology in multiple sclerosis: Retinal atrophy and inflammation irrespective of disease duration. Brain 2010, 133, 1591–1601. [Google Scholar] [CrossRef]
- Syc, S.B.; Saidha, S.; Newsome, S.D.; Ratchford, J.N.; Levy, M.; Ford, E.; Crainiceanu, C.M.; Durbin, M.K.; Oakley, J.D.; Meyer, S.A.; et al. Optical coherence tomography segmentation reveals ganglion cell layer pathology after optic neuritis. Brain 2012, 135, 521–533. [Google Scholar] [CrossRef]
- Sadiq, M.N.; Wali, U.; Jaccob, P.C. Retrobulbar acute optic neuritis. J. Coll. Physicians Surg. Pak. 2007, 17, 435–437. [Google Scholar]
- Falavarjani, K.G.; Sanjari, M.S. Detection of optic disc oedema using optical coherence tomography. Br. J. Ophthalmol. 2012, 96, 1355–1357. [Google Scholar] [CrossRef]
- Galetta, K.M.; Calabresi, P.A.; Frohman, E.M.; Balcer, L.J. Optical coherence tomography (OCT): Imaging the visual pathway as a model for neurodegeneration. Neurotherapeutics 2011, 8, 117–132. [Google Scholar] [CrossRef] [PubMed]
- Lamirel, C.; Newman, N.J.; Biousse, V. Optical coherence tomography (OCT) in optic neuritis and multiple sclerosis. Rev. Neurol. 2010, 166, 978–986. [Google Scholar] [CrossRef] [PubMed]
- Martinez-Lapiscina, E.H.; Sanchez-Dalmau, B.; Fraga-Pumar, E.; Ortiz-Perez, S.; Tercero-Uribe, A.I.; Torres-Torres, R.; Villoslada, P. The visual pathway as a model to understand brain damage in multiple sclerosis. Mult. Scler. J. 2014, 20, 1678–1685. [Google Scholar] [CrossRef] [PubMed]
- Trip, S.A.; Schlottmann, P.G.; Jones, S.J.; Altmann, D.R.; Garway-Heath, D.F.; Thompson, A.J.; Plant, G.T.; Miller, D.H. Retinal nerve fiber layer axonal loss and visual dysfunction in optic neuritis. Ann. Neurol. 2005, 58, 383–391. [Google Scholar] [CrossRef]
- Balcer, L.J.; Miller, D.H.; Reingold, S.C.; Cohen, J.A. Vision and vision-related outcome measures in multiple sclerosis. Brain 2015, 138, 11–27. [Google Scholar] [CrossRef]
- Polman, C.H.; Reingold, S.C.; Banwell, B.; Clanet, M.; Cohen, J.A.; Filippi, M.; Fujihara, K.; Havrdova, E.; Hutchinson, M.; Kappos, L.; et al. Diagnostic criteria for multiple sclerosis: 2010 revisions to the McDonald criteria. Ann. Neurol. 2011, 69, 292–302. [Google Scholar] [CrossRef]
- Ropper, A.H.; Joshua, M.A.S.; Klein, P. Adams and Victor’s Principles of Neurology, 10th ed.; McGraw-Hill Education: New York, NY, USA, 2014. [Google Scholar]
- The clinical profile of optic neuritis. Experience of the Optic Neuritis Treatment Trial. Optic Neuritis Study Group. Arch. Ophthalmol. 1991, 109, 1673–1678. [Google Scholar] [CrossRef]
- Kurtzke, J.F. Rating neurologic impairment in multiple sclerosis: An expanded disability status scale (EDSS). Neurology 1983, 33, 1444–1452. [Google Scholar] [CrossRef]
- Rosser, D.A.; Laidlaw, D.A.; Murdoch, I.E. The development of a “reduced logMAR” visual acuity chart for use in routine clinical practice. Br. J. Ophthalmol. 2001, 85, 432–436. [Google Scholar] [CrossRef]
- Bradley, W.G.; Whitty, C.W. Acute optic neuritis: Its clinical features and their relation to prognosis for recovery of vision. J. Neurol. Neurosurg. Psychiatry 1967, 30, 531–538. [Google Scholar] [CrossRef]
- Tewarie, P.; Balk, L.; Costello, F.; Green, A.; Martin, R.; Schippling, S.; Petzold, A. The OSCAR-IB Consensus Criteria for Retinal OCT Quality Assessment. PLoS ONE 2012, 7, e34823. [Google Scholar] [CrossRef] [PubMed]
- Cruz-Herranz, A.; Balk, L.J.; Oberwahrenbrock, T.; Saidha, S.; Martinez-Lapiscina, E.H.; Lagreze, W.A.; Schuman, J.S.; Villoslada, P.; Calabresi, P.; Balcer, L.; et al. The APOSTEL recommendations for reporting quantitative optical coherence tomography studies. Neurology 2016, 86, 2303–2309. [Google Scholar] [CrossRef] [PubMed]
- Boston, R.C.; Sumner, A.E. STATA: A statistical analysis system for examining biomedical data. Adv. Exp. Med. Biol. 2003, 537, 353–369. [Google Scholar] [PubMed]
- Yau, G.S.; Lee, J.W.; Lau, P.P.; Tam, V.T.; Wong, W.W.; Yuen, C.Y. Prospective study on retinal nerve fibre layer thickness changes in isolated unilateral retrobulbar optic neuritis. Sci. World J. 2013, 2013, 694613. [Google Scholar] [CrossRef] [PubMed]
- Malik, A.; Zakri, R.H.; Sheikh, Z.; Shalchi, Z.; Zia, R.; Schultz, D.J. Concurrent macular oedema and optic neuritis in Crohn’s disease with varied response to steroids. BMJ Case Rep. 2010, 2010, bcr1020092394. [Google Scholar] [CrossRef] [PubMed]
- Saidha, S.; Sotirchos, E.S.; Ibrahim, M.A.; Crainiceanu, C.M.; Gelfand, J.M.; Sepah, Y.J.; Ratchford, J.N.; Oh, J.; Seigo, M.A.; Newsome, S.D.; et al. Microcystic macular oedema, thickness of the inner nuclear layer of the retina, and disease characteristics in multiple sclerosis: A retrospective study. Lancet Neurol. 2012, 11, 963–972. [Google Scholar] [CrossRef]
- Du, Y.; Li, K.; Yang, J.; Xu, X.; Li, J.J.; Zhou, R.W.; Zhang, Y.; Jiang, B.L.; He, J.F. Disc swelling and mild initial visual acuity loss predict a better short-term visual acuity outcome in bilateral acute optic neuritis. J. Clin. Neurosci. 2012, 19, 1380–1382. [Google Scholar] [CrossRef]
- Kallenbach, K.; Simonsen, H.; Sander, B.; Wanscher, B.; Larsson, H.; Larsen, M.; Frederiksen, J.L. Retinal nerve fiber layer thickness is associated with lesion length in acute optic neuritis. Neurology 2010, 74, 252–258. [Google Scholar] [CrossRef]
- Tawse, K.L.; Hedges, T.R., 3rd; Gobuty, M.; Mendoza-Santiesteban, C. Optical coherence tomography shows retinal abnormalities associated with optic nerve disease. Br. J. Ophthalmol. 2014, 98 (Suppl. S2), ii30–ii33. [Google Scholar] [CrossRef]
- Gabilondo, I.; Martinez-Lapiscina, E.H.; Fraga-Pumar, E.; Ortiz-Perez, S.; Torres-Torres, R.; Andorra, M.; Llufriu, S.; Zubizarreta, I.; Saiz, A.; Sanchez-Dalmau, B.; et al. Dynamics of retinal injury after acute optic neuritis. Ann. Neurol. 2015, 77, 517–528. [Google Scholar] [CrossRef]
- Ratchford, J.N.; Saidha, S.; Sotirchos, E.S.; Oh, J.A.; Seigo, M.A.; Eckstein, C.; Durbin, M.K.; Oakley, J.D.; Meyer, S.A.; Conger, A.; et al. Active MS is associated with accelerated retinal ganglion cell/inner plexiform layer thinning. Neurology 2013, 80, 47–54. [Google Scholar] [CrossRef] [PubMed]
- Huang-Link, Y.M.; Al-Hawasi, A.; Lindehammar, H. Acute optic neuritis: Retinal ganglion cell loss precedes retinal nerve fiber thinning. Neurol. Sci. 2015, 36, 617–620. [Google Scholar] [CrossRef] [PubMed]
- Klistorner, A.; Arvind, H.; Nguyen, T.; Garrick, R.; Paine, M.; Graham, S.; O’Day, J.; Grigg, J.; Billson, F.; Yiannikas, C. Axonal loss and myelin in early ON loss in postacute optic neuritis. Ann. Neurol. 2008, 64, 325–331. [Google Scholar] [CrossRef] [PubMed]
- Madill, S.A.; Riordan-Eva, P. Disorders of the anterior visual pathways. J. Neurol. Neurosurg. Psychiatry 2004, 75 (Suppl. S4), iv12–iv19. [Google Scholar] [CrossRef] [PubMed] [Green Version]
- Bringmann, A.; Wiedemann, P. Muller glial cells in retinal disease. Ophthalmologica 2012, 227, 1–19. [Google Scholar] [CrossRef] [PubMed]
- Pannicke, T.; Biedermann, B.; Uckermann, O.; Weick, M.; Bringmann, A.; Wolf, S.; Wiedemann, P.; Habermann, G.; Buse, E.; Reichenbach, A. Physiological properties of retinal Muller glial cells from the cynomolgus monkey, Macaca fascicularis—A comparison to human Muller cells. Vis. Res. 2005, 45, 1781–1791. [Google Scholar] [CrossRef] [PubMed] [Green Version]
- Lujan, B.J.; Horton, J.C. Microcysts in the inner nuclear layer from optic atrophy are caused by retrograde trans-synaptic degeneration combined with vitreous traction on the retinal surface. Brain 2013, 136, e260. [Google Scholar] [CrossRef] [Green Version]
- Balk, L.J.; Coric, D.; Knier, B.; Zimmermann, H.G.; Behbehani, R.; Alroughani, R.; Martinez-Lapiscina, E.H.; Brandt, A.U.; Sanchez-Dalmau, B.; Vidal-Jordana, A.; et al. Retinal inner nuclear layer volume reflects inflammatory disease activity in multiple sclerosis; a longitudinal OCT study. Mult. Scler. J. Exp. Transl. Clin. 2019, 5, 2055217319871582. [Google Scholar] [CrossRef] [Green Version]
- Serbecic, N.; Beutelspacher, S.C.; Geitzenauer, W.; Kircher, K.; Lassmann, H.; Reitner, A.; Khan, A.; Schmidt-Erfurth, U. RNFL thickness in MS-associated acute optic neuritis using SD-OCT: Critical interpretation and limitations. Acta Ophthalmol. 2011, 89, e451–e460. [Google Scholar] [CrossRef]
- Hanson, J.V.; Lukas, S.C.; Pless, M.; Schippling, S. Optical Coherence Tomography in Multiple Sclerosis. Semin. Neurol. 2016, 36, 177–184. [Google Scholar] [CrossRef]
- Huang-Link, Y.M.; Fredrikson, M.; Link, H. Benign Multiple Sclerosis is Associated with Reduced Thinning of the Retinal Nerve Fiber and Ganglion Cell Layers in Non-Optic-Neuritis Eyes. J. Clin. Neurol. 2015, 11, 241–247. [Google Scholar] [CrossRef] [PubMed] [Green Version]
- Narayanan, D.; Cheng, H.; Bonem, K.N.; Saenz, R.; Tang, R.A.; Frishman, L.J. Tracking changes over time in retinal nerve fiber layer and ganglion cell-inner plexiform layer thickness in multiple sclerosis. Mult. Scler. J. 2014, 20, 1331–1341. [Google Scholar] [CrossRef] [PubMed] [Green Version]
- Costello, F. Evaluating the use of optical coherence tomography in optic neuritis. Mult. Scler. Int. 2011, 2011, 148394. [Google Scholar] [CrossRef] [PubMed]
- Medana, I.M.; Esiri, M.M. Axonal damage: A key predictor of outcome in human CNS diseases. Brain 2003, 126, 515–530. [Google Scholar] [CrossRef] [PubMed] [Green Version]
- Behbehani, R.; Al-Moosa, A.; Sriraman, D.; Alroughani, R. Ganglion cell analysis in acute optic neuritis. Mult. Scler. Relat. Disord. 2016, 5, 66–69. [Google Scholar] [CrossRef] [PubMed]
- Britze, J.; Pihl-Jensen, G.; Frederiksen, J.L. Retinal ganglion cell analysis in multiple sclerosis and optic neuritis: A systematic review and meta-analysis. J. Neurol. 2017, 264, 1837–1853. [Google Scholar] [CrossRef]
- Al-Louzi, O.A.; Bhargava, P.; Newsome, S.D.; Balcer, L.J.; Frohman, E.M.; Crainiceanu, C.; Calabresi, P.A.; Saidha, S. Outer retinal changes following acute optic neuritis. Mult. Scler. J. 2016, 22, 362–372. [Google Scholar] [CrossRef] [Green Version]
- Costello, F.; Pan, Y.I.; Yeh, E.A.; Hodge, W.; Burton, J.M.; Kardon, R. The temporal evolution of structural and functional measures after acute optic neuritis. J. Neurol. Neurosurg. Psychiatry 2015, 86, 1369–1373. [Google Scholar] [CrossRef]
- Nolan, R.C.; Galetta, S.L.; Frohman, T.C.; Frohman, E.M.; Calabresi, P.A.; Castrillo-Viguera, C.; Cadavid, D.; Balcer, L.J. Optimal Intereye Difference Thresholds in Retinal Nerve Fiber Layer Thickness for Predicting a Unilateral Optic Nerve Lesion in Multiple Sclerosis. J. Neuroophthalmol. 2018, 38, 451–458. [Google Scholar] [CrossRef]
- Nolan-Kenney, R.C.; Liu, M.; Akhand, O.; Calabresi, P.A.; Paul, F.; Petzold, A.; Balk, L.; Brandt, A.U.; Martinez-Lapiscina, E.H.; Saidha, S.; et al. Optimal Intereye Difference Thresholds by Optical Coherence Tomography in Multiple Sclerosis: An International Study. Ann. Neurol. 2019. [Google Scholar] [CrossRef]
- Balk, L.J.; Killestein, J.; Polman, C.H.; Uitdehaag, B.M.; Petzold, A. Microcystic macular oedema confirmed, but not specific for multiple sclerosis. Brain 2012, 135, e227. [Google Scholar] [CrossRef] [PubMed] [Green Version]
- Kaufhold, F.; Zimmermann, H.; Schneider, E.; Ruprecht, K.; Paul, F.; Oberwahrenbrock, T.; Brandt, A.U. Optic neuritis is associated with inner nuclear layer thickening and microcystic macular edema independently of multiple sclerosis. PLoS ONE 2013, 8, e71145. [Google Scholar] [CrossRef]
- Costello, F.; Coupland, S.; Hodge, W.; Lorello, G.R.; Koroluk, J.; Pan, Y.I.; Freedman, M.S.; Zackon, D.H.; Kardon, R.H. Quantifying axonal loss after optic neuritis with optical coherence tomography. Ann. Neurol. 2006, 59, 963–969. [Google Scholar] [CrossRef] [PubMed]
- Balk, L.J.; Cruz-Herranz, A.; Albrecht, P.; Arnow, S.; Gelfand, J.M.; Tewarie, P.; Killestein, J.; Uitdehaag, B.M.; Petzold, A.; Green, A.J. Timing of retinal neuronal and axonal loss in MS: A longitudinal OCT study. J. Neurol. 2016, 263, 1323–1331. [Google Scholar] [CrossRef] [Green Version]
- Birkeldh, U.; Manouchehrinia, A.; Hietala, M.A.; Hillert, J.; Olsson, T.; Piehl, F.; Kockum, I.; Brundin, L.; Zahavi, O.; Wahlberg-Ramsay, M.; et al. Retinal nerve fiber layer thickness associates with cognitive impairment and physical disability in multiple sclerosis. Mult. Scler. Relat. Disord. 2019, 36, 101414. [Google Scholar] [CrossRef]
- Cellerino, M.; Cordano, C.; Boffa, G.; Bommarito, G.; Petracca, M.; Sbragia, E.; Novi, G.; Lapucci, C.; Capello, E.; Uccelli, A.; et al. Relationship between retinal inner nuclear layer, age, and disease activity in progressive MS. Neurol. Neuroimmunol. Neuroinflamm. 2019, 6. [Google Scholar] [CrossRef] [Green Version]


| Total (90) | |
|---|---|
| Female (%) | 60 (66.7%) |
| Age (mean ± SD) | 35.6 ± 10.5 |
| Disease Duration (months; mean ± SD) | 91.9 ± 85.2 |
| Total N of relapses (mean ± SD) | 5.3 ± 4.3 |
| EDSS during relapse (mean ± SD) | 3.1 ± 1.6 |
| EDSS postrelapse (mean ± SD) | 2.5 ± 1.8 |
| ΔEDSS (mean ± SD) | 0.45 ± 0.06 |
| Duration of visual symptoms (hours; mean ± SD) | 35.9 ± 4.8 |
| N patient recovered (%) | 47 (52.2%) |
| ON Eyes | nON Eyes | p-Value | |
|---|---|---|---|
| RNFL (µm) | 129.1 ± 19.5 | 100.5 ± 10.1 | <0.001 |
| Superior sector (µm) | 141.6 ± 12.6 | 110.3 ± 8.1 | <0.001 |
| Inferior sector (µm) | 136.3 ± 9.0 | 115.3 ± 7.9 | <0.001 |
| Nasal sector (µm) | 81.6 ± 8.9 | 78.6 ± 10.3 | <0.05 |
| Temporal sector (µm) | 86.3 ± 9.4 | 75.5 ± 8.4 | <0.05 |
| Macular Volume (µm) | 9.3 ± 0.8 | 9.5 ± 0.6 | ns |
| Foveal Thickness (µm) | 243.4 ± 15.0 | 245.8 ± 16.3 | ns |
| Ganglional Cell (µm) | 80.4 ± 8.8 | 86.8 ± 11.6 | <0.05 |
| LogMAR VA | 0.42 ± 0.23 | 0.05 ± 0.05 | <0.001 |
| LCSLA charts 100% | 19.9 ± 9.9 | 36.5 ± 5.2 | <0.001 |
| LCSLA charts 2.5% | 9.1 ± 6.8 | 26.4 ± 10.2 | <0.001 |
| LCSLA charts 1.25 | 4.6 ± 5.7 | 19.6 ± 8.4 | <0.001 |
| ON | nON | ||||
|---|---|---|---|---|---|
| T0 | T1 | T0 | T1 | p-Value | |
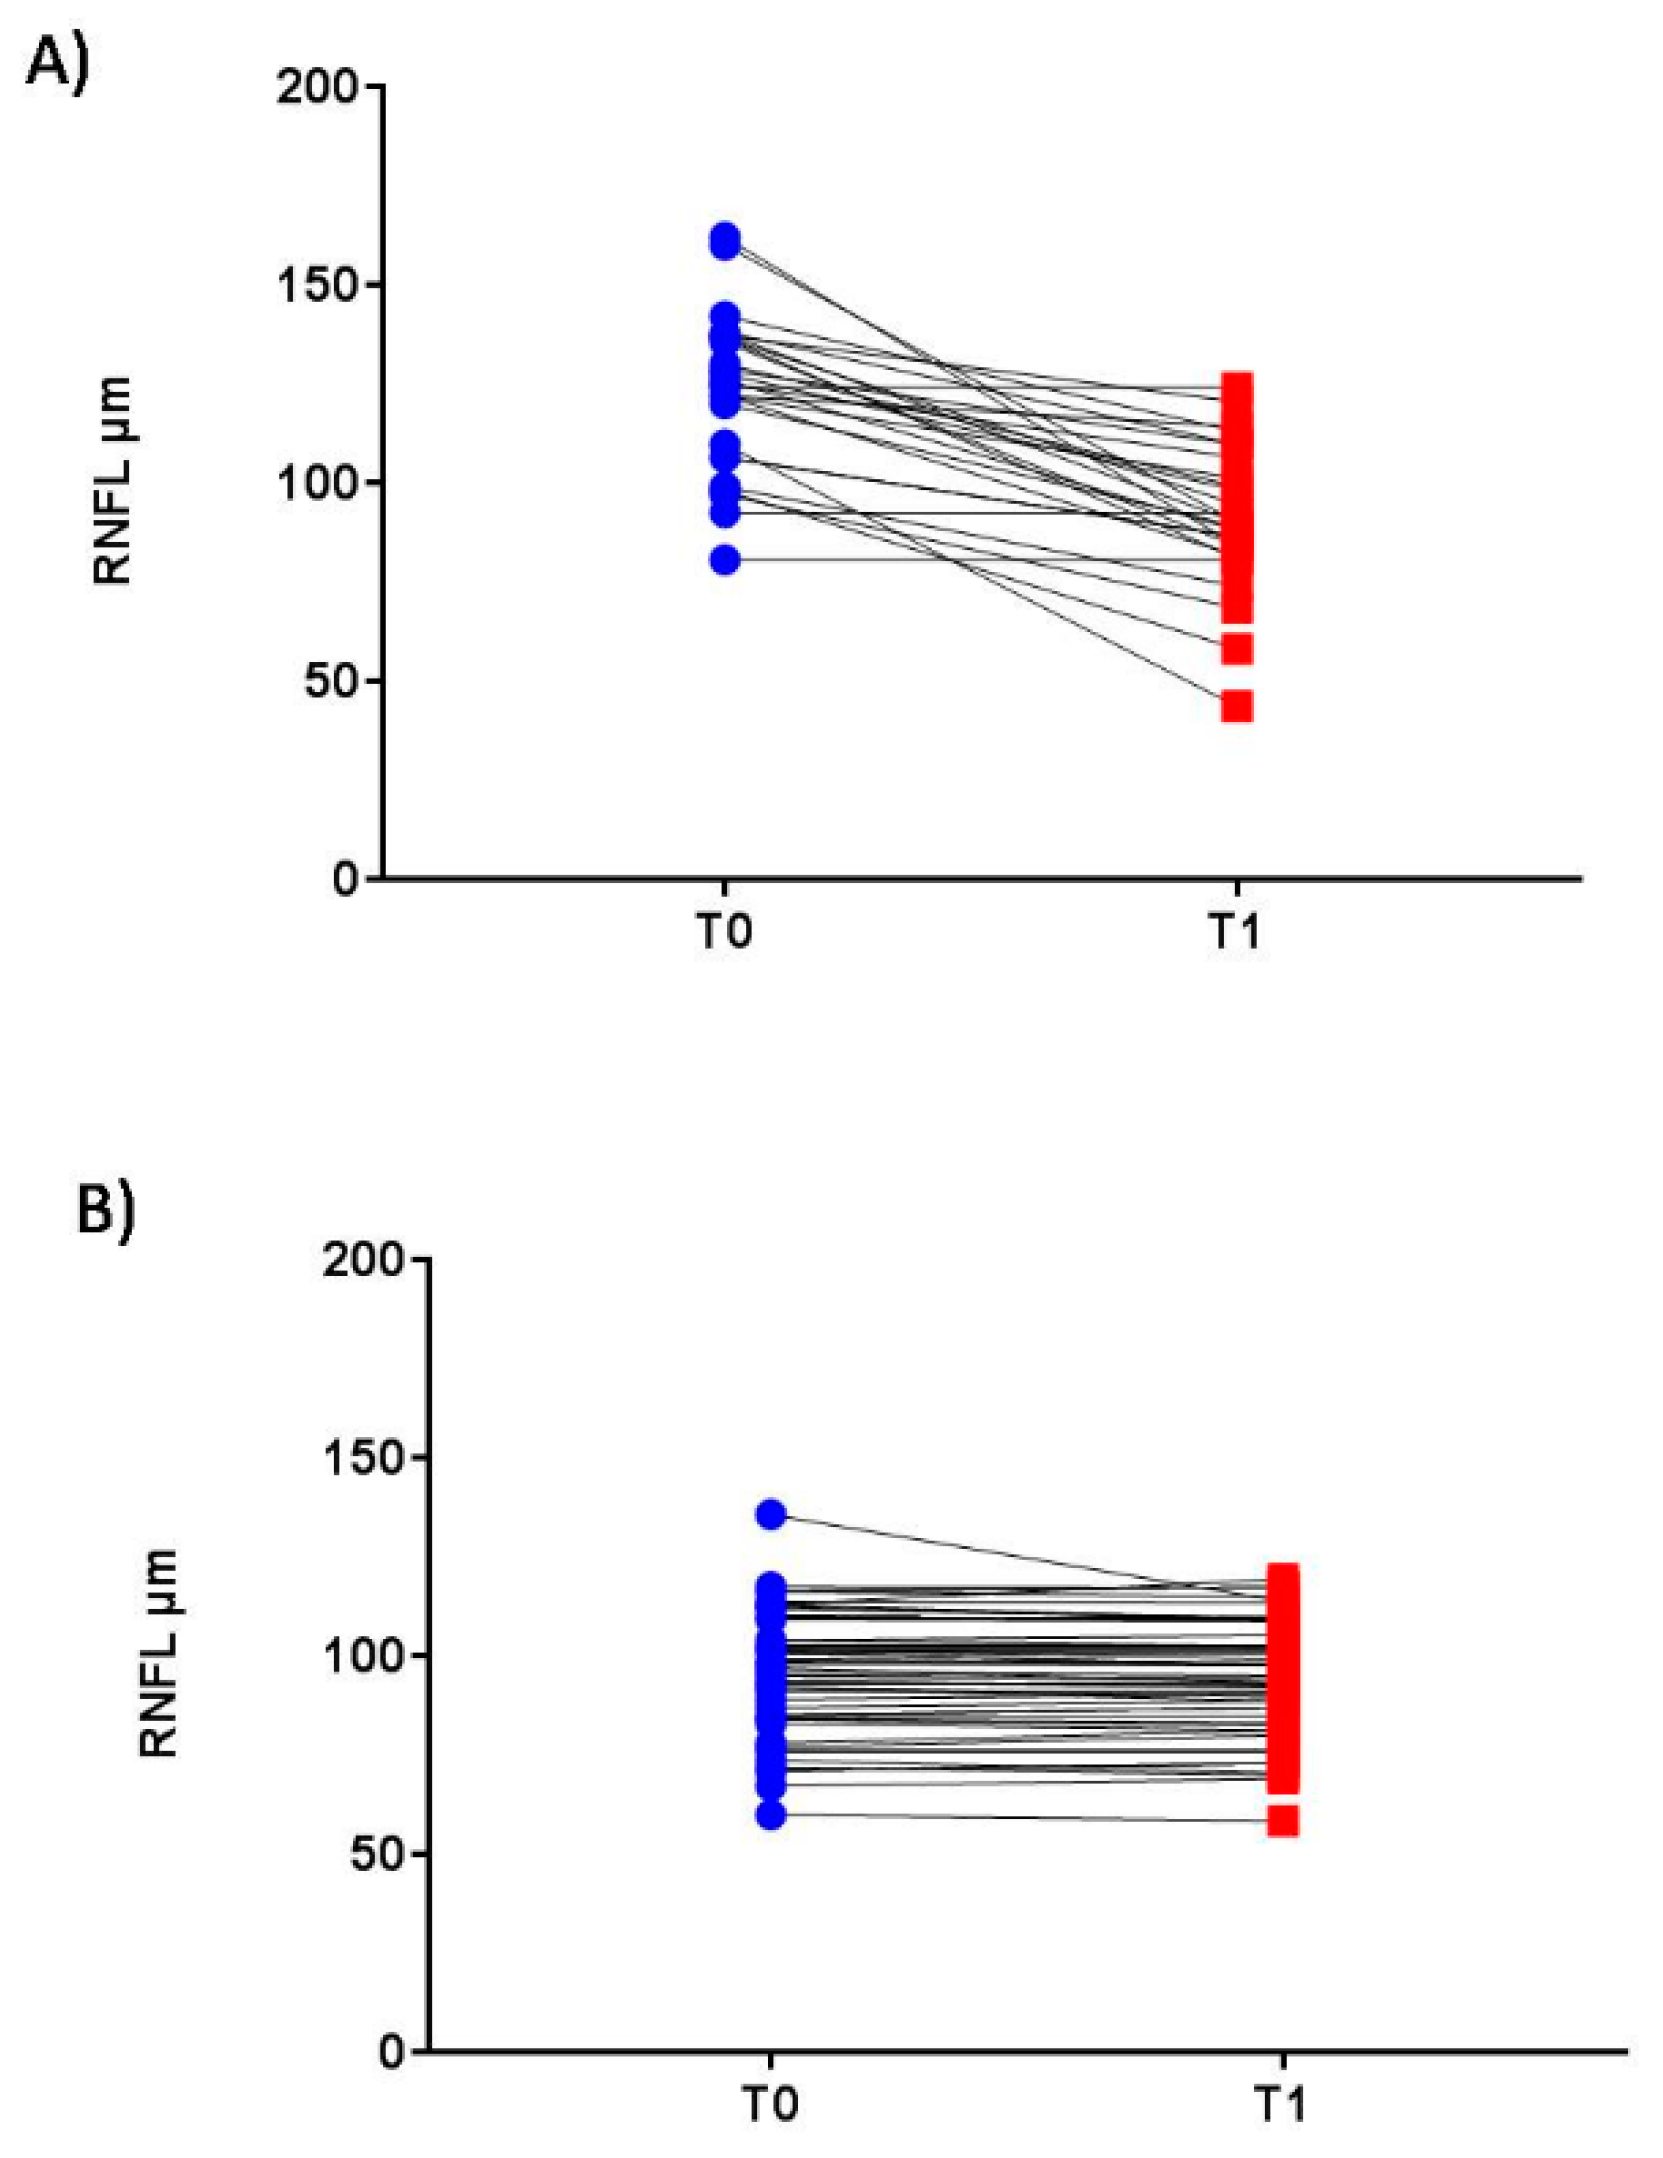
| RNFL (µm) | 129.1 ± 19.5 | 91.6 ± 20.2 | 100.5 ± 10.1 | 93.1 ± 15.2 | * < 0.001 |
| # < 0.05 | |||||
| Superior sector (µm) | 141.6 ± 12.6 | 104.9 ± 8.9 | 110.3 ± 8.1 | 109.6 ± 7.3 | * < 0.001 |
| Inferior sector (µm) | 136.3 ± 9.0 | 110.6 ± 10.6 | 115.3 ± 7.9 | 114.9 ± 11.6 | * < 0.001 |
| Nasal sector (µm) | 81.6 ± 8.9 | 70.9 ± 9.9 | 78.6 ± 10.3 | 70.6 ± 12.3 | *# < 0.05 |
| Temporal sector (µm) | 86.3 ± 9.4 | 71.5 ± 10.3 | 75.5 ± 8.4 | 68.6 ± 6.7 | *# < 0.05 |
| Macular Volume (µm) | 9.3 ± 0.8 | 8.6 ± 0.7 | 9.5 ± 0.6 | 9.3 ± 0.5 | * < 0.05 |
| Foveal Thickness (µm) | 243.4 ± 15.0 | 240.4 ± 13.4 | 245.8 ± 16.3 | 243.9 ± 10.8 | ns |
| Ganglional Cell (µm) | 80.4 ± 8.8 | 73.8 ± 11.6 | 86.8 ± 11.6 | 82.4 ± 8.1 | *# < 0.05 |
| LogMAR VA | 0.42 ± 0.23 | 0.05 ± 0.02 | 0.05 ± 0.05 | 0.03 ± 0.05 | * < 0.001 |
| LCSLA charts 100% | 19.9 ± 9.9 | 40.4 ± 8.5 | 36.5 ± 5.2 | 36.0 ± 6.2 | * < 0.001 |
| LCSLA charts 2.5% | 9.1 ± 6.8 | 29.5 ± 11.2 | 26.4 ± 10.2 | 26.1 ± 11.8 | * < 0.001 |
| LCSLA charts 1.25 | 4.6 ± 5.7 | 21.0 ± 9.1 | 19.6 ± 8.4 | 18.5 ± 8.7 | * < 0.001 |
| T0 | T1 | P Value | |
|---|---|---|---|
| RNFL | −29.6 | 5.5 | <0.01 |
| Ganglional Cell Layer | 5.4 | 11.4 | <0.01 |
| Macular Volume | 0.2 | 0.7 | ns |
| Foveal Thickness | 2.4 | 3.5 | ns |
| LogMAR VA | −1.6 | −0.4 | <0.05 |
© 2019 by the authors. Licensee MDPI, Basel, Switzerland. This article is an open access article distributed under the terms and conditions of the Creative Commons Attribution (CC BY) license (http://creativecommons.org/licenses/by/4.0/).
Share and Cite
Chisari, C.G.; Toro, M.D.; Cimino, V.; Rejdak, R.; Luca, M.; Rapisarda, L.; Avitabile, T.; Posarelli, C.; Rejdak, K.; Reibaldi, M.; et al. Retinal Nerve Fiber Layer Thickness and Higher Relapse Frequency May Predict Poor Recovery after Optic Neuritis in MS Patients. J. Clin. Med. 2019, 8, 2022. https://doi.org/10.3390/jcm8112022
Chisari CG, Toro MD, Cimino V, Rejdak R, Luca M, Rapisarda L, Avitabile T, Posarelli C, Rejdak K, Reibaldi M, et al. Retinal Nerve Fiber Layer Thickness and Higher Relapse Frequency May Predict Poor Recovery after Optic Neuritis in MS Patients. Journal of Clinical Medicine. 2019; 8(11):2022. https://doi.org/10.3390/jcm8112022
Chicago/Turabian StyleChisari, Clara Grazia, Mario Damiano Toro, Vincenzo Cimino, Robert Rejdak, Maria Luca, Laura Rapisarda, Teresio Avitabile, Chiara Posarelli, Konrad Rejdak, Michele Reibaldi, and et al. 2019. "Retinal Nerve Fiber Layer Thickness and Higher Relapse Frequency May Predict Poor Recovery after Optic Neuritis in MS Patients" Journal of Clinical Medicine 8, no. 11: 2022. https://doi.org/10.3390/jcm8112022