


Is Primary Open-Angle Glaucoma a Vascular Disease? Assessment of the Relationship between Retinal Arteriolar Morphology and Glaucoma Severity Using Adaptive Optics

Abstract
:1. Introduction
2. Materials and Methods
2.1. Subjects
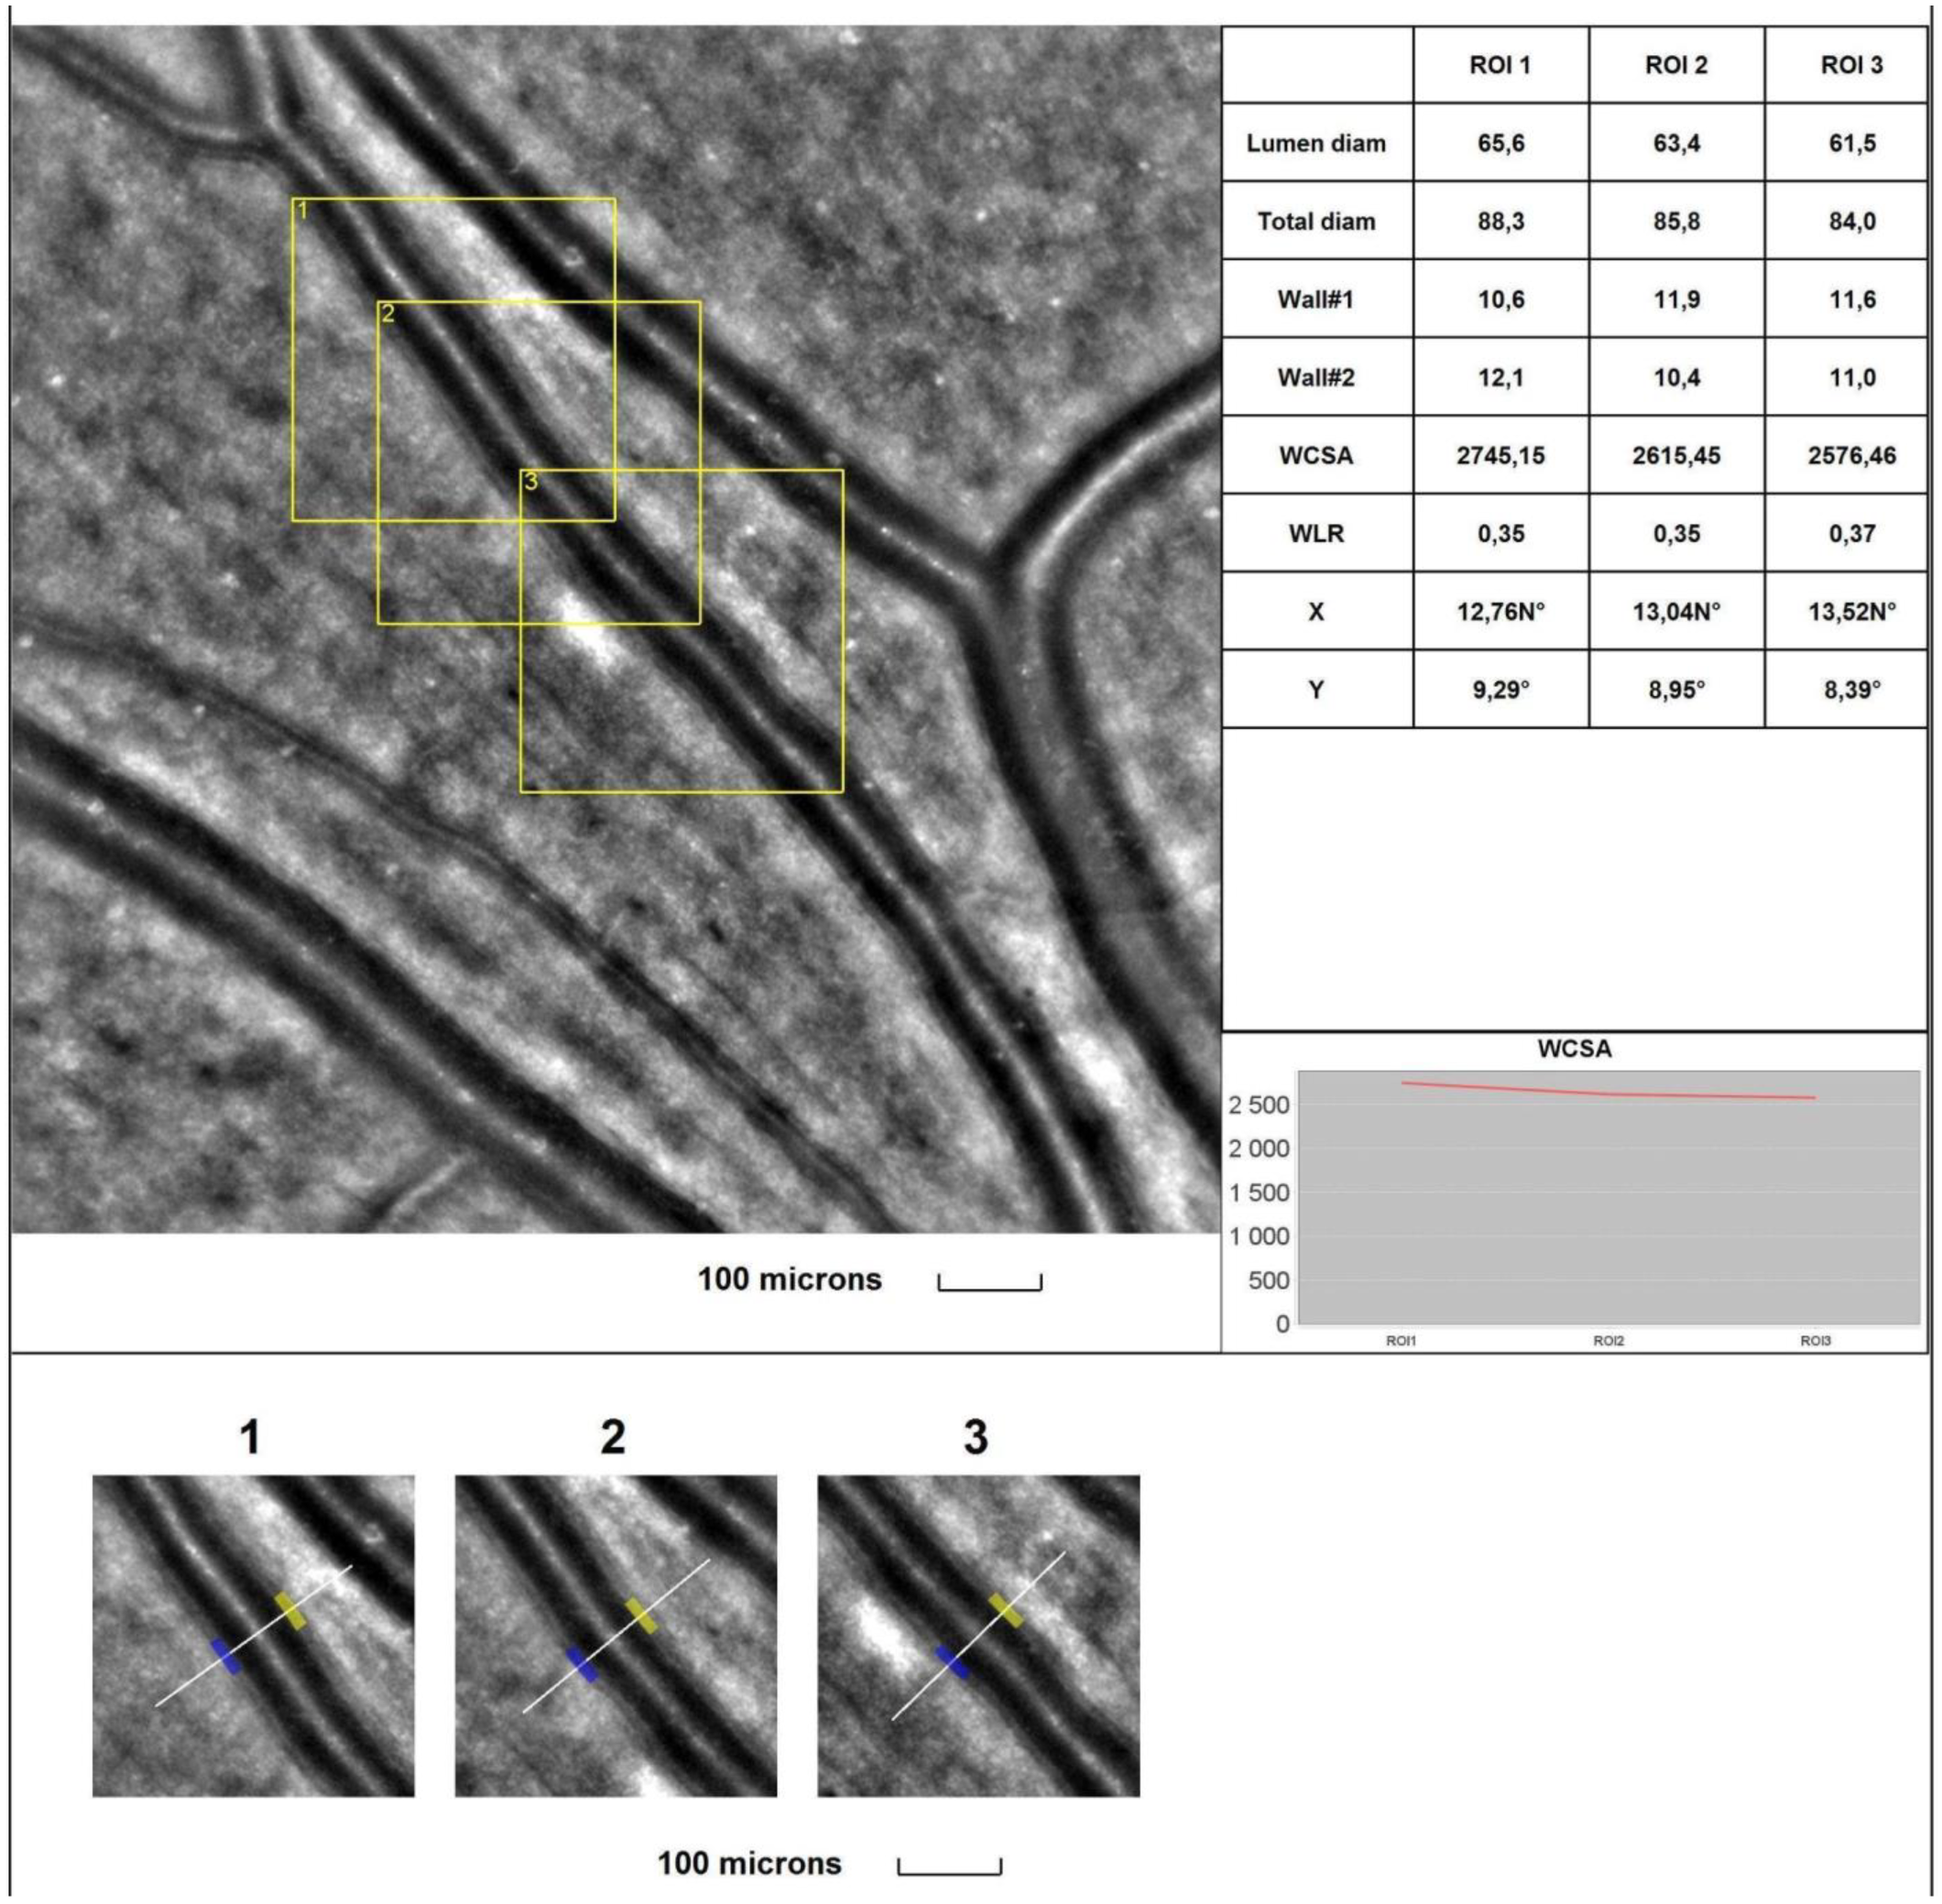
2.2. Examination
2.3. Statistical Analyses
3. Results
Comparison of General Data
4. Discussion
5. Limitations
6. Conclusions
Author Contributions
Funding
Institutional Review Board Statement
Informed Consent Statement
Data Availability Statement
Conflicts of Interest
References
- Martucci, A.; Nucci, C.; Pinazo-Duran, M.D. Editorial: New perspectives in glaucoma pathophysiology, diagnosis, and treatment. Front. Med. 2023, 10, 1200427. [Google Scholar] [CrossRef] [PubMed]
- Almeida, I.N.F.; Taniguchi, E.; Tito, C.V.A.; Dias, D.T.; Ushida, M.; Dorairaj, S.; Ritch, R.; Teixeira, S.H.; Paranhos, A.; Gracitelli, C.P.B.; et al. Vascular parameters and endothelin-1 measurements in glaucoma patients with low- and high-tension optic disc hemorrhages. Sci. Rep. 2023, 13, 5023. [Google Scholar] [CrossRef]
- Shalaby, W.S.; Ahmed, O.M.; Waisbourd, M.; Katz, L.J. A review of potential novel glaucoma therapeutic options independent of intraocular pressure. Surv. Ophthalmol. 2022, 67, 1062–1080. [Google Scholar] [CrossRef] [PubMed]
- Harris, A.; Guidoboni, G.; Siesky, B.; Mathew, S.; Vercellin, A.C.V.; Rowe, L.; Arciero, J. Ocular blood flow as a clinical observation: Value, limitations and data analysis. Prog. Retin. Eye Res. 2020, 78, 100841. [Google Scholar] [CrossRef] [PubMed]
- Weinreb, R.N.; Aung, T.; Medeiros, F.A. The pathophysiology and treatment of glaucoma: A review. JAMA 2014, 311, 1901–1911. [Google Scholar] [CrossRef]
- Fan, X.; Ying, Y.; Zhai, R.; Sheng, Q.; Sun, Y.; Xu, H.; Kong, X. The characteristics of fundus microvascular alterations in the course of glaucoma: A narrative review. Ann. Transl. Med. 2022, 10, 527. [Google Scholar] [CrossRef] [PubMed]
- Wang, X.; Wang, M.; Liu, H.; Mercieca, K.; Prinz, J.; Feng, Y.; Prokosch, V. The Association between Vascular Abnormalities and Glaucoma—What Comes First? Int. J. Mol. Sci. 2023, 24, 13211. [Google Scholar] [CrossRef] [PubMed]
- Kang, J.M.; Tanna, A.P. Glaucoma. Med. Clin. N. Am. 2021, 105, 493–510. [Google Scholar] [CrossRef]
- García-Medina, J.J.; Pinazo-Durán, M.D. Updates in Clinical and Translational Glaucoma Research. J. Clin. Med. 2021, 11, 221. [Google Scholar] [CrossRef]
- Ko, C.-K.; Huang, K.-I.; Su, F.-Y.; Ko, M.-L. Vessel Density in the Macular and Peripapillary Areas in Preperimetric Glaucoma to Various Stages of Primary Open-Angle Glaucoma in Taiwan. J. Clin. Med. 2021, 10, 5490. [Google Scholar] [CrossRef]
- Nishida, T.; Moghimi, S.; Wu, J.-H.; Chang, A.C.; Diniz-Filho, A.; Kamalipour, A.; Zangwill, L.M.; Weinreb, R.N. Association of Initial Optical Coherence Tomography Angiography Vessel Density Loss With Faster Visual Field Loss in Glaucoma. JAMA Ophthalmol. 2022, 140, 319–326. [Google Scholar] [CrossRef] [PubMed]
- Shin, J.D.; Wolf, A.T.; Harris, A.; Vercellin, A.V.; Siesky, B.; Rowe, L.W.; Packles, M.; Oddone, F. Vascular biomarkers from optical coherence tomography angiography and glaucoma: Where do we stand in 2021? Acta Ophthalmol. 2022, 100, E377–E385. [Google Scholar] [CrossRef]
- Banou, L.; Dastiridou, A.; Giannoukas, A.; Kouvelos, G.; Baros, C.; Androudi, S. The Role of Color Doppler Imaging in the Diagnosis of Glaucoma: A Review of the Literature. Diagnostics 2023, 13, 588. [Google Scholar] [CrossRef] [PubMed]
- Hugo, J.; Chavane, F.; Beylerian, M.; Callet, M.; Denis, D.; Matonti, F. Morphologic Analysis of Peripapillary Retinal Arteriole Using Adaptive Optics in Primary Open-angle Glaucoma. Eur. J. Gastroenterol. Hepatol. 2020, 29, 271–275. [Google Scholar] [CrossRef]
- Perez-Rovira, A.; MacGillivray, T.; Trucco, E.; Chin, K.S.; Zutis, K.; Lupascu, C.; Tegolo, D.; Giachetti, A.; Wilson, P.J.; Doney, A.; et al. VAMPIRE: Vessel Assessment and Measurement Platform for Images of the REtina. In Proceedings of the 2011 Annual International Conference of the IEEE Engineering in Medicine and Biology Society, Boston, MA, USA, 30 August–3 September 2011; pp. 3391–3394. [Google Scholar]
- Cheung, C.Y.; Tay, W.T.; Mitchell, P.; Wang, J.J.; Hsu, W.; Lee, M.L.; Lau, Q.P.; Zhu, A.L.; Klein, R.; Saw, S.M.; et al. Quantitative and qualitative retinal microvascular characteristics and blood pressure. J. Hypertens. 2011, 29, 1380–1391. [Google Scholar] [CrossRef]
- Garhofer, G.; Bek, T.; Boehm, A.G.; Gherghel, D.; Grunwald, J.; Jeppesen, P.; Kergoat, H.; Kotliar, K.; Lanzl, I.; Lovasik, J.V.; et al. Use of the retinal vessel analyzer in ocular blood flow research. Acta Ophthalmol. 2010, 88, 717–722. [Google Scholar] [CrossRef]
- Ouyang, Y.; Shao, Q.; Scharf, D.; Joussen, A.M.; Heussen, F.M. Retinal vessel diameter measurements by spectral domain optical coherence tomography. Graefe’s Arch. Clin. Exp. Ophthalmol. 2015, 253, 499–509. [Google Scholar] [CrossRef] [PubMed]
- Pellegrini, E.; Robertson, G.; Trucco, E.; MacGillivray, T.J.; Lupascu, C.; van Hemert, J.; Williams, M.C.; Newby, D.E.; van Beek, E.J.; Houston, G. Blood vessel segmentation and width estimation in ultra-wide field scanning laser ophthalmoscopy. Biomed. Opt. Express 2014, 5, 4329–4337. [Google Scholar] [CrossRef]
- Bakker, E.; Dikland, F.A.; van Bakel, R.; De Jesus, D.A.; Brea, L.S.; Klein, S.; van Walsum, T.; Rossant, F.; Farías, D.C.; Grieve, K.; et al. Adaptive optics ophthalmoscopy: A systematic review of vascular biomarkers. Surv. Ophthalmol. 2022, 67, 369–387. [Google Scholar] [CrossRef]
- Akyol, E.; Hagag, A.M.; Sivaprasad, S.; Lotery, A.J. Adaptive optics: Principles and applications in ophthalmology. Eye 2021, 35, 244–264. [Google Scholar] [CrossRef]
- Kupis, M.; Wawrzyniak, Z.M.; Szaflik, J.P.; Zaleska-Żmijewska, A. Retinal Photoreceptors and Microvascular Changes in the Assessment of Diabetic Retinopathy Progression: A Two-Year Follow-Up Study. Diagnostics 2023, 13, 2513. [Google Scholar] [CrossRef]
- European Glaucoma Society Terminology and Guidelines for Glaucoma, 5th Edition. Br. J. Ophthalmol. 2021, 105, 1–169. [CrossRef] [PubMed]
- Samelska, K.; Szaflik, J.P.; Śmigielska, B.; Zaleska-Żmijewska, A. Progression of Rare Inherited Retinal Dystrophies May Be Monitored by Adaptive Optics Imaging. Life 2023, 13, 1871. [Google Scholar] [CrossRef]
- Lombardo, M.; Parravano, M.; Serrao, S.; Ducoli, P.; Stirpe, M.; Lombardo, G. Analysis of retinal capillaries in patients with type 1 diabetes and nonproliferative diabetic retinopathy using adaptive optics imaging. Retina 2013, 33, 1630–1639. [Google Scholar] [CrossRef] [PubMed]
- Berrett, G.B.; Hogg, J.; Innes, W. Retinal arterial pulsation as an indicator of raised intraocular pressure. SAGE Open Med Case Rep. 2021, 9, 2050313X211054633. [Google Scholar] [CrossRef]
- Ahmad, S.S. Controversies in the vascular theory of glaucomatous optic nerve degeneration. Taiwan J. Ophthalmol. 2016, 6, 182–186. [Google Scholar] [CrossRef] [PubMed]
- Flammer, J.; Konieczka, K.; Flammer, A.J. The role of ocular blood flow in the pathogenesis of glaucomatous damage. US Ophthalmic Rev. 2011, 4, 84. [Google Scholar] [CrossRef]
- Takayanagi, Y.; Takai, Y.; Kaidzu, S.; Tanito, M. Association between Systemic Antioxidant Capacity and Retinal Vessel Diameters in Patients with Primary-Open Angle Glaucoma. Life 2020, 10, 364. [Google Scholar] [CrossRef]
- Garhöfer, G.; Bata, A.M.; Popa-Cherecheanu, A.; Hommer, A.; Vass, C.; Resch, H.; Schmidl, D.; Werkmeister, R.M.; Schmetterer, L. Retinal Oxygen Extraction in Patients with Primary Open-Angle Glaucoma. Int. J. Mol. Sci. 2022, 23, 10152. [Google Scholar] [CrossRef]
- Gugleta, K.; Kochkorov, A.; Waldmann, N.; Polunina, A.; Katamay, R.; Flammer, J.; Orgul, S. Dynamics of retinal vessel response to flicker light in glaucoma patients and ocular hypertensives. Graefe’s Arch. Clin. Exp. Ophthalmol. 2012, 250, 589–594. [Google Scholar] [CrossRef]
- Feke, G.T.; Pasquale, L.R. Retinal blood flow response to posture change in glaucoma patients compared with healthy subjects. Ophthalmology 2008, 115, 246–252. [Google Scholar] [CrossRef]
- Gardiner, S.K.; Cull, G.; Fortune, B. Retinal Vessel Pulsatile Characteristics Associated with Vascular Stiffness Can Predict the Rate of Functional Progression in Glaucoma Suspects. Investig. Opthalmol. Vis. Sci. 2023, 64, 30. [Google Scholar] [CrossRef] [PubMed]
- Mautuit, T.; Semecas, R.; Hogg, S.; Daien, V.; Gavard, O.; Chateau, N.; MacGillivray, T.; Trucco, E.; Chiquet, C. Comparing Measurements of Vascular Diameter Using Adaptative Optics Imaging and Conventional Fundus Imaging. Diagnostics 2022, 12, 705. [Google Scholar] [CrossRef] [PubMed]
- De Ciuceis, C.; Rosei, C.A.; Caletti, S.; Trapletti, V.; Coschignano, M.A.; Tiberio, G.A.; Duse, S.; Docchio, F.; Pasinetti, S.; Zambonardi, F.; et al. Comparison between invasive and noninvasive techniques of evaluation of microvascular structural alterations. J. Hypertens. 2018, 36, 1154–1163. [Google Scholar] [CrossRef]
- Arichika, S.; Uji, A.; Ooto, S.; Muraoka, Y.; Yoshimura, N. Comparison of retinal vessel measurements using adaptive optics scanning laser ophthalmoscopy and optical coherence tomography. Jpn. J. Ophthalmol. 2016, 60, 166–171. [Google Scholar] [CrossRef]
- Wang, S.; Xu, L.; Wang, Y.; Wang, Y.; Jonas, J.B. Retinal vessel diameter in normal and glaucomatous eyes: The Beijing eye study. Clin. Exp. Ophthalmol. 2007, 35, 800–807. [Google Scholar] [CrossRef] [PubMed]
- Jonas, J.B.; Nguyen, X.N.; Naumann, G.O. Parapapillary retinal vessel diameter in normal and glaucoma eyes. I. Morphometric data. Investig. Ophthalmol. Vis. Sci. 1989, 30, 1599–1603. [Google Scholar]
- Rader, J.; Feuer, W.J.; Anderson, D.R. Peripapillary vasoconstriction in the glaucomas and the anterior ischemic optic neuropathies. Arch. Ophthalmol. 1994, 117, 72–80. [Google Scholar] [CrossRef]
- Zhang, Q.; Jan, C.; Guo, C.Y.; Wang, F.H.; Liang, Y.B.; Cao, K.; Zhang, Z.; Yang, D.Y.; Thomas, R.; Wang, N.L.; et al. Association of intraocular pressure-related factors and retinal vessel diameter with optic disc rim area in subjects with and without primary open angle glaucoma. Clin. Exp. Ophthalmol. 2018, 46, 389–399. [Google Scholar] [CrossRef]
- Chiquet, C.; Gavard, O.; Arnould, L.; Mautuit, T.; Macgillivray, T.J.; Bron, A.M.; Semecas, R.; Trucco, E.; Florent, A. Retinal vessel phenotype in patients with primary open-angle glaucoma. Acta Ophthalmol. 2020, 98, e88–e93. [Google Scholar] [CrossRef]
- Cheng, J.; Zhao, H.; Jiang, C.; Kong, X.; Sun, X. Change of Retinal Vessels in Different Sectors of the Parapapillary Area in Primary Open-Angle Glaucoma. Front. Med. 2021, 8, 705829. [Google Scholar] [CrossRef] [PubMed]
- Koch, E.; Rosenbaum, D.; Brolly, A.; Sahel, J.-A.; Chaumet-Riffaud, P.; Girerd, X.; Rossant, F.; Paques, M. Morphometric analysis of small arteries in the human retina using adaptive optics imaging: Relationship with blood pressure and focal vascular changes. J. Hypertens. 2014, 32, 890–898. [Google Scholar] [CrossRef] [PubMed]
- Zaleska-Żmijewska, A.; Wawrzyniak, Z.M.; Dąbrowska, A.; Szaflik, J.P. Adaptive Optics (rtx1) High-Resolution Imaging of Photoreceptors and Retinal Arteries in Patients with Diabetic Retinopathy. J. Diabetes Res. 2019, 2019, 9548324. [Google Scholar] [CrossRef] [PubMed]
- Meixner, E.; Michelson, G. Measurement of retinal wall-to-lumen ratio by adaptive optics retinal camera: A clinical research. Graefe’s Arch. Clin. Exp. Ophthalmol. 2015, 253, 1985–1995. [Google Scholar] [CrossRef]
- Lim, L.S.; Saw, S.M.; Cheung, N.; Mitchell, P.; Wong, T.Y. Relationship of retinal vascular caliber with optic disc and macular structure. Arch. Ophthalmol. 2009, 148, 368–375. [Google Scholar] [CrossRef] [PubMed]
- Hall, J.K.; Andrews, A.P.; Walker, R.; Piltz-Seymour, J.R. Association of retinal vessel caliber and visual field defects in glaucoma. Arch. Ophthalmol. 2001, 132, 855–859. [Google Scholar] [CrossRef]
- De Leon, J.M.S.; Cheung, C.Y.; Wong, T.-Y.; Li, X.; Hamzah, H.; Aung, T.; Su, D.H.-W. Retinal vascular caliber between eyes with asymmetric glaucoma. Graefe’s Arch. Clin. Exp. Ophthalmol. 2015, 253, 583–589. [Google Scholar] [CrossRef] [PubMed]
- Lin, T.P.H.; Wang, Y.M.; Ho, K.; Wong, C.Y.K.; Chan, P.P.; Wong, M.O.M.; Chan, N.C.Y.; Tang, F.; Lam, A.; Leung, D.Y.L.; et al. Global assessment of arteriolar, venular and capillary changes in normal tension glaucoma. Sci. Rep. 2020, 10, 19222. [Google Scholar] [CrossRef]
- Mitchell, P.; Leung, H.; Wang, J.J.; Rochtchina, E.; Lee, A.J.; Wong, T.Y.; Klein, R. Retinal vessel diameter and open-angle glaucoma: The Blue Mountains Eye Study. Ophthalmology 2005, 112, 245–250. [Google Scholar] [CrossRef]
- Amerasinghe, N.; Aung, T.; Cheung, N.; Fong, C.W.; Wang, J.J.; Mitchell, P.; Saw, S.-M.; Wong, T.Y. Evidence of retinal vascular narrowing in glaucomatous eyes in an Asian population. Investig. Opthalmol. Vis. Sci. 2008, 49, 5397–5402. [Google Scholar] [CrossRef]
- Kawasaki, R.; Wang, J.J.; Rochtchina, E.; Lee, A.J.; Wong, T.Y.; Mitchell, P. Retinal vessel caliber is associated with the 10-year incidence of glaucoma: The Blue Mountains Eye Study. Ophthalmology 2013, 120, 84–90. [Google Scholar] [CrossRef] [PubMed]
- Lin, T.P.; Hui, H.Y.; Ling, A.; Chan, P.P.; Shen, R.; Wong, M.O.; Chan, N.C.; Leung, D.Y.; Xu, D.; Lee, M.L.; et al. Risk of Normal Tension Glaucoma Progression From Automated Baseline Retinal-Vessel Caliber Analysis: A Prospective Cohort Study. Arch. Ophthalmol. 2023, 247, 111–120. [Google Scholar] [CrossRef] [PubMed]
- Yoo, E.; Yoo, C.; Lee, T.-E.; Kim, Y.Y. Retinal vessel diameter in bilateral glaucoma suspects: Comparison between the eye converted to glaucoma and the contralateral non-converted eye. Graefe’s Arch. Clin. Exp. Ophthalmol. 2016, 254, 1599–1608. [Google Scholar] [CrossRef] [PubMed]
- Loo, J.H.; Wang, Z.; Chong, R.S. Caveolin-1 in vascular health and glaucoma: A critical vascular regulator and potential therapeutic target. Front. Med. 2023, 10, 1087123. [Google Scholar] [CrossRef] [PubMed]
- Hasegawa, T.; Ooto, S.; Akagi, T.; Kameda, T.; Nakanishi, H.; Ikeda, H.O.; Suda, K.; Tsujikawa, A. Expansion of retinal nerve fiber bundle narrowing in glaucoma: An adaptive optics scanning laser ophthalmoscopy study. Am. J. Ophthalmol. Case Rep. 2020, 19, 100732. [Google Scholar] [CrossRef] [PubMed]
- Chen, M.F.; Chui, T.Y.P.; Alhadeff, P.; Rosen, R.B.; Ritch, R.; Dubra, A.; Hood, D.C. Adaptive optics imaging of healthy and abnormal regions of retinal nerve fiber bundles of patients with glaucoma. Investig. Opthalmol. Vis. Sci. 2015, 56, 674–681. [Google Scholar] [CrossRef] [PubMed]
- Richhariya, A.; Choudhari, N.; Kumar, S.; Krishnamurthy, R.; Priya, R.; Garudadri, C. Adaptive optics scanning laser ophthalmoscopy may support early diagnosis of glaucoma. Indian J. Ophthalmol. 2022, 70, 2877–2882. [Google Scholar] [CrossRef] [PubMed]
- Zwillinger, S.; Paques, M.; Safran, B.; Baudouin, C. In vivo characterization of lamina cribrosa pore morphology in primary open-angle glaucoma. J. Français D’ophtalmologie 2016, 39, 265–271. [Google Scholar] [CrossRef]
- Choi, S.S.; Zawadzki, R.J.; Lim, M.C.; Brandt, J.D.; Keltner, J.L.; Doble, N.; Werner, J.S. Evidence of outer retinal changes in glaucoma patients as revealed by ultrahigh-resolution in vivo retinal imaging. Br. J. Ophthalmol. 2011, 95, 131–141. [Google Scholar] [CrossRef]
- King, B.J.; Burns, S.A.; Sapoznik, K.A.; Luo, T.; Gast, T.J. High-Resolution, Adaptive Optics Imaging of the Human Trabecular Meshwork In Vivo. Transl. Vis. Sci. Technol. 2019, 8, 5. [Google Scholar] [CrossRef]
- Liu, Z.; Saeedi, O.; Zhang, F.; Villanueva, R.; Asanad, S.; Agrawal, A.; Hammer, D.X. Quantification of Retinal Ganglion Cell Morphology in Human Glaucomatous Eyes. Investig. Opthalmol. Vis. Sci. 2021, 62, 34. [Google Scholar] [CrossRef] [PubMed]
- Soltanian-Zadeh, S.; Kurokawa, K.; Liu, Z.; Zhang, F.; Saeedi, O.; Hammer, D.X.; Miller, D.T.; Farsiu, S. Weakly supervised individual ganglion cell segmentation from adaptive optics OCT images for glaucomatous damage assessment. Optica 2021, 8, 642–651. [Google Scholar] [CrossRef] [PubMed]


| Parameters | Group A | Group B | Group C | Control Group | p-Value † |
|---|---|---|---|---|---|
| total number of eyes | 37 | 48 | 26 | 70 | 0.370 |
| age (m ± SD) (years) | 51.1 ± 7.8 | 52.7 ± 8.2 | 53.5 ± 8.8 | 50.5 ± 5.9 | 0.232 |
| sex (male/female) | 12/25 | 24/24 | 11/15 | 26/44 | 0.489 0.559 § |
| BMI (m ± SD) (kg/m2) | 23.6 ± 2.4 | 24.3 ± 1.8 | 24.3 ± 2.0 | 23.8 ± 2.2 | 0.358 |
| SBP (m ± SD) (cm Hg) | 124.4 ± 11.4 | 126.7 ± 11.8 | 126.9 ± 9.9 | 121.5 ± 11.9 | 0.404 ‡ |
| DBP (m ± SD) (cm Hg) | 77.9 ± 8.4 | 78.4 ± 7.6 | 78.3 ± 7.3 | 78.7 ± 8.7 | 0.876 |
| BCVA (m ± SD) | 0.905 ± 0.118 | 0.908 ± 0.133 | 0.865 ± 0.147 | 0.989 ± 0.040 | <0.001 † A **, B *, C *** vs. Control *** |
| IOP (m ± SD) (cm Hg) | 13.2 ± 2.6 | 13.2 ± 2.5 | 13.0 ± 2.8 | 15.2 ± 2.5 | <0.001 † A **, B **, C ** vs. Control ** |
| AL (m ± SD) (mm) | 24.0 ± 0.9 | 24.4 ± 1.2 | 23.9 ± 1.3 | 23.5 ± 0.9 | 0.905 ‡ B *** vs. Control *** |
| lens status (pseudophakic) (%) | 2 (5.4%) | 4 (8.3%) | 5 (23.1%) | 3 (4.3%) |
| Parameters | Group A | Group B | Group C | p-Value † |
|---|---|---|---|---|
| Duration of glaucoma (m ± SD) (years) | 7.1 ± 4.3 | 8.2 ± 5.2 | 9.0 ± 6.0 | 0.489 |
| Cup-to-disc ratio (m ± SD) | 0.554 ± 0.051 | 0.590 ± 0.031 | 0.815 ± 0.067 | <0.001 A ***, B *** vs. C *** |
| RNFL (m ± SD) (µm) | 87.3 ± 10.0 | 83.3 ± 10.7 | 72.6 ± 13.9 | <0.001 A ***, B *** vs. C *** |
| GCC (m ± SD) (µm) | 90.0 ± 11.2 | 84.4 ± 9.7 | 74.0 ± 13.7 | <0.001 A ***, B *** vs. C *** |
| Rim area (m ± SD) (mm) | 0.873 ± 0.262 | 0.857 ± 0.367 | 0.656 ± 0.381 | <0.001 A ***, B ** vs. C *** |
| MD (m ± SD) (dB) | 0.02 ± 1.02 | −1.99 ± 1.74 | −9.45 ± 2.95 | <0.001 A *** vs. B ***, A *** vs. C ***, B ***vs. C *** |
| PSD (m ± SD) (dB) | 1.58 ± 0.3 | 3.6 ± 1.9 | 10.54 ± 3.58 | <0.001 A *** vs. B ***, A *** vs. C ***, B *** vs. C *** |
| Parameters | Filtering Surgery (n (%)) | Canaloplasty (n (%)) | SLT (n (%)) | Monotherapy (n (%)) | Bitherapy (n (%)) | Tritherapy (n (%)) | Quadric Therapy (n (%)) |
|---|---|---|---|---|---|---|---|
| Groups | |||||||
| Group A | 1 (2.7%) | 4 (10.8%) | 1 (2.7%) | 21 (56.8%) | 9 (24.3%) | 1 (2.7%) | 1 (2.7%) |
| Group B | 6 (12.5%) | 14 (29.2%) | 2 (4.2%) | 10 (20.8%) | 13 (27.9%) | 5 (10.4%) | 0 (0.0%) |
| Group C | 7 (18.2%) | 6 (26.9%) | 1 (3.8%) | 5 (19.2%) | 7 (26.9%) | 5 (19.2%) | 5 (7.7%) |
| Parameters | Group A | Group B | Group C | Control Group | p-Value † |
|---|---|---|---|---|---|
| Supratemporal Arteriole | |||||
| 1WT (m ± SD) (µm) | 13.0 ± 2.0 | 13.1 ± 1.4 | 13.6 ± 2.0 | 12.0 ± 1.2 | <0.001 A *, B ***, C *** vs. Control *** |
| 2WT (m ± SD) (µm) | 12.5 ± 1.3 | 12.9 ± 1.2 | 13.6 ± 1.7 | 11.4 ± 1.1 | <0.001 A ***, B ***, C *** vs. Control *** |
| WLR (m ± SD) | 0.294 ± 0.035 | 0.298 ± 0.044 | 0.329 ± 0.045 | 0.241 ± 0.023 | <0.001 A ***, B ***, C *** vs. Control *** |
| LD (m ± SD) (µm) | 87.8 ± 10.2 | 88.6 ± 11.1 | 79.9 ± 17.7 | 95.6 ± 15.2 | <0.001 A **, B *, C *** vs. Control *** |
| TD (m ± SD) (µm) | 112.3 ± 13.0 | 113.2 ± 12.3 | 110.5 ± 9.8 | 120.9 ± 11.9 | 0.001 A *, B *, C ** vs. Control ** |
| WCSA (m ± SD) (µm2) | 4041.9 ± 732.3 | 4161.3 ± 596.0 | 4148.1 ± 663.8 | 4033.5 ± 697.0 | 0.604 |
| Infratemporal arteriole | |||||
| 1WT (m ± SD) (µm) | 13.6 ± 1.7 | 13.3 ± 2.1 | 14.1 ± 2.0 | 11.9 ± 1.3 | <0.001 A ***, B **, C *** vs. Control *** |
| 2WT (m ± SD) (µm) | 13.7 ± 1.6 | 13.3 ± 1.7 | 13.81 ± 1.7 | 11.8 ± 1.2 | <0.001 A ***, B ***, C *** vs. Control *** |
| WLR (m ± SD) | 0.307 ± 0.034 | 0.298 ± 0.048 | 0.336 ± 0.047 | 0.239 ± 0.018 | <0.001 A ***, B ***, C *** vs. Control ***, B *** vs. Control *** |
| LD (m ± SD) (µm) | 90.3 ± 11.1 | 90.3 ± 9.7 | 84.2 ± 12.0 | 99.4 ± 10.3 | <0.001 A ***, B ***, C *** vs. Control *** |
| TD (m ± SD) (µm) | 116.6 ± 9.9 | 115.4 ± 13.2 | 111.2 ± 13.8 | 123.0 ± 11.6 | 0.003 C *** vs. Control *** |
| WCSA (m ± SD) (µm2) | 4420.0 ± 712.7 | 4338.7 ± 801.9 | 4349.8 ± 913.6 | 4136.5 ± 688.6 | 0.248 |
Disclaimer/Publisher’s Note: The statements, opinions and data contained in all publications are solely those of the individual author(s) and contributor(s) and not of MDPI and/or the editor(s). MDPI and/or the editor(s) disclaim responsibility for any injury to people or property resulting from any ideas, methods, instructions or products referred to in the content. |
© 2024 by the authors. Licensee MDPI, Basel, Switzerland. This article is an open access article distributed under the terms and conditions of the Creative Commons Attribution (CC BY) license (https://creativecommons.org/licenses/by/4.0/).
Share and Cite
Szewczuk, A.; Wawrzyniak, Z.M.; Szaflik, J.P.; Zaleska-Żmijewska, A. Is Primary Open-Angle Glaucoma a Vascular Disease? Assessment of the Relationship between Retinal Arteriolar Morphology and Glaucoma Severity Using Adaptive Optics. J. Clin. Med. 2024, 13, 478. https://doi.org/10.3390/jcm13020478
Szewczuk A, Wawrzyniak ZM, Szaflik JP, Zaleska-Żmijewska A. Is Primary Open-Angle Glaucoma a Vascular Disease? Assessment of the Relationship between Retinal Arteriolar Morphology and Glaucoma Severity Using Adaptive Optics. Journal of Clinical Medicine. 2024; 13(2):478. https://doi.org/10.3390/jcm13020478
Chicago/Turabian StyleSzewczuk, Alina, Zbigniew M. Wawrzyniak, Jacek P. Szaflik, and Anna Zaleska-Żmijewska. 2024. "Is Primary Open-Angle Glaucoma a Vascular Disease? Assessment of the Relationship between Retinal Arteriolar Morphology and Glaucoma Severity Using Adaptive Optics" Journal of Clinical Medicine 13, no. 2: 478. https://doi.org/10.3390/jcm13020478