
Stiffness and Elasticity of Aorta Assessed Using Computed Tomography Angiography as a Marker of Cardiovascular Health—A Cross-Sectional Study

 ,
,
Abstract
:1. Introduction
2. Materials and Methods
3. Results
4. Discussion
5. Conclusions
Author Contributions
Funding
Institutional Review Board Statement
Informed Consent Statement
Data Availability Statement
Conflicts of Interest
References
- Townsend, N.; Wilson, L.; Bhatnagar, P.; Wickramasinghe, K.; Rayner, M.; Nichols, M. Cardiovascular Disease in Europe: Epidemiological Update 2016. Eur. Heart J. 2016, 37, 3232–3245. [Google Scholar] [CrossRef]
- Pilkerton, C.S.; Singh, S.S.; Bias, T.K.; Frisbee, S.J. Changes in Cardiovascular Health in the United States, 2003–2011. J. Am. Heart Assoc. 2015, 4, e001650. [Google Scholar] [CrossRef]
- Zhao, D.; Liu, J.; Wang, M.; Zhang, X.; Zhou, M. Epidemiology of Cardiovascular Disease in China: Current Features and Implications. Nat. Rev. Cardiol. 2019, 16, 203–212. [Google Scholar] [CrossRef]
- Ślusarska, B. Zachowania Zdrowotne w Prewencji Ryzyka Sercowo-Naczyniowego. Folia Cardiol. 2012, 7, 51–59. [Google Scholar]
- Kozłowska, E.; Marzec, A.; Kalinowski, P.; Bojakowska, U. Health Concept and Its Protections in the Light of Subject Literature. J. Educ. Health Sport 2016, 6, 575–585. [Google Scholar]
- Kobierzycki, T. (Ed.) Concepts of Health in the Philosophy of Ancient Greece (from the Seven Wise Men to Aristotle). In Mental Hygiene for Medical Students; Medical Academy: Warsaw, Poland, 1993; pp. 157–177. [Google Scholar]
- Conference, I.H. Constitution of the World Health Organization. 1946. Bull. World Health Organ. 2002, 80, 983–984. [Google Scholar]
- Leonardi, F. The Definition of Health: Towards New Perspectives. Int. J. Health Serv. 2018, 48, 735–748. [Google Scholar] [CrossRef] [PubMed]
- Wood, P.H. Health and Disease and Its Importance for Models Relevant to Health Research; World Health Organization: Copenhagen, Denmark, 1986. [Google Scholar]
- Żórawik, A.; Hajdusianek, W.; Gać, P.; Poręba, R. Environmental and Behavioural Determinants of Cardiovascular Health. J. Health Inequalities 2022, 8, 14–24. [Google Scholar] [CrossRef]
- Folsom, A.R.; Shah, A.M.; Lutsey, P.L.; Roetker, N.S.; Alonso, A.; Avery, C.L.; Miedema, M.D.; Konety, S.; Chang, P.P.; Solomon, S.D. American Heart Association’s Life’s Simple 7: Avoiding Heart Failure and Preserving Cardiac Structure and Function. Am. J. Med. 2015, 128, 970–976.e2. [Google Scholar] [CrossRef]
- Hasbani, N.R.; Ligthart, S.; Brown, M.R.; Heath, A.S.; Bebo, A.; Ashley, K.E.; Boerwinkle, E.; Morrison, A.C.; Folsom, A.R.; Aguilar, D.; et al. American Heart Association’s Life’s Simple 7: Lifestyle Recommendations, Polygenic Risk, and Lifetime Risk of Coronary Heart Disease. Circulation 2022, 145, 808–818. [Google Scholar] [CrossRef]
- Desai, C.S.; Ning, H.; Liu, K.; Reis, J.P.; Gidding, S.S.; Armstrong, A.; Lima, J.A.C.; Lloyd-Jones, D.M. Cardiovascular Health in Young Adulthood and Association with Left Ventricular Structure and Function Later in Life: The Coronary Artery Risk Development in Young Adults Study. J. Am. Soc. Echocardiogr. 2015, 28, 1452–1461. [Google Scholar] [CrossRef]
- Hajdusianek, W.; Żórawik, A.; Poręba, R.; Gać, P. Assessment of Aortic Stiffness in Computed Tomography—Methodology of Radiological Examination from 2000 to 2020. Pol. J. Radiol. 2022, 87, 635–640. [Google Scholar] [CrossRef] [PubMed]
- Birudaraju, D.; Cherukuri, L.; Kinninger, A.; Chaganti, B.T.; Haroun, P.; Pidikiti, S.; Lakshmanan, S.; Hamal, S.; Flores, F.; Dailing, C.; et al. Relationship between Cardio-Ankle Vascular Index and Obstructive Coronary Artery Disease. Coron. Artery Dis. 2020, 31, 550–555. [Google Scholar] [CrossRef] [PubMed]
- Pereira, T.; Maldonado, J.; Pereira, L.; Conde, J. Aortic Stiffness Is an Independent Predictor of Stroke in Hypertensive Patients. Arq. Bras. Cardiol. 2013, 100, 437–443. [Google Scholar] [CrossRef] [PubMed]
- Di Daniele, N.; Celotto, R.; Alunni Fegatelli, D.; Gabriele, M.; Rovella, V.; Scuteri, A. Common Carotid Artery Calcification Impacts on Cognitive Function in Older Patients. High. Blood Press. Cardiovasc. Prev. 2019, 26, 127–134. [Google Scholar] [CrossRef] [PubMed]
- Guo, J.; Fujiyoshi, A.; Willcox, B.; Choo, J.; Vishnu, A.; Hisamatsu, T.; Ahuja, V.; Takashima, N.; Barinas-Mitchell, E.; Kadota, A.; et al. Increased Aortic Calcification Is Associated with Arterial Stiffness Progression in Multiethnic Middle-Aged Men. Hypertension 2017, 69, 102–108. [Google Scholar] [CrossRef]
- Cecelja, M.; Hussain, T.; Greil, G.; Botnar, R.; Preston, R.; Moayyeri, A.; Spector, T.D.; Chowienczyk, P. Multimodality Imaging of Subclinical Aortic Atherosclerosis: Relation of Aortic Stiffness to Calcification and Plaque in Female Twins. Hypertension 2013, 61, 609–614. [Google Scholar] [CrossRef]
- Sekikawa, A.; Shin, C.; Curb, J.D.; Barinas-Mitchell, E.; Masaki, K.; El-Saed, A.; Seto, T.B.; Mackey, R.H.; Choo, J.; Fujiyoshi, A.; et al. Aortic Stiffness and Calcification in Men in a Population-Based International Study. Atherosclerosis 2012, 222, 473–477. [Google Scholar] [CrossRef]
- Jia, C.; Jiang, Y.; Yang, Z.; Sun, X.; Yu, Y.; Wang, H.; Lu, Y.; Chen, A.; Wang, Z. Ascending Aortic Elasticity and Related Risk Factors Study on Prehypertension Patients. Am. J. Hypertens. 2017, 30, 61–66. [Google Scholar] [CrossRef]
- Gać, P.; Hajdusianek, W.; Żórawik, A.; Macek, P.; Poręba, M.; Poręba, R. Thickness and Volume of Epicardial Adipose Tissue in Relation to Stiffness and Elasticity of Aorta Assessed by Computed Tomography Angiography. Biomedicines 2023, 11, 1617. [Google Scholar] [CrossRef]
- Sethi, S.; Rivera, O.; Oliveros, R.; Chilton, R. Aortic Stiffness: Pathophysiology, Clinical Implications, and Approach to Treatment. Integr. Blood Press. Control 2014, 7, 29–34. [Google Scholar] [CrossRef]
- Determinants of Pulse Wave Velocity in Healthy People and in the Presence of Cardiovascular Risk Factors: ‘Establishing Normal and Reference Values’. Eur. Heart J. 2010, 31, 2338–2350. [CrossRef]
- Van Bortel, L.M.; Laurent, S.; Boutouyrie, P.; Chowienczyk, P.; Cruickshank, J.K.; De Backer, T.; Filipovsky, J.; Huybrechts, S.; Mattace-Raso, F.U.S.; Protogerou, A.D.; et al. Expert Consensus Document on the Measurement of Aortic Stiffness in Daily Practice Using Carotid-Femoral Pulse Wave Velocity. J. Hypertens. 2012, 30, 445–448. [Google Scholar] [CrossRef] [PubMed]
- Williams, B.; Mancia, G.; Spiering, W.; Agabiti Rosei, E.; Azizi, M.; Burnier, M.; Clement, D.L.; Coca, A.; de Simone, G.; Dominiczak, A.; et al. 2018 ESC/ESH Guidelines for the Management of Arterial Hypertension. Eur. Heart J. 2018, 39, 3021–3104. [Google Scholar] [CrossRef] [PubMed]
- Ben-Shlomo, Y.; Spears, M.; Boustred, C.; May, M.; Anderson, S.G.; Benjamin, E.J.; Boutouyrie, P.; Cameron, J.; Chen, C.-H.; Cruickshank, J.K.; et al. Aortic Pulse Wave Velocity Improves Cardiovascular Event Prediction. J. Am. Coll. Cardiol. 2014, 63, 636–646. [Google Scholar] [CrossRef] [PubMed]
- Tykarski, A.; Filipiak, K.; Januszewicz, A.; Litwin, M.; Narkiewicz, K.; Prejbisz, A.; Ostalska-Nowicka, D.; Widecka, K.; Kostka-Jeziorny, K. Zasady Postępowania w Nadciśnieniu Tętniczym—2019 Rok (Principles of Hypertension Management—2019). Nadciśnienie Tętnicze W Prakt. 2019, 5, 1–86. [Google Scholar]
- Cavalcante, J.L.; Lima, J.A.C.; Redheuil, A.; Al-Mallah, M.H. Aortic Stiffness. J. Am. Coll. Cardiol. 2011, 57, 1511–1522. [Google Scholar] [CrossRef]
- Li, N.; Beck, T.; Chen, J.; Biermann, C.; Guo, L.; Sun, H.; Gao, F.; Liu, C. Assessment of Thoracic Aortic Elasticity: A Preliminary Study Using Electrocardiographically Gated Dual-Source CT. Eur. Radiol. 2011, 21, 1564–1572. [Google Scholar] [CrossRef]
- Oyenuga, A.O.; Folsom, A.R.; Cheng, S.; Tanaka, H.; Meyer, M.L. Greater Adherence to Life’s Simple 7 Is Associated with Less Arterial Stiffness: The Atherosclerosis Risk in Communities (ARIC) Study. Am. J. Hypertens. 2019, 32, 769–776. [Google Scholar] [CrossRef]
- Niiranen, T.J.; Lyass, A.; Larson, M.G.; Hamburg, N.M.; Benjamin, E.J.; Mitchell, G.F.; Vasan, R.S. Prevalence, Correlates, and Prognosis of Healthy Vascular Aging in a Western Community-Dwelling Cohort. Hypertension 2017, 70, 267–274. [Google Scholar] [CrossRef]
- Liu, R.; Li, D.; Yang, Y.; Hu, Y.; Wu, S.; Tian, Y. Systolic Blood Pressure Trajectories and the Progression of Arterial Stiffness in Chinese Adults. Int. J. Environ. Res. Public Health 2022, 19, 10046. [Google Scholar] [CrossRef] [PubMed]
- Webb, A.J.S.; Lawson, A.; Wartolowska, K.; Mazzucco, S.; Rothwell, P.M. OXVASC Study Cohort Aortic Stiffness, Pulse Pressure, and Cerebral Pulsatility Progress Despite Best Medical Management: The OXVASC Cohort. Stroke 2022, 53, 1310–1317. [Google Scholar] [CrossRef] [PubMed]
- Wu, S.; Tian, X.; Chen, S.; Zhang, Y.; Zhang, X.; Xu, Q.; Wang, A. Arterial Stiffness and Blood Pressure in Treated Hypertension: A Longitudinal Study. J. Hypertens. 2023, 41, 768–774. [Google Scholar] [CrossRef] [PubMed]
- Jatoi, N.A.; Jerrard-Dunne, P.; Feely, J.; Mahmud, A. Impact of Smoking and Smoking Cessation on Arterial Stiffness and Aortic Wave Reflection in Hypertension. Hypertension 2007, 49, 981–985. [Google Scholar] [CrossRef] [PubMed]
- Tian, X.; Zuo, Y.; Chen, S.; Zhang, Y.; Zhang, X.; Xu, Q.; Wu, S.; Wang, A. Hypertension, Arterial Stiffness, and Diabetes: A Prospective Cohort Study. Hypertension 2022, 79, 1487–1496. [Google Scholar] [CrossRef]
- Wildman, R.P.; Mackey, R.H.; Bostom, A.; Thompson, T.; Sutton-Tyrrell, K. Measures of Obesity Are Associated with Vascular Stiffness in Young and Older Adults. Hypertension 2003, 42, 468–473. [Google Scholar] [CrossRef]
- Para, I.; Albu, A.; Porojan, M.D. Adipokines and Arterial Stiffness in Obesity. Medicina 2021, 57, 653. [Google Scholar] [CrossRef]
- Recio-Rodriguez, J.I.; Gomez-Marcos, M.A.; Patino-Alonso, M.C.; Agudo-Conde, C.; Rodriguez-Sanchez, E.; Garcia-Ortiz, L. Vasorisk group Abdominal Obesity vs General Obesity for Identifying Arterial Stiffness, Subclinical Atherosclerosis and Wave Reflection in Healthy, Diabetics and Hypertensive. BMC Cardiovasc. Disord. 2012, 12, 3. [Google Scholar] [CrossRef]
- Fu, S.; Luo, L.; Ye, P.; Liu, Y.; Zhu, B.; Zheng, J.; Bai, Y.; Bai, J. Overall and Abdominal Obesity Indicators Had Different Association with Central Arterial Stiffness and Hemodynamics Independent of Age, Sex, Blood Pressure, Glucose, and Lipids in Chinese Community-Dwelling Adults. Clin. Interv. Aging 2013, 8, 1579–1584. [Google Scholar] [CrossRef]
- Park, W.; Jung, W.-S.; Hong, K.; Kim, Y.-Y.; Kim, S.-W.; Park, H.-Y. Effects of Moderate Combined Resistance- and Aerobic-Exercise for 12 Weeks on Body Composition, Cardiometabolic Risk Factors, Blood Pressure, Arterial Stiffness, and Physical Functions, among Obese Older Men: A Pilot Study. Int. J. Environ. Res. Public Health 2020, 17, 7233. [Google Scholar] [CrossRef]
- Lopes, S.; Mesquita-Bastos, J.; Garcia, C.; Leitão, C.; Bertoquini, S.; Ribau, V.; Carvalho, P.; Oliveira, J.; Viana, J.; Figueiredo, D.; et al. Physical Activity Is Associated with Lower Arterial Stiffness in Patients With Resistant Hypertension. Heart Lung Circ. 2021, 30, 1762–1768. [Google Scholar] [CrossRef] [PubMed]
- Hasegawa, N.; Fujie, S.; Horii, N.; Miyamoto-Mikami, E.; Tsuji, K.; Uchida, M.; Hamaoka, T.; Tabata, I.; Iemitsu, M. Effects of Different Exercise Modes on Arterial Stiffness and Nitric Oxide Synthesis. Med. Sci. Sports Exerc. 2018, 50, 1177–1185. [Google Scholar] [CrossRef] [PubMed]
- Heil, L.; Oberhoffer, R.; Böhm, B. Association between Physical Activity Intensity Levels and Arterial Stiffness in Healthy Children. J. Phys. Act. Health 2020, 17, 933–939. [Google Scholar] [CrossRef] [PubMed]
- Stamatelopoulos, K.; Tsoltos, N.; Armeni, E.; Paschou, S.A.; Augoulea, A.; Kaparos, G.; Rizos, D.; Karagouni, I.; Delialis, D.; Ioannou, S.; et al. Physical Activity Is Associated with Lower Arterial Stiffness in Normal-Weight Postmenopausal Women. J. Clin. Hypertens. 2020, 22, 1682–1690. [Google Scholar] [CrossRef]
- Lopes, S.; Afreixo, V.; Teixeira, M.; Garcia, C.; Leitão, C.; Gouveia, M.; Figueiredo, D.; Alves, A.J.; Polonia, J.; Oliveira, J.; et al. Exercise Training Reduces Arterial Stiffness in Adults with Hypertension: A Systematic Review and Meta-Analysis. J. Hypertens. 2021, 39, 214–222. [Google Scholar] [CrossRef]
- Visseren, F.L.J.; Mach, F.; Smulders, Y.M.; Carballo, D.; Koskinas, K.C.; Bäck, M.; Benetos, A.; Biffi, A.; Boavida, J.-M.; Capodanno, D.; et al. 2021 ESC Guidelines on Cardiovascular Disease Prevention in Clinical Practice. Eur. Heart J. 2021, 42, 3227–3337. [Google Scholar] [CrossRef]


| Whole Studied Group (n = 96) | |
|---|---|
| Age (years) | 70.41 ± 8.32 |
| Height (cm) | 166.90 ± 7.80 |
| Body mass (kg) | 71.52 ± 11.68 |
| BMI (kg/m2) | 25.58 ± 3.12 |
| Gender (%) | |
| Men | 54.2 |
| Women | 45.8 |
| Smoking (%) | 28.1 |
| Arterial hypertension (%) | 54.2 |
| Systolic blood pressure (mmHg) | 140.05 ± 18.56 |
| Diastolic blood pressure (mmHg) | 86.04 ± 9.15 |
| Type 2 of diabetes (%) | 11.4 |
| Fasting glucose (mg/dL) | 120.27 ± 49.31 |
| Hypercholesterolemia (%) | 67.7 |
| Total cholesterol (mg/dL) | 224.61 ± 43.25 |
| Indication to CCTA (%) | |
| Chronic CAD suspicion | 58.3 |
| Chest pain | 51.0 |
| Numerous CAD risk factors | 46.8 |
| Low intermediate CAD risk | 20.8 |
| Inconclusive exercise test | 15.6 |
| Non-diagnostic exercise test | 6.2 |
| Regional wall motion abnormalities of left ventricular | 3.1 |
| Sudden cardiac death in the family history | 1.0 |
| AHA Life’s Simple 7 Classification | Whole Studied Group (n = 96) | |
|---|---|---|
| Health behaviors | ||
| Smoking (%) | Never or quit >12 months ago (2 CVH points) | 65.6 |
| Former ≤12 months (1 CVH point) | 6.2 | |
| Yes (0 CVH point) | 28.1 | |
| Body mass index (%) | <25 kg/m2 (2 CVH points) | 39.6 |
| 25–29.9 kg/m2 (1 CVH point) | 48.9 | |
| ≥30 kg/m2 (0 CVH point) | 11.4 | |
| Physical activity (%) | Moderate-intensity activity ≥150 min/week or vigorous-intensity activity ≥75 min/week or combination (2 CVH points) | 14.6 |
| Moderate-intensity activity 1–149 min/week or vigorous-intensity activity 1–74 min/week or combination 1–149 min/week (1 CVH point) | 50.0 | |
| None (0 CVH point) | 35.4 | |
| Healthy diet score (%) | 4–5 components (2 CVH points) | 11.4 |
| 2–3 components (1 CVH point) | 50.0 | |
| 0–1 component (0 CVH point) | 38.5 | |
| Health factor | ||
| Total cholesterol (%) | <200 mg/dL (2 CVH points) | 11.4 |
| 200–239 mg/dL or treated to goal (1 CVH point) | 58.3 | |
| ≥240 mg/dL (0 CVH point) | 30.2 | |
| Blood pressure (%) | <120/80 mmHg (2 CVH points) | 5.2 |
| SBP: 120–139 mmHg and/or DBP: 80–89 mmHg or treated to goal (1 CVH point) | 33.3 | |
| SBP ≥ 140 mmHg and/or DBP ≥ 90 mmHg (0 CVH point) | 61.4 | |
| Fasting glucose (%) | <100 mg/dL (2 CVH points) | 35.4 |
| 100–125 mg/dL or treated to goal (1 CVH point) | 42.7 | |
| ≥126 mg/dL (0 CVH point) | 21.9 | |
| Cardiovascular health score | ||
| CVH score (point, mean ± SD) | 6.56 ± 1.98 | |
| CVH score (%) | Optimal (10–14 points) | 5.2 |
| Average (5–9 points) | 72.9 | |
| Inadequate (0–4 points) | 21.9 | |
| Whole Studied Group (n = 96) | |
|---|---|
| CACS | 194.18 ± 59.48 |
| CAD-RADS | |
| 0 | 19.8 |
| 1 | 20.8 |
| 2 | 47.9 |
| 3 | 6.2 |
| 4 | 3.1 |
| 5 | 1.0 |
| N | 1.0 |
| Ao diastolic diameter (mm) | 33.33 ± 4.26 |
| Ao systolic diameter (mm) | 34.39 ± 4.39 |
| Ao stiffness index | 4.17 ± 0.80 |
| Ao strain (%) | 3.20 ± 2.08 |
| Ao distensibility (cm2/dyn) | 0.14 ± 0.13 |
| AHA Life’s Simple 7 Classification Factor | Ao Stiffness Index | Ao Strain (%) | Ao Distensibility (cm2/dyn) | |
|---|---|---|---|---|
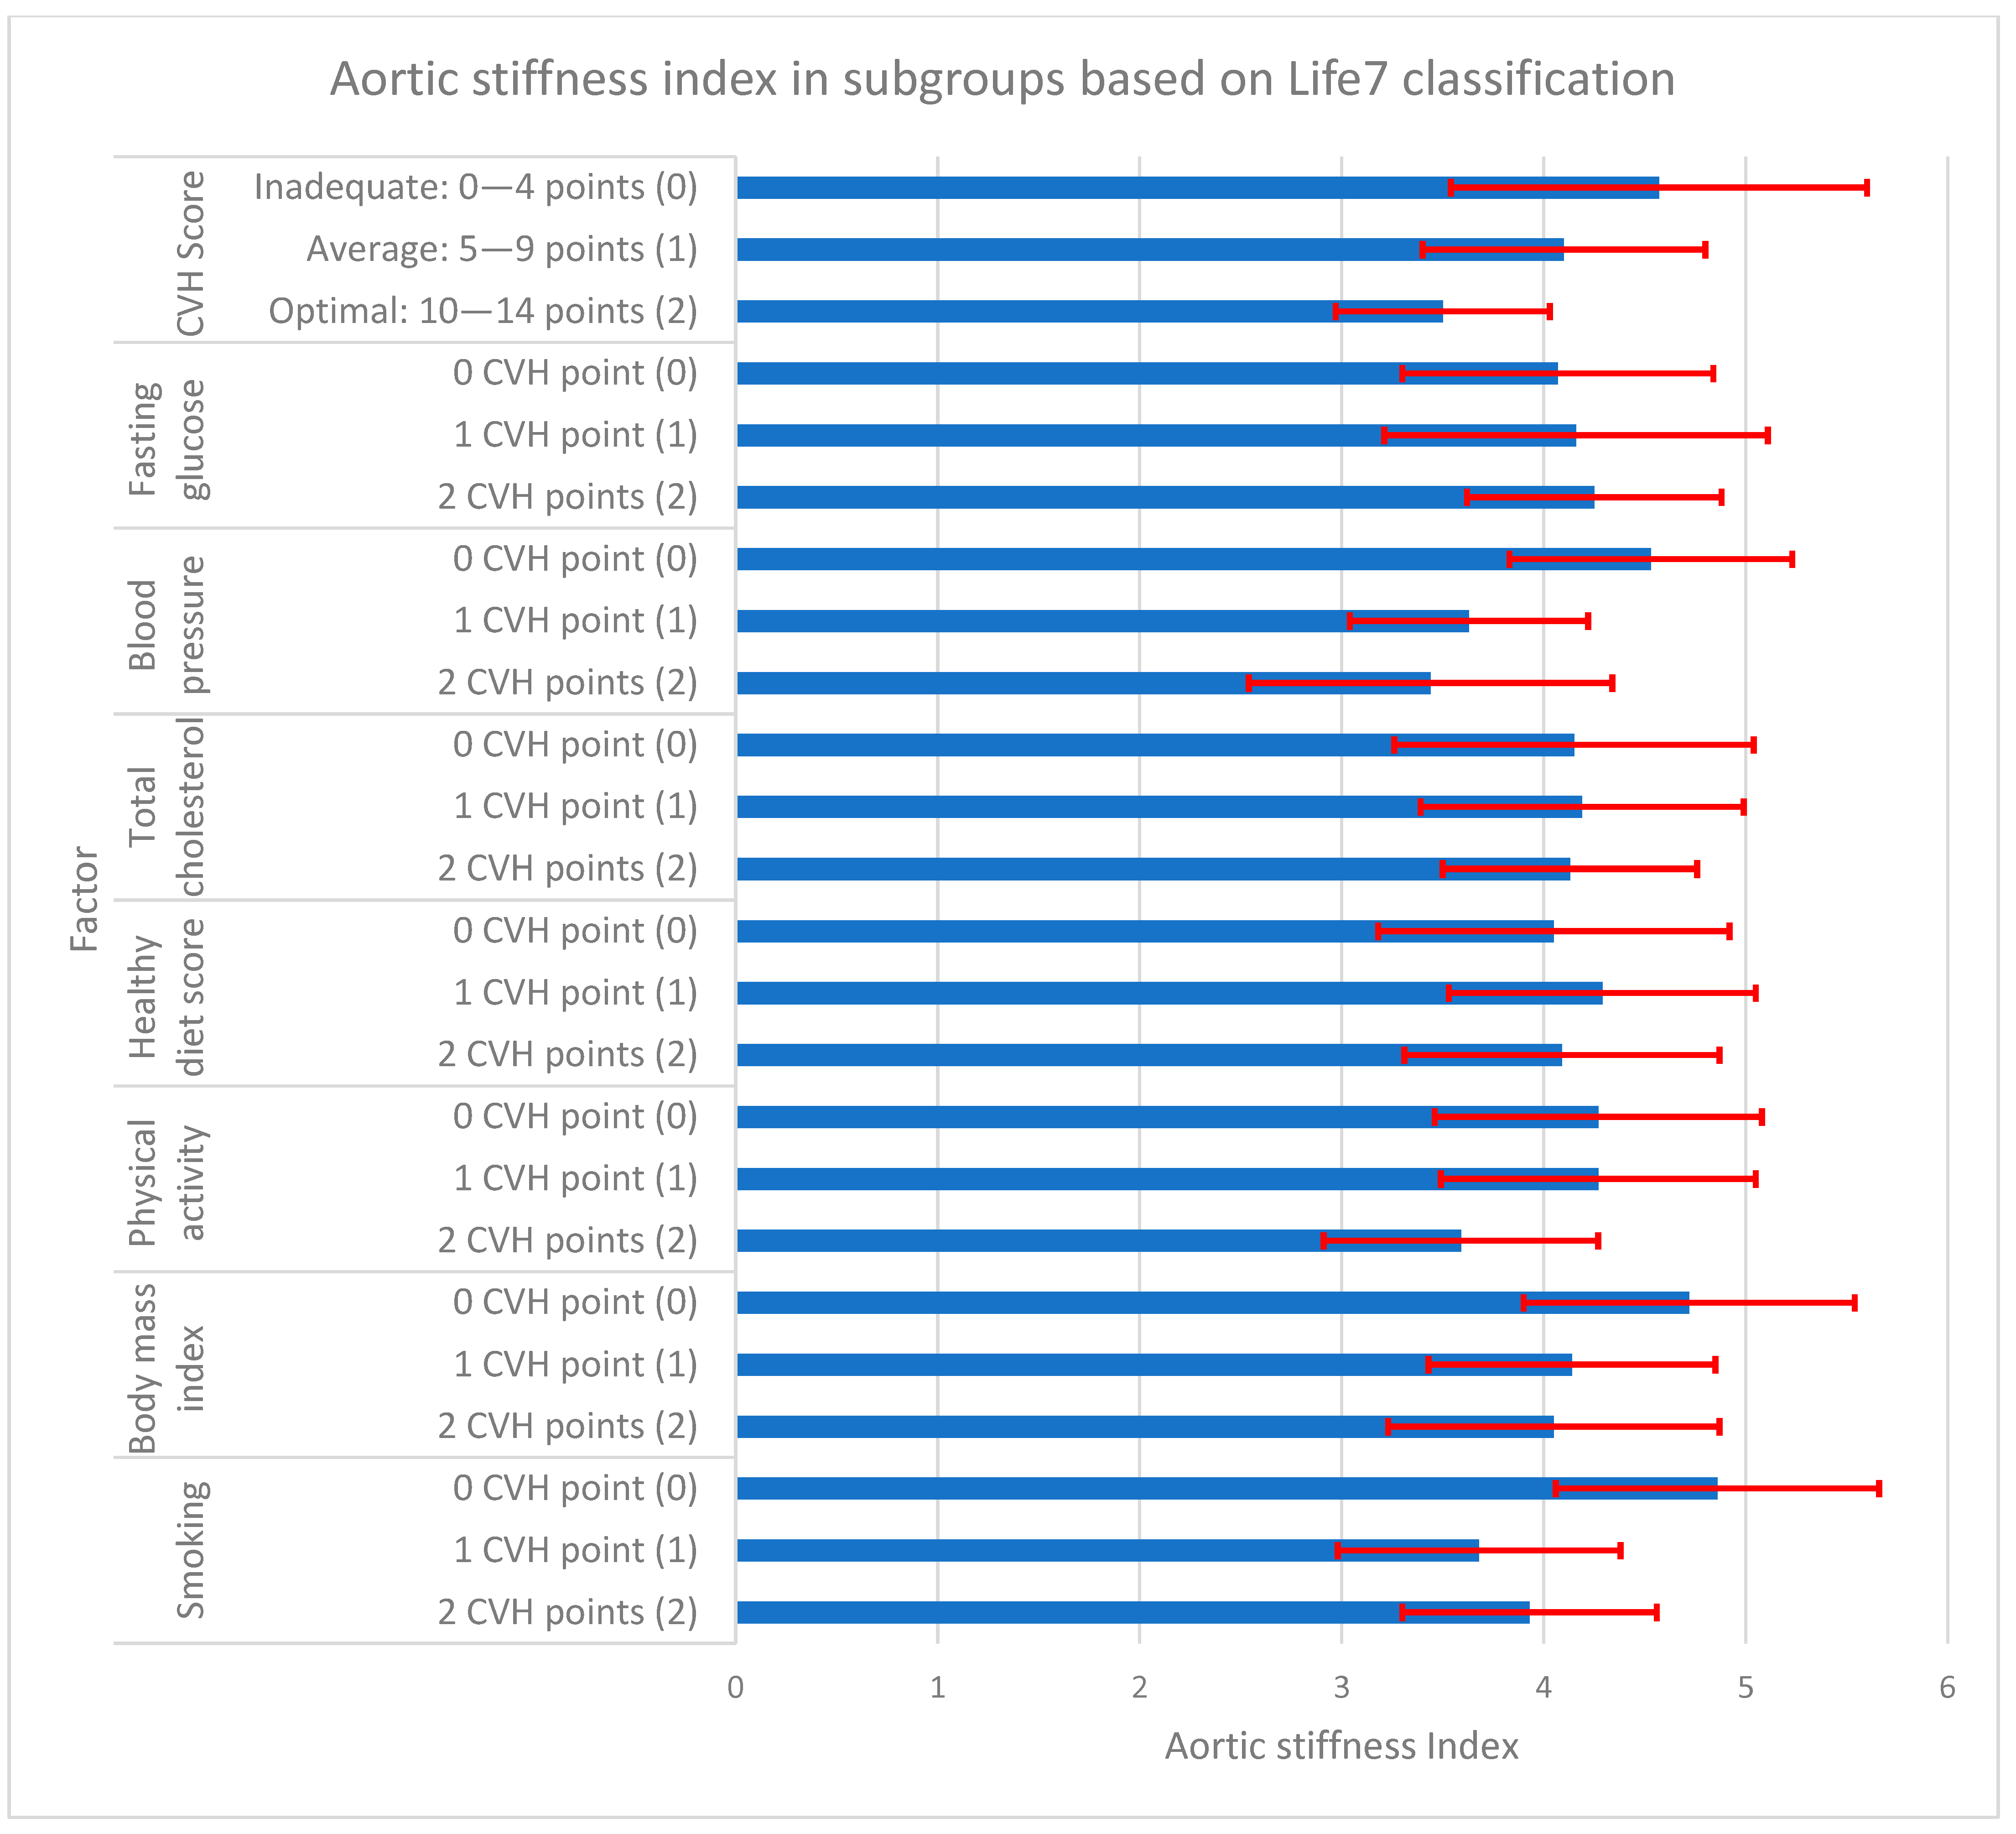
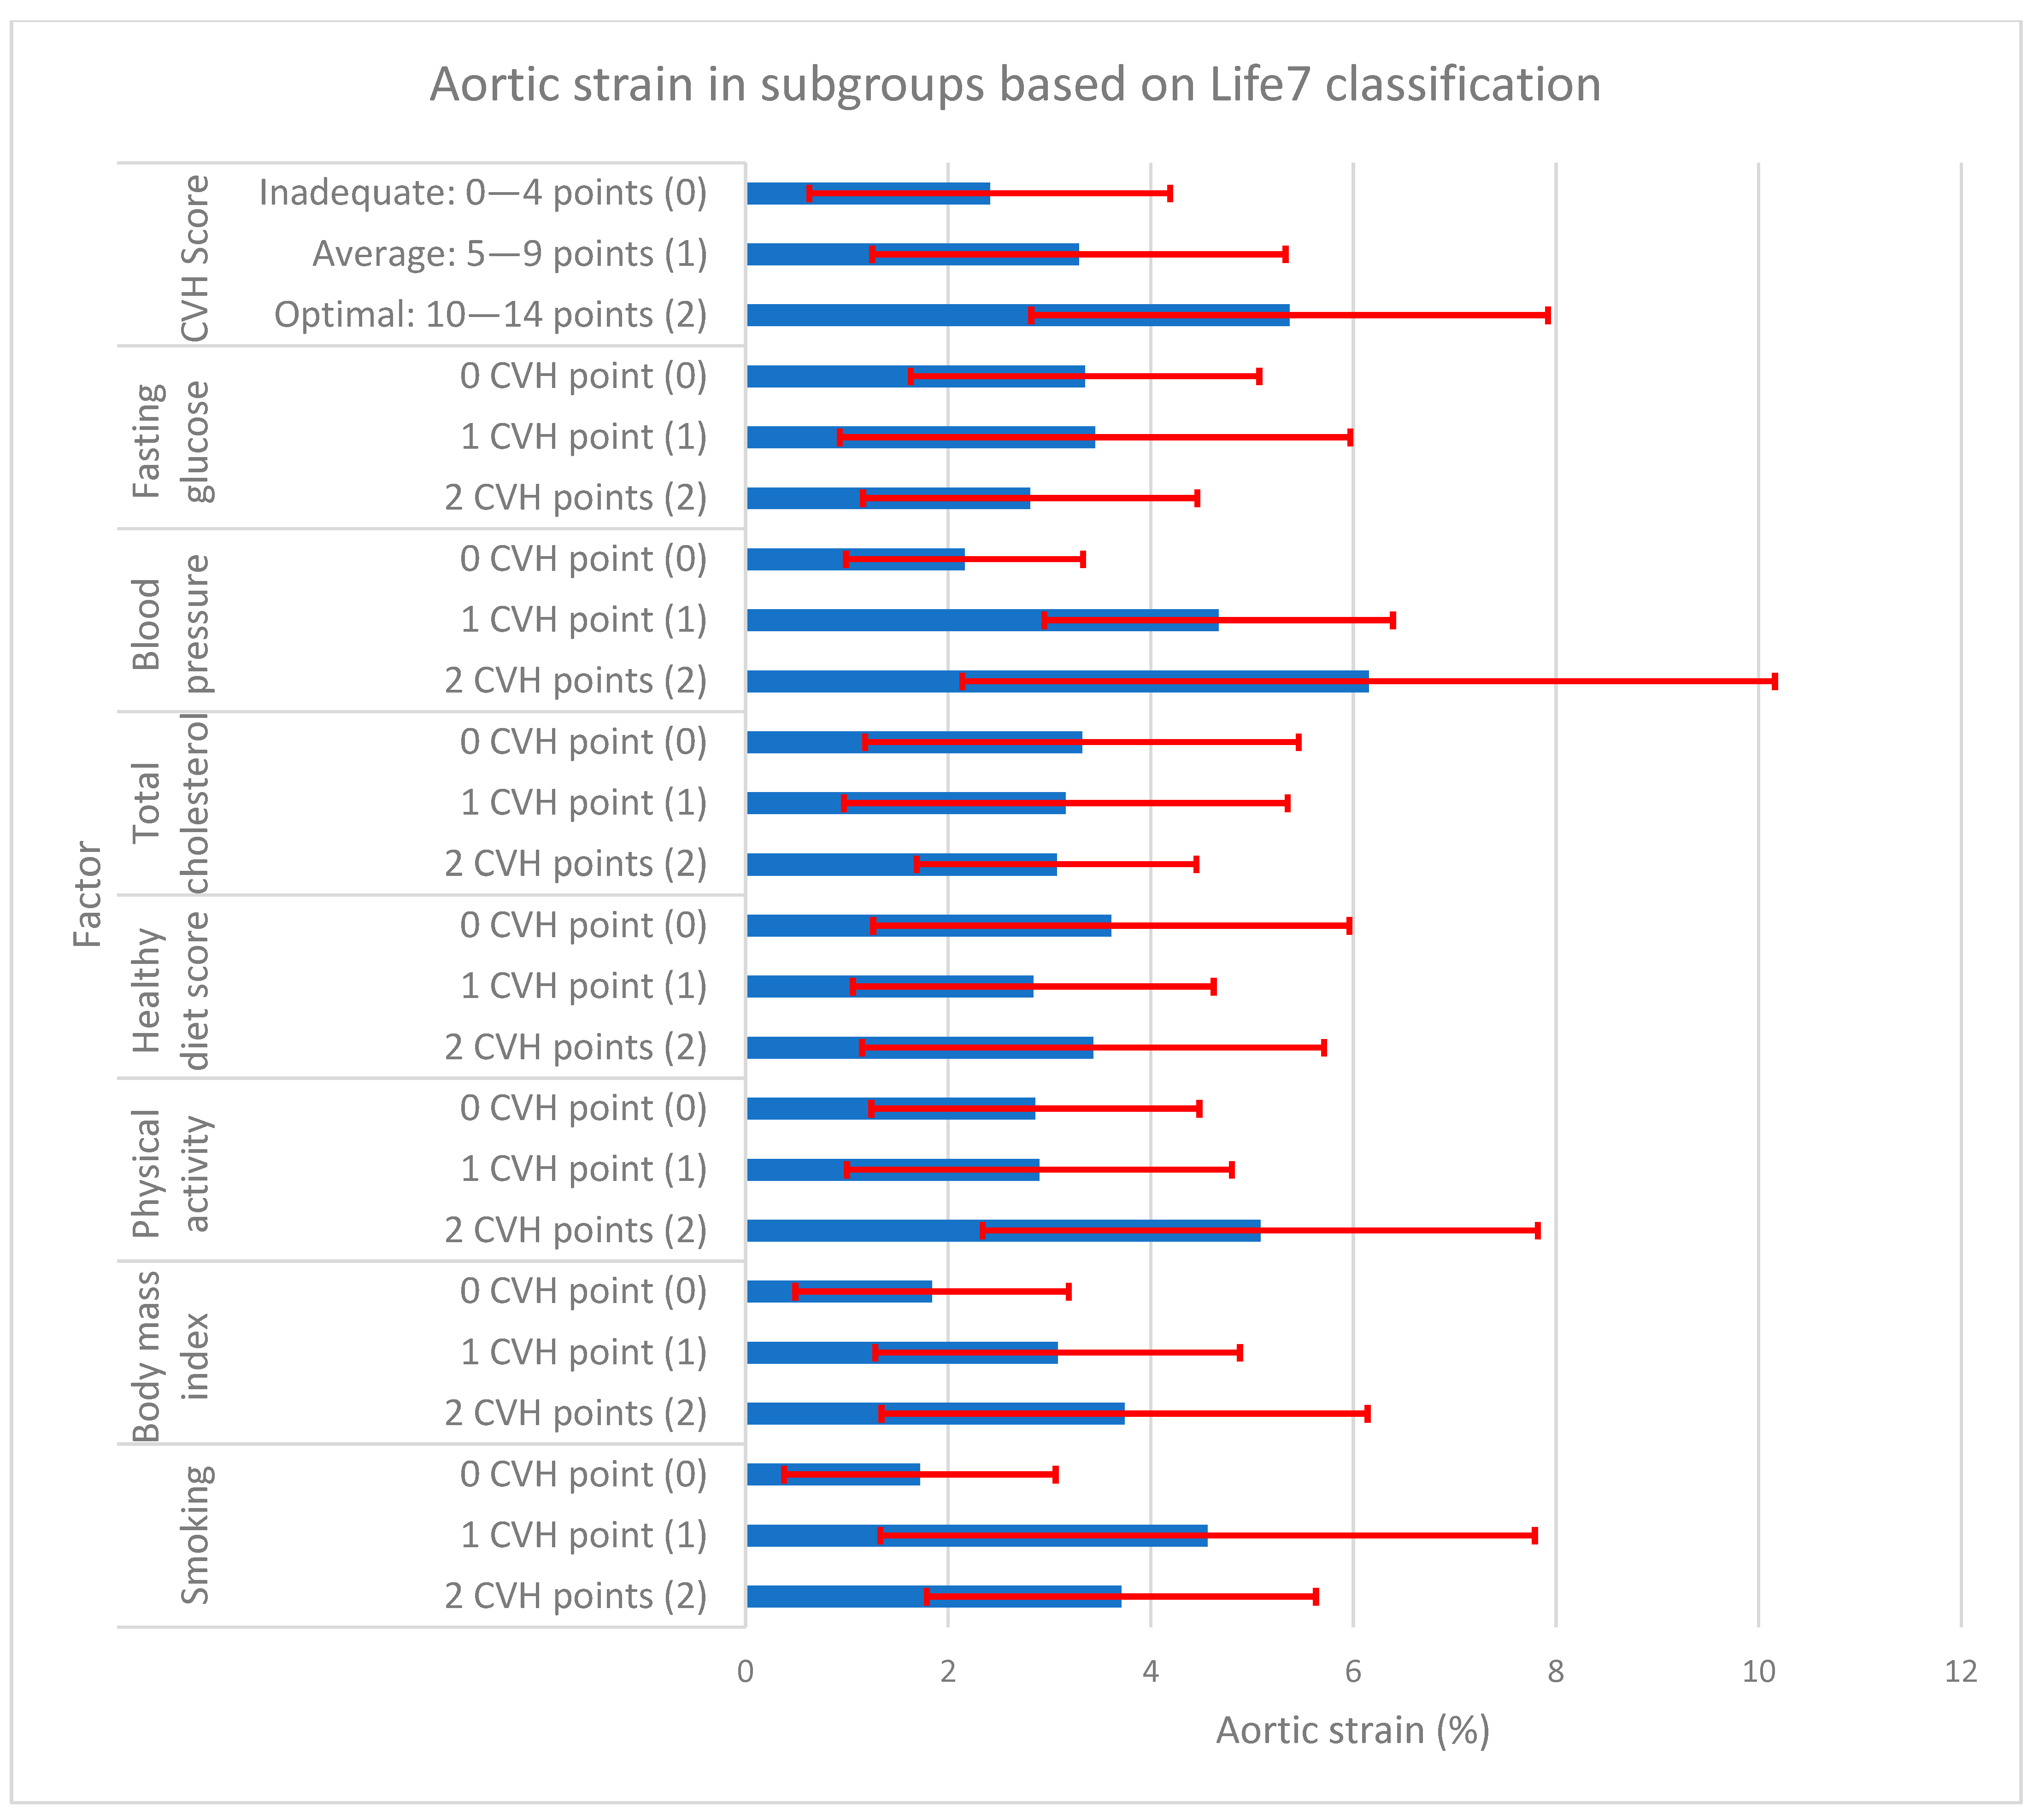
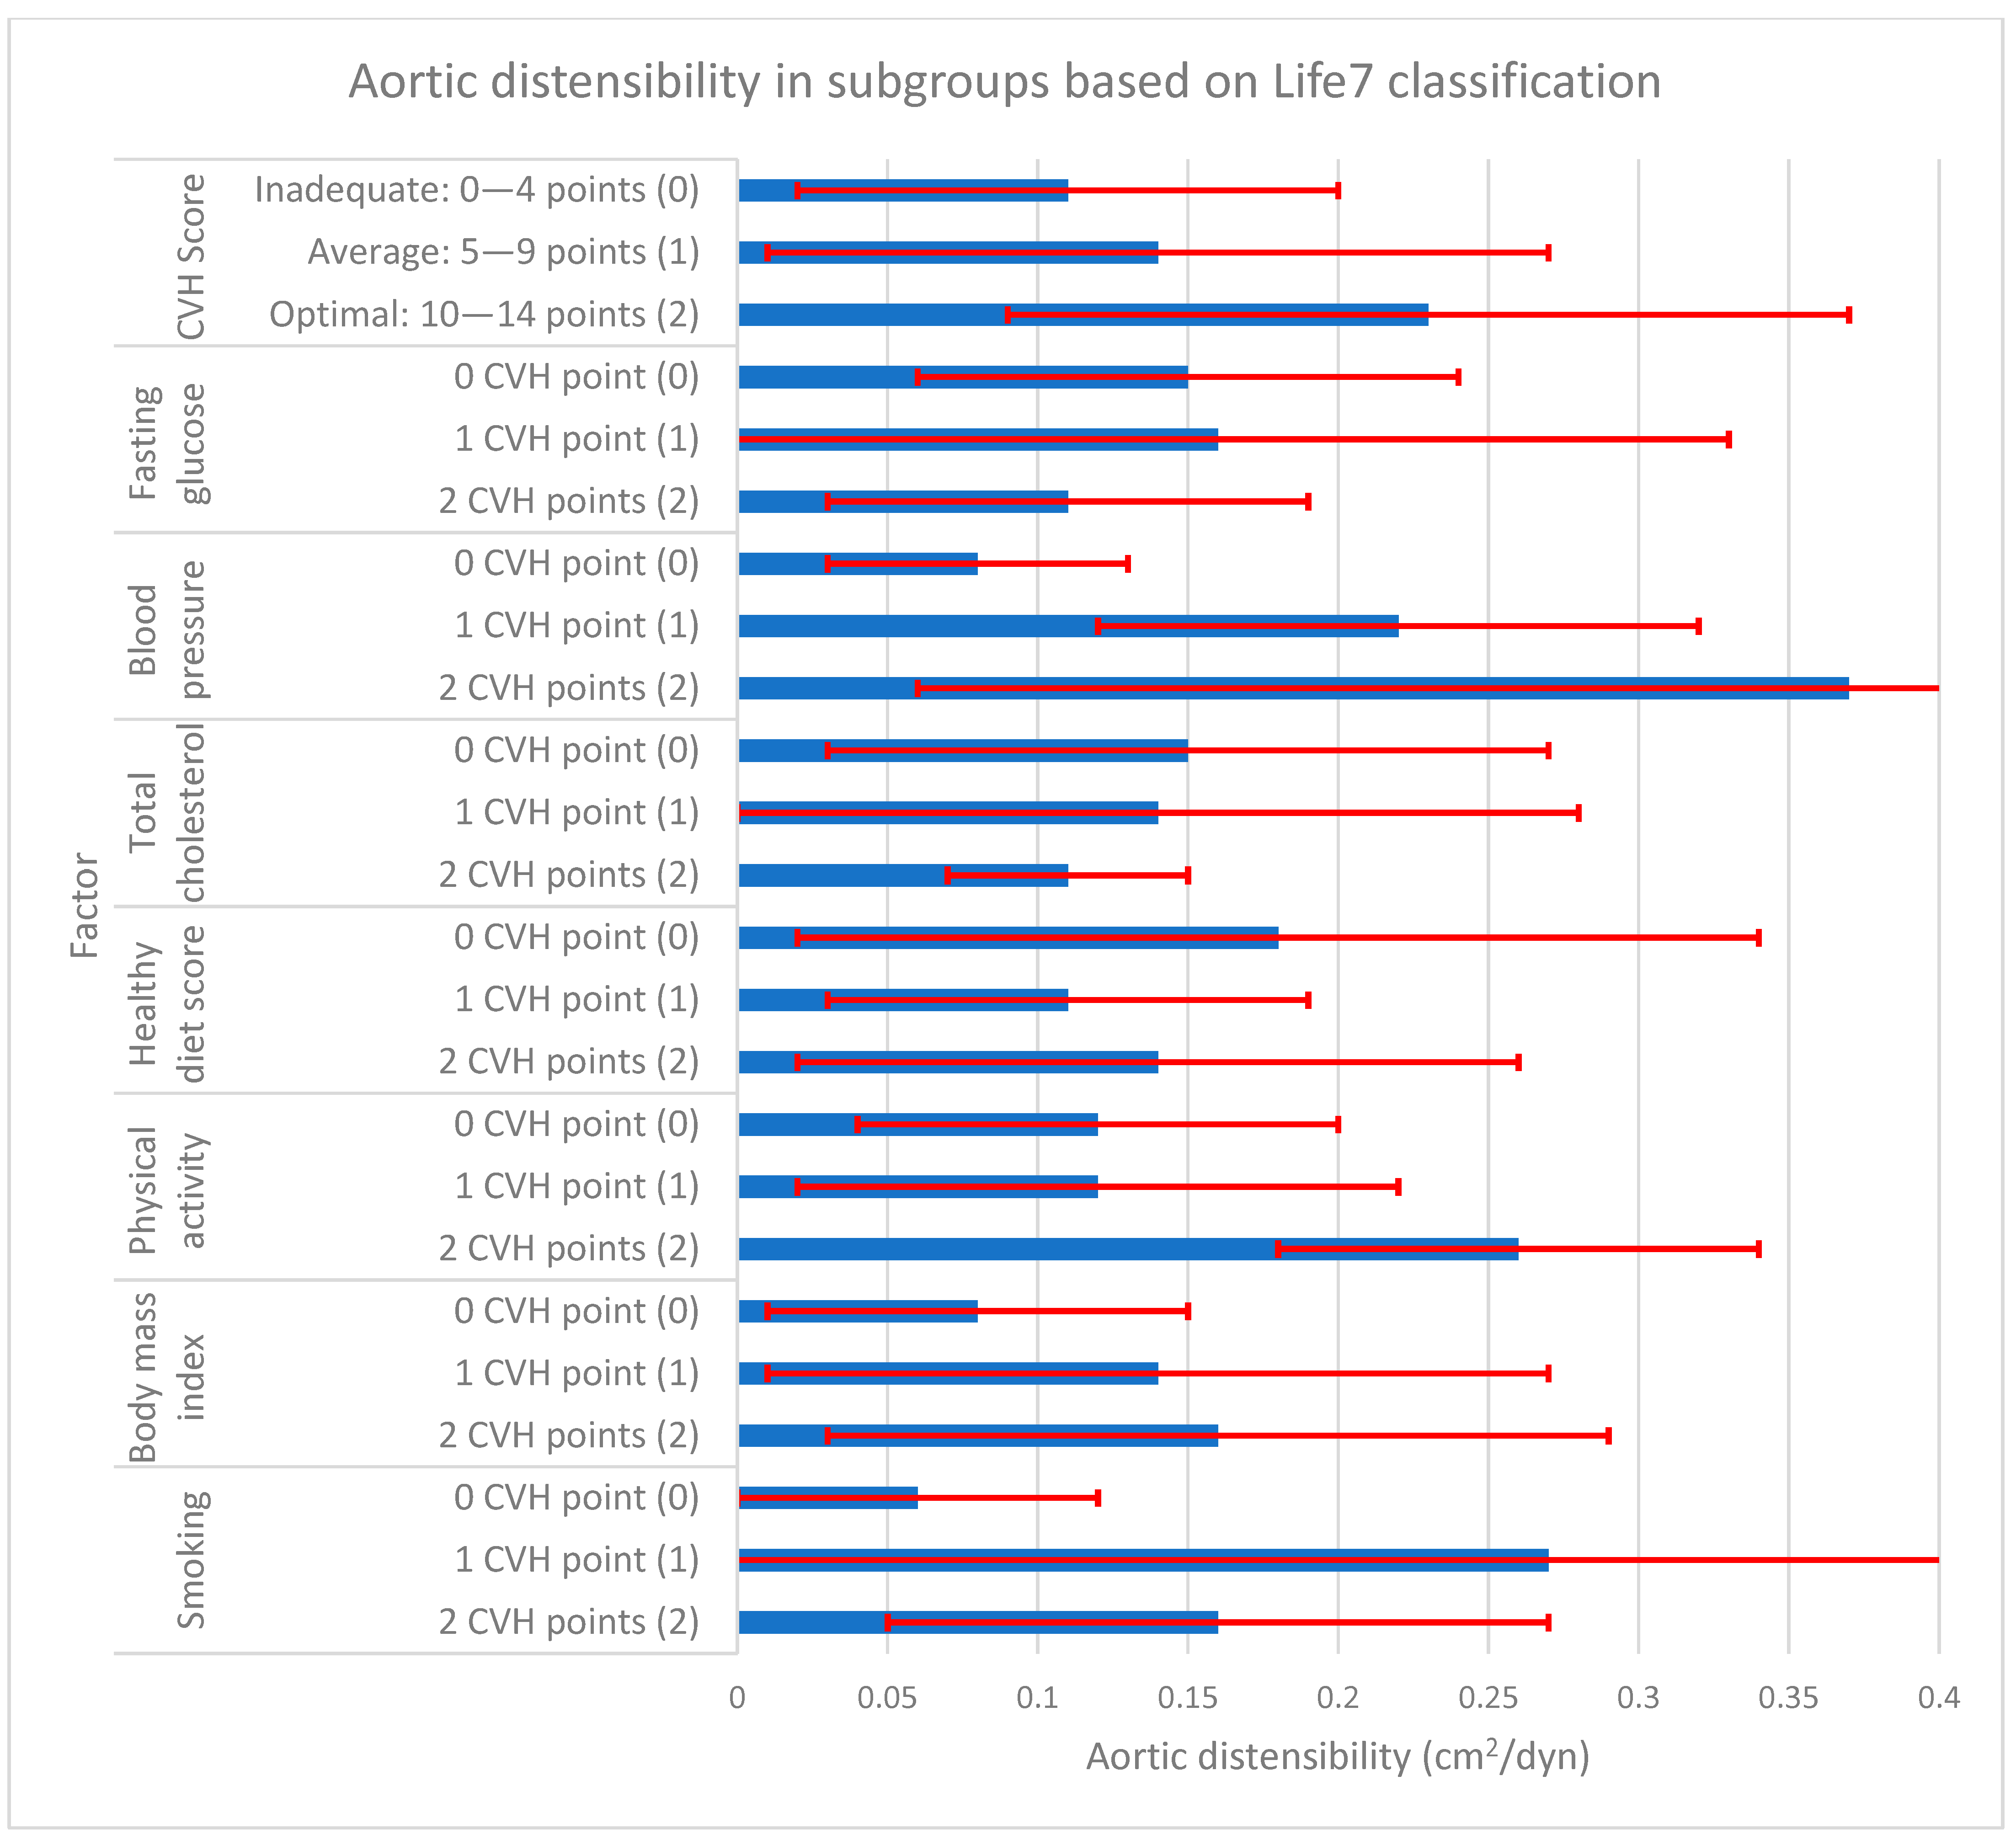
| Smoking | 2 CVH points (2) | 3.93 ± 0.63 | 3.71 ± 1.92 | 0.16 ± 0.11 |
| 1 CVH point (1) | 3.68 ± 0.70 | 4.56 ± 3.23 | 0.27 ± 0.30 | |
| 0 CVH point (0) | 4.86 ± 0.80 | 1.72 ± 1.34 | 0.06 ± 0.06 | |
| p < 0.05 | 2, 1 vs. 0 | 2, 1 vs. 0 | 2, 1 vs. 0 | |
| Body mass index | 2 CVH points (2) | 4.05 ± 0.82 | 3.74 ± 2.40 | 0.16 ± 0.13 |
| 1 CVH point (1) | 4.14 ± 0.71 | 3.08 ± 1.80 | 0.14 ± 0.13 | |
| 0 CVH point (0) | 4.72 ± 0.82 | 1.84 ± 1.35 | 0.08 ± 0.07 | |
| p < 0.05 | 2, 1 vs. 0 | 2 vs. 0 | 2 vs. 0 | |
| Physical activity | 2 CVH points (2) | 3.59 ± 0.68 | 5.08 ± 2.74 | 0.26 ± 0.08 |
| 1 CVH point (1) | 4.27 ± 0.78 | 2.90 ± 1.90 | 0.12 ± 0.10 | |
| 0 CVH point (0) | 4.27 ± 0.81 | 2.86 ± 1.62 | 0.12 ± 0.08 | |
| p < 0.05 | 2 vs. 1, 0 | 2 vs. 1, 0 | 2 vs. 1, 0 | |
| Healthy diet score | 2 CVH points (2) | 4.09 ± 0.78 | 3.43 ± 2.28 | 0.14 ± 0.12 |
| 1 CVH point (1) | 4.29 ± 0.76 | 2.84 ± 1.78 | 0.11 ± 0.08 | |
| 0 CVH point (0) | 4.05 ± 0.87 | 3.61 ± 2.35 | 0.18 ± 0.16 | |
| p < 0.05 | - | - | - | |
| Total cholesterol | 2 CVH points (2) | 4.13 ± 0.63 | 3.07 ± 1.38 | 0.11 ± 0.04 |
| 1 CVH point (1) | 4.19 ± 0.80 | 3.16 ± 2.19 | 0.14 ± 0.14 | |
| 0 CVH point (0) | 4.15 ± 0.89 | 3.32 ± 2.14 | 0.15 ± 0.12 | |
| p < 0.05 | - | - | - | |
| Blood pressure | 2 CVH points (2) | 3.44 ± 0.90 | 6.15 ± 4.01 | 0.37 ± 0.31 |
| 1 CVH point (1) | 3.63 ± 0.59 | 4.67 ± 1.72 | 0.22 ± 0.10 | |
| 0 CVH point (0) | 4.53 ± 0.70 | 2.16 ± 1.17 | 0.08 ± 0.05 | |
| p < 0.05 | 2, 1 vs. 0 | 2, 1 vs. 0 | 2, 1 vs. 0; 2 vs. 1 | |
| Fasting glucose | 2 CVH points (2) | 4.25 ± 0.63 | 2.81 ± 1.65 | 0.11 ± 0.08 |
| 1 CVH point (1) | 4.16 ± 0.95 | 3.45 ± 2.52 | 0.16 ± 0.17 | |
| 0 CVH point (0) | 4.07 ± 0.77 | 3.35 ± 1.72 | 0.15 ± 0.09 | |
| p < 0.05 | - | - | - | |
| Total CVH score | Optimal: 10–14 points (2) | 3.50 ± 0.53 | 5.37 ± 2.55 | 0.23 ± 0.14 |
| Average: 5–9 points (1) | 4.10 ± 0.70 | 3.29 ± 2.04 | 0.14 ± 0.13 | |
| Inadequate: 0–4 points (0) | 4.57 ± 1.03 | 2.41 ± 1.78 | 0.11 ± 0.09 | |
| p < 0.05 | 2, 1 vs. 0 | 2 vs. 1, 0 | 2 vs. 0 | |
| Ao Stiffness Index | Ao Strain (%) | Ao Distensibility (cm2/dyn) | |
|---|---|---|---|
| Age (years) | ns | ns | ns |
| BMI (kg/m2) | 0.20 | −0.24 | ns |
| Systolic blood pressure (mmHg) | 0.61 | −0.66 | −0.69 |
| Diastolic blood pressure (mmHg) | 0.39 | −0.49 | −0.41 |
| Fasting glucose (mg/dL) | ns | ns | ns |
| Total cholesterol (mg/dL) | ns | ns | ns |
| CVH score | −0.48 | 0.48 | 0.36 |
| Model for: Ao Stiffness Index | |||||
| Intercept | Blood Pressure | Smoking | Body Mass Index | ||
| Regression coefficient | 5.211 | −0.669 | −0.409 | −0.242 | |
| SEM of Rc | 0.154 | 0.099 | 0.065 | 0.089 | |
| p | p < 0.001 | p < 0.001 | p < 0.001 | p < 0.05 | |
| p of the model | p < 0.001 | ||||
| Model for: Ao strain (%) | |||||
| Intercept | Blood Pressure | Smoking | Body Mass Index | Physical Activity | |
| Regression coefficient | 0.526 | 2.019 | 0.807 | 0.461 | 0.339 |
| SEM of Rc | 0.041 | 0.245 | 0.158 | 0.219 | 0.096 |
| p | p < 0.01 | p < 0.001 | p < 0.001 | p < 0.05 | p < 0.05 |
| p of the model | p < 0.001 | ||||
| Model for: Ao distensibility (cm2/dyn) | |||||
| Intercept | Blood Pressure | Smoking | |||
| Regression coefficient | 0.028 | 0.139 | 0.037 | ||
| SEM of Rc | 0.008 | 0.015 | 0.010 | ||
| p | p < 0.01 | p < 0.001 | p < 0.001 | ||
| p of the model | p < 0.001 | ||||
Disclaimer/Publisher’s Note: The statements, opinions and data contained in all publications are solely those of the individual author(s) and contributor(s) and not of MDPI and/or the editor(s). MDPI and/or the editor(s) disclaim responsibility for any injury to people or property resulting from any ideas, methods, instructions or products referred to in the content. |
© 2024 by the authors. Licensee MDPI, Basel, Switzerland. This article is an open access article distributed under the terms and conditions of the Creative Commons Attribution (CC BY) license (https://creativecommons.org/licenses/by/4.0/).
Share and Cite
Hajdusianek, W.; Żórawik, A.; Macek, P.; Poręba, M.; Poręba, R.; Gać, P. Stiffness and Elasticity of Aorta Assessed Using Computed Tomography Angiography as a Marker of Cardiovascular Health—A Cross-Sectional Study. J. Clin. Med. 2024, 13, 384. https://doi.org/10.3390/jcm13020384
Hajdusianek W, Żórawik A, Macek P, Poręba M, Poręba R, Gać P. Stiffness and Elasticity of Aorta Assessed Using Computed Tomography Angiography as a Marker of Cardiovascular Health—A Cross-Sectional Study. Journal of Clinical Medicine. 2024; 13(2):384. https://doi.org/10.3390/jcm13020384
Chicago/Turabian StyleHajdusianek, Wojciech, Aleksandra Żórawik, Piotr Macek, Małgorzata Poręba, Rafał Poręba, and Paweł Gać. 2024. "Stiffness and Elasticity of Aorta Assessed Using Computed Tomography Angiography as a Marker of Cardiovascular Health—A Cross-Sectional Study" Journal of Clinical Medicine 13, no. 2: 384. https://doi.org/10.3390/jcm13020384