
Development of a Predictive Model of Cardiovascular Risk in a Male Population from the Peruvian Amazon
 ,
,  ,
,  , and
, and 
Abstract
:1. Introduction
2. Materials and Methods
- Independent variables
- 1.1
- Anthropometric variables: height in centimeters, weight in kilograms, BMI (kg/m2), waist and hip circumference in centimeters, ABSI and BAI indices, and body fat percentage using Deurenberg’s equation [11].
- 1.2
- Analytical variables: capillary glycemia in mg/dL and systolic (SBP) and diastolic (DBP) blood pressure in mmHg.
- 1.3
- The eight items included in the FINDRISC questionnaire to predict DM9:
- Age;
- Previous diagnosis of T2DM in a family member;
- Waist circumference (WC);
- Physical activity of at least 30 min daily;
- Frequency of vegetable intake;
- Use of antihypertensives;
- Previous high blood glucose level;
- BMI.
- The final test scores ranged from 0 to 24 points, with the following interpretation:
- <7 points: low risk level (1%);
- From 7 to 11: light risk level (4%);
- From 12 to 14: moderate risk level (17%);
- From 15 to 20: high risk level (33%);
- More than 20: maximum level of very high risk (50%).
- 1.4
- Sociodemographic variables: age, schooling level (no schooling, elementary, or higher education), employment situation (employed or unemployed), marital status (single, married, widowed, or divorced).
- Outcome variables
- 2.1
- High blood pressure (HBP): following the VII JNC [12], HBP was considered when systolic blood pressure (SBP) reached 140 mmHg or higher and/or diastolic blood pressure (DBP) equaled or exceeded 90 mmHg.
- 2.2
- Diabetes mellitus: the authors applied criteria established by the American Diabetes Association for DM diagnosis [13]:
- 2.2.1
- Fasting plasma glucose values (without having ingested calories in the last eight hours) of 126 mg/dL or higher.
- 2.2.2
- Plasma glucose values equal to or greater than 200 mg/dL after two hours of an oral glucose tolerance test using 75 g of anhydrous glucose dissolved in water.
- 2.2.3
- Patients with classic symptoms of hyperglycemia or hyperglycemic crisis or a random plasma glucose ≥200 mg/dL.
- 2.3
- Cardiovascular risk: co-presence of a minimum of two of the following diseases: HBP, DM, or obesity.
2.1. Ethical Considerations
2.2. Statistical Analysis
3. Results
3.1. Population and Sample
3.2. Bivariate Analysis and Logistic Regression of HBP, DMT2, and CR
3.3. Comparison of Adjusted Models and Diagnostic Accuracy for CR
4. Discussion
4.1. Importance of a Predictive Model for the Amazonian Population
4.2. Comparison with Other Models
4.3. Applicability in the Amazonian Context
4.4. Study Limitations
5. Conclusions
Author Contributions
Funding
Institutional Review Board Statement
Informed Consent Statement
Data Availability Statement
Conflicts of Interest
References
- Davis, J.N.; Oaks, B.M.; Engle-Stone, R. The Double Burden of Malnutrition: A Systematic Review of Operational Definitions. Curr. Dev. Nutr. 2020, 4, nzaa127. [Google Scholar] [CrossRef]
- Popkin, B.M.; Corvalan, C.; Grummer-Strawn, L.M. Dynamics of the Double Burden of Malnutrition and the Changing Nutrition Reality. Lancet 2020, 395, 65–74. [Google Scholar] [CrossRef]
- Abdullah, A. The Double Burden of Undernutrition and Overnutrition in Developing Countries: An Update. Curr. Obes. Rep. 2015, 4, 337–349. [Google Scholar] [CrossRef]
- Pan American Health Organization. Health in the Americas, 2017 Edition Summary: Regional Outlook and Country Profiles; Pan American Health Organization: Washington, DC, USA, 2017. [Google Scholar]
- Alcalde, M.C. Coloniality, Belonging, and Indigeneity in Peruvian Migration Narratives. J. Lat. Am. Caribb. Ethn. 2022, 17, 58–77. [Google Scholar] [CrossRef]
- Segura, L.; Regulo, C.; Parodi, J. Factores de Riesgo de las Enfermedades Cardiovasculares en el Perú (Estudio Tornasol II). Rev. Peru. Cardiol. 2011, 32, 82–128. [Google Scholar]
- Paredes-Aramburú, J.; Bernabé-Ortiz, A. Asociación entre la participación en programas de asistencia alimentaria y patrones del perfil lipídico en Perú. Rev. Chil. Nutr. 2018, 45, 135–143. [Google Scholar] [CrossRef]
- Recio, G.M.; Rojas, R.M.; Rodríguez, M.G.; Abellán, M.V. Nutritional Assessment of the Most Frequently Consumed Dishes in a Slum in Iquitos, Peruvian Amazon. Nutr. Hosp. 2016, 33, 70–79. [Google Scholar] [CrossRef]
- Jacoby, E.; Goldstein, J.; López, A.; Núñez, E.; López, T. Social Class, Family, and Life-Style Factors Associated with Overweight and Obesity among Adults in Peruvian Cities. Prev. Med. 2003, 37, 396–405. [Google Scholar] [CrossRef]
- Lindström, J.; Tuomilehto, J. The diabetes risk score: A practical tool to predict type 2 diabetes risk. Diabetes Care 2003, 26, 725–731. [Google Scholar] [CrossRef]
- López-González, A.A.; Jover, A.M.; Martínez, C.S.; Artal, P.M.; Bote, S.A.; Jané, B.A.; Ramírez-Manent, J.I. The CUN-BAE, Deurenberg Fat Mass, and Visceral Adiposity Index as Confident Anthropometric Indices for Early Detection of Metabolic Syndrome Components in Adults. Sci. Rep. 2022, 12, 1–10. [Google Scholar] [CrossRef]
- Chobanian, A.V.; Roccella, E.J. The JNC 7 Hypertension Guidelines. JAMA 2003, 290, 1312. [Google Scholar] [CrossRef]
- American Diabetes Association. Standards of Medical Care in Diabetes-2016 Abridged for Primary Care Providers. Clin. Diabetes 2016, 34, 3–21. [Google Scholar] [CrossRef] [PubMed]
- Norton, K.I. Standards for Anthropometry Assessment. In Kinanthropometry and Exercise Physiology; Routledge: Abingdon, UK, 2018; pp. 68–137. [Google Scholar]
- Stergiou, G.S.; Palatini, P.; Asmar, R.; Ioannidis, J.P.; Kollias, A.; Lacy, P.; McManus, R.J.; Myers, M.G.; Parati, G.; Shennan, A. Recommendations and Practical Guidance for Performing and Reporting Validation Studies According to the Universal Standard for the Validation of Blood Pressure Measuring Devices (AAMI/ESH/ISO). J. Hypertens. 2019, 37, 459–466. [Google Scholar] [CrossRef]
- Cohen, J.B.; Brady, T.M. Validation of Blood Pressure Device Accuracy: When the Bottom Line Is Not Enough. Circulation 2022, 145, 94–96. [Google Scholar] [CrossRef]
- Pagana, K.D.; Pagana, T.J.; Pagana, T.N. Mosby’s® Diagnostic and Laboratory Test Reference-E-Book; Elsevier Health Sciences: Amsterdam, The Netherlands, 2022; pp. 85–97. [Google Scholar]
- Vargas, R.S.V. Informe Técnico: Estado Nutricional de Adolescentes de 12 a 17 Años y Adultos Mayores de 60 Años a Más—VIANEV 2017–2018; Ministerio de Salud: Lima, Perú, 2019; pp. 46–48.
- Huaquía-Díaz, A.M.; Chalán-Dávila, T.S.; Carrillo-Larco, R.M.; Bernabe-Ortiz, A. Multimorbidity in Latin America and the Caribbean: A Systematic Review and Meta-Analysis. BMJ Open 2021, 11, e050409. [Google Scholar] [CrossRef] [PubMed]
- Perú Perfil Sociodemográfico: Informe Nacional 2017; El Instituto Nacional de Estadística e Informática-INEI: Lima, Perú, 2017.
- Paz-Krumdiek, M.; Rodriguez-Vélez, S.G.; Mayta-Tristán, P.; Bernabe-Ortiz, A. Association between Sitting Time and Obesity: A Population-based Study in Peru. Nutr. Diet. 2020, 77, 189–195. [Google Scholar] [CrossRef] [PubMed]
- López-González, Á.A.; García-Agudo, S.; Tomás-Salvá, M.; Vicente-Herrero, M.T.; Queimadelos-Carmona, M.; Campos-González, I. FINDRISC Test: Relationship between cardiovascular risk parameters and scales in Spanish Mediterranean population. Rev. Med. Inst. Mex. Seguro Soc. 2017, 55, 309. [Google Scholar]
- Molina Luque, R.; Alcaide-Leyva, J.M. El riesgo cardiovascular y su situación actual en la Amazonía peruana. In Aproximaciones a la Pluralidad Alimentaria Iberoamericana, 1st ed.; Moreno Rojas, R., Martínez-Álvarez, J.R., Eds.; El Jardín de los Curiosos: Madrid, Spain, 2020; Volume 3, pp. 158–200. [Google Scholar]
- Carrillo-Larco, R.M.; Altez-Fernandez, C.; Pacheco-Barrios, N.; Bambs, C.; Irazola, V.; Miranda, J.J.; Danaei, G.; Perel, P. Cardiovascular Disease Prognostic Models in Latin America and the Caribbean: A Systematic Review. Glob. Heart 2019, 14, 81–93. [Google Scholar] [CrossRef]
- Jackson-Morris, A.M.; Mutungi, G.; Maree, E.; Waqanivalu, T.; Marten, R.; Nugent, R. ‘Implementability’ Matters: Using Implementation Research Steps to Guide and Support Non-Communicable Disease National Planning in Low-Income and Middle-Income Countries. BMJ Glob. Health 2022, 7, e008275. [Google Scholar] [CrossRef]
- León-Jiménez, F.; Barreto-Pérez, D.; Altamirano-Cardozo, L.; Loayza-Enríquez, B.; Farfán-García, J. Health status evaluation of type 2 diabetes patients from two hospitals of northern Peru. Rev. Cuerpo Med. 2021, 14, 330–336. [Google Scholar] [CrossRef]
- Yang, L.; Wu, H.; Jin, X.; Zheng, P.; Hu, S.; Xu, X.; Yu, W.; Yan, J. Study of Cardiovascular Disease Prediction Model Based on Random Forest in Eastern China. Sci. Rep. 2020, 10, 5245. [Google Scholar] [CrossRef] [PubMed]
- Alaa, A.M.; Bolton, T.; Angelantonio, E.D.; Rudd, J.H.F.; van der Schaar, M. Cardiovascular Disease Risk Prediction Using Automated Machine Learning: A Prospective Study of 423,604 UK Biobank Participants. PLoS ONE 2019, 14, e0213653. [Google Scholar] [CrossRef] [PubMed]
- D’Agostino Sr, R.B.; Vasan, R.S.; Pencina, M.J.; Wolf, P.A.; Cobain, M.; Massaro, J.M.; Kannel, W.B. General Cardiovascular Risk Profile for Use in Primary Care: The Framingham Heart Study. Circulation 2008, 117, 743–753. [Google Scholar] [CrossRef]
- Romero-Saldaña, M.; Fuentes-Jiménez, F.J.; Vaquero-Abellán, M.; Álvarez-Fernández, C.; Molina-Recio, G.; López-Miranda, J. New Non-Invasive Method for Early Detection of Metabolic Syndrome in the Working Population. Eur. J. Cardiovasc. Nurs. 2016, 15, 549–558. [Google Scholar] [CrossRef] [PubMed]
- United Nations. World Economic Situation and Prospects; DESA Publications: New York, NY, USA, 2023; pp. 118–119. [Google Scholar]
- León-Mendoza, J.C. Emprendimiento empresarial y crecimiento económico en Perú. Estud. Gerenc. 2019, 35, 429–439. [Google Scholar] [CrossRef]
- Berner, K.; Tawa, N.; Louw, Q. Multimorbidity Patterns and Function among Adults in Low-and Middle-Income Countries: A Scoping Review Protocol. Syst. Rev. 2022, 11, 139. [Google Scholar] [CrossRef]
- Alae-Carew, C.; Scheelbeek, P.; Carrillo-Larco, R.M.; Bernabé-Ortiz, A.; Checkley, W.; Miranda, J.J. Analysis of Dietary Patterns and Cross-Sectional and Longitudinal Associations with Hypertension, High BMI and Type 2 Diabetes in Peru. Public Health Nutr. 2020, 23, 1009–1019. [Google Scholar] [CrossRef]
- García Rodríguez, M.; Romero Saldaña, M.; Alcaide Leyva, J.M.; Moreno Rojas, R.; Molina Recio, G. Design and Validation of a Food Frequency Questionnaire (FFQ) for the Nutritional Evaluation of Food Intake in the Peruvian Amazon. J. Health Popul. Nutr. 2019, 38, 1–11. [Google Scholar] [CrossRef]


| Variable | n or Mean (% or SD) |
|---|---|
| Age | 42.9 (16.9) |
| Marital status | |
| Married | 275 (75.5) |
| Single | 89 (25.5) |
| Level of education | |
| None/Primary | 279 (76.6) |
| Secondary/University | 85 (23.4) |
| Employment status | |
| Employed | 99 (27.3) |
| Unemployed | 264 (72.7) |
| Nutritional status | |
| Normal weight | 154 (42.2) |
| Overweight | 136 (37.5) |
| Obesity | 74 (20.3) |
| BMI (kg/m2) | 26.5 (4.5) |
| WHtR | 0.56 (0.06) |
| WC (cm) | 88.9 (10.7) |
| WHR | 0.96 (0.06) |
| ABSI | 0.07 (0.005) |
| BAI | 28.2 (4.3) |
| DFT (%) | 25.5 (6.6) |
| HC (cm) | 92.4 (7.5) |
| Variable | DMT2 Yes (n = 6) | DMT2 No (n = 357) | OR | IC95% OR | p |
|---|---|---|---|---|---|
| Age | 46.2 | 42.9 | 1.01 | (0.966–1.058) | 0.633 |
| Marital status | |||||
| Married | 6 (2.2) | 269 (97.8) | 1 | ||
| Single | 0 (0) | 89 (100) | 1.23 | 0.89 | |
| Level of education | |||||
| None/Primary | 5(1.8) | 274 (98.2) | 1 | ||
| Secondary/University | 1(1.2) | 84 (98.8) | 0.652 | (0.075–5.662) | 0.69 |
| Employment status | |||||
| Employed | 259 (98.1) | 5 (1.9) | 1 | ||
| Unemployed | 98 (99) | 1(1) | 1.89 | (0.218–16.4) | 0.55 |
| Anthropometric indexes (nutritional status) | |||||
| Normal weight | 2 (1.3) | 152 (98.7) | 1 | ||
| Overweight | 1 (0.7) | 135 (99.3) | 1.47 | (0.267–8.161) | 0.656 |
| Obesity | 3 (4.1) | 71 (95.9) | 1.11 | (0.952–1.284) | 0.190 |
| BMI | 28.9 (3.8) | 26.4 (4.5) | 3.37 | (0.962–11.84) | 0.057 |
| WHtR | 0.61(0.067) | 0.55 (0.07) | 1.06 | (0.989–1.142) | 0.100 |
| WC | 96.2 (9.91) | 88.8 (10.7) | 1.01 | (0.996–1.005) | 0.800 |
| HC | 97.17 (7.44) | 92.34 (7.86) | 1.078 | (0.981–1.184) | 0.11 |
| WHR | 0.98 (0.06) | 0.95 (0.07) | 1.11 | (0.99–1.24 | 0.056 |
| ABSI | 0.08 (0.004) | 0.07 (0.005) | 2.34 | (0.508–10.83) | 0.275 |
| BAI | 31.7 (5.6) | 28.1 (4.3) | 1.15 | (1.001–1.341) | <0.05 |
| DFP | 29.1 (7.2) | 25.4 (6.6) | 1.08 | (0.96–1.22) | 0.180 |
| FINDRISC | |||||
| Low risk 0–14 | 4 (1.1) | 347 (98.9) | 1 | <0.001 | |
| High risk 15–24 | 2 (15.4) | 11 (84.6) | 15.73 | (2.606–95.45) | |
| Q2. NO family history of DM | 2 (2.7) | 71 (97.3) | 1 | 0.291 | |
| Family history of DM | 3 (1) | 282 (99) | 2.64 | (0.43–16.14) | |
| Q4 > 30 min physical activity | 2 (1) | 194 (99) | 1.35 | (0.550–3.33) | 0.550 |
| <30 min physical activity | 2 (1.9) | 159 (98.1) | 1 | ||
| Q5. Daily intake of fruits, vegetables, etc. | 3 (1.1) | 259 (98.9) | 0.544 | (0.09–3.3) | 0.504 |
| NO daily intake of fruits, vegetables | 2 (2.1) | 94 (97.9) | 1 | ||
| Q6. No history of HBP drugs | 4 (1.2) | 318 (98.8) | 1.5 | (0.49–4.57) | 0.470 |
| History of HBP drugs | 1 (2.8) | 35 (97.2) | 0.41 | ||
| Q3. WC no risk | 2 (1.4) | 138 (98.6) | 1 | ||
| WC risk | 4 (1.8) | 220 (98.2) | 1.255 | (0.23–6.941) | 0.795 |
| Variable | HBP YES = 82 (22.52%) | HBP NO = 281 (77.2%) | p | OR | IC (18.09–26.95) | p |
|---|---|---|---|---|---|---|
| Age | 52.8 (15.03) | 40.07 (16.31) | 0.001 | 1.04 | (1.030–1.062) | 0.001 |
| Marital status | ||||||
| Married | 66 (21.1%) | 208 (75.9%) | 0.24 | 1 | ||
| Single | 16 (18%) | 73 (82%) | 0.69 | (0.376–1.268) | 0.23 | |
| Level of education | ||||||
| None/Primary | 62 (22.3%) | 216 (77.7%) | 0.882 | 1 | ||
| Secondary/University | 20 (23.5%) | 65 (76.5%) | 1.07 | (0.603–1.905) | 0.81 | |
| Employment status | ||||||
| Employed | 20 (20.3%) | 79 (79.8%) | 0.57 | 1 | ||
| Unemployed | 62 (23.6%) | 201 (76.4%) | 1.21 | (0.691–2.149) | 0.495 | |
| Anthropometric indexes (nutritional status) | ||||||
| Normal weight | 22 (14.4%) | 131 (85.6%) | 0.001 | 1 | ||
| Overweight | 32 (23.5%) | 104 (75.6%) | 0.001 | 2.38 | (1.385–4.095) | 0.005 |
| Obesity | 28 (51.85%) | 26 (48.14%) | 0.001 | 1.11 | (1.048–1.167) | 0.001 |
| BMI | 0.59 (0.061) | 0.54 (0.067) | 0.001 | 1.1 | (1.04–1.16) | 0.001 |
| WHtR | 94.79 (10.15) | 87.22 (10.23) | 0.001 | 1.1 | (1.06–1.14) | 0.001 |
| WC | 94.79 (1.12) | 87.22 (0.61) | 0.001 | 1.07 | (1.04–1.09) | 0.001 |
| WHR | 0.99 (0.059) | 0.95 (0.067) | 0.001 | 2.59 | (1.7–3.9) | 0.001 |
| ABSI | 0.08 (0.005) | 0.07 (0.004) | 0.001 | 3.09 | (1.79–5.31) | 0.001 |
| BAI | 29.61 (3.83) | 27.75 (4.35) | 0.001 | 1.1 | (1.040–1.164) | 0.001 |
| DFP | 29.69(5.8) | 24.25(6.31) | 0.001 | 1.14 | (1.09–1.2) | 0.001 |
| FINDRISC | ||||||
| Low risk 0–14 | 73(20.9%) | 227 (79.1%) | 0.001 | 1 | ||
| High risk 15–24 | 9 (69.2%) | 4 (30.8%) | 8.53 | (2.55–28.5) | 0.001 | |
| Q2. NO family history of DM | 64 (22.5%) | 221 (77.5%) | 0.473 | 1 | ||
| Family history of DM | 17 (23.6%) | 55 (76.4%) | 1.06 | 0.579–1.96) | 0.83 | |
| Q4 > 30 min physical activity | 162 (82.7%) | 34 (17.3%) | 0.005 | 1 | ||
| <30 min physical activity | 47 (29.2%) | 114 (70.8%) | 1.96 | (1.18–3.24) | 0.008 | |
| Q5. Daily intake of fruits, vegetables, etc. | 65 (24.9%) | 196 (75.1%) | 0.064 | 1 | ||
| NO daily intake of fruits, vegetables | 16 (16.7%) | 80 (83.3%) | 1.65 | (0.9–3.03) | 0.102 | |
| Q6. No history of HBP drugs | 57 (17.8%) | 254 (82.2%) | 0.001 | 1 | ||
| History HBP of drugs | 24 (66.7%) | 12 (33.3%) | 3.04 | (2.09–4.42) | 0.001 | |
| Q3. WC no risk | 36 (16%) | 189 (84%) | 0.001 | 1 | ||
| WC risk | 43 (33.9%) | 84 (66.1%) | 2.68 | (1.61–4.48) | 0.001 | |
| Variable | CR YES = 30 (8.24%) | CR NO = 333 (91.5%) | p | OR | IC (5.27–11.20) | p |
|---|---|---|---|---|---|---|
| Age | 47.73 (12.91) | 42.51(17.14) | 0.105 | 1.04 | (1.030–1.062) | 0.001 |
| Marital status | ||||||
| Married | 26 (9.5%) | 248 (90.5%) | 0.183 | 1 | ||
| Single | 4 (4.5) | 85 (95.5%) | 0.69 | (0.376–1.268) | 0.23 | |
| Level of education | ||||||
| None/Primary | 23 (8.3%) | 255 (91.7%) | 1 | |||
| Secondary/University | 7 (8.2%) | 78 (91.8%) | 1.07 | (0.603–1.905) | 0.81 | |
| Employment status | ||||||
| Employed | 3 (3%) | 96 (97%) | 0.03 | 1 | ||
| Unemployed | 27 (10.3%) | 236 (89.7%) | 1.21 | (0.691–2.149) | 0.495 | |
| Anthropometric indexes (nutritional status) | ||||||
| Normal weight | 1 (0.7%) | 152 (99.3%) | 0.000 | 1 | ||
| Overweight | 0 | 136 (100%) | 2.38 | (1.385–4.095) | 0.002 | |
| Obesity | 29 (39.2%) | 45 (60.8) | 1.11 | (1.048–1.167) | 0.001 | |
| BMI | 33.05 (3.66) | 25.89 (4.06) | 0.001 | 1.1 | (1.04–1.16) | 0.001 |
| WHtR | 0.65 (0.04) | 0.55 (0.065) | 0.001 | 1.12 | (1.048–1.167) | 0.001 |
| WC | 103.88 (7.11) | 87.58 (9.9) | 0.001 | 1.07 | (1.04–1.09) | 0.001 |
| WHR | 1.01 (0.04) | 0.95 (0.067) | 0.001 | 1 | (0.999–1.002) | 0.645 |
| ABSI | 0.08 (0.003) | 0.08 (0.005) | 0.621 | 3.09 | (1.798–5.319) | 0.001 |
| BAI | 32.81 (3.47) | 27.75 (4.15) | 0.001 | 1.1 | (1.040–1.164) | 0.001 |
| DFP | 34.44(5.15) | 24.67(6.1) | 0.001 | 1.32 | (1.21–1.44) | 0.001 |
| FINDRISC | ||||||
| Low risk 0–14 | 1 | |||||
| High risk 15–24 | 22 (6.3%) | 328 (93.7%) | 0.001 | 8.53 | (2.55–28.5) | 0.001 |
| Q2. NO family history of DM | 8 (61.5%) | 5 (38.5%) | 0.001 | 1 | ||
| Family history of DM | 20 (7%) | 365 (93%) | 0.104 | 1067 | 0.579–1.96) | 0.83 |
| Q4 > 30 min physical activity | 9 (12.5%) | 63 (87.5%) | 0.104 | 1 | ||
| <30 min physical activity | 13 (6.6%) | 183 (93.4%) | 0.173 | 1.96 | (1.18–3.24) | 0.008 |
| Q5. Daily intake of fruits, vegetables, etc. | 16 (9.9%) | 145 (90.1%) | 0.173 | 1 | ||
| NO daily intake of fruits, vegetables | 23 (8.8%) | 238 (91.2%) | 0.292 | 1.65 | (0.9–3.03) | 0.102 |
| Q6. No history of HBP drugs | 6 (6.3%) | 90 (93.8%) | 0.292 | 1 | ||
| History of HBP drugs | 18 (5.6%) | 303 (94.4%) | 0.001 | 3.04 | (2.09–4.42) | 0.001 |
| Q3. WC no risk | 11 (30.6%) | 25 (69.4%) | 0.001 | 1 | ||
| WC risk | 2 (0.6%) | 331 (99.4%) | 0.001 | 2.68 | (1.61–4.48) | 0.001 |
| Cardiovascular Risk | ß | OR | IC 95% | p | r2 | Hosmer and Lemshow | AUC |
|---|---|---|---|---|---|---|---|
| Model 1 | 0.62 | 0.292 | 0.92 | ||||
| SBP (qualitative) | 4.04 | 56.8 | (15.16–214.21) | 0.001 | |||
| HC | 0.234 | 1.26 | (1.15–1.38) | 0.001 | |||
| Model 2 | 0.54 | 0.95 | 0.94 | ||||
| SBP (quantitative) | 0.076 | 1.07 | (1–05-1.1) | 0.001 | |||
| WC | 0.233 | 1.26 | (1.16–1.36) | 0.001 | |||
| Model 3 | 0.53 | 0.76 | 0.93 | ||||
| SBP | 0.059 | 1.06 | (1.03–1.08) | 0.001 | |||
| WC | 0.171 | 1.18 | (1.11–1.26) | 0.001 | |||
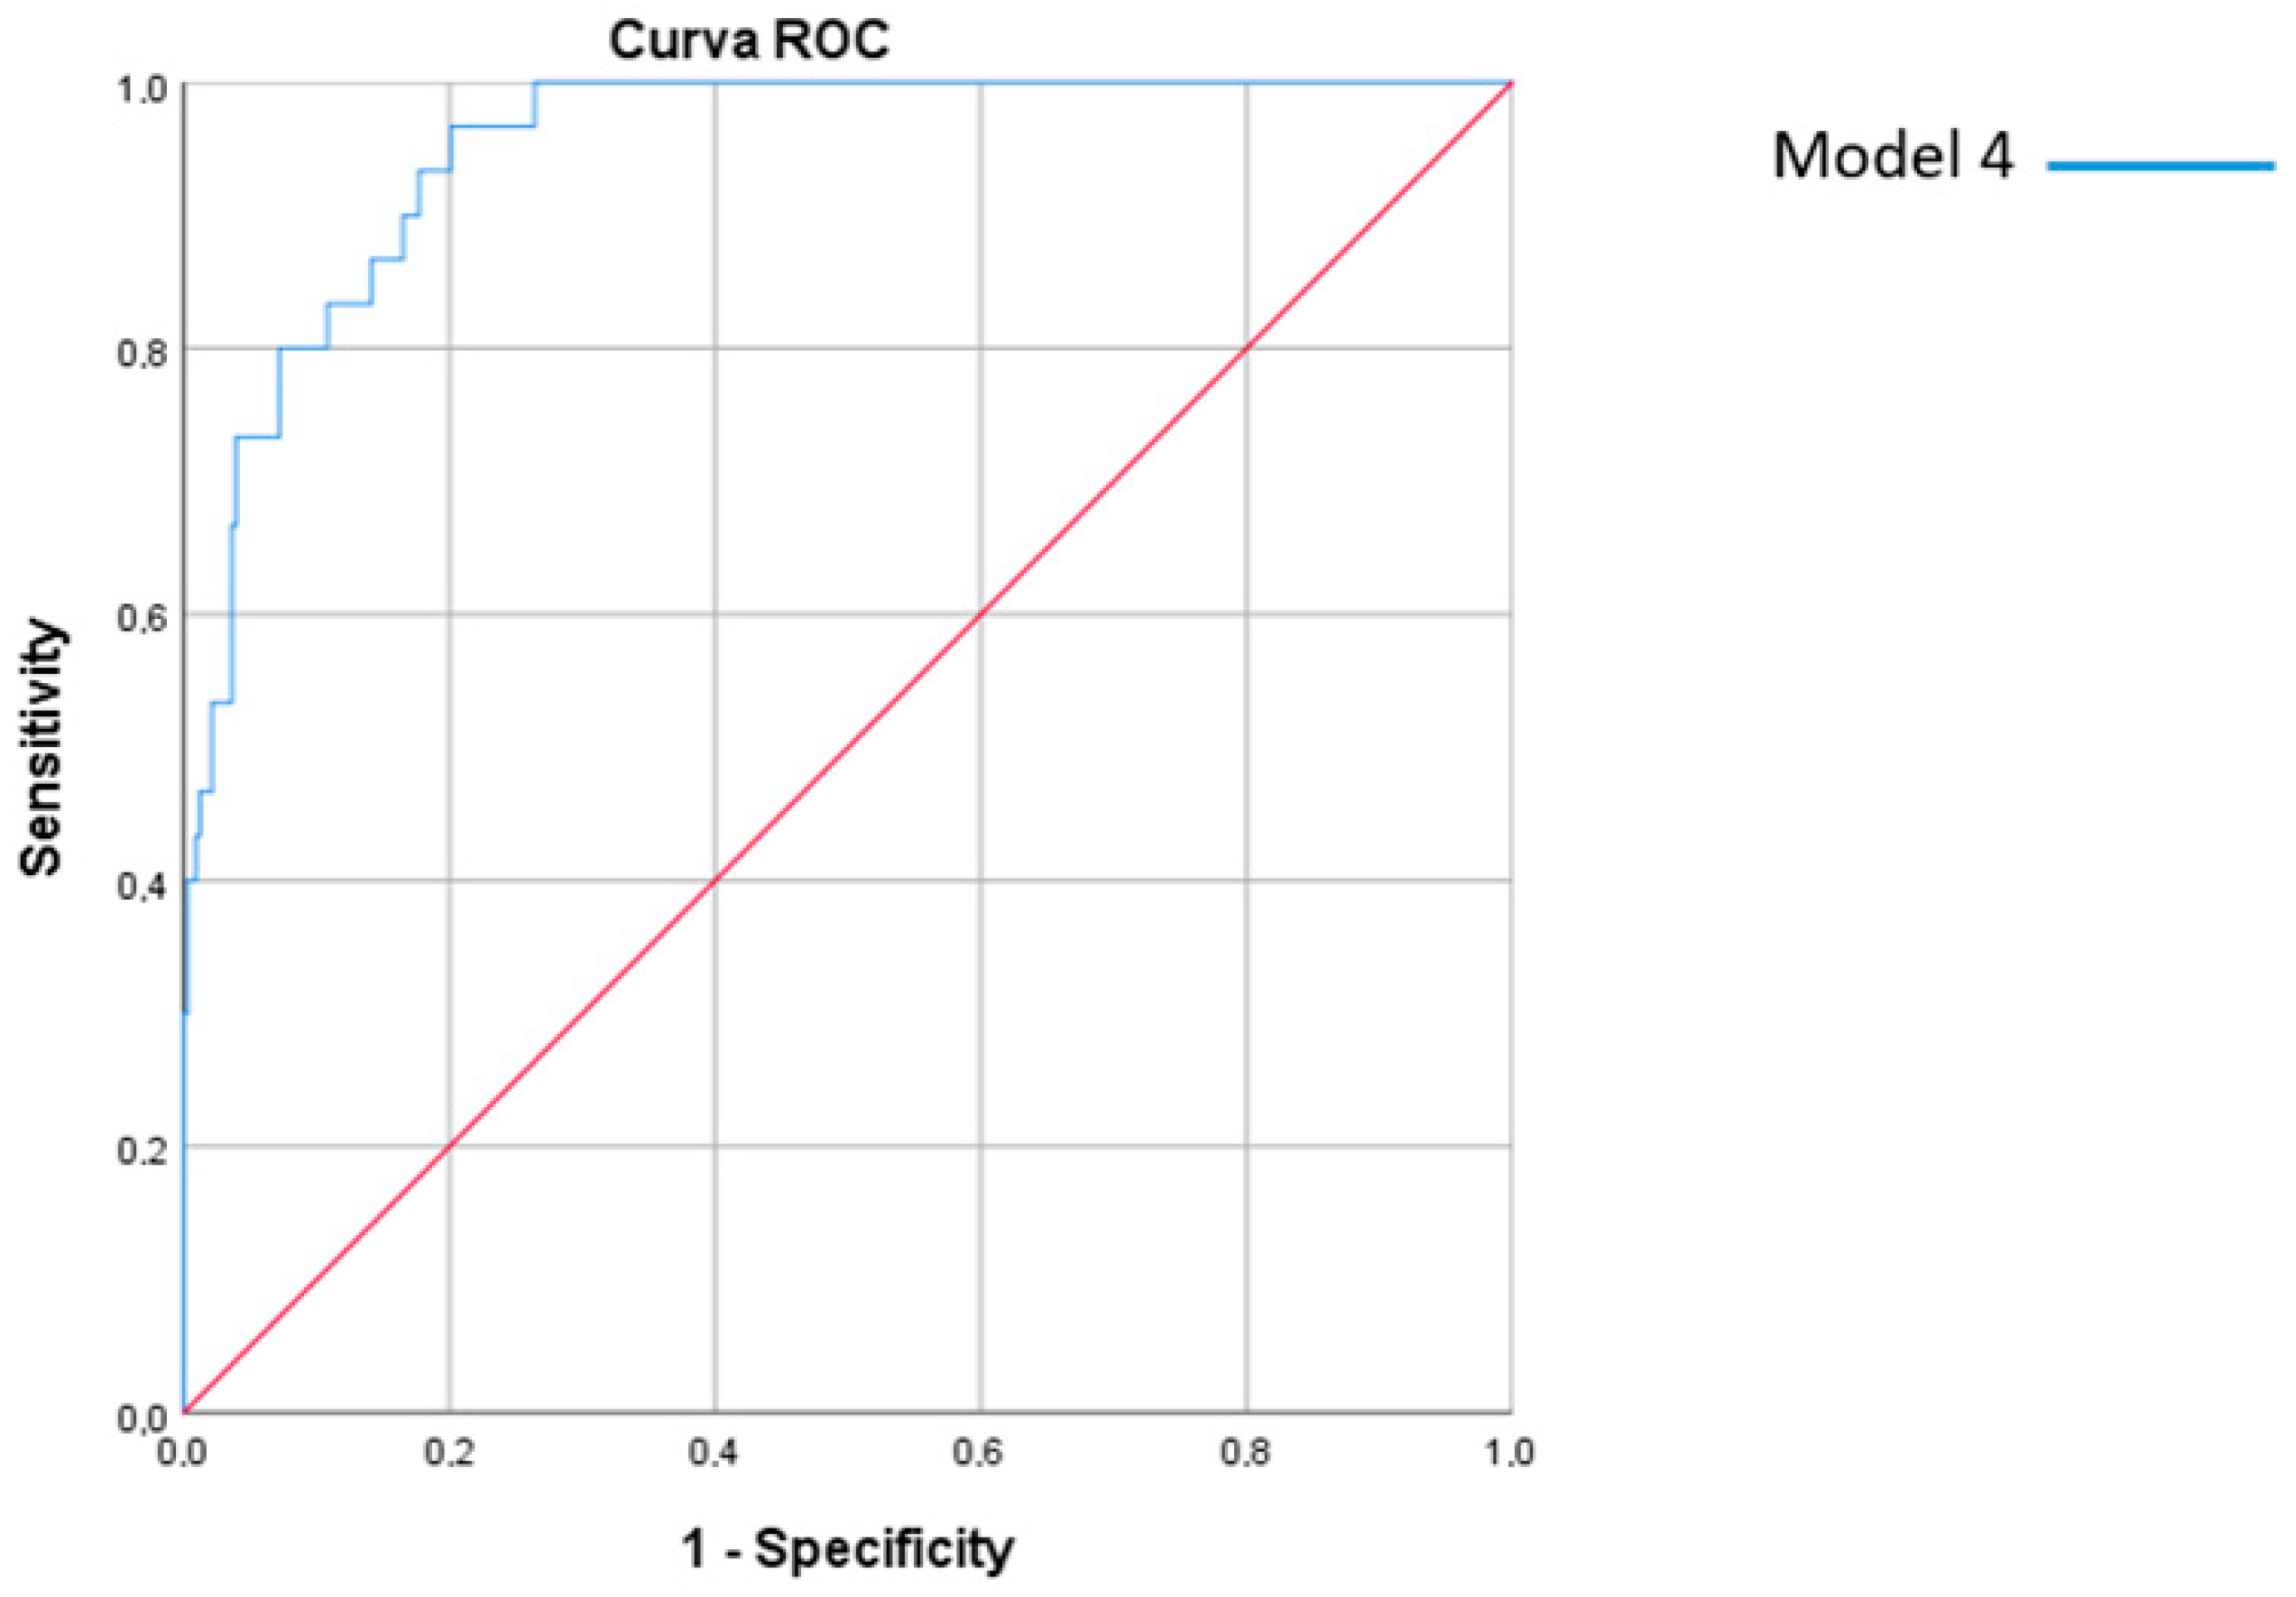
| Model 4 | 0.57 | 0.92 | 0.94 | ||||
| SBP (quantitative) | 0.74 | 1.08 | (1.05–1.1) | 0.001 | |||
| HC | 0.21 | 1.24 | (1.14–1.34) | 0.001 | |||
| FINDRISC (LOW/HIGH RISK) | 2.06 | 7.86 | (1.42–43.54) | 0.018 | |||
| Model 1 | Model 4 | |||
|---|---|---|---|---|
| Diagnostic Test | Value | CI95% | Value | CI95% |
| Sensitivity (%) | 86.96 | 95.12–99.1 | 73.68 | 81.25–96.12 |
| Specificity (%) | 97.06 | 94.37–98.47 | 95.35 | 92.98–97.72 |
| Validity index (%) | 96.42 | 94.37–98.47 | 94.21 | 91.68–96.75 |
| Predictive value + (%) | 66.67 | 48.13–85.2 | 46.67 | 27.16–66.19 |
| Predictive value − (%) | 99.10 | 97.93–100 | 98.50 | 97.04–99.95 |
| Prevalence (%) | 6.34 | 3.69–8.98 | 5.23 | 2.81–7.66 |
| Youden index | 0.84 | 0.70–0.98 | 0.69 | 0.49–0.89 |
Disclaimer/Publisher’s Note: The statements, opinions and data contained in all publications are solely those of the individual author(s) and contributor(s) and not of MDPI and/or the editor(s). MDPI and/or the editor(s) disclaim responsibility for any injury to people or property resulting from any ideas, methods, instructions or products referred to in the content. |
© 2023 by the authors. Licensee MDPI, Basel, Switzerland. This article is an open access article distributed under the terms and conditions of the Creative Commons Attribution (CC BY) license (https://creativecommons.org/licenses/by/4.0/).
Share and Cite
Alcaide-Leyva, J.M.; Romero-Saldaña, M.; García-Rodríguez, M.; Molina-Luque, R.; Jiménez-Mérida, R.; Molina-Recio, G. Development of a Predictive Model of Cardiovascular Risk in a Male Population from the Peruvian Amazon. J. Clin. Med. 2023, 12, 3199. https://doi.org/10.3390/jcm12093199
Alcaide-Leyva JM, Romero-Saldaña M, García-Rodríguez M, Molina-Luque R, Jiménez-Mérida R, Molina-Recio G. Development of a Predictive Model of Cardiovascular Risk in a Male Population from the Peruvian Amazon. Journal of Clinical Medicine. 2023; 12(9):3199. https://doi.org/10.3390/jcm12093199
Chicago/Turabian StyleAlcaide-Leyva, Jose M., Manuel Romero-Saldaña, María García-Rodríguez, Rafael Molina-Luque, Rocío Jiménez-Mérida, and Guillermo Molina-Recio. 2023. "Development of a Predictive Model of Cardiovascular Risk in a Male Population from the Peruvian Amazon" Journal of Clinical Medicine 12, no. 9: 3199. https://doi.org/10.3390/jcm12093199