
Risky Decision-Making in Adults with Alcohol Use Disorder—A Systematic and Meta-Analytic Review
 ,
,
Abstract
:1. Introduction
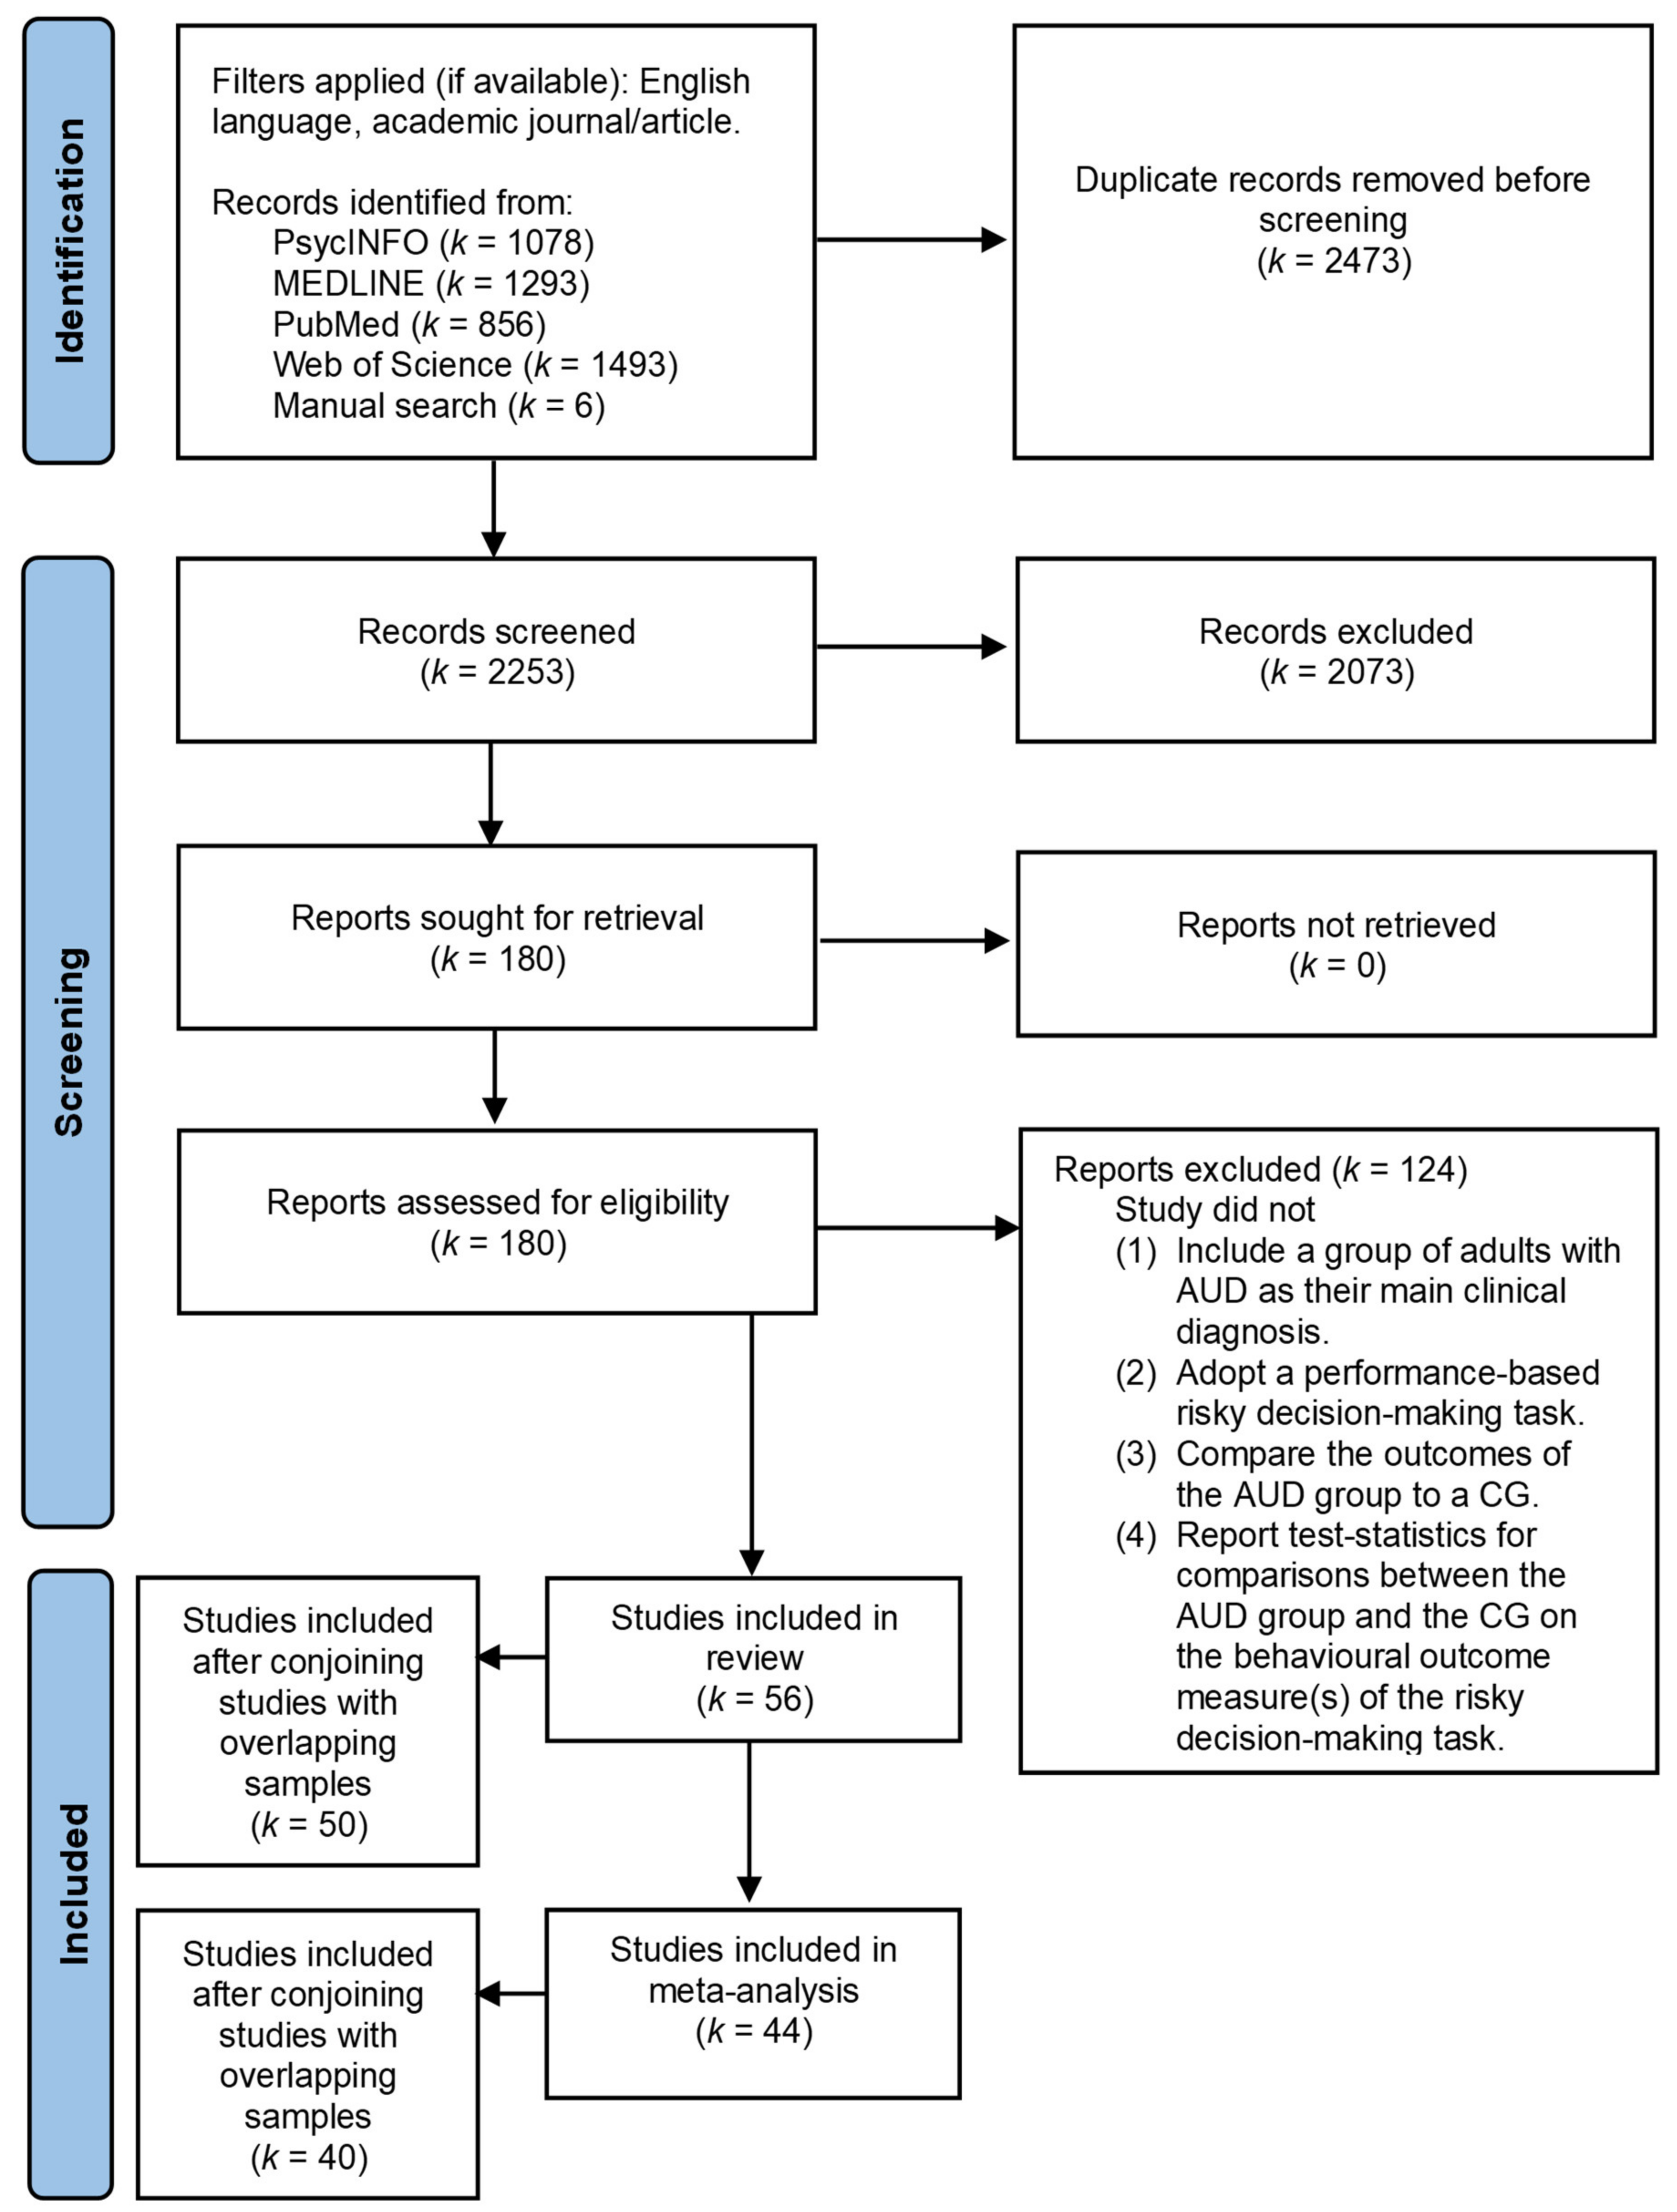
2. Method
2.1. Study Selection Procedure
2.2. Study Analysis
2.2.1. Content Analysis
2.2.2. Meta-Analysis
3. Results

3.1. Overall Task Findings

| Task Name | Task Description | Outcome Measures |
|---|---|---|
| Iowa Gambling Task (IGT) [63] |
| Scores are usually calculated for five blocks of 20 trials each and for the entire task (all 5 blocks combined):
|
| Cambridge Gambling Task (CGT) [65] |
|
|
| Balloon Analogue Risk Task (BART) [66] |
|
|
| Risk-Taking Task (RTT) [67] |
|
|
| Game of Dice Task (GDT) [68] |
|
|
| Coin Flipping Task (CFT)/Loss Aversion (Gambling) Task (LA(G)T) a [69] |
|
|
| Explicit Gambling Task (EGT) [58] |
|
|
| Cups Task (CT) [71] |
|
|
| Card Playing Task (CPT) (adapted from [72], see [73]) |
|
|
| Wheel of Fortune (WoF) Task (adapted from [74], see [56]) |
| Scores can be calculated per feedback condition:
|
| Single Outcome Gambling (SOG) task [57] |
|
|
| Lane Risk-Taking Task (LRT) (adapted from [75], see [59]) |
|
|
| Probability Discounting Task (PDT) (adaptation of existing task paradigm, see [35]) |
|
|
| Mixed-Gambles Task (MGT) (adaptation of existing task paradigm, see [35]) |
|
|
| Ecological Decision-Making Task (EDMT) [45] (see also [20]) |
|
|
| First Author (Year) | Sample Characteristics 1 | Comorbidities and Relevant Exclusion Criteria 2 | Alcohol-Use-Related Variables 3 | Abstinence Period 3 | Risky Decision-Making Task | Main Study Outcomes 4 | Conclusion 5 |
|---|---|---|---|---|---|---|---|
| Arcurio et al. (2015); Folco et al. (2021) [20,45] | AUD# (n = 15) Age (y): 21.20 ± 2.08 Sex: Female (all participants) Education: High school graduate: 20% Some college: 60% College graduate: 20% | Depression (BDI score): AUD = CG Exclusion criteria for both participant groups included current treatment for depression or anxiety, self-reported symptoms of psychosis or of TBI, and dependency of stimulants or marijuana. | Frequency (days/week): 4.20 ± 1.15 Quantity (drinks/week): 36.57 ± 18.10 | Minimum (h): 24 | EDMT | Arcurio et al. (2015) [45]:
| + |
| CG (n = 16) Age (y): 20.25 ± 1.57 Sex: Female (all participants) Education: High school graduate: 6.3% Some college: 81.3% College graduate: 12.5% | |||||||
| Avcu Meriç et al. (2022) [76] | AUD* (n = 52) Age (y): 45.27 ± 10.02 Sex: Male (all participants) Education: 10.04 ± 3.21 | Exclusion criteria for the AUD group included having drug-related cognitive deficiencies, severe comorbid psychiatric disorders, or other medical conditions that could hamper the understanding of study instructions. | AUD duration (y): 10.44 ± 7.41 Dangerousness of alcohol consumption (AUDIT score): 27.27 ± 7.57 Alcohol craving (PACS score): 8.62 ± 8.71 | Minimum (weeks): 3 | IGT |
| + |
| CG (n = 52) Age (y): 45.90 ± 11.71 Sex: Male (all participants) Education: 10.12 ± 3.87 | |||||||
| Bernhardt et al. (2017) [35]—study 2 | AUD# (n = 114) Age (y): 44.77 ± 10.56 Sex (m/f): 96/18 Education: n.r. Subdivided by relapse status to heavy-drinking during 48-week follow-up interval: AUD# abstaining (n = 27) Age (y): 44.14 ± 13.06 Sex (m/f): 20/7 Education: n.r. AUD# relapsing (n = 58) Age (y): 46.03 ± 10.22 Sex (m/f): 51/7 Education: n.r. | Anxiety and depression (HADS scores): AUD > CG AUD abstaining = AUD relapsing Exclusion criteria for both participant groups included a history of or current neurologic or mental disorder. | AUD severity (ADS score): AUD: 14.69 ± 6.74 AUD abstaining: 14.67 ± 7.06 AUD relapsing: 15 ± 6.14 Alcohol craving (OCDS score): AUD: 11.81 ± 8.36 AUD abstaining: 11.27 ± 8.04 AUD relapsing: 10.95 ± 7.61 Alcohol consumption in past year (grams of alcohol/drinking occasion): AUD: 206.92 ± 125.94 AUD abstaining: 190.33 ± 96.28 AUD relapsing: 206.53 ± 105.50 Alcohol intake per binge-drinking event in past year (grams of alcohol): AUD: 276.95 ± 157.37 AUD abstaining: 258.67 ± 112.23 AUD relapsing: 290.02 ± 155.17 Cumulated lifetime alcohol intake (kilograms of alcohol): AUD: 1749.09 ± 1096.02 AUD abstaining: 1677.32 ± 1207.02 AUD relapsing: 1893.29 ± 1139.54 | Days: 17 ± 10 (range: 4–50) | PDT MGT |
| + |
| CG (n = 98) Age (y): 43.75 ± 10.86 Sex (m/f): 81/17 Education: n.r. | |||||||
| Bjork et al. (2004) [67] | AUD# (n = 130) Age (y): 39.8 ± 8.0 Sex (m/f): 96/34 Education (y): 13.6 ± 2.4 | AUD: ≥1 mood disorder according to DSM-4 criteria: 80% ≥1 anxiety disorder according to DSM-4 criteria: 40% Exclusion criteria for the AUD group included a history of seizures, features suggestive of foetal alcohol syndrome or other neurologic disorders, or a presentation of psychotic symptoms. | n.r. | Minimum (days): 7 | RTT |
| +/− |
| CG (n = 41) Age (y): 38.5 ± 11.6 Sex (m/f): 27/14 Education (y): 16.9 ± 3.0 | |||||||
| Bjork et al. (2008) [46]; Zhu et al. (2016) [47] The majority of participants from Zhu et al. (2016) [47] were analysed in Bjork et al. (2008) [46], with the addition of 17 control participants. | Bjork et al. (2008) [46]: AUD# (n = 17) Age (y): 32.9 (SD n.r.) Sex (m/f): 10/7 Education: n.r. | Bjork et al. (2008) [46]: Lifetime history of cocaine dependence: n = 16 Lifetime history of cocaine abuse: n = 1 Lifetime history of cannabis dependence: n = 10 Lifetime history of cannabis abuse: n = 1 Exclusion criteria for the AUD group included a history of seizures, psychosis or features indicative of foetal alcohol syndrome. | Zhu et al. (2016) [47]: Duration of heavy drinking (y): 10.5 ± 6.5 | Minimum (days): 7 | RTT | Bjork et al. (2008) [46]:
| − |
| CG (n = 17) Age (y): 33.5 (SD n.r.) Sex (m/f): 10/7 Education: n.r. | |||||||
| Zhu et al. (2016) [47]: AUD# (n = 16) Age (y): 32.9 ± 7.2 Sex (m/f): 9/7 Education: n.r. | |||||||
| CG (n = 34) Age (y): 31.9 ± 5.7 Sex (m/f): 16/18 Education: n.r. | |||||||
| Bowden-Jones et al. (2005) [77] | AUD# (n = 21) Age (y): 40.95 ± 9.47 Sex: n.r. Education: n.r. Relapse at 3 months post-detoxification: AUD# abstaining (n = 15) Age (y): 43.87 ± 8.43 Sex: n.r. Education: n.r. AUD# relapsing (n = 6) Age (y): 33.66 ± 8.40 Sex: n.r. Education: n.r. | Borderline or dissocial personality disorder: n = 6 Exclusion criteria for the AUD group included polysubstance dependency, an organic brain disease, learning difficulties, or a comorbid mental illness. | n.r. | Days: 21 | IGT CGT |
| − |
| CG (n = 20) Age (y): 36.5 ± 10.97 Sex: n.r. Education: n.r. | |||||||
| Brevers et al. (2014) [70] | AUD# (n = 30) Age (y): 44.48 ± 11.69 Sex (m/f): 22/8 Education (y): 14.06 ± 2.63 | Depression (BDI score): AUD > CG Anxiety (STAI scores): AUD > CG Exclusion criteria for the AUD group included current Axis I diagnosis, a history of severe medical illness or severe head injury. | AUD duration (y): 19.57 ± 7.17 Alcohol consumption (drinks per day): 15.13 ± 4.56 Number of times entering detoxification program: 2.31 ± 1.67 | Days: 22.07 ± 3.49 (minimum: 18) | IGT CFT/LA(G)T CT |
| + |
| CG (n = 30) Age (y): 41.53 ± 10.21 Sex (m/f): 24/6 Education (y): 15.10 ± 2.16 | |||||||
| Brière et al. (2019) [78] | AUD* (n = 67) Age (y): 50.7 ± 11.1 Sex (m/f): 51/16 Education (y): n.r. | The main psychiatric histories in the AUD and CG included mood disorders (major depressive disorder or bipolar disorder) or suicide attempts. (Co)addictions were present in both the AUD and CG. | AUD duration (y): 15.2 ± 10.7 Age of first use (y): 15.6 ± 4.4 Age of first intoxication (y): 19.1 ± 7.2 Number of previous detoxifications: 4 ± 3.9 | n.r. | IGT |
| + |
| CG (n = 31) Age (y): 51 ± 13.4 Sex (m/f): 15/16 Education (y): n.r. | |||||||
| Burnette et al. (2021) [17] | AUD# (n = 16) Age (y): 31 ± 9.05 Sex (m/f): 11/5 Education (y): 15 ± 2.56 | Exclusion criteria for both participant groups included systemic, neurological, cardiovascular, or pulmonary disease, or current major psychiatric/Axis I diagnoses within the last year. | Drinks per drinking day in last month: 6.45 ± 2.06 | Days: 2.31 ± 1.49 (minimum: 24 h) | BART |
| − |
| CG (n = 16) Age (y): 30.94 ± 10.39 Sex (m/f): 11/5 Education (y): 14.31 ± 1.45 | |||||||
| Cordovil De Sousa Uva et al. (2010) [79] | AUD# (n = 35) Age (y): 48.4 ± 8.2 Sex (m/f): 17/18 Education: Secondary education: 42.85% Higher education: 57.14% | n.r. | Alcohol craving (OCDS score): AUD-T1 > AUD-T2 AUD-T1 > CG-T1, CG-T2 AUD-T2 > CG-T1, CG-T2 | All variables were tested twice (i.e., at T1 and T2), except for the IGT. For analysis of the IGT, the AUD group was split into two groups, which performed the IGT either at T1 (AUD-T1) or at T2 (AUD-T2). T1—Onset of withdrawal (1–2 days of abstinence) T2—End of withdrawal (14–18 days of abstinence) AUD participants who relapsed during the program were excluded. | IGT |
| + |
| CG (n = 22) Age (y): 44.36 ± 9.64 Sex (m/f): 14/8 Education: Secondary education: 31.81% Higher education: 68.18% | |||||||
| Czapla et al. (2016) [80] | AUD# (n = 94) Age (y): 48.05 ± 9.26 Sex (m/f): 76/18 Education (y): 12.99 ± 2.62 | Exclusion criteria for both participant groups included drug abuse or dependence and severe somatic, neurological or psychiatric diseases. | AUD duration (y): 11.45 ± 10.16 AUD severity (ADS score): 15.85 ± 6.97 Drinking days in past 3 months: 51.94 ± 24.02 Cumulative amount of alcohol in past 3 months (grams): 9294.03 ± 6397 Number of prior detoxifications: 5.83 ± 7.48 | Days: 18.20 ± 10.05 (range: 6–76) | CGT |
| − |
| CG (n = 71) Age (y): 46 ± 12.02 Sex (m/f): 54/17 Education (y): 13.63 ± 3.41 | |||||||
| Dinesh et al. (2022) [81] | AUD* (no ADHD) (n = 28) Age (y): 38.9 ± 8.2 Sex: Male (all participants) Education: School: 78.6% College: 21.4% AUD* + ADHD (n = 30) Age (y): 35.3 ± 9.0 Sex: Male (all participants) Education: School: 70% College: 30% | Exclusion criteria for the AUD groups included the presence of comorbid major psychiatric and neurological disorders, with the exception of ADHD in the AUD + ADHD group. | Duration of dependence (y): AUD total: 30.7 ± 7.8 AUD: 31.6 ± 7.9 AUD + ADHD: 29.9 ± 7.7 Duration of use (y): AUD total: 16.9 ± 8.7 AUD: 17.9 ± 9 AUD + ADHD: 16.1 ± 8.5 Age of onset AUD (y): AUD total: 20.1 ± 5.2 AUD: 21 ± 4.9 AUD + ADHD: 19.2 ± 5.5 Quantity (grams per day): AUD total: 92.5 ± 61.7 AUD: 79.7 ± 51.6 AUD + ADHD: 104.5 ± 68.5 | n.r. | IGT BART |
| +/− |
| CG (n = 28) Age (y): 38.5 ± 10.9 Sex: Male (all participants) Education: School: 35.7% College: 64.3% | |||||||
| Dom et al. (2006) [82] | AUD# (no personality disorder) (n = 38) Age (y): 43 ± 11 Sex (m/f): 74%/26% Education (y): 13.3 ± 2.5 | Part of group assignment: AUD and CG: no personality disorders. AUD + A/C: AUD diagnosis and ≥1 cluster A or C personality disorder. AUD + B: AUD diagnosis and ≥1 cluster B personality disorder (borderline n = 18, ASP n = 3, both n = 2). Exclusion criteria for all participant groups included a current or lifetime history of psychotic disorders, amnestic disorders, neurological disorders, and severe somatic disorders. | AUD duration (y): AUD: 14.9 ± 8.4 AUD + A/C: 17.7 ± 3.1 AUD + B: 17.2 ± 9.5 | Range (weeks): 4–5 | IGT |
| + |
| AUD# + A/C (n = 19) Age (y): 41 ± 11 Sex (m/f): 74%/26% Education (y): 13.5 ± 3.5 | |||||||
| AUD# + B (n = 23) Age (y): 40 ± 7 Sex (m/f): 65%/35% Education (y): 12.5 ± 2.8 | |||||||
| CG (n = 53) Age (y): 41 ± 11 Sex (m/f): 49%/51% Education (y): 13.5 ± 2.5 | |||||||
| Fama et al. (2016) [83] | AUD# (n = 39) Age (y): 48.4 ± 9.7 Sex (m/f): n.r. Education (y): 13.5 ± 2.3 | Depression (BDI score): AUD > CG Lifetime criteria (not current) for nonalcohol substance abuse or dependence: 56.4% Exclusion criteria for all participant groups included a significant history of medical, psychiatric, or neurological disorders. | Age of onset AUD (median y): 20 AUD remission time (weeks): 87 (range: 0–484) Lifetime alcohol consumption (kilograms): 1257.1 ± 918.6 | n.r. | CGT |
| + |
| CG (n = 31) Age (y): 44.1 ± 9.8 Sex (m/f): n.r. Education (y): 15.1 ± 1.9 | |||||||
| Fein et al. (2004) [84] | AUD# Male (n = 26) Age (y): 45 ± 1.34 Education (y): 15.5 ± 0.43 | Exclusion criteria for all participant groups included a history or presence of an Axis I diagnosis (including ASP and CD), a significant history of head trauma or cranial surgery, a history of diabetes, stroke or hypertension, or of another neurological disease, evidence of Wernicke–Korsakoff syndrome, and current substance abuse. | Duration of use (months): AUD Male: 251 ± 17.4 AUD Female: 246 ± 21.2 Average dose (drinks/month): AUD Male: 167 ± 26.3 AUD Female: 134 ± 19.8 Duration of peak use (months): AUD Male: 52.3 ± 6.29 AUD Female: 82.8 ± 19.2 Peak dose (drinks/month): AUD Male: 353 ± 51.5 AUD Female: 311 ± 66.8 | Years: AUD Male: 6.79 ± 1.19 AUD Female: 7.13 ± 1.36 Minimum (months): 6 | IGT |
| + |
| AUD# Female (n = 18) Age (y): 47.4 ± 1.34 Education (y): 15.6 ± 0.5 | |||||||
| CG Male (n = 21) Age (y): 43.1 ± 1.36 Education (y): 16 ± 0.4 | |||||||
| CG Female (n = 37) Age (y): 44.8 ± 1.11 Education (y): 16.4 ± 0.28 | |||||||
| Fein et al. (2006) [85] | AUD# (n = 58) Age (y): 31.1 ± 7.8 Sex (m/f): 34/24 Education (y): 16.2 ± 1.5 | Exclusion criteria for all participant groups included a lifetime or current diagnosis of schizophrenia or schizophreniform disorder, a history of drug dependence or abuse, a significant history of head trauma or cranial surgery, a history of diabetes, stroke or hypertension, or of another neurological disease, evidence of Wernicke–Korsakoff syndrome, and current substance abuse. | Age when first meeting criteria for heavy use (y): 21.2 ± 4.9 Level at first heavy use: 135.9 ± 42.4 Duration of active drinking (months): 181.2 ± 95.2 Average lifetime drinking dose (standard number of drinks/month): 84.9 ± 43.3 Duration of peak drinking (months): 55.6 ± 55.1 Peak drinking dose (standard number of drinks/month): 150.9 ± 113.1 | Minimum (hours): 24 | IGT |
| − |
| CG (n = 58) Age (y): 31.3 ± 7.9 Sex (m/f): 34/24 Education (y): 16.5 ± 1.8 | |||||||
| Fishbein et al. (2007) a [48] | AUD# (n = 102) Age (y): 32.1 ± 5.3 Sex (m/f): 78/24 Education: Dropped high school: 16.7% College: 68.6% University: 6.9% | Psychiatric symptoms (BPRS scores): Clinical groups > CG Exclusion criteria for the clinical groups included an Axis I psychiatric disorder, severe head injury, or other sources of serious brain damage, or HIV/AIDS. Participants from the clinical groups with Axis 2 psychiatric disorders were not excluded. | AUD duration (y): AUD: 7 ± 3.8 HD + AUD: 4.3 ± 2.5 Duration of use (y): AUD: 13.8 ± 5.3 HD + AUD: 10.2 ± 4.0 Age at first use (y): AUD: 17.1 ± 2.9 HD + AUD: 16.2 ± 3.6 Number of hospitalisations for AUD: AUD: 1.95 ± 0.27 HD + AUD: 0.78 ± 0.13 | Weeks: 3 | CGT |
| − |
| HD (n = 100) Age (y): 25.6 ± 4.2 Sex (m/f): 64/36 Education: Dropped high school: 31% College: 52% University: 13% | |||||||
| HD + AUD# (n = 60) Age (y): 26.2 ± 4.1 Sex (m/f): 53/7 Education: Dropped high school: 36.7% College: 41.6% University: 0% | |||||||
| CG (n = 160) Age (y): 28.3 ± 5.1 Sex (m/f): 122/38 Education: Dropped high school: 13.8 College: 67.5 University: 18.1 | |||||||
| Flannery et al. (2007) a [49] | AUD# (n = 102) Age (y): 32.2 ± 5.1 Sex (m/f): 78/24 Education: College or university: 77% Subdivided by gender: AUD# Females (n = 24) Age (y): 29.65 ± 4.81 Education: College or university: 43.5% AUD# Males (n = 78) Age (y): 32.97 ± 4.96 Education: College or university: 87% | Psychiatric symptoms (BPRS scores): AUD > CG Participants from the AUD group were excluded if they had an Axis I psychiatric disorder, head injury, or HIV/AIDS. | Age at first use (y): AUD: 17.5 ± 3.8 Subdivided by gender: AUD duration (y): AUD Females: 5.17 ± 2.74 AUD Males: 7.53 ± 3.96 Duration of use (y): AUD Females: 10.61 ± 3.9 AUD Males: 14.79 ± 5.19 Age at first use (y): AUD Females: 17.3 ± 5.24 AUD Males: 17.61 ± 3.24 Number of prior treatments for AUD: AUD Females: 0.78 ± 0.42 AUD Males: 0.69 ± 0.46 Pattern of use (binge drinkers): AUD Females: 91.3% AUD Males: 71.8% | Weeks: 3 | CGT |
| See [48] a |
| CG (n = 68) Age (y): 32.9 ± 2.9 Sex (m/f): 48/20 Education: College or university: 95.6% | |||||||
| Galandra et al. (2020) [56] | AUD* (n = 26) Age (y): 46.5 ± 8.25 Sex (m/f): 16/10 Education (y): 10.88 ± 3.51 | Exclusion criteria for both participant groups included a presence or (family) history of neurological or (comorbid) psychiatric disorders, past brain injury or major medical disorders. | AUD duration (y): 10.77 ± 6.78 Daily alcohol dose: 15.42 ± 7.93 | Days: 14.27 ± 3.91 (minimum: 10) | WoF |
| − |
| CG (n = 19) Age (y): 45.11 ± 8.69 Sex (m/f): 8/11 Education (y): 10.63 ± 3.06 | |||||||
| Galandra et al. (2021) [50]; Canessa et al. (2021) [51] All participants from Galandra et al. (2021) [50] were analysed in Canessa et al. (2021) [51], with the addition of 1 control participant. | AUD* (n = 22) Age (y): 45.59 ± 7.99 Sex (m/f): 59%/41% Education (y): 9.91 ± 2.65 | Exclusion criteria for both participant groups included major medical or neuro-psychiatric conditions, comorbid disorders with the exception of nicotine dependence, and a prior loss of consciousness or brain injury. | Duration of use (y): 10.11 ± 6.57 Daily alcohol dose: 14.34 ± 6.66 Subdivided by gender: Duration of use (y): AUD Females: 11.89 ± 7.11 AUD Males: 10.11 ± 7.48 Daily alcohol dose: AUD Females: 14.49 ± 5.52 AUD Males: 14.18 ± 7.12 | Days: 14 ± 3.9 Subdivided by gender: Days: AUD Females: 14.22 ± 5.04 AUD Males: 18.92 ± 17.49 | CGT |
| − |
| Galandra et al. (2021) [50]: CG (n = 18) Age (y): 44.83 ± 8.86 Sex (m/f): 56%/44% Education (y): 10.11 ± 2.78 Canessa et al. (2021) [51]: CG (n = 19) Age (y): 45.11 ± 8.69 Sex (m/f): 50%/50% Education (y): 10.11 ± 2.78 | |||||||
| Genauck et al. (2017) [34] | AUD# (n = 15) Age (y): 45.4 ± 10.2 Sex: Male (all participants) Education (y): 16.6 ± 4.7 | Depression (BDI score): AUD > CG Exclusion criteria for all participant groups included a known history of a neurological disorder or a current psychological disorder (Axis I). | AUD severity (ADS score): 19 ± 6.7 Alcohol Craving (OCDS score): 5.3 ± 4.5 | Days: 42 (SD n.r.) | CFT/LA(G)T |
| + |
| CG (n = 17) Age (y): 38.8 ± 11.5 Sex: Male (all participants) Education (y): 16.3 ± 3.4 | |||||||
| Gilman et al. (2015) [59] | AUD# (n = 18) Age (y): 30.67 ± 7.10 Sex: 12/6 Education: n.r. | Mood disorders: 39% Anxiety disorders: 44% Exclusion criteria for both participant groups included psychosis, evidence of foetal alcohol spectrum disorder, chronic medical conditions, history of significant head injury or of neurological disorder. | Average number of drinks per drinking day: 13.89 ± 10.15 | Minimum (days): 6 Maximum (weeks): 4 | LRT |
| − |
| CG (n = 18) Age (y): 30.50 ± 5.06 Sex: 12/6 Education: n.r. | |||||||
| Gonzalez et al. (2007) [86] | Substance-dependent group, using alcohol ≥80% of the time. SD-AUD# (n = 17) Age (y): 33.8 ± 2.2 Sex (m/f): 12/5 Education (y): 12.4 ± 0.51 | History of previous drug abuse/dependence: 71% Lifetime prevalence mood/anxiety disorder: 93% Current major depressive disorder: 71% Exclusion criteria for both participant groups included a history of psychosis, head injury, or seizure disorder. | Age at alcohol use onset (y): 20.6 ± 1.4 | Days: 26.6 ± 4.0 (minimum: 14) | IGT |
| +/− |
| CG (n = 19) Age (y): 31.1 ± 2.1 Sex (m/f): 12/7 Education (y): 14.9 ± 0.48 | |||||||
| Goudriaan et al. (2005) [73] | AUD# (n = 46) Age (y): 47.4 ± 8.4 Sex (m/f): 78%/22% Education (y): n.r. | Depression (BDI score): AUD > CG Anxiety (STAI scores): AUD > CG ADHD symptoms (ADHD-RS): AUD > CG Exclusion criteria for all participant groups included a history of major psychiatric disorders, current treatment for mental disorders, or physical conditions known to influence cognition. The AUD group did not fulfil criteria for pathological gambling or Tourette’s syndrome. Apart from an AUD group, the study included two separate clinical groups for these two disorders. | n.r. | Minimum (months): 3 Maximum (months): 12 | IGT CPT |
| + |
| CG (n = 49) Age (y): 35.8 ± 11.1 Sex (m/f): 69%/31% Education (y): n.r. | |||||||
| Harvanko et al. (2012) [87] | AUD# (n = 25) Age (y): 21.16 ± 3.31 Sex (m/f): 20/25 Education: High school or below: 4% Some college: 80% College graduate or higher: 16% | Exclusion criteria for all participant groups included the presence of current Axis-I disorders. | Frequency of alcohol use (times per week): AUD: 1.90 ± 1.65 At-Risk Drinkers: 1.79 ± 0.92 | n.r. | CGT |
| +/− |
| At-Risk Drinkers6 (n = 82) Age (y): 22.12 ± 2.99 Sex (m/f): 62/20 Education: High school or below: 3.66% Some college: 59.76% College graduate or higher: 36.59% | |||||||
| CG (n = 48) Age (y): 19.50 ± 2.43 Sex (m/f): 33/15 Education: High school or below: 8.33% Some college: 85.42%% College graduate or higher: 4.17% | |||||||
| Kamarajan et al. (2010) [57] | AUD# (n = 40) Age (y): 38.28 ± 6.44 Sex: Male (all participants) Education (y): n.r. | Exclusion criteria for both participant groups included a personal and/or family history of major medical or psychiatric disorders and substance-related addictive illnesses. | n.r. | Minimum (days): 28 | SOG |
| − |
| CG (n = 40) Age (y): 21.07 ± 3.36 Sex: Male (all participants) Education (y): n.r. | |||||||
| Khemiri et al. (2020) [88] | AUD# (n = 106) Age (y): 47.9 ± 7.5 Sex (m/f): 51.9%/48.1% Education: Did not finish primary school: 0% Primary school: 17% Secondary school: 34% University: 49.1% | Depressive symptoms (MADRS score): AUD > CG Exclusion criteria for both groups included a diagnosis of substance abuse or dependence, severe major psychiatric disorder, severe somatic illness, history of stroke, intracranial haemorrhage, or severe head trauma. | Age of onset alcohol problem: 34.1 ± 10.6 Alcohol craving (OCDS scores): 23.8 ± 6.5 Years with current level of drinking: 7.7 ± 6.6 Drinking days in last 90 days: 72% ± 21 Heavy drinking days in last 90 days: 62% ± 27 | Range (days): 4–14 | CGT |
| − |
| CG (n = 90) Age (y): 48.1 ± 11.8 Sex (m/f): 43.3%/56.7% Education: Did not finish primary school: 1.1% Primary school: 4.5% Secondary school: 46.1% University: 48.3% | |||||||
| Kim et al. (2006) [64] | AUD# (n = 28) Age (y): 40.8 ± 5.6 Sex: Male (all participants) Education (y): 12.7 ± 1.5 | ASPD: AUD + CD: n = 7 Exclusion criteria for all participant groups included past neurological illness or traumatic brain injury, and lifetime Axis I psychiatric diagnoses. | AUD severity (MAST score): AUD: 27.4 ± 13.4 AUD + CD: 27.1 ± 8.7 Alcohol Craving (OCDS score): AUD: 23.3 ± 7.3 AUD + CD: 24.9 ± 10.2 Age at first drinking (y): AUD: 19.6 ± 1.8 AUD + CD: 17.8 ± 1.9 Age of onset problematic drinking (y): AUD: 32.6 ± 7.1 AUD + CD: 31.2 ± 7.5 Duration of problematic drinking (y): AUD: 8.1 ± 5.6 AUD + CD: 7.6 ± 5.9 Age at first detoxification (y): AUD: 37.9 ± 6.2 AUD + CD: 35.8 ± 6.8 Number of prior detoxifications: AUD: 4.5 ± 5.4 AUD + CD: 4.4 ± 5.6 | Minimum: 2 weeks | IGT IGT variant |
| +/− |
| AUD# + CD7 (n = 28) Age (y): 38.7 ± 7.5 Sex: Male (all participants) Education (y): 10.8 ± 1.4 | |||||||
| CG + CD7 (n = 10) Age (y): 42.3 ± 7.3 Sex: Male (all participants) Education (y): 12.8 ± 1.3 | |||||||
| CG (n = 30) Age (y): 39.1 ± 7.3 Sex: Male (all participants) Education (y): 14.0 ± 1.8 | |||||||
| Kim et al. (2011) [89] | AUD# (n = 23) Age (y): 32.65 ± 5.10 Sex: Male (all participants) Education (y): 11.26 ± 2.77 | Exclusion criteria for both participant groups included past neurological illness, traumatic brain injury, and lifetime axis I psychiatric disorders. | AUD duration (y): 4.91 ± 3.64 AUD severity (MAST score): 25.78 ± 10.16 | Minimum: 2 weeks | IGT GDT |
| + |
| CG (n = 21) Age (y): 30.52 ± 2.98 Sex: Male (all participants) Education (y): 15.14 ± 1.20 | |||||||
| Körner et al. (2015) [90] | AUD# (n = 40) Age (y): 48.15 ± 10.52 Sex (m/f): 27/13 Education (y): 15.15 ± 2.76 | The exclusion criteria for both participant groups included severe mental disorders such as psychosis, head injuries, organic brain syndrome, other cognitive disorders, and a history of seizures. | n.r. | Months: 38.45 ± 87.27 Range: 2 weeks-38 years | IGT |
| + |
| CG (n = 40) Age (y): 45.40 ± 10.73 Sex (m/f): 27/13 Education (y): 15 ± 2.7 | |||||||
| Kornreich et al. (2013) [60] | AUD# (n = 25) Age (y): 45.68 ± 7.97 Sex (m/f): 15/10 Education: Completed 3 years of secondary school: 40% Completed secondary school: 24% Post-secondary school education: 36% | Depression (BDI score): AUD > CG Anxiety (STAI scores): AUD > CG The exclusion criteria for all participant groups included a history of bipolar disorder or schizophrenia. | Duration of alcohol use (months): 94.32 ± 84.28 Number of hospitalizations for alcohol use: 2.48 ± 2.6 | Assessments took place in the third week of abstinence. | IGT |
| +/− |
| CG (n = 25) Age (y): 38.96 ± 10.47 Sex (m/f): 19/6 Education: Completed 3 years of secondary school: 16% Completed secondary school: 32% Post-secondary school education: 52% | |||||||
| Lawrence et al. (2009) [91] | AUD# (n = 21) Age (y): 44.2 ± 9.2 Sex: Male (all participants) Education (y): 11.9 ± 3.4 | Depression (BDI score): AUD > CG Exclusion criteria for all participant groups included comorbid psychiatric illness (with the exception of depression in the AUD group), history of head injury, or a neurological disorder. | AUD severity (SADQ score): 33.7 ± 16 | Self-reported duration (days): 150 (SD n.r.) Minimum: > 1 week (although 4 participants consumed alcohol in the past 48 h) | CGT |
| +/− |
| CG (n = 21) Age (y): 40.2 ± 13.6 Sex: Male (all participants) Education (y): 13.5 ± 2.4 | |||||||
| Le Berre et al. (2012) [92] | AUD# (n = 31) Age (y): 43.87 ± 6.97 Sex (m//f): 26/5 Education (y): 10.77 ± 2.14 | Depression (BDI score): AUD > CG Anxiety (STAI scores): AUD > CG Exclusion criteria for both participant groups included the display of psychiatric problems or any history of head injury, coma, epilepsy, Wernicke’s encephalopathy, cirrhosis, or depression. | AUD duration (y): 8.26 ± 8.26 Quantity (units per day): 21.95 ± 11.70 | Days: 12.64 ± 7.16 (range: 7–40) | IGT |
| + |
| CG (n = 37) Age (y): 45.49 ± 6.07 Sex (m//f): 25/12 Education (y): 12.11 ± 3.56 | |||||||
| Le Berre et al. (2014) [93] | AUD# (n = 30) Age (y): 43.67 ± 7.04 Sex (m//f): 26/4 Education (y): 10.53 ± 2.32 | Depression (BDI score): 8 ± 3.36 Anxiety (STAI scores): State anxiety: 33.13 ± 10.06 Trait anxiety: 50.27 ± 14.22 Exclusion criteria for both participant groups included the display of psychiatric problems or any history of head injury, coma, epilepsy, Wernicke’s encephalopathy, cirrhosis, or depression. | AUD duration (y): 9.03 ± 9.37 Duration of alcohol use (y): 27.97 ± 8.23 Duration of alcohol misuse (y): 15.60 ± 9.69 Quantity (units per day): 24.16 ± 15.44 Number of withdrawals: 2.20 ± 1.16 | Days: 12.63 ± 7.08 (range: 7–40) | IGT |
| + |
| CG (n = 45) Age (y): 44.76 ± 7.78 Sex (m//f): 38/7 Education (y): 10.69 ± 2.25 | |||||||
| Loeber et al. (2009) b [52] | AUD# (n = 48) Age (y): 46.5 ± 8.2 Sex (m/f): 27/21 Education: n.r. Subdivided in high number (≥2) of detoxifications (AUD-HD) and low number (<2) of detoxifications (AUD-LD) groups: AUD#-HD (n = 27) Age (y): 47.8± 8.8 Sex (m/f): 19/8 Education: n.r. AUD#-LD (n = 21) Age (y): 45 ± 7.2 Sex (m/f): 8/13 Education: n.r. Subdivided in recently (≤16 days) abstinent (AUD-RA) and longer (>16) abstinent (AUD-LA) groups: AUD#-RA (n = 28) Age (y): 45.3 ± 7.3 Sex (m/f): 15/13 Education: n.r AUD#-LA (n = 20) Age (y): 48.3 ± 9.2 Sex (m/f): 12/8 Education: n.r | Depression (BDI score): AUD > CG AUD-HD, AUD-LD, AUD-RA, AUD-LA > CG Exclusion criteria for both participant groups included current drug abuse or dependence, severe somatic, neurological or psychiatric diseases, or suicidal tendencies. | AUD duration (y): AUD: n.r. AUD-HD: 17.4 ± 9.4 AUD-LD: 9.4 ± 6 AUD-RA: 13 ± 9.2 AUD-LA: 15.2 ± 8.7 AUD severity (ADS total score): AUD: 15.2 ± 6.8 AUD-HD: 17 ± 7.1 AUD-LD: 12.9 ± 5.8 AUD-RA: 16.2 ± 7.3 AUD-LA: 13.8 ± 6 Age of onset regular alcohol use: AUD: 19.4 ± 4.5 AUD-HD: 19.6 ± 5.2 AUD-LD: 19.1 ± 3.3 AUD-RA: 19.3 ± 4.4 AUD-LA: 19.6 ± 4.6 Lifetime alcohol consumption (number of drinks): AUD: 91,987.6 ± 102,845.9 AUD-HD: 98,694.3 ± 85,205.3 AUD-LD: 83,364.6 ± 123,611.9 AUD-RA: 93,313.9 ± 117,925.1 AUD-LA: 90,130.6 ± 79,981.5 Number of prior detoxifications: AUD: n.r. AUD-HD: 7.1 ± 11 AUD-LD: 0.2 ± 0.4 AUD-RA: 4.4 ± 10.7 AUD-LA: 3.6 ± 5.5 | Days: AUD: 15.65 ± 6.69 AUD-HD: 16.2 ± 8 AUD-LD: 14.9 ± 4.6 AUD-RA: 11.5 ± 3.8 AUD-LA: 21.4 ± 5.5 | IGT |
| − |
| CG (n = 36) Age (y): 44.4 ± 9.9 Sex (m//f): 23/13 Education: n.r. | |||||||
| Loeber et al. (2010) b [53] | AUD#-HD (n = 31) Age (y): 47.4 ± 8.4 Sex (m/f): 76%/24% Education: n.r. | Depression (BDI score): AUD-HD > CG AUD-LD = CG Exclusion criteria for all participant groups included current drug abuse or dependence, severe somatic, neurological or psychiatric diseases, or suicidal tendencies. | AUD severity (ADS total score): AUD-HD: 16.7 ± 6.8 AUD-LD: 12.6 ± 6.1 Age of onset regular alcohol use: AUD-HD: 19.4 ± 5 AUD-LD: 19.4 ± 3.5 Lifetime alcohol consumption (number of drinks): AUD-HD: 94,065.5 ± 80,793.8 AUD-LD: 88,198.4 ± 137,141.7 Daily dose in last 90 days prior to admission (number of alcohol units): AUD-HD: 160.4 ± 126 AUD-LD: 107.4 ± 114.5 Drinking days in last 90 days prior to admission: AUD-HD: 51.7 ± 20.2 AUD-LD: 50.7 ± 26.5 Number of prior detoxifications: AUD-HD: 7.3 ± 10.4 AUD-LD: 1 ± 0 | n.r. | IGT |
| See [52] b |
| AUD#-LD (n = 17) Age (y): 44.9 ± 7.7 Sex (m/f): 50%/50% Education: n.r. | |||||||
| CG (n = 36) Age (y): 44.4 ± 9.1 Sex (m/f): 56.3%/43.7% Education: n.r. | |||||||
| Maurage et al. (2018) [94] | Severe AUD* (n = 38) Age (y): 46.95 ± 11.30 Sex (m/f): 29/9 Education (y): 12.50 ± 2.42 Subdivided by relapse status 6 months after start of detoxification: AUD*-Abstaining (n = 17) Age (y): 43.18 ± 9.12 Sex (m/f): 12/5 Education (y): 12.35 ± 2.09 AUD*-Relapsing (n = 21) Age (y): 50 ± 12.17 Sex (m/f): 17/4 Education (y): 12.62 ± 2.71 | Depressive and anxiety symptoms (HADS scores): Depression: 5.92 ± 2.07 Anxiety: 7.87 ± 3.03 Only one AUD participant presented with severe anxious symptomatology according to the HADS. AUD participants were free of any current psychiatric diagnosis. | AUD duration (y): Severe AUD: 24.68 ± 12.79 AUD-Abstaining: 21.88 ± 9.72 AUD-Relapsing: 26.95 ± 14.66 AUD severity (MAST score): Severe AUD: 31.92 ± 9.54 AUD-Abstaining: 33.12 ± 9.71 AUD-Relapsing: 30.95 ± 9.54 Dangerousness of alcohol consumption (AUDIT score): Severe AUD: 27.66 ± 7.40 AUD-Abstaining: 27.29 ± 6.56 AUD-Relapsing: 27.95 ± 8.17 Daily consumption before detoxification (number of drinks): Severe AUD: 16.45 ± 8.66 AUD-Abstaining: 15.47 ± 8.59 AUD-Relapsing: 17.24 ± 8.85 Number of prior detoxifications: Severe AUD: 1.89 ± 2.17 AUD-Abstaining: 1.29 ± 1.36 AUD-Relapsing: 2.38 ± 2.57 | Days: Severe AUD: 31.66 ± 16.33 AUD-Relapsing: 34.57 ± 17.94 AUD-Abstaining: 28.06 ± 13.76 Minimum (days): 14 | IGT |
| + |
| CG (n = 38) Age (y): 46.66 ± 13.42 Sex (m/f): 29/9 Education (y): 12.45 ± 2.88 | |||||||
| Miranda et al. (2009) [95] | AUD# (n = 22) Age (y): 29.3 ± 5.6 Sex: Male (all participants) Education (y): 12.9 ± 2.4 | Part of group assignment. AUD groups: Avoidant personality disorder: 10.3% Obsessive compulsive personality disorder: 15.4% Paranoid personality disorder: 2.6% Schizoid personality disorder: 2.6% Narcissistic personality disorder: 2.6% Exclusion criteria for all participant groups included current or lifetime bipolar I or II disorder, agoraphobia, a psychotic disorder, posttraumatic stress disorder, panic disorder, obsessive compulsive disorder, and eating disorders as well as a current mood disorder, generalized anxiety disorder, or an active substance use disorder. | n.r. | Months: AUD: 13.64 ± 21.34 AUD + ASPD: 13.56 ± 21.65 Minimum (days): 30 | IGT |
| + |
| AUD# + ASPD (n = 17) Age (y): 27.1 ± 6.1 Sex: Male (all participants) Education (y): 11.3 ± 1.4 | |||||||
| CG (n = 21) Age (y): 22.6 ± 4.3 Sex: Male (all participants) Education: 14.5 ± 1.4 | |||||||
| Murray et al. (2018) [96] | AUD# + Smoking (n = 20) Age (y): 45.9 ± 9.5 Sex (m/f): 16/4 Education: 13.8 ± 1.4 | Depression (BDI score): AUD + Smoking > CG + Smoking Anxiety (STAI scores): AUD + Smoking > CG + Smoking Exclusion criteria for all participant groups included neurological disorders, psychiatric disorders, and vascular risk factors. | Duration of alcohol use (y): 29 ± 9 Lifetime average alcohol use (drinks/month): 229 ± 151 One-year average alcohol use (drinks/month): 299 ± 159 | Days: 14 ± 10 (range: 1–31) | IGT BART |
| − |
| CG + Smoking (n = 35) Age (y): 47.4 ± 10.2 Sex (m/f): 31/4 Education: 14.7 ± 2.2 | |||||||
| CG Non-smoking (n = 29) Age (y): 47.2 ± 11.2 Sex (m/f): 24/5 Education: 17.1 ± 2 | |||||||
| Noël et al. (2007) [54]; Noël et al. (2011) [55] | AUD# (n = 30) Age (y): 45.8 ± 9.5 Sex (m/f): 20/10 Education: 10.7 ± 2 | Depression (MADRS score): AUD > CG Anxiety (STAI scores): AUD > CG Exclusion criteria for the AUD group included other current Axis I diagnoses, a history of significant medical illness, head injury, and overt cognitive dysfunction. | Years of heavy drinking: 14.05 ± 8.7/17.05 ± 8.7 8 Daily quantity (grams): 352.5 ± 240.5 Number of prior detoxifications: 4.5 ± 1.7 | Days: 19.3 ± 2.5 (minimum: 15) (range: 18–21) | IGT | Noël et al. (2007) [54]:
| + |
| CG (n = 30) Age (y): 44.1 ± 8.9 Sex (m/f): 19/11 Education: 10.8 ± 2.5 | |||||||
| Roopesh et al. (2017) [58] | AUD# (n = 26) Age (y): 33.88 ± 8.28 Sex: Male (all participants) Education (y): 9.61 ± 4.11 | Exclusion criteria for the AUD group included comorbid psychiatric, major medical, neurological, or neurosurgical disorders. | AUD severity (SADQ score): 31.73 ± 10.66 | Days: 14 (SD n.r.) | EGT |
| + |
| CG (n = 26) Age (y): 32.69 ± 6.23 Sex: Male (all participants) Education (y): 11.92 ± 4.7 | |||||||
| Salgado et al. (2009) [97] | AUD# (n = 31) Age (y): 48.97 ± 6.1 Sex (m/f): 26/5 Education (y): 10.55 ± 2.6 | Exclusion criteria for both participant groups included substance-related disorders disorders, current major depressive disorder or manic/hippomanic episode, a history of psychotic disorder, obsessive-compulsive disorder, impulse control related disorders such as pathological gambling, borderline personality, attention-deficit/hyperactivity disorder or eating disorders, or a lifetime history of traumatic brain injury/vascular brain disorder. | AUD duration (y): nearly 10–15 (SD n.r.) Duration of alcohol use (y): nearly 30 (SD n.r.). Quantity of use: Men (units per week): > 51 Women (units per week): >31 | Range (days): 15–120 Shorter abstinence (15–30 days): n = 20 Longer abstinence (60–120 days): n = 9 | IGT |
| + |
| CG (n = 30) Age (y): 46.93 ± 8.3 Sex (m/f): 20/10 Education (y): 11.07 ± 4.0 | |||||||
| Sehrig et al. (2019) [98] | AUD* (n = 39) Age (y): 43.2 ± 8.4 Sex (m/f): 72%/28% Education (y): 10.2 ± 1.6 | n.r. | n.r. | AUD participants were abstinent at time of assessment (duration: n.r.) | BART |
| − |
| CG (n = 35) Age (y): 42.7 ± 9.9 Sex (m/f): 66%/34% Education (y): 12.2 ± 1.4 | |||||||
| Sönmez et al. (2023) [99] | AUD* (n = 85) Age (y): 46.33 ± 10 Sex: Male (all participants) Education (y): 9.35 ± 3.20 | Exclusion criteria for the AUD group included having drug-related cognitive deficiencies, severe comorbid psychiatric disorders, or other medical conditions that could hamper the understanding of study instructions. | n.r. | Minimum (weeks): 3 | IGT |
| + |
| CG (n = 87) Age (y): 45.40 ± 12.16 Sex: Male (all participants) Education (y): 9.21 ± 3.64 | |||||||
| Sübay et al. (2021) [100] | AUD* (n = 40) Age (y): 46.58 ± 10.06 Sex: Male (all participants) Education (y): 8.73 ± 2.99 | Exclusion criteria for the AUD group included having drug-related cognitive deficiencies, severe comorbid psychiatric disorders, or other medical conditions that could hamper the understanding of study instructions. | Addiction severity (API score): 11.19 ± 2.88 Alcohol craving (PACS score): 6.88 ± 7.5 Age at onset alcohol use (y): 19.13 ± 3.98 Duration of regular alcohol use (y): 22.30 ± 10.48 | Minimum (weeks): 3 | IGT |
| + |
| CG (n = 40) Age (y): 37.45 ± 12.16 Sex: Male (all participants) Education (y): 9.25 ± 2.33 | |||||||
| Tomassini et al. (2012) [101] | AUD# (n = 26) Age (y): 46.15 ± 7.67 Sex (m/f): 21/6 Education (y): 9.38 ± 2.77 | n.r. | Age of onset AUD (y): 23.19 ± 9.04 | Months: 16.85 ± 13.21 (minimum: 6) | IGT |
| + |
| CG (n = 24) Age (y): 40.08 ± 12.79 Sex (m/f): 13/11 Education (y): 12.37 ± 3.40 | |||||||
| Van der Plas et al. (2009) [61] | Substance-dependent group, using alcohol ≥80% of the time. SD-AUD# (n = 33) Age (y): 37.9 ± 9.9 Sex (m/f): 15/18 Education (y): 13.8 ± 2.4 | Exclusion criteria for the SD-AUD group included presence of psychosis, past head injury or seizure disorder. The comorbidities that were assessed were psychoses, major depressive disorder, and anxiety disorders. A sum score of >3 on the SCID for each of these comorbidities led to exclusion. | AUD duration (y): 19.5 ± 10.4 Frequency of use in 30 days before assessment: 2.7 ± 3.5 | Minimum (days): 15 | IGT |
| + |
| CG (n = 36) Age (y): 28.9 ± 9.8 Sex (m/f): 19/17 Education (y): 16.2 ± 2.4 | |||||||
| Vitoria-Estruch et al. (2018) [102] | Interpersonal violence perpetrators with AUD (AUD* + IPV) (n = 28) Age (y): 40.21 ± 11.90 Sex: Male (all participants) Education; Primary/lower secondary: 71.43% Upper secondary/vocational training: 25% University: 3.57% | Exclusion criteria for the AUD + IPV group included having any mental illness and psychopathological signs. History of TBI: 48.14% | Age at first use (y): 16.25 ± 2.17 Duration of use (y): 21.83 ± 10.78 Quantity: 69.10 ± 85.60 | Months: 0.33 ± 0.78 | CGT |
| +/− |
| Interpersonal violence perpetrators without AUD (CG + IPV) (n = 35) Age (y): 39.34 ± 9.83 Sex: Male (all participants) Education: Primary/lower secondary: 45.71% Upper secondary/vocational training: 48.57% University: 5.72% | |||||||
| CG (n = 37) Age (y): 41.75 ± 11 Sex: Male (all participants) Education: Primary/lower secondary: 43.24% Upper secondary/vocational training: 45.95% University: 10.81% | |||||||
| Xie et al. (2018) [103] | AUD# (n = 48) Age (y): 48.21 ± 5.89 Sex (m/f): 40/8 Education (y): 10.46 ± 1.79 | Exclusion criteria for both participant groups included current or past psychological disorders such as anxiety and depression, or obvious brain lesions. | AUD severity (MAST score): 12.69 ± 4.12 | Minimum (days): 14 | IGT GDT |
| + |
| CG (n = 50) Age (y): 47.70 ± 6 Sex (m/f): 43/7 Education (y): 10.72 ± 2.06 | |||||||
| Zorlu et al. (2013) [104] | AUD# (n = 17) Age (y): 47 ± 7 Sex: Male (all participants) Education (y): 7.6 ± 2.8 | Exclusion criteria for the AUD group included other substance disorders, current or past history of Axis I psychiatric disorders (except for a past major depressive disorder), a current or past history of significant neurological disorders, or severe medical issues (e.g., HIV). | AUD duration (y): 12.2 ± 7.3 Duration of use (y): 29.7 ± 7.5 Age at first use (y): 17.3 ± 3.9 Quantity (drinks per day): 18.2 ± 3.7 | Minimum (days): 14 | IGT |
| +/− |
| CG (n = 16) Age (y): 46.7 ± 7.5 Sex: Male (all participants) Education (y): 8 ± 2.2 | |||||||
| Zorlu et al. (2014) [105] | AUD# (n = 12) Age (y): 53.9 ± 6.3 Sex: Male (all participants) Education (y): 7.6 ± 2.8 | Past history of alcohol-induced mood disorder with depressive features: n = 7 Exclusion criteria for the AUD group included other substance disorders, current or past history of Axis I psychiatric disorders (except for a past alcohol-induced mood disorder with depressive features), a current or past history of significant neurological disorders, or severe medical issues (e.g., HIV). | AUD duration: 24.6 ± 9.8 Duration of use: 39.2 ± 6.9 Age at first use (y): 14.8 ± 3.7 | Months: 27.8 ± 22.6 (range: 6–72) | IGT |
| − |
| CG (n = 13) Age (y): 52.1 ± 4.4 Sex: Male (all participants) Education (y): 8 ± 2.2 | |||||||
| Zorick et al. (2022) [62] | AUD# (n = 12) Age (y): 43.2 ± 8.1 Sex (m/f): 8/4 Education (y): 12.9 ± 1.5 | Depression (BDI score): AUD = CG Exclusion criteria for both groups included any recent (comorbid) mental illness, including depression. | Quantity (drinks per day): 6.0 ± 3.3 | Study included active alcohol dependent individuals. Participants should maintain abstinence for a minimum of 16 h per testing day. | BART CFT/LA(G)T |
| − |
| CG (n = 13) Age (y): 38.3 ± 8.9 Sex (m/f): 5/8 Education (y): 13.8 ± 1.5 |
3.2. IGT
3.3. CGT
3.4. BART
3.5. RTT
3.6. GDT
3.7. CFT/LA(G)T
3.8. EDMT
3.9. Outcomes on Other Risky Decision-Making Tasks
3.10. Associations between Risky Decision-Making and Demographic, Clinical, and Alcohol-Use-Related Variables
3.10.1. Demographic Characteristics
3.10.2. Clinical Characteristics
3.10.3. Alcohol-Use-Related Variables
Relapse to Drinking
4. Discussion
4.1. Outcomes on Risky Decision-Making Tasks
4.2. The SMT of Addiction
4.3. Associations between Risky Decision-Making and Demographic, Clinical, and Alcohol-Use-Related Variables
4.4. Limitations and Future Research Directions
5. Conclusions
Supplementary Materials
Author Contributions
Funding
Informed Consent Statement
Data Availability Statement
Conflicts of Interest
References
- Damasio, A.R. Descartes’ Error: Emotion, Reason, and the Human Brain; G. P. Putnam: New York, NY, USA, 1994. [Google Scholar]
- Shimp, K.G.; Mitchell, M.R.; Beas, B.S.; Bizon, J.L.; Setlow, B. Affective and Cognitive Mechanisms of Risky Decision Making. Neurobiol. Learn. Mem. 2015, 117, 60–70. [Google Scholar] [CrossRef] [PubMed]
- Kahneman, D.; Frederick, S. A Model of Heuristic Judgment. In Cambridge Handbook of Thinking and Reasoning; Holyoak, K.J., Morrison, R.G., Eds.; Cambridge University Press: Cambridge, UK, 2005; pp. 267–294. [Google Scholar]
- Kahneman, D. A Perspective on Judgment and Choice: Mapping Bounded Rationality. Am. Psychol. 2003, 58, 679–720. [Google Scholar] [CrossRef] [PubMed]
- Dahlbäck, O. Criminality and Risk-Taking. Pers. Individ. Dif. 1990, 11, 265–272. [Google Scholar] [CrossRef]
- Goldenberg, D.; Telzer, E.H.; Lieberman, M.D.; Fuligni, A.; Galván, A. Neural Mechanisms of Impulse Control in Sexually Risky Adolescents. Dev. Cogn. Neurosci. 2013, 6, 23–29. [Google Scholar] [CrossRef]
- Chen, S.; Yang, P.; Chen, T.; Su, H.; Jiang, H.; Zhao, M. Risky Decision-Making in Individuals with Substance Use Disorder: A Meta-Analysis and Meta-Regression Review. Psychopharmacology 2020, 237, 1893–1908. [Google Scholar] [CrossRef]
- American Psychiatric Association. Diagnostic and Statistical Manual of Mental Disorders, 5th ed.; American Psychiatric Publishing: Arlington, TX, USA, 2013. [Google Scholar] [CrossRef]
- Glantz, M.D.; Bharat, C.; Degenhardt, L.; Sampson, N.A.; Scott, K.M.; Lim, C.C.W.; Al-Hamzawi, A.; Alonso, J.; Andrade, L.H.; Cardoso, G.; et al. The Epidemiology of Alcohol Use Disorders Cross-Nationally: Findings from the World Mental Health Surveys. Addict. Behav. 2020, 102, 106128. [Google Scholar] [CrossRef]
- Degenhardt, L.; Charlson, F.; Ferrari, A.; Santomauro, D.; Erskine, H.; Mantilla-Herrara, A.; Whiteford, H.; Leung, J.; Naghavi, M.; Griswold, M.; et al. The Global Burden of Disease Attributable to Alcohol and Drug Use in 195 Countries and Territories, 1990–2016: A Systematic Analysis for the Global Burden of Disease Study. Lancet Psychiatry 2018, 392, 1015–1035. [Google Scholar] [CrossRef]
- Castillo-Carniglia, A.; Keyes, K.M.; Hasin, D.S.; Cerdá, M. Psychiatric Comorbidities in Alcohol Use Disorder. Lancet Psychiatry 2019, 6, 1068–1080. [Google Scholar] [CrossRef]
- Evert, D.L.; Oscar-Berman, M. Alcohol-Related Cognitive Impairments: An Overview of How Alcoholism May Affect the Workings of the Brain. Alcohol Health Res. World 1995, 19, 89–96. [Google Scholar]
- Le Berre, A.P.; Fama, R.; Sullivan, E.V. Executive Functions, Memory, and Social Cognitive Deficits and Recovery in Chronic Alcoholism: A Critical Review to Inform Future Research. Alcohol. Clin. Exp. Res. 2017, 41, 1432–1443. [Google Scholar] [CrossRef]
- Stavro, K.; Pelletier, J.; Potvin, S. Widespread and Sustained Cognitive Deficits in Alcoholism: A Meta-Analysis. Addict. Biol. 2013, 18, 203–213. [Google Scholar] [CrossRef]
- Fujiwara, E.; Brand, M.; Borsutzky, S.; Steingass, H.P.; Markowitsch, H.J. Cognitive Performance of Detoxified Alcoholic Korsakoff Syndrome Patients Remains Stable over Two Years. J. Clin. Exp. Neuropsychol. 2008, 30, 576–587. [Google Scholar] [CrossRef]
- Bechara, A.; Dolan, S.; Denburg, N.; Hindes, A.; Anderson, S.W.; Nathan, P.E. Decision-Making Deficits, Linked to a Dysfunctional Ventromedial Prefrontal Cortex, Revealed in Alcohol and Stimulant Abusers. Neuropsychologia 2001, 39, 376–389. [Google Scholar] [CrossRef]
- Burnette, E.M.; Grodin, E.N.; Ghahremani, D.G.; Galván, A.; Kohno, M.; Ray, L.A.; London, E.D. Diminished Cortical Response to Risk and Loss during Risky Decision Making in Alcohol Use Disorder. Drug Alcohol Depend. 2021, 218, 10839. [Google Scholar] [CrossRef]
- Koffarnus, M.N.; Kaplan, B.A. Clinical Models of Decision Making in Addiction. Pharmacol. Biochem. Behav. 2018, 164, 71–83. [Google Scholar] [CrossRef]
- Falk, D.; Yi, H.Y.; Hiller-Sturmhöfel, S. An Epidemiologic Analysis of Co-Occurring Alcohol and Drug Use and Disorders. Alcohol Res. Health 2008, 31, 100–110. [Google Scholar]
- Folco, K.L.; Fridberg, D.J.; Arcurio, L.R.; Finn, P.R.; Heiman, J.R.; James, T.W. Neural Mechanisms of Sexual Decision-Making in Women with Alcohol Use Disorder. Psychopharmacology 2021, 238, 1867–1883. [Google Scholar] [CrossRef]
- Korlakunta, A.; Reddy, C. High-Risk Behavior in Patients with Alcohol Dependence. Indian J. Psychiatry 2019, 61, 125–130. [Google Scholar] [CrossRef]
- Melugin, P.R.; Nolan, S.O.; Siciliano, C.A. Bidirectional Causality between Addiction and Cognitive Deficits. Int. Rev. Neurobiol. 2021, 157, 371–407. [Google Scholar] [CrossRef]
- Bechara, A. Decision Making, Impulse Control and Loss of Willpower to Resist Drugs: A Neurocognitive Perspective. Nat. Neurosci. 2005, 8, 1458–1463. [Google Scholar] [CrossRef]
- Olsen, V.V.; Lugo, R.G.; Sütterlin, S. The Somatic Marker Theory in the Context of Addiction: Contributions to Understanding Development and Maintenance. Psychol. Res. Behav. Manag. 2015, 8, 187–200. [Google Scholar] [CrossRef] [PubMed]
- Verdejo-Garcia, A.; Perez-Garcia, M.; Bechara, A. Emotion, Decision-Making and Substance Dependence: A Somatic-Marker Model of Addiction. Curr. Neuropharmacol. 2005, 4, 17–31. [Google Scholar] [CrossRef] [PubMed]
- Bechara, A.; Dolan, S.; Hindes, A. Decision-Making and Addiction (Part I): Impaired Activation of Somatic States in Substance Dependent Individuals When Pondering Decisions with Negative Future Consequences. Neuropsychologia 2002, 40, 1675–1689. [Google Scholar] [CrossRef]
- Brion, M.; D’Hondt, F.; Pitel, A.L.; Lecomte, B.; Ferauge, M.; de Timary, P.; Maurage, P. Executive Functions in Alcohol-Dependence: A Theoretically Grounded and Integrative Exploration. Drug Alcohol Depend. 2017, 177, 39–47. [Google Scholar] [CrossRef] [PubMed]
- Stephan, R.A.; Alhassoon, O.M.; Allen, K.E.; Wollman, S.C.; Hall, M.; Thomas, W.J.; Gamboa, J.M.; Kimmel, C.; Stern, M.; Sari, C.; et al. Meta-Analyses of Clinical Neuropsychological Tests of Executive Dysfunction and Impulsivity in Alcohol Use Disorder. Am. J. Drug Alcohol Abus. 2017, 43, 24–43. [Google Scholar] [CrossRef]
- Claus, E.D.; Kiehl, K.A.; Hutchison, K.E. Neural and Behavioral Mechanisms of Impulsive Choice in Alcohol Use Disorder. Alcohol. Clin. Exp. Res. 2011, 35, 1206–1219. [Google Scholar] [CrossRef]
- Bobova, L.; Finn, P.R.; Rickert, M.E.; Lucas, J. Disinhibitory Psychopathology and Delay Discounting in Alcohol Dependence: Personality and Cognitive Correlates. Exp. Clin. Psychopharmacol. 2009, 17, 51–61. [Google Scholar] [CrossRef]
- MacKillop, J.; Amlung, M.T.; Few, L.R.; Ray, L.A.; Sweet, L.H.; Munafò, M.R. Delayed Reward Discounting and Addictive Behavior: A Meta-Analysis. Psychopharmacology 2011, 216, 305–321. [Google Scholar] [CrossRef]
- Petry, N.M. Delay Discounting of Money and Alcohol in Actively Using Alcoholics, Currently Abstinent Alcoholics, and Controls. Psychopharmacology 2001, 154, 243–250. [Google Scholar] [CrossRef]
- Gerst, K.R.; Gunn, R.L.; Finn, P.R. Delay Discounting of Losses in Alcohol Use Disorders and Antisocial Psychopathology: Effects of a Working Memory Load. Alcohol. Clin. Exp. Res. 2017, 41, 1768–1774. [Google Scholar] [CrossRef]
- Genauck, A.; Quester, S.; Wüstenberg, T.; Mörsen, C.; Heinz, A.; Romanczuk-Seiferth, N. Reduced Loss Aversion in Pathological Gambling and Alcohol Dependence Is Associated with Differential Alterations in Amygdala and Prefrontal Functioning. Sci. Rep. 2017, 7, 16306. [Google Scholar] [CrossRef]
- Bernhardt, N.; Nebe, S.; Pooseh, S.; Sebold, M.; Sommer, C.; Birkenstock, J.; Zimmermann, U.S.; Heinz, A.; Smolka, M.N. Impulsive Decision Making in Young Adult Social Drinkers and Detoxified Alcohol-Dependent Patients: A Cross-Sectional and Longitudinal Study. Alcohol. Clin. Exp. Res. 2017, 41, 1794–1807. [Google Scholar] [CrossRef]
- Mellick, W.; Prisciandaro, J.J.; Brenner, H.; Brown, D.; Tolliver, B.K. A Multimethod Examination of Sensitivity to Reward and Sensitivity to Punishment in Bipolar Disorder and Alcohol Dependence: Results from a 2 × 2 Factorial Design. Psychopathology 2021, 54, 70–77. [Google Scholar] [CrossRef]
- Page, M.J.; McKenzie, J.E.; Bossuyt, P.M.; Boutron, I.; Hoffmann, T.C.; Mulrow, C.D.; Shamseer, L.; Tetzlaff, J.M.; Akl, E.A.; Brennan, S.E.; et al. The PRISMA 2020 Statement: An Updated Guideline for Reporting Systematic Reviews. BMJ 2021, 372, 71. [Google Scholar] [CrossRef]
- National Institute on Alcohol Abuse and Alcohol Use Disorder. A Comparison between DSM–IV and DSM–5; NIH Publication: Bethesda, MD, USA, 2013. [Google Scholar]
- Borenstein, M.; Hedges, L.V.; Higgins, J.P.T.; Rothstein, H.R. Introduction to Meta-Analysis; John Wiley & Sons: New York, NY, USA, 2009; p. 237. [Google Scholar] [CrossRef]
- Hedges, L.; Olkin, I. Statistical Methods for Meta-Analysis; Academic Press: New York, NY, USA, 1985. [Google Scholar]
- Lipsey, M.W.; Wilson, D.B. Practical Meta-Analysis; Sage Publications: Thousand Oaks, CA, USA, 2001. [Google Scholar]
- Cohen, J. Statistical Power Analysis for the Behavioral Sciences; Academic Press: New York, NY, USA, 1969. [Google Scholar]
- Higgins, J.P.T.; Thompson, S.G.; Deeks, J.J.; Altman, D.G. Measuring Inconsistency in Meta-Analyses. Br. Med. J. 2003, 327, 557–560. [Google Scholar] [CrossRef]
- The Cochrane Collaboration. Review Manager (RevMan), Version 5.3; The Nordic Cochrane Centre: Copenhagen, Denmark, 2014. [Google Scholar]
- Arcurio, L.R.; Finn, P.R.; James, T.W. Neural Mechanisms of High-Risk Decisions-to-Drink in Alcohol-Dependent Women. Addict. Biol. 2015, 20, 390–406. [Google Scholar] [CrossRef]
- Bjork, J.M.; Momenan, R.; Smith, A.R.; Hommer, D.W. Reduced Posterior Mesofrontal Cortex Activation by Risky Rewards in Substance-Dependent Patients. Drug Alcohol Depend. 2008, 95, 115–128. [Google Scholar] [CrossRef]
- Zhu, X.; Sundby, K.; Bjork, J.M.; Momenan, R. Alcohol Dependence and Altered Engagement of Brain Networks in Risky Decisions. Front. Hum. Neurosci. 2016, 10, 142. [Google Scholar] [CrossRef]
- Fishbein, D.H.; Krupitsky, E.; Flannery, B.A.; Langevin, D.J.; Bobashev, G.; Verbitskaya, E.; Augustine, C.B.; Bolla, K.I.; Zvartau, E.; Schech, B.; et al. Neurocognitive Characterizations of Russian Heroin Addicts without a Significant History of Other Drug Use. Drug Alcohol Depend. 2007, 90, 25–38. [Google Scholar] [CrossRef]
- Flannery, B.; Fishbein, D.; Krupitsky, E.; Langevin, D.; Verbitskaya, E.; Bland, C.; Bolla, K.; Egorova, V.; Bushara, N.; Tsoy, M.; et al. Gender Differences in Neurocognitive Functioning among Alcohol-Dependent Russian Patients. Alcohol. Clin. Exp. Res. 2007, 31, 745–754. [Google Scholar] [CrossRef]
- Galandra, C.; Crespi, C.; Basso, G.; Manera, M.R.; Giorgi, I.; Poggi, P.; Canessa, N. Decreased Information Processing Speed and Decision-Making Performance in Alcohol Use Disorder: Combined Neurostructural Evidence from VBM and TBSS. Brain Imaging Behav. 2021, 15, 205–215. [Google Scholar] [CrossRef] [PubMed]
- Canessa, N.; Basso, G.; Carne, I.; Poggi, P.; Gianelli, C. Increased Decision Latency in Alcohol Use Disorder Reflects Altered Resting-State Synchrony in the Anterior Salience Network. Sci. Rep. 2021, 11, 19581. [Google Scholar] [CrossRef] [PubMed]
- Loeber, S.; Duka, T.T.; Welzel, H.; Nakovics, H.; Heinz, A.; Flor, H.; Mann, K. Impairment of Cognitive Abilities and Decision Making after Chronic Use of Alcohol: The Impact of Multiple Detoxifications. Alcohol Alcohol. 2009, 44, 372–381. [Google Scholar] [CrossRef] [PubMed]
- Loeber, S.; Duka, T.; Márquez, H.W.; Nakovics, H.; Heinz, A.; Mann, K.; Flor, H. Effects of Repeated Withdrawal from Alcohol on Recovery of Cognitive Impairment under Abstinence and Rate of Relapse. Alcohol Alcohol. 2010, 45, 541–547. [Google Scholar] [CrossRef]
- Noël, X.; Bechara, A.; Dan, B.; Hanak, C.; Verbanck, P. Response Inhibition Deficit Is Involved in Poor Decision Making under Risk in Nonamnesic Individuals with Alcoholism. Neuropsychology 2007, 21, 778–786. [Google Scholar] [CrossRef]
- Noël, X.; Brevers, D.; Bechara, A.; Hanak, C.; Kornreich, C.; Verbanck, P.; Le Bon, O. Neurocognitive Determinants of Novelty and Sensation-Seeking in Individuals with Alcoholism. Alcohol Alcohol. 2011, 46, 407–415. [Google Scholar] [CrossRef]
- Galandra, C.; Crespi, C.; Basso, G.; Canessa, N. Impaired Learning from Regret and Disappointment in Alcohol Use Disorder. Sci. Rep. 2020, 10, 12104. [Google Scholar] [CrossRef]
- Kamarajan, C.; Rangaswamy, M.; Tang, Y.; Chorlian, D.B.; Pandey, A.K.; Roopesh, B.N.; Manz, N.; Saunders, R.; Stimus, A.T.; Porjesz, B. Dysfunctional Reward Processing in Male Alcoholics: An ERP Study during a Gambling Task. J. Psychiatr. Res. 2010, 44, 576–590. [Google Scholar] [CrossRef]
- Roopesh, B.; Sharma, M.; Tripathy, S.; Benegal, V. Failure to Utilize Feedback during Explicit Decision-Making Task in Alcohol-Dependent Patients. Ind. Psychiatry J. 2017, 26, 39–44. [Google Scholar] [CrossRef]
- Gilman, J.M.; Smith, A.R.; Bjork, J.M.; Ramchandani, V.A.; Momenan, R.; Hommer, D.W. Cumulative Gains Enhance Striatal Response to Reward Opportunities in Alcohol-Dependent Patients. Addict. Biol. 2015, 20, 580–593. [Google Scholar] [CrossRef]
- Kornreich, C.; Brevers, D.; Ermer, E.; Hanak, C.; Verbanck, P.; Campanella, S.; Noël, X. Polysubstance Dependent Patients Display a More Utilitarian Profile in Moral Decision-Making than Alcohol-Dependent Patients, Depressive Patients and Controls. Drug Alcohol Depend. 2013, 132, 434–440. [Google Scholar] [CrossRef]
- Van Der Plas, E.A.A.; Crone, E.A.; Van Den Wildenberg, W.P.M.; Tranel, D.; Bechara, A. Executive Control Deficits in Substance-Dependent Individuals: A Comparison of Alcohol, Cocaine, and Methamphetamine and of Men and Women. J. Clin. Exp. Neuropsychol. 2009, 31, 706–719. [Google Scholar] [CrossRef]
- Zorick, T.; Okita, K.; Renard, K.B.; Mandelkern, M.A.; Brody, A.L.; London, E.D. The Effects of Citalopram and Thalamic Dopamine D2/3 Receptor Availability on Decision-Making and Loss Aversion in Alcohol Dependence. Psychiatry J. 2022, 2022, 5663274. [Google Scholar] [CrossRef]
- Bechara, A.; Damasio, A.R.; Damasio, H.; Anderson, S.W. Insensitivity to Future Consequences Following Damage to Human Prefrontal Cortex. Cognition 1994, 50, 7–15. [Google Scholar] [CrossRef]
- Kim, Y.T.; Lee, S.J.; Kim, S.H. Effects of the History of Conduct Disorder on the Iowa Gambling Tasks. Alcohol. Clin. Exp. Res. 2006, 30, 466–472. [Google Scholar] [CrossRef]
- Rogers, R.D.; Everitt, B.J.; Baldacchino, A.; Blackshaw, A.J.; Swainson, R.; Wynne, K.; Baker, N.B.; Hunter, J.; Carthy, T.; Booker, E.; et al. Dissociable Deficits in the Decision-Making Cognition of Chronic Amphetamine Abusers, Opiate Abusers, Patients with Focal Damage to Prefrontal Cortex, and Tryptophan-Depleted Normal Volunteers: Evidence for Monoaminergic Mechanisms. Neuropsychopharmacology 1999, 20, 322–339. [Google Scholar] [CrossRef]
- Lejuez, C.W.; Richards, J.B.; Read, J.P.; Kahler, C.W.; Ramsey, S.E.; Stuart, G.L.; Strong, D.R.; Brown, R.A. Evaluation of a Behavioral Measure of Risk Taking: The Balloon Analogue Risk Task (BART). J. Exp. Psychol. Appl. 2002, 8, 75–84. [Google Scholar] [CrossRef]
- Bjork, J.M.; Hommer, D.W.; Grant, S.J.; Danube, C. Impulsivity in Abstinent Alcohol-Dependent Patients: Relation to Control Subjects and Type 1-/Type 2-like Traits. Alcohol 2004, 34, 133–150. [Google Scholar] [CrossRef]
- Brand, M.; Fujiwara, E.; Borsutzky, S.; Kalbe, E.; Kessler, J.; Markowitsch, H.J. Decision-Making Deficits of Korsakoff Patients in a New Gambling Task with Explicit Rules: Associations with Executive Functions. Neuropsychology 2005, 19, 267–277. [Google Scholar] [CrossRef]
- Tom, S.M.; Fox, C.R.; Trepel, C.; Poldrack, R.A. The Neural Basis of Loss Aversion in Decision-Making under Risk. Science 2007, 315, 515–518. [Google Scholar] [CrossRef]
- Brevers, D.; Bechara, A.; Cleeremans, A.; Kornreich, C.; Verbanck, P.; Noël, X. Impaired Decision-Making under Risk in Individuals with Alcohol Dependence. Alcohol. Clin. Exp. Res. 2014, 38, 1924–1931. [Google Scholar] [CrossRef] [PubMed]
- Levin, I.P.; Weller, J.A.; Pederson, A.A.; Harshman, L.A. Age-Related Differences in Adaptive Decision Making: Sensitivity to Expected Value in Risky Choice. Judgm. Decis. Mak. 2007, 2, 225–233. [Google Scholar] [CrossRef]
- Newman, J.P.; Patterson, C.M.; Kosson, D.S. Response Perseveration in Psychopaths. J. Abnorm. Psychol. 1987, 96, 145–148. [Google Scholar] [CrossRef]
- Goudriaan, A.E.; Oosterlaan, J.; De Beurs, E.; Van Den Brink, W. Decision Making in Pathological Gambling: A Comparison between Pathological Gamblers, Alcohol Dependents, Persons with Tourette Syndrome, and Normal Controls. Cogn. Brain Res. 2005, 23, 137–151. [Google Scholar] [CrossRef] [PubMed]
- Mellers, B.; Schwartz, A.; Ritov, I. Emotion-Based Choice. J. Exp. Psychol. Gen. 1999, 128, 332–345. [Google Scholar] [CrossRef]
- Lane, S.D.; Cherek, D.R. Analysis of Risk Taking in Adults with a History of High Risk Behavior. Drug Alcohol Depend. 2000, 60, 179–187. [Google Scholar] [CrossRef]
- Avcu Meriç, I.; Sönmez, M.B. Decision-Making, Interoceptive Awareness and Mindful Attention Awareness in Male Patients with Alcohol Use Disorder. Cogn. Neuropsychiatry 2022, 27, 35–48. [Google Scholar] [CrossRef]
- Bowden-Jones, H.; McPhillips, M.; Rogers, R.; Hutton, S.; Joyce, E. Risk-Taking on Tests Sensitive to Ventromedial Prefrontal Cortex Dysfunction Predicts Early Relapse in Alcohol Dependency: A Pilot Study. J. Neuropsychiatry Clin. Neurosci. 2005, 17, 417–420. [Google Scholar] [CrossRef]
- Brière, M.; Tocanier, L.; Allain, P.; Le Gal, D.; Allet, G.; Gorwood, P.; Gohier, B. Decision-Making Measured by the Iowa Gambling Task in Patients with Alcohol Use Disorders Choosing Harm Reduction versus Relapse Prevention Program. Eur. Addict. Res. 2019, 25, 182–190. [Google Scholar] [CrossRef]
- Cordovil De Sousa Uva, M.; Luminet, O.; Cortesi, M.; Constant, E.; Derely, M.; de Timary, P. Distinct Effects of Protracted Withdrawal on Affect, Craving, Selective Attention and Executive Functions among Alcohol-Dependent Patients. Alcohol Alcohol. 2010, 45, 241–246. [Google Scholar] [CrossRef]
- Czapla, M.; Simon, J.J.; Richter, B.; Kluge, M.; Friederich, H.C.; Herpertz, S.; Mann, K.; Herpertz, S.C.; Loeber, S. The Impact of Cognitive Impairment and Impulsivity on Relapse of Alcohol-Dependent Patients: Implications for Psychotherapeutic Treatment. Addict. Biol. 2016, 21, 873–884. [Google Scholar] [CrossRef]
- Dinesh, A.; Rai, S.; Praharaj, S.K. Decision-Making and Impulsivity in Patients with Alcohol Dependence Syndrome with Comorbid Attention Deficit Hyperactivity Disorder. Clin. Psychol. 2022, 26, 92–104. [Google Scholar] [CrossRef]
- Dom, G.; De Wilde, B.; Hulstijn, W.; Van Den Brink, W.; Sabbe, B. Decision-Making Deficits in Alcohol-Dependent Patients with and without Comorbid Personality Disorder. Alcohol. Clin. Exp. Res. 2006, 30, 1670–1677. [Google Scholar] [CrossRef]
- Fama, R.; Sullivan, E.V.; Sassoon, S.A.; Pfefferbaum, A.; Zahr, N.M. Impairments in Component Processes of Executive Function and Episodic Memory in Alcoholism, HIV Infection, and HIV Infection with Alcoholism Comorbidity. Alcohol. Clin. Exp. Res. 2016, 40, 2656–2666. [Google Scholar] [CrossRef]
- Fein, G.; Klein, L.; Finn, P. Impairment on a Simulated Gambling Task in Long-Term Abstinent Alcoholics. Alcohol. Clin. Exp. Res. 2004, 28, 487–491. [Google Scholar] [CrossRef]
- Fein, G.; McGillivray, S.; Finn, P. Normal Performance on a Simulated Gambling Task in Treatment-Naïve Alcohol-Dependent Individuals. Alcohol. Clin. Exp. Res. 2006, 30, 959–966. [Google Scholar] [CrossRef]
- Gonzalez, R.; Bechara, A.; Martin, E.M. Executive Functions among Individuals with Methamphetamine or Alcohol as Drugs of Choice: Preliminary Observations. J. Clin. Exp. Neuropsychol. 2007, 29, 155–159. [Google Scholar] [CrossRef]
- Harvanko, A.M.; Odlaug, B.L.; Schreiber, L.R.N.; Grant, J.E. Cognitive Task Performance and Frequency of Alcohol Usage in Young Adults. J. Addict. Med. 2012, 6, 106–111. [Google Scholar] [CrossRef]
- Khemiri, L.; Franck, J.; Jayaram-Lindström, N. Effect of Alcohol Use Disorder Family History on Cognitive Function. Psychol. Med. 2020, 52, 757–769. [Google Scholar] [CrossRef]
- Kim, Y.T.; Sohn, H.; Jeong, J. Delayed Transition from Ambiguous to Risky Decision Making in Alcohol Dependence during Iowa Gambling Task. Psychiatry Res. 2011, 190, 297–303. [Google Scholar] [CrossRef]
- Körner, N.; Schmidt, P.; Soyka, M. Decision Making and Impulsiveness in Abstinent Alcohol-Dependent People and Healthy Individuals: A Neuropsychological Examination. Subst. Abus. Treat. Prev. Policy 2015, 10, 24. [Google Scholar] [CrossRef] [PubMed]
- Lawrence, A.J.; Luty, J.; Bogdan, N.A.; Sahakian, B.J.; Clark, L. Problem Gamblers Share Deficits in Impulsive Decision-Making with Alcohol-Dependent Individuals. Addiction 2009, 104, 1006–1015. [Google Scholar] [CrossRef] [PubMed]
- Le Berre, A.P.; Vabret, F.; Cauvin, C.; Pinon, K.; Allain, P.; Pitel, A.L.; Eustache, F.; Beaunieux, H. Cognitive Barriers to Readiness to Change in Alcohol-Dependent Patients. Alcohol. Clin. Exp. Res. 2012, 36, 1542–1549. [Google Scholar] [CrossRef] [PubMed]
- Le Berre, A.P.; Rauchs, G.; La Joie, R.; Mézenge, F.; Boudehent, C.; Vabret, F.; Segobin, S.; Viader, F.; Allain, P.; Eustache, F.; et al. Impaired Decision-Making and Brain Shrinkage in Alcoholism. Eur. Psychiatry 2014, 29, 125–133. [Google Scholar] [CrossRef] [PubMed]
- Maurage, P.; Lannoy, S.; Dormal, V.; Blanco, M.; Trabut, J.B. Clinical Usefulness of the Iowa Gambling Task in Severe Alcohol Use Disorders: Link with Relapse and Cognitive-Physiological Deficits. Alcohol. Clin. Exp. Res. 2018, 42, 2266–2273. [Google Scholar] [CrossRef]
- Miranda, R.; MacKillop, J.; Meyerson, L.A.; Justus, A.; Lovallo, W.R. Influence of Antisocial and Psychopathic Traits on Decision-Making Biases in Alcoholics. Alcohol. Clin. Exp. Res. 2009, 33, 817–825. [Google Scholar] [CrossRef]
- Murray, D.E.; Durazzo, T.C.; Schmidt, T.P.; Murray, T.A.; Abé, C.; Guydish, J.; Meyerhoff, D.J. Regional Cerebral Blood Flow in Opiate Dependence Relates to Substance Use and Neuropsychological Performance. Addict. Biol. 2018, 23, 781–795. [Google Scholar] [CrossRef]
- Salgado, J.V.; Malloy-Diniz, L.F.; Campos, V.R.; Abrantes, S.S.C.; Fuentes, D.; Bechara, A.; Correa, H. Neuropsychological Assessment of Impulsive Behavior in Abstinent Alcohol-Dependent Subjects. Rev. Bras. Psiquiatr. 2009, 31, 4–9. [Google Scholar] [CrossRef]
- Sehrig, S.; Weiss, A.; Miller, G.A.; Rockstroh, B. Decision- and Feedback-Related Brain Potentials Reveal Risk Processing Mechanisms in Patients with Alcohol Use Disorder. Psychophysiology 2019, 56, e13450. [Google Scholar] [CrossRef]
- Sönmez, M.B.; Meriç, I.A.; Sübay, B.; Görgülü, Y. Relationship of Interoceptive Accuracy with Risky Decision-Making and Treatment Outcomes in Male Patients with Alcohol Use Disorder. J. Psychophysiol. 2023, 37, 1–11. [Google Scholar] [CrossRef]
- Sübay, B.; Sönmez, M.B. Interoceptive Awareness, Decision-Making and Impulsiveness in Male Patients with Alcohol or Opioid Use Disorder. Subst. Use Misuse 2021, 56, 1275–1283. [Google Scholar] [CrossRef]
- Tomassini, A.; Struglia, F.; Spaziani, D.; Pacifico, R.; Stratta, P.; Rossi, A. Decision Making, Impulsivity, and Personality Traits in Alcohol-Dependent Subjects. Am. J. Addict. 2012, 21, 263–267. [Google Scholar] [CrossRef]
- Vitoria-Estruch, S.; Romero-Martínez, A.; Lila, M.; Moya-Albiol, L. Differential Cognitive Profiles of Intimate Partner Violence Perpetrators Based on Alcohol Consumption. Alcohol 2018, 70, 61–71. [Google Scholar] [CrossRef]
- Xie, C.; Yuan, L.; Meng, Y.; Wang, K. Alcohol-Dependent Individuals Make Detrimental Decisions under Ambiguous and Perilous Conditions. Int. J. Ment. Health Addict. 2018, 16, 956–964. [Google Scholar] [CrossRef]
- Zorlu, N.; Gelal, F.; Kuserli, A.; Cenik, E.; Durmaz, E.; Saricicek, A.; Gulseren, S. Abnormal White Matter Integrity and Decision-Making Deficits in Alcohol Dependence. Psychiatry Res. Neuroimaging 2013, 214, 382–388. [Google Scholar] [CrossRef]
- Zorlu, N.; Karavul Ucman, T.; Gelal, F.; Colak Kalayci, C.; Polat, S.; Saricicek, A.; Kurtgöz Zorlu, P.; Gulseren, S. Abnormal White Matter Integrity in Long-Term Abstinent Alcohol Dependent Patients. Psychiatry Res. Neuroimaging 2014, 224, 42–48. [Google Scholar] [CrossRef]
- Brand, M.; Recknor, E.C.; Grabenhorst, F.; Bechara, A. Decisions under Ambiguity and Decisions under Risk: Correlations with Executive Functions and Comparisons of Two Different Gambling Tasks with Implicit and Explicit Rules. J. Clin. Exp. Neuropsychol. 2007, 29, 86–99. [Google Scholar] [CrossRef]
- Buelow, M.T.; Suhr, J.A. Construct Validity of the Iowa Gambling Task. Neuropsychol. Rev. 2009, 19, 102–114. [Google Scholar] [CrossRef]
- Kovács, I.; Richman, M.J.; Janka, Z.; Maraz, A.; Andó, B. Decision Making Measured by the Iowa Gambling Task in Alcohol Use Disorder and Gambling Disorder: A Systematic Review and Meta-Analysis. Drug Alcohol Depend. 2017, 181, 152–161. [Google Scholar] [CrossRef]
- Bechara, A.; Tranel, D.; Damasio, H.; Damasio, A.R. Failure to Respond Autonomically to Anticipated Future Outcomes Following Damage to Prefrontal Cortex. Cereb. Cortex 1996, 6, 215–225. [Google Scholar] [CrossRef]
- Brand, M.; Grabenhorst, F.; Starcke, K.; Vandekerckhove, M.M.P.; Markowitsch, H.J. Role of the Amygdala in Decisions under Ambiguity and Decisions under Risk: Evidence from Patients with Urbach-Wiethe Disease. Neuropsychologia 2007, 45, 1305–1317. [Google Scholar] [CrossRef] [PubMed]
- Clark, L.; Bechara, A.; Damasio, H.; Aitken, M.R.F.; Sahakian, B.J.; Robbins, T.W. Differential Effects of Insular and Ventromedial Prefrontal Cortex Lesions on Risky Decision-Making. Brain 2008, 131, 1311–1322. [Google Scholar] [CrossRef] [PubMed]
- Mochizuki, K.; Funahashi, S. Effect of Emotional Distracters on Cognitive Decision-Making in Cambridge Gambling Task. Psychologia 2009, 52, 122–136. [Google Scholar] [CrossRef]
- Pollak, Y.; Shalit, R.; Aran, A. Risk Taking and Adult Attention Deficit/Hyperactivity Disorder: A Gap between Real Life Behavior and Experimental Decision Making. Psychiatry Res. 2018, 259, 56–62. [Google Scholar] [CrossRef]
- Bogg, T.; Finn, P.R. An Ecologically Based Model of Alcohol-Consumption Decision Making: Evidence for the Discriminative and Predictive Role of Contextual Reward and Punishment Information. J. Stud. Alcohol Drugs 2009, 70, 446–457. [Google Scholar] [CrossRef]
- Ma, L.L.; Wang, Y.Y.; Yang, Z.H.; Huang, D.; Weng, H.; Zeng, X.T. Methodological Quality (Risk of Bias) Assessment Tools for Primary and Secondary Medical Studies: What Are They and Which Is Better? Mil. Med. Res. 2020, 7, 7. [Google Scholar] [CrossRef]


Disclaimer/Publisher’s Note: The statements, opinions and data contained in all publications are solely those of the individual author(s) and contributor(s) and not of MDPI and/or the editor(s). MDPI and/or the editor(s) disclaim responsibility for any injury to people or property resulting from any ideas, methods, instructions or products referred to in the content. |
© 2023 by the authors. Licensee MDPI, Basel, Switzerland. This article is an open access article distributed under the terms and conditions of the Creative Commons Attribution (CC BY) license (https://creativecommons.org/licenses/by/4.0/).
Share and Cite
Ariesen, A.-M.D.; Neubert, J.H.; Gaastra, G.F.; Tucha, O.; Koerts, J. Risky Decision-Making in Adults with Alcohol Use Disorder—A Systematic and Meta-Analytic Review. J. Clin. Med. 2023, 12, 2943. https://doi.org/10.3390/jcm12082943
Ariesen A-MD, Neubert JH, Gaastra GF, Tucha O, Koerts J. Risky Decision-Making in Adults with Alcohol Use Disorder—A Systematic and Meta-Analytic Review. Journal of Clinical Medicine. 2023; 12(8):2943. https://doi.org/10.3390/jcm12082943
Chicago/Turabian StyleAriesen, Akke-Marij D., Julia H. Neubert, Geraldina F. Gaastra, Oliver Tucha, and Janneke Koerts. 2023. "Risky Decision-Making in Adults with Alcohol Use Disorder—A Systematic and Meta-Analytic Review" Journal of Clinical Medicine 12, no. 8: 2943. https://doi.org/10.3390/jcm12082943