
Long-Term Adverse Effects of Mild COVID-19 Disease on Arterial Stiffness, and Systemic and Central Hemodynamics: A Pre-Post Study
 , ,
, ,
Abstract
:1. Introduction
2. Materials and Methods
2.1. Study Design
2.2. Participants
2.3. Study Procedures
2.4. Study Measurements
2.5. Sample Size Considerations
2.6. Data Analysis
3. Results
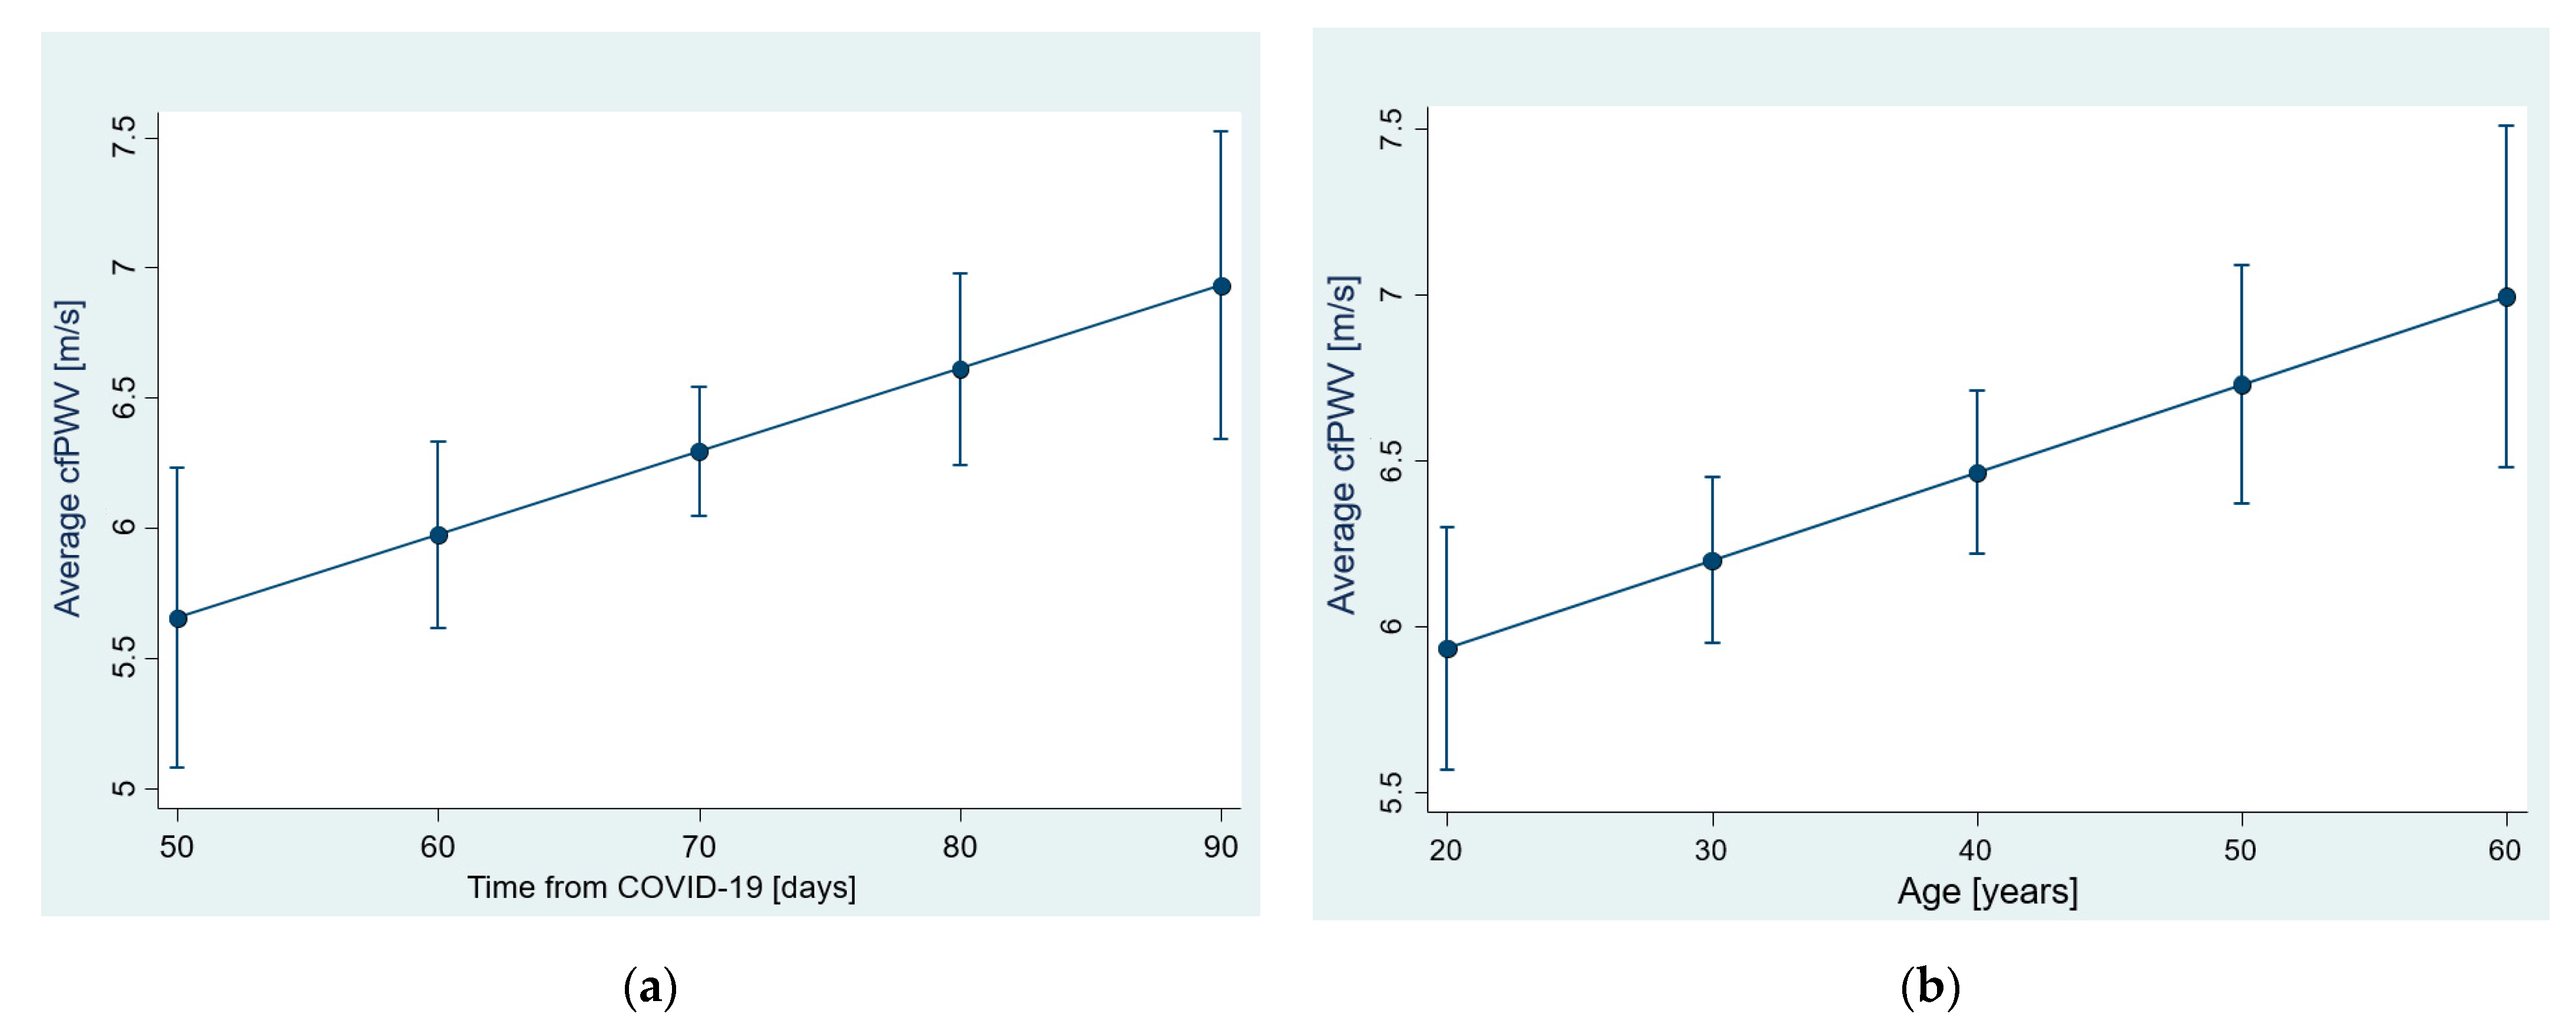
3.1. Arterial Stiffness—cfPWV
3.2. Arterial Stiffness—Augmentation Indices
3.3. Peripheral and Central Hemodynamics
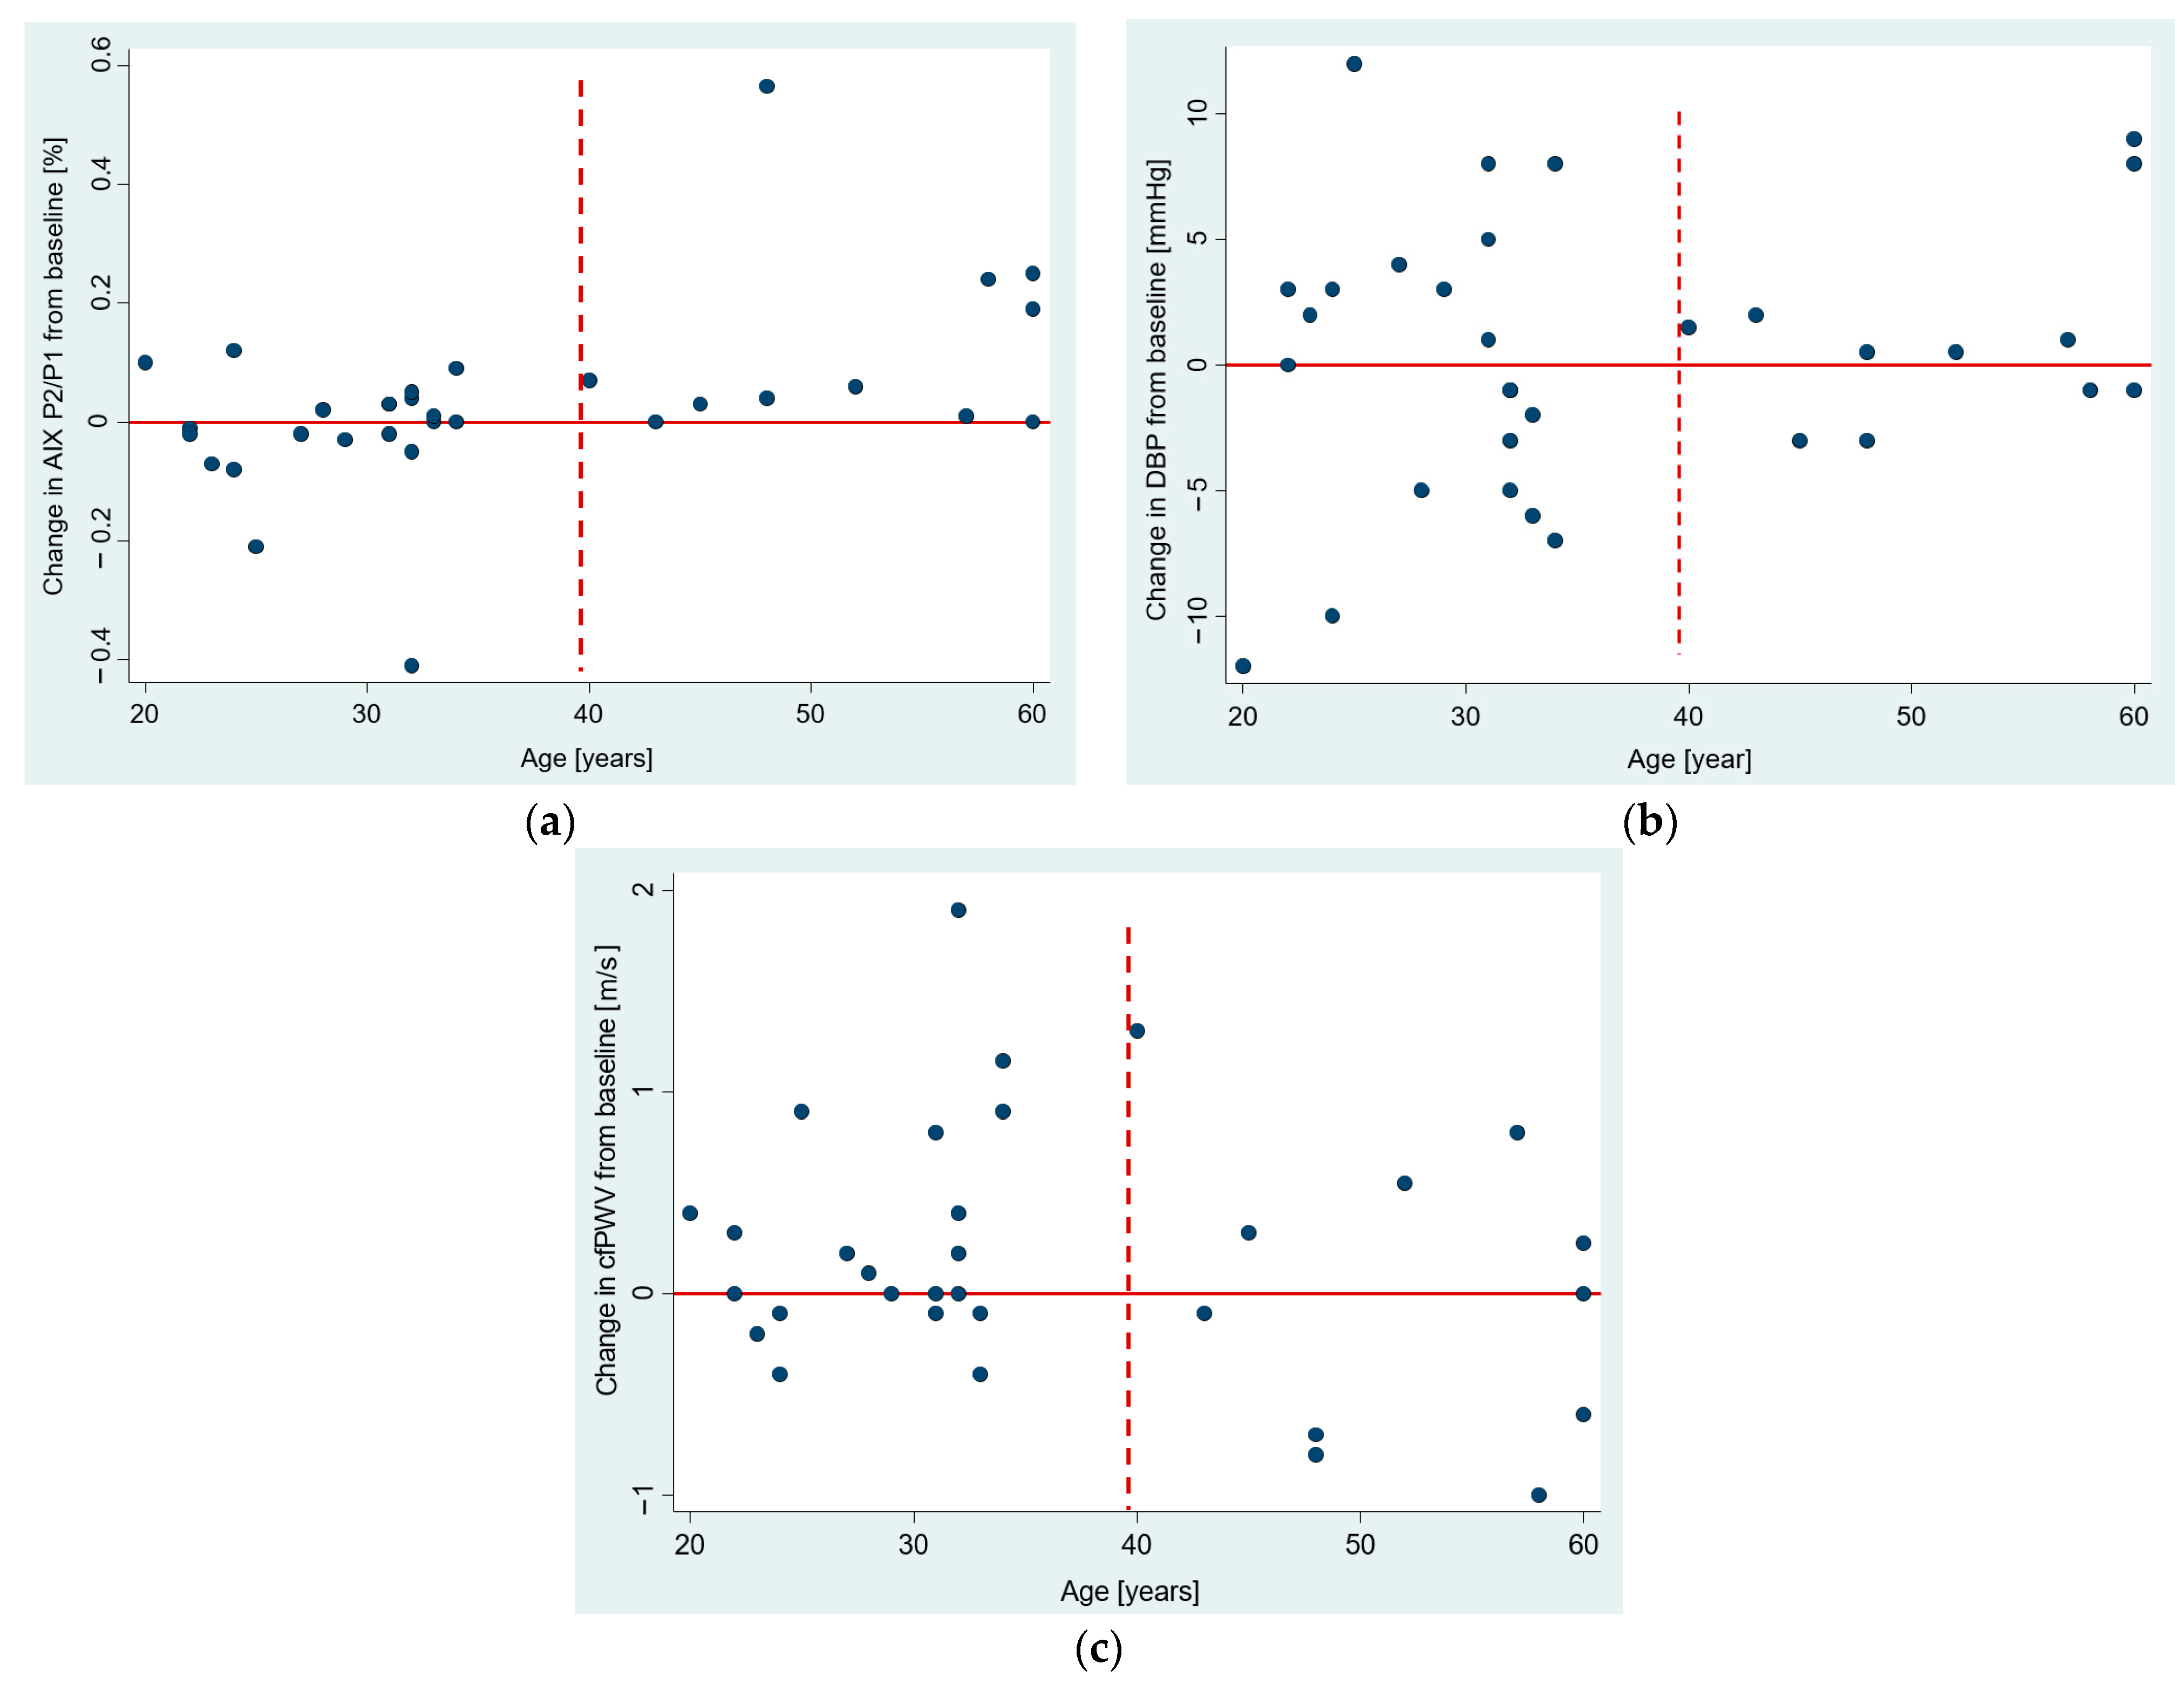
3.4. The Age Dependence of Pre-Post Changes in Investigated Parameters
4. Discussion
5. Conclusions
Author Contributions
Funding
Institutional Review Board Statement
Informed Consent Statement
Data Availability Statement
Acknowledgments
Conflicts of Interest
References
- Akhmerov, A.; Marban, E. COVID-19 and the Heart. Circ. Res. 2020, 126, 1443–1455. [Google Scholar] [CrossRef] [PubMed] [Green Version]
- Barrantes, F.J. The unfolding palette of COVID-19 multisystemic syndrome and its neurological manifestations. Brain Behav. Immun. Health 2021, 14, 100251. [Google Scholar] [CrossRef]
- Son, K.; Jamil, R.; Chowdhury, A.; Mukherjee, M.; Venegas, C.; Miyasaki, K.; Zhang, K.; Patel, Z.; Salter, B.; Yuen, A.C.Y.; et al. Circulating anti-nuclear autoantibodies in COVID-19 survivors predict long COVID symptoms. Eur. Respir. J. 2023, 61, 2200970. [Google Scholar] [CrossRef] [PubMed]
- Schnaubelt, S.; Oppenauer, J.; Tihanyi, D.; Mueller, M.; Maldonado-Gonzalez, E.; Zejnilovic, S.; Haslacher, H.; Perkmann, T.; Strassl, R.; Anders, S.; et al. Arterial stiffness in acute COVID-19 and potential associations with clinical outcome. J. Intern. Med. 2021, 290, 437–443. [Google Scholar] [CrossRef] [PubMed]
- Turan, T.; Özderya, A.; Şahin, S.; Konuş, A.H.; Kul, S.; Akyüz, A.R.; Kalaycıoğlu, E.; Sayın, M.R. Left ventricular global longitudinal strain in low cardiac risk outpatients who recently recovered from coronavirus disease 2019. Int. J. Cardiovasc. Imaging 2021, 37, 2979–2989. [Google Scholar] [CrossRef]
- Hoffmann, M.; Kleine-Weber, H.; Schroeder, S.; Kruger, N.; Herrler, T.; Erichsen, S.; Schiergens, T.S.; Herrler, G.; Wu, N.H.; Nitsche, A.; et al. SARS-CoV-2 Cell Entry Depends on ACE2 and TMPRSS2 and Is Blocked by a Clinically Proven Protease Inhibitor. Cell 2020, 181, 271–280.e8. [Google Scholar] [CrossRef]
- Lambadiari, V.; Kousathana, F.; Raptis, A.; Katogiannis, K.; Kokkinos, A.; Ikonomidis, I. Pre-Existing Cytokine and NLRP3 Inflammasome Activation and Increased Vascular Permeability in Diabetes: A Possible Fatal Link With Worst COVID-19 Infection Outcomes? Front. Immunol. 2020, 11, 557235. [Google Scholar] [CrossRef]
- Tomasoni, D.; Italia, L.; Adamo, M.; Inciardi, R.M.; Lombardi, C.M.; Solomon, S.D.; Metra, M. COVID-19 and heart failure: From infection to inflammation and angiotensin II stimulation. Searching for evidence from a new disease. Eur. J. Heart Fail. 2020, 22, 957–966. [Google Scholar] [CrossRef]
- Ratchford, S.M.; Stickford, J.L.; Province, V.M.; Stute, N.; Augenreich, M.A.; Koontz, L.K.; Bobo, L.K.; Stickford, A.S.L. Vascular alterations among young adults with SARS-CoV-2. Am. J. Physiol. Heart Circ. Physiol. 2021, 320, H404–H410. [Google Scholar] [CrossRef]
- Szeghy, R.E.; Province, V.M.; Stute, N.L.; Augenreich, M.A.; Koontz, L.K.; Stickford, J.L.; Stickford, A.S.L.; Ratchford, S.M. Carotid stiffness, intima-media thickness and aortic augmentation index among adults with SARS-CoV-2. Exp. Physiol. 2022, 107, 694–707. [Google Scholar] [CrossRef]
- Laurent, S.; Cockcroft, J.; Van Bortel, L.; Boutouyrie, P.; Giannattasio, C.; Hayoz, D.; Pannier, B.; Vlachopoulos, C.; Wilkinson, I.; Struijker-Boudier, H. Expert consensus document on arterial stiffness: Methodological issues and clinical applications. Eur. Heart J. 2006, 27, 2588–2605. [Google Scholar] [CrossRef] [Green Version]
- Lacolley, P.; Regnault, V.; Nicoletti, A.; Li, Z.; Michel, J.B. The vascular smooth muscle cell in arterial pathology: A cell that can take on multiple roles. Cardiovasc. Res. 2012, 95, 194–204. [Google Scholar] [CrossRef] [Green Version]
- Lacolley, P.; Regnault, V.; Segers, P.; Laurent, S.V. Vascular smooth muscle cell and arterial stiffening: Relevance in development, ageing and disease. Phys. Rev. 2017, 97, 1555–1617. [Google Scholar] [CrossRef]
- Davies, J.I.; Struthers, A.D. Pulse wave analysis and pulse wave velocity: A critical review of their strengths and weaknesses. J. Hypertens. 2003, 21, 463–472. [Google Scholar] [CrossRef]
- McEniery, C.M.; Cockcroft, J.R.; Roman, M.J.; Franklin, S.S.; Wilkinson, I.B. Central blood pressure: Current evidence and clinical importance. Eur. Heart J. 2014, 35, 1719–1725. [Google Scholar] [CrossRef] [Green Version]
- Podrug, M.; Sunjic, B.; Bekavac, A.; Koren, P.; Dogas, V.; Mudnic, I.; Boban, M.; Jeroncic, A. The effects of experimental, meteorological, and physiological factors on short-term repeated pulse wave velocity measurements, and measurement difficulties: A randomized crossover study with two devices. Front. Cardiovasc. Med. 2023, 9, 993971. [Google Scholar] [CrossRef]
- Podrug, M.; Šunjić, B.; Koren, P.; Đogaš, V.; Mudnić, I.; Boban, M.; Jerončić, A. What Is the Smallest Change in Pulse Wave Velocity Measurements That Can Be Attributed to Clinical Changes in Arterial Stiffness with Certainty: A Randomized Cross-Over Study. J. Cardiovasc. Dev. Dis. 2023, 10, 44. [Google Scholar] [CrossRef]
- Butlin, M.; Qasem, A.; Battista, F.; Bozec, E.; McEniery, C.M.; Millet-Amaury, E.; Pucci, G.; Wilkinson, I.B.; Schillaci, G.; Boutouyrie, P.; et al. Carotid-femoral pulse wave velocity assessment using novel cuff-based techniques: Comparison with tonometric measurement. J. Hypertens. 2013, 31, 2237–2243, discussion 2243. [Google Scholar] [CrossRef] [Green Version]
- Hwang, M.H.; Yoo, J.K.; Kim, H.K.; Hwang, C.L.; Mackay, K.; Hemstreet, O.; Nichols, W.W.; Christou, D.D. Validity and reliability of aortic pulse wave velocity and augmentation index determined by the new cuff-based SphygmoCor Xcel. J. Hum. Hypertens. 2014, 28, 475–481. [Google Scholar] [CrossRef]
- Townsend, R.R.; Wilkinson, I.B.; Schiffrin, E.L.; Avolio, A.P.; Chirinos, J.A.; Cockcroft, J.R.; Heffernan, K.S.; Lakatta, E.G.; McEniery, C.M.; Mitchell, G.F.; et al. Recommendations for Improving and Standardizing Vascular Research on Arterial Stiffness: A Scientific Statement From the American Heart Association. Hypertension 2015, 66, 698–722. [Google Scholar] [CrossRef] [Green Version]
- Cohen, J. Statistical Power Analysis for the Behavioral Sciences, 2nd ed.; Routledge: New York, NY, USA, 1988; p. 15. 415p. [Google Scholar]
- Bastard, P.; Rosen, L.B.; Zhang, Q.; Michailidis, E.; Hoffmann, H.H.; Zhang, Y.; Dorgham, K.; Philippot, Q.; Rosain, J.; Beziat, V.; et al. Autoantibodies against type I IFNs in patients with life-threatening COVID-19. Science 2020, 370, eabd4585. [Google Scholar] [CrossRef]
- Gatto, M.; Perricone, C.; Tonello, M.; Bistoni, O.; Cattelan, A.M.; Bursi, R.; Cafaro, G.; De Robertis, E.; Mencacci, A.; Bozza, S.; et al. Frequency and clinical correlates of antiphospholipid antibodies arising in patients with SARS-CoV-2 infection: Findings from a multicentre study on 122 cases. Clin. Exp. Rheumatol. 2020, 38, 754–759. [Google Scholar] [PubMed]
- Zuo, Y.; Estes, S.K.; Ali, R.A.; Gandhi, A.A.; Yalavarthi, S.; Shi, H.; Sule, G.; Gockman, K.; Madison, J.A.; Zuo, M.; et al. Prothrombotic autoantibodies in serum from patients hospitalized with COVID-19. Sci. Transl. Med. 2020, 12, eabd3876. [Google Scholar] [CrossRef] [PubMed]
- Douaud, G.; Lee, S.; Alfaro-Almagro, F.; Arthofer, C.; Wang, C.; McCarthy, P.; Lange, F.; Andersson, J.L.R.; Griffanti, L.; Duff, E.; et al. SARS-CoV-2 is associated with changes in brain structure in UK Biobank. Nature 2022, 604, 697–707. [Google Scholar] [CrossRef] [PubMed]
- Proal, A.D.; VanElzakker, M.B. Long COVID or Post-acute Sequelae of COVID-19 (PASC): An Overview of Biological Factors That May Contribute to Persistent Symptoms. Front. Microbiol. 2021, 12, 698169. [Google Scholar] [CrossRef]
- Su, Y.; Yuan, D.; Chen, D.G.; Ng, R.H.; Wang, K.; Choi, J.; Li, S.; Hong, S.; Zhang, R.; Xie, J.; et al. Multiple early factors anticipate post-acute COVID-19 sequelae. Cell 2022, 185, 881–895.e20. [Google Scholar] [CrossRef]
- Jain, S.; Khera, R.; Corrales-Medina, V.F.; Townsend, R.R.; Chirinos, J.A. Inflammation and arterial stiffness in humans. Atherosclerosis 2014, 237, 381–390. [Google Scholar] [CrossRef]
- Maamar, M.; Artime, A.; Pariente, E.; Fierro, P.; Ruiz, Y.; Gutierrez, S.; Tobalina, M.; Diaz-Salazar, S.; Ramos, C.; Olmos, J.M.; et al. Post-COVID-19 syndrome, low-grade inflammation and inflammatory markers: A cross-sectional study. Curr. Med. Res. Opin. 2022, 38, 901–909. [Google Scholar] [CrossRef]
- Chang, R.; Yen-Ting Chen, T.; Wang, S.I.; Hung, Y.M.; Chen, H.Y.; Wei, C.J. Risk of autoimmune diseases in patients with COVID-19: A retrospective cohort study. EClinicalMedicine 2023, 56, 101783. [Google Scholar] [CrossRef]
- Thiebaud, R.S.; Fahs, C.A.; Rossow, L.M.; Loenneke, J.P.; Kim, D.; Mouser, J.G.; Beck, T.W.; Bemben, D.A.; Larson, R.D.; Bemben, M.G. Effects of age on arterial stiffness and central blood pressure after an acute bout of resistance exercise. Eur. J. Appl. Physiol. 2016, 116, 39–48. [Google Scholar] [CrossRef]
- Rosenberg, A.; Lane-Cordova, A.; Bunsawat, K.; Ouk Wee, S.; Baynard, T.; Fernhall, B. 5.3 The influence of sex and age on arterial function in response to an acute inflammatory stimulus. Artery Res. 2015, 12, 46. [Google Scholar] [CrossRef]
- Wang, Y.; Fu, Z.; Li, X.; Liang, Y.; Pei, S.; Hao, S.; Zhu, Q.; Yu, T.; Pei, Y.; Yuan, J.; et al. Cytoplasmic DNA sensing by KU complex in aged CD4(+) T cell potentiates T cell activation and aging-related autoimmune inflammation. Immunity 2021, 54, 632–647.e639. [Google Scholar] [CrossRef]
- Palatini, P.; Casiglia, E.; Gasowski, J.; Gluszek, J.; Jankowski, P.; Narkiewicz, K.; Saladini, F.; Stolarz-Skrzypek, K.; Tikhonoff, V.; Van Bortel, L.; et al. Arterial stiffness, central hemodynamics, and cardiovascular risk in hypertension. Vasc. Health Risk Manag. 2011, 7, 725–739. [Google Scholar] [CrossRef] [Green Version]
- Martínez-Salazar, B.; Holwerda, M.; Stüdle, C.; Piragyte, I.; Mercader, N.; Engelhardt, B.; Rieben, R.; Döring, Y. COVID-19 and the Vasculature: Current Aspects and Long-Term Consequences. Front. Cell Dev. Biol. 2022, 10, 824851. [Google Scholar] [CrossRef]
- Lambadiari, V.; Mitrakou, A.; Kountouri, A.; Thymis, J.; Katogiannis, K.; Korakas, E.; Varlamos, C.; Andreadou, I.; Tsoumani, M.; Triantafyllidi, H.; et al. Association of COVID-19 with impaired endothelial glycocalyx, vascular function and myocardial deformation 4 months after infection. Eur. J. Heart Fail. 2021, 23, 1916–1926. [Google Scholar] [CrossRef]
- Ikonomidis, I.; Lambadiari, V.; Mitrakou, A.; Kountouri, A.; Katogiannis, K.; Thymis, J.; Korakas, E.; Pavlidis, G.; Kazakou, P.; Panagopoulos, G.; et al. Myocardial work and vascular dysfunction are partially improved at 12 months after COVID-19 infection. Eur. J. Heart Fail. 2022, 24, 727–729. [Google Scholar] [CrossRef]
- Akpek, M. Does COVID-19 Cause Hypertension? Angiology 2022, 73, 682–687. [Google Scholar] [CrossRef]
- Nandadeva, D.; Young, B.E.; Stephens, B.Y.; Grotle, A.K.; Skow, R.J.; Middleton, A.J.; Haseltine, F.P.; Fadel, P.J. Blunted peripheral but not cerebral vasodilator function in young otherwise healthy adults with persistent symptoms following COVID-19. Am. J. Physiol. Heart Circ. Physiol. 2021, 321, H479–H484. [Google Scholar] [CrossRef]
- Szeghy, R.E.; Stute, N.L.; Province, V.M.; Augenreich, M.A.; Stickford, J.L.; Stickford, A.S.L.; Ratchford, S.M. Six-month longitudinal tracking of arterial stiffness and blood pressure in young adults following SARS-CoV-2 infection. J. Appl. Physiol. 2022, 132, 1297–1309. [Google Scholar] [CrossRef]
- Stute, N.L.; Szeghy, R.E.; Stickford, J.L.; Province, V.P.; Augenreich, M.A.; Ratchford, S.M.; Stickford, A.S.L. Longitudinal observations of sympathetic neural activity and hemodynamics during 6 months recovery from SARS-CoV-2 infection. Physiol. Rep. 2022, 10, e15423. [Google Scholar] [CrossRef]
- Grillo, A.; Salvi, P.; Furlanis, G.; Baldi, C.; Rovina, M.; Salvi, L.; Faini, A.; Bilo, G.; Fabris, B.; Carretta, R.; et al. Mean arterial pressure estimated by brachial pulse wave analysis and comparison with currently used algorithms. J. Hypertens. 2020, 38, 2161–2168. [Google Scholar] [CrossRef] [PubMed]


| Characteristic | Statistics |
|---|---|
| Sex, N (%) Male Female | 18 (56%) 14 (44%) |
| Age (years), mean ± SD | 36.6 ± 12.6 |
| BMI, median (IQR) | 28 (24.5 to 31.4) |
| Hypertension, N (%) | 3 (9%) |
| Diabetes, N (%) | 2 (6%) |
| Dyslipidemia, N(%) | 0 (0%) |
| Familial history of CV disease, N (%) | 7 (22%) |
| Smoking, N (%) No Yes Ex-smoker | 17 (53%) 7 (22%) 8 (25%) |
| Smoking [cigarettes per day], median (range) * | 5–10 cigarettes (1–10) |
| Parameter | Pre-Infection | Post-Infection |
|---|---|---|
| Systemic Hemodynamics | ||
| SBP (mmHg), mean ± SD | 120 ± 9 | 119 ± 9 |
| DBP (mmHg), mean ± SD | 70 ± 8 | 71 ± 9 |
| MAP (mmHg), mean ± SD | 86 ± 8 | 85 ± 10 |
| PP (mmHg), median (IQR) | 47 (43, 54) | 47 (43, 51) |
| HR (bpm), mean ± SD | 65 ± 10 | 64 ± 7 |
| Central Hemodynamics | ||
| cSBP (mmHg), mean ± SD | 107 ± 7 | 107 ± 9 |
| cDBP (mmHg), mean ± SD | 71 ± 8 | 72 ± 9 |
| cPP (mmHg), mean ± SD | 36 ± 6 | 35 ± 6 |
| Carotid–Femoral Pulse Wave Velocity | ||
| cfPWV (m/s), mean ± SD | 6.3 ± 0.7 | 6.5 ± 1.0 |
| Pulse Wave Analysis | ||
| Aortic Augmentation (mmHg), mean ± SD | 7 ± 5 | 7 ± 6 |
| Aortic AIx, P2/P1 (%), mean ± SD | 19% ± 13% | 20% ± 16% |
| Aortic AIx, AP/PP (%), mean ± SD | 123% ± 13% | 126% ± 19% |
| Aortic AIx@HR75, P2/P1 (%), mean ± SD | 15% ± 14% | 15% ± 17% |
| Pre–Post Change in: | Predictor | B (95% CI) | p-Value | Adjusted Simple Model R2 | Adjusted Final Model R2 |
|---|---|---|---|---|---|
| Systemic and Central Hemodynamics | |||||
| SBP (mmHg) | Baseline value * | –0.46 (–0.68 to –0.24) | <0.001 | 21 § | 21 § |
| DBP (mmHg) | no significant model | ||||
| PP (mmHg) | Baseline value | –0.35 (–0.68 to –0.02) | 0.041 | 26 §§ | 30 §§ |
| Device, XCEL vs. CvMs | 4.16 (–0.02 to 8.34) | 0.051 † | 12 | ||
| MAP (mmHg) | no significant model | ||||
| cSBP (mmHg) | Baseline value | –0.24 (–0.44 to –0.03) | 0.026 | 3 | 3 |
| cDBP (mmHg) | no significant model | ||||
| cPP (mmHg) | Baseline value | –0.36 (–0.71 to –0.18) | 0.040 | 12 | 12 |
| Carotid–Femoral Pulse Wave Velocity | |||||
| cfPWV (m/s) | no significant model | ||||
| Pulse Wave Analysis | |||||
| Aortic AP (mmHg) | Age | 0.11 (0.02–0.21) | 0.023 | 7 | 7 |
| Aortic AIx, AP/PP (%) | Age | 0.003 (0.0008–0.006) | 0.013 | 10 | 10 |
| Aortic AIx, P2/P1 (%) | Age | 0.005 (0.002–0.008) | 0.001 | 18 § | 33 §§ |
| Time between measurements | 0.0003 (−0.00003, 0.0005) | 0.076 † | 17 § | ||
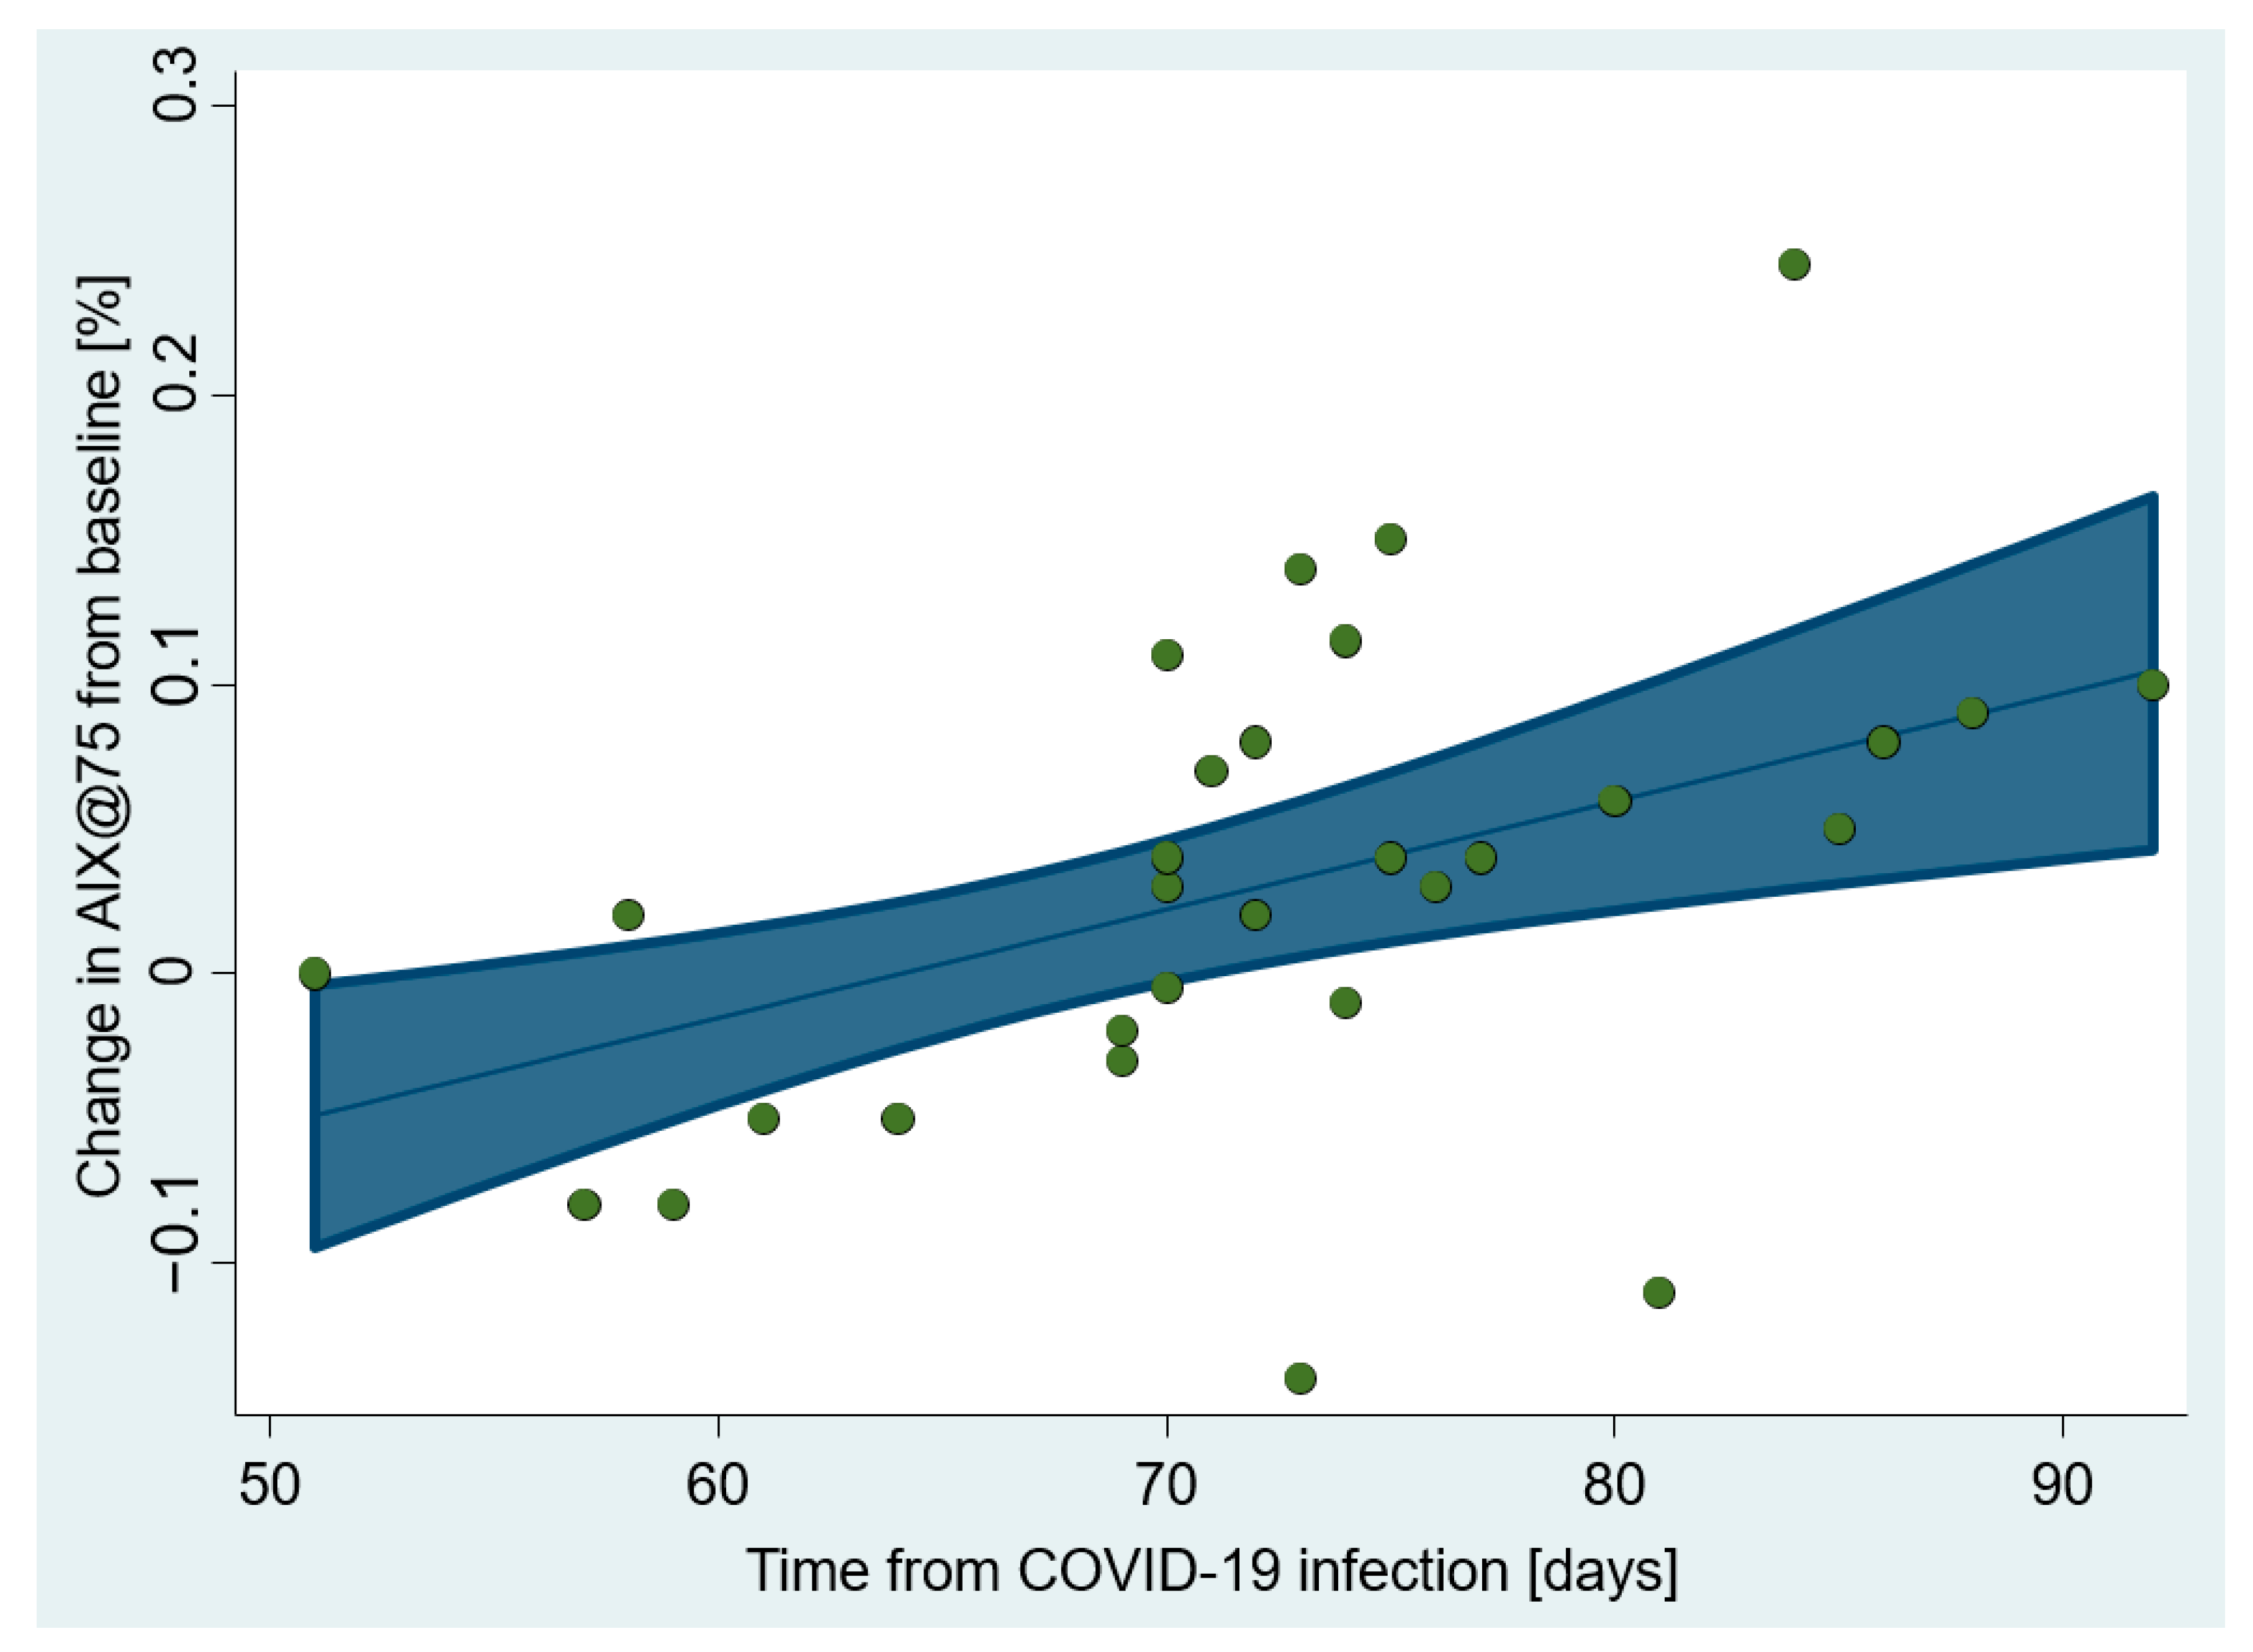
| Aortic AIx@HR75 (%) | Time from COVID | 0.004 (0.001–0.006) | 0.003 | 20 § | 26 §§ |
| Age | 0.002 (−0.0001, 0.004) | 0.061 † | 10 | ||
| Measure: | Predictor | B (95% CI) | p-Value | The One-Predictor Model | The Final Model |
|---|---|---|---|---|---|
| Snijders/Bosker’s R2 Level 1, Level 2 | |||||
| Systemic and Central Hemodynamics | |||||
| DBP (mmHg) | Time from COVID | 0.20 (–0.01, 0.41) | 0.063 † | 8%, 9% | 29% §§, 32% §§ |
| Age | 0.32 (0.13, 0.51) | 0.001 | 24% §, 27% §§ | ||
| cDBP (mmHg) | Time from COVID | 0.19 (–0.02, 0.39) | 0.082 † | 7%, 8% | 28% §§, 31% §§ |
| Age | 0.33 (0.13, 0.52) | 0.001 | 24% §, 27% §§ | ||
| MAP (mmHg) | Time from COVID | 0.19 (–0.04, 0.42) | 0.113 † | 7%, 8% | 31% §§, 34% §§ |
| Age | 0.35 (0.17–0.53) | <0.001 | 27% §§, 30% §§ | ||
| Carotid–Femoral Pulse Wave Velocity | |||||
| cfPWV (m/s) | Time from COVID | 0.03 (0.003, 0.05) | 0.030 | 13% §, 15% § | 28% §§, 32% §§ |
| Age | 0.03 (0.008, 0.05) | 0.005 | 18% §, 21% § | ||
| Pre–post change in cfPWV | 0.19 (–0.03, 0.40) | 0.094 † | 1%, 0% | ||
Disclaimer/Publisher’s Note: The statements, opinions and data contained in all publications are solely those of the individual author(s) and contributor(s) and not of MDPI and/or the editor(s). MDPI and/or the editor(s) disclaim responsibility for any injury to people or property resulting from any ideas, methods, instructions or products referred to in the content. |
© 2023 by the authors. Licensee MDPI, Basel, Switzerland. This article is an open access article distributed under the terms and conditions of the Creative Commons Attribution (CC BY) license (https://creativecommons.org/licenses/by/4.0/).
Share and Cite
Podrug, M.; Koren, P.; Dražić Maras, E.; Podrug, J.; Čulić, V.; Perissiou, M.; Bruno, R.M.; Mudnić, I.; Boban, M.; Jerončić, A. Long-Term Adverse Effects of Mild COVID-19 Disease on Arterial Stiffness, and Systemic and Central Hemodynamics: A Pre-Post Study. J. Clin. Med. 2023, 12, 2123. https://doi.org/10.3390/jcm12062123
Podrug M, Koren P, Dražić Maras E, Podrug J, Čulić V, Perissiou M, Bruno RM, Mudnić I, Boban M, Jerončić A. Long-Term Adverse Effects of Mild COVID-19 Disease on Arterial Stiffness, and Systemic and Central Hemodynamics: A Pre-Post Study. Journal of Clinical Medicine. 2023; 12(6):2123. https://doi.org/10.3390/jcm12062123
Chicago/Turabian StylePodrug, Mario, Pjero Koren, Edita Dražić Maras, Josip Podrug, Viktor Čulić, Maria Perissiou, Rosa Maria Bruno, Ivana Mudnić, Mladen Boban, and Ana Jerončić. 2023. "Long-Term Adverse Effects of Mild COVID-19 Disease on Arterial Stiffness, and Systemic and Central Hemodynamics: A Pre-Post Study" Journal of Clinical Medicine 12, no. 6: 2123. https://doi.org/10.3390/jcm12062123