

Early Impact of Laser Vision Correction (LVC) on the Stability and Quality of the Retinal Image
 ,
,  ,
,  ,
,
Abstract
:1. Introduction
2. Materials and Methods
2.1. Ethical Principles
2.2. Study Design
2.3. Study Protocol
2.4. Visual and Optical Quality Assessment
2.5. Surgical Technique
2.6. Statistical Analysis
3. Results
3.1. Changes in Optical and Visual Quality Metrics
3.2. Correlations
4. Discussion
Author Contributions
Funding
Institutional Review Board Statement
Informed Consent Statement
Data Availability Statement
Acknowledgments
Conflicts of Interest
References
- Solomon, K.D.; Fernández de Castro, L.E.; Sandoval, H.P.; Biber, J.M.; Groat, B.; Neff, K.D.; Ying, M.S.; French, J.W.; Donnenfeld, E.D.; Lindstrom, R.L. LASIK world literature review: Quality of life and patient satisfaction. Ophthalmology 2009, 116, 691–701. [Google Scholar] [CrossRef] [PubMed]
- Pasquali, T.A.; Smadja, D.; Savetsky, M.J.; Reggiani Mello, G.H.; Alkhawaldeh, F.; Krueger, R.R. Long-term follow-up after laser vision correction in physicians: Quality of life and patient satisfaction. J. Cataract. Refract. Surg. 2014, 40, 395–402. [Google Scholar] [CrossRef] [PubMed]
- Wen, D.; Mcalinden, C.; Flitcroft, I.; Tu, R.; Wang, Q.; Alió, J.; Marshall, J.; Huang, Y.; Song, B.; Hu, L.; et al. Postoperative Efficacy, Predictability, Safety, and Visual Quality of Laser Corneal Refractive Surgery: A Network Meta-analysis. Am. J. Ophthalmol. 2017, 178, 65–78. [Google Scholar] [CrossRef] [PubMed]
- Singh Sambhi, R.-D.; Singh Sambhi, G.-D.; Mather, R.; Malvankar-Metha, M.S. Dry eye after refractive surgery: A meta-analysis. Can. J. Ophthalmol. 2020, 55, 99–106. [Google Scholar] [CrossRef] [PubMed]
- Eydelman, M.; Hilmantel, G.; Tarver, M.E.; Hofmeister, E.M.; May, J.; Hammel, K.; Hays, R.D.; Ferris, F. Symptoms and satisfaction of patients in the patient-reported outcomes with laser in situ keratomileusis (PROWL) studies. JAMA Ophthalmol. 2017, 135, 13–22. [Google Scholar] [CrossRef] [Green Version]
- Montés-Micó, R. Role of the tear film in the optical quality of the human eye. J. Cataract. Refract. Surg. 2007, 33, 1631–1635. [Google Scholar] [CrossRef]
- Tutt, R.; Bradley, A.; Begley, C.; Thibos, L.N. Optical and visual impact of tear break-up in human eyes. Investig. Ophthalmol. Vis. Sci. 2000, 41, 4117–4123. [Google Scholar]
- Benito, A.; Perez, G.M.; Mirabet, S.; Vilaseca, M.; Pujol, J.; Marín, J.M.; Artal, P. Objective optical assessment of tear-film quality dynamics in normal and mildly symptomatic dry eyes. J. Cataract. Refract. Surg. 2011, 37, 1481–1487. [Google Scholar] [CrossRef]
- Diaz-Douton, F.; Benito, A.; Pujol, J.; Arjona, M.; Guell, J.; Artal, P. Comparison of the retinal image quality with a Hartmann-Shack wavefront sensor and a double-pass instrument. Investig. Ophthalmol. Vis. Sci. 2006, 47, 1710–1716. [Google Scholar] [CrossRef] [Green Version]
- Saad, A.; Saab, M.; Gatinel, D. Repeatability of measurements with a double-pass system. J. Cataract. Refract. Surg. 2010, 36, 28–33. [Google Scholar] [CrossRef]
- Ondategui, J.C.; Vilaseca, M.; Arjona, M.; Montasell, A.; Cardona, G.; Güell, J.L.; Pujol, J. Optical quality after myopic photorefractive keratectomy and laser in situ keratomileusis: Comparison using a double-pass system. J. Cataract. Refract. Surg. 2012, 38, 16–27. [Google Scholar] [CrossRef] [PubMed]
- Tan, C.-H.; Labbe, A.; Liang, Q.; Qiao, L.; Baudouin, C.; Wan, X.; Wang, N. Dynamic change of optical quality in patients with dry eye disease. Investig. Ophthalmol. Vis. Sci. 2015, 56, 2848–2854. [Google Scholar] [CrossRef] [PubMed] [Green Version]
- Artal, P.; Benito, A.; Perez, G.M.; Alcón, E.; De Casas, A.; Pujol, J.; Marín, J.M. An objective scatter index based on double-pass retinal images of a point source to classify cataracts. PLoS ONE 2011, 6, e16823. [Google Scholar] [CrossRef] [PubMed] [Green Version]
- Santhiago, M.R.; Smadja, D.; Gomes, B.A.F.; Mello, G.R.; Monteiro, M.L.; Wilson, S.E.; Randleman, J.B. Association between the Percent Tissue Altered and Post-Laser in situ keratomileusis Ectasia in Eyes with Normal Preoperative Topography. Am. J. Ophthalmol. 2014, 158, 87–95. [Google Scholar] [CrossRef] [PubMed]
- Kamiya, K.; Shimizu, K.; Igarashi, A.; Kobashi, H. Time course of optical quality and intraocular scattering after refractive lenticule extraction. PLoS ONE 2013, 8, e76738. [Google Scholar] [CrossRef] [Green Version]
- Jung, H.G.; Lim, T.H. The recovery of optical quality after laser vision correction. Korean J. Ophthalmol. 2013, 27, 249–255. [Google Scholar] [CrossRef] [Green Version]
- Moller-Pedersen, T.; Cavanagh, H.D.; Petroll, W.M.; Jester, J.V. Stromal wound healing explains refractive instability and haze development after photorefractive keratectomy: A 1-year confocal microscopic study. Ophthalmology 2000, 107, 1235–1245. [Google Scholar] [CrossRef]
- Santhiago, M.R.; Netto, M.V.; Wilson, S.E. Mitomycin C: Biological effects and use in refractive surgery. Cornea 2012, 31, 311–321. [Google Scholar] [CrossRef]
- Tsubota, K. Short tear film break-up time–type dry eye. Investig. Ophthalmol. Vis. Sci. 2018, 59, DES64–DES70. [Google Scholar] [CrossRef] [Green Version]
- Kaido, M. Functional visual acuity. Investig. Ophthalmol. Vis. Sci. 2018, 59, DES29–DES35. [Google Scholar] [CrossRef] [Green Version]
- Toda, I.; Shimazaki, J.; Tsubota, K. Dry eye with only decreased tear break-up time is sometimes associated with allergic conjunctivitis. Ophthalmology 1995, 102, 302–309. [Google Scholar] [CrossRef] [PubMed]
- Uchino, Y.; Uchino, M.; Yokoi, N.; Dogru, M.; Kawashima, M.; Okada, N.; Inaba, T.; Tamaki, S.; Komuro, A.; Sonomura, Y.; et al. Alteration of tear mucin 5AC in office workers using visual display terminals: The Osaka Study. JAMA Ophthalmol. 2014, 132, 985–992. [Google Scholar] [CrossRef] [PubMed] [Green Version]
- Hong, J.W.; Kim, H.M. The Changes of Tear Break Up Time after Myopic Excimer Laser Photorefractive Keratectomy. Korean J. Ophthalmol. 1997, 11, 89–93. [Google Scholar] [CrossRef] [PubMed]
- Bettach, E.; Zadok, D.; Abulafia, A.; Shoshani, A.; Ghebali, R.A.; Weill, Y.; Smadja, D. Influence of Reading on Smartphone Screens on Visual Optical Quality Metrics and Tear Film Stability. Cornea 2021, 40, 1309–1315. [Google Scholar] [CrossRef] [PubMed]
- Shimazaki-Den, S.; Dogru, M.; Higa, K.; Shimazaki, J. Symptoms, Visual Function, and Mucin Expression of Eyes with Tear Film Instability. Cornea 2013, 32, 1211–1218. [Google Scholar] [CrossRef]
- Kaido, M.; Uchino, M.; Yokoi, N.; Uchino, Y.; Dogru, M.; Kawashima, M.; Komuro, A.; Sonomura, Y.; Kato, H.; Kinoshita, S.; et al. Dry-eye screening by using a functional visual acuity measurement system: The Osaka Study. Investig Ophthalmol. Vis. Sci. 2014, 55, 3275–3281. [Google Scholar] [CrossRef] [Green Version]
- Ryan, D.S.; Bower, K.S.; Sia, R.K.; Shatos, M.A.; Howard, R.S.; Mines, M.J.; Stutzman, R.D.; Dartt, D.A. Goblet cell response after photorefractive keratectomy and laser in situ keratomileusis. J. Cataract. Refract. Surg. 2016, 42, 1181–1189. [Google Scholar] [CrossRef] [Green Version]
- Nichols, K.K.; Nichols, J.J.; Mitchell, G.L. The lack of association between signs and symptoms in patients with dry eye disease. Cornea 2004, 23, 762–770. [Google Scholar] [CrossRef]
- Yin, Y.; Lu, Y.; Xiang, A.; Fu, Y.; Zhao, Y.; Li, Y.; Hu, T.; Du, K.; Hu, S.; Fu, Q.; et al. Comparison of the optical quality after SMILE and FS-LASIK for high myopia by OQAS and iTrace analyzer: A one-year retrospective study. BMC Ophthalmol. 2021, 21, 292. [Google Scholar] [CrossRef]


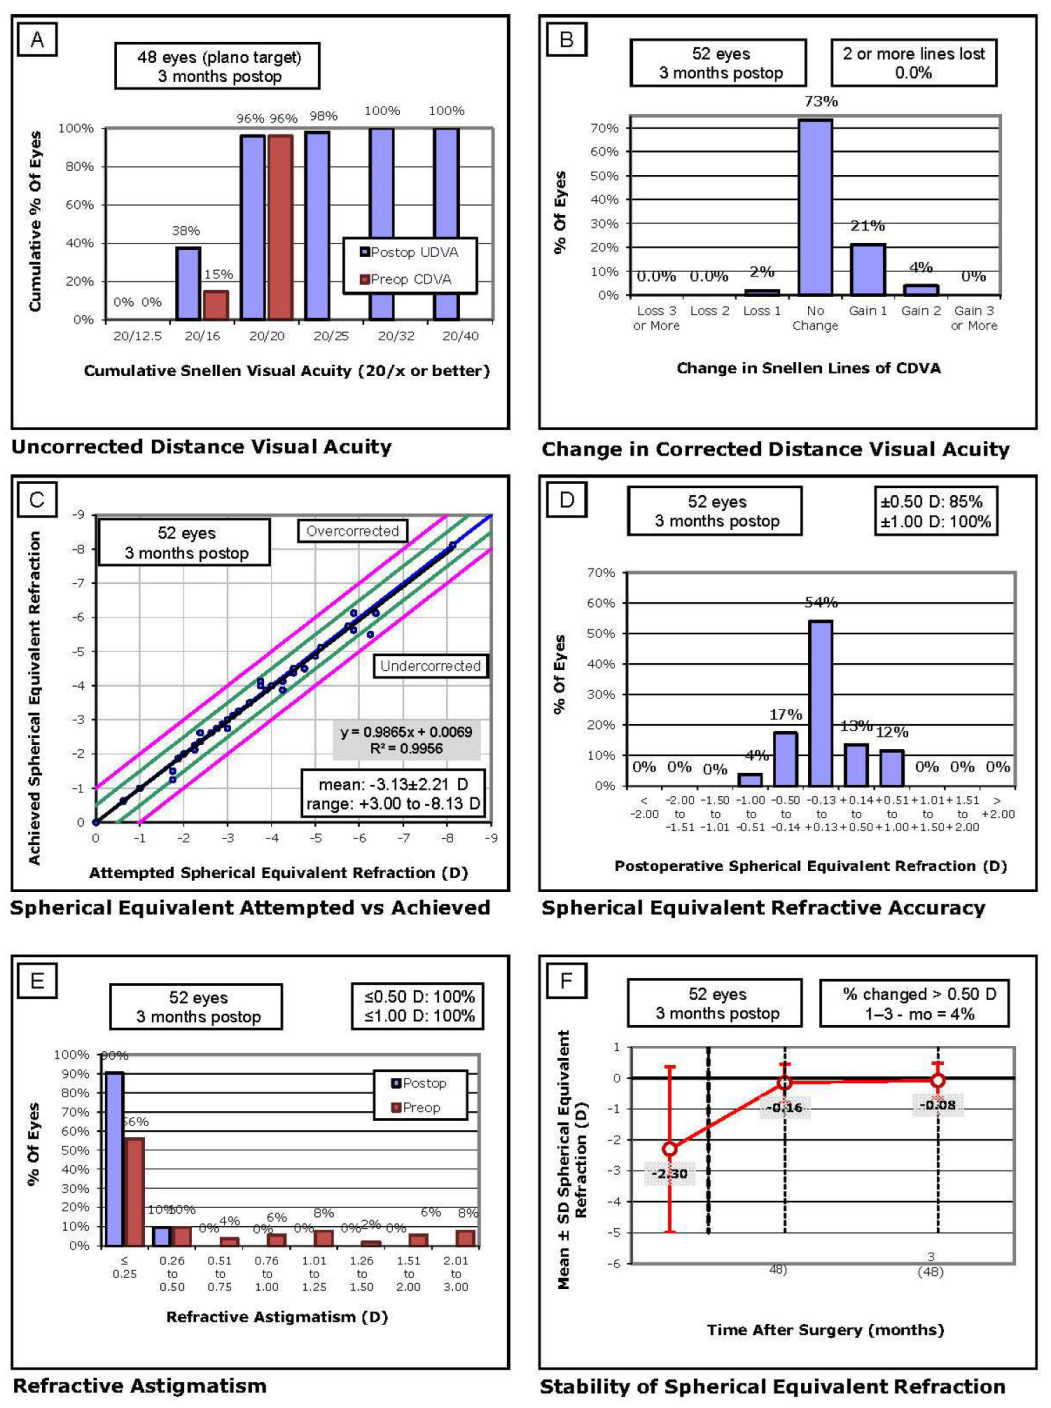
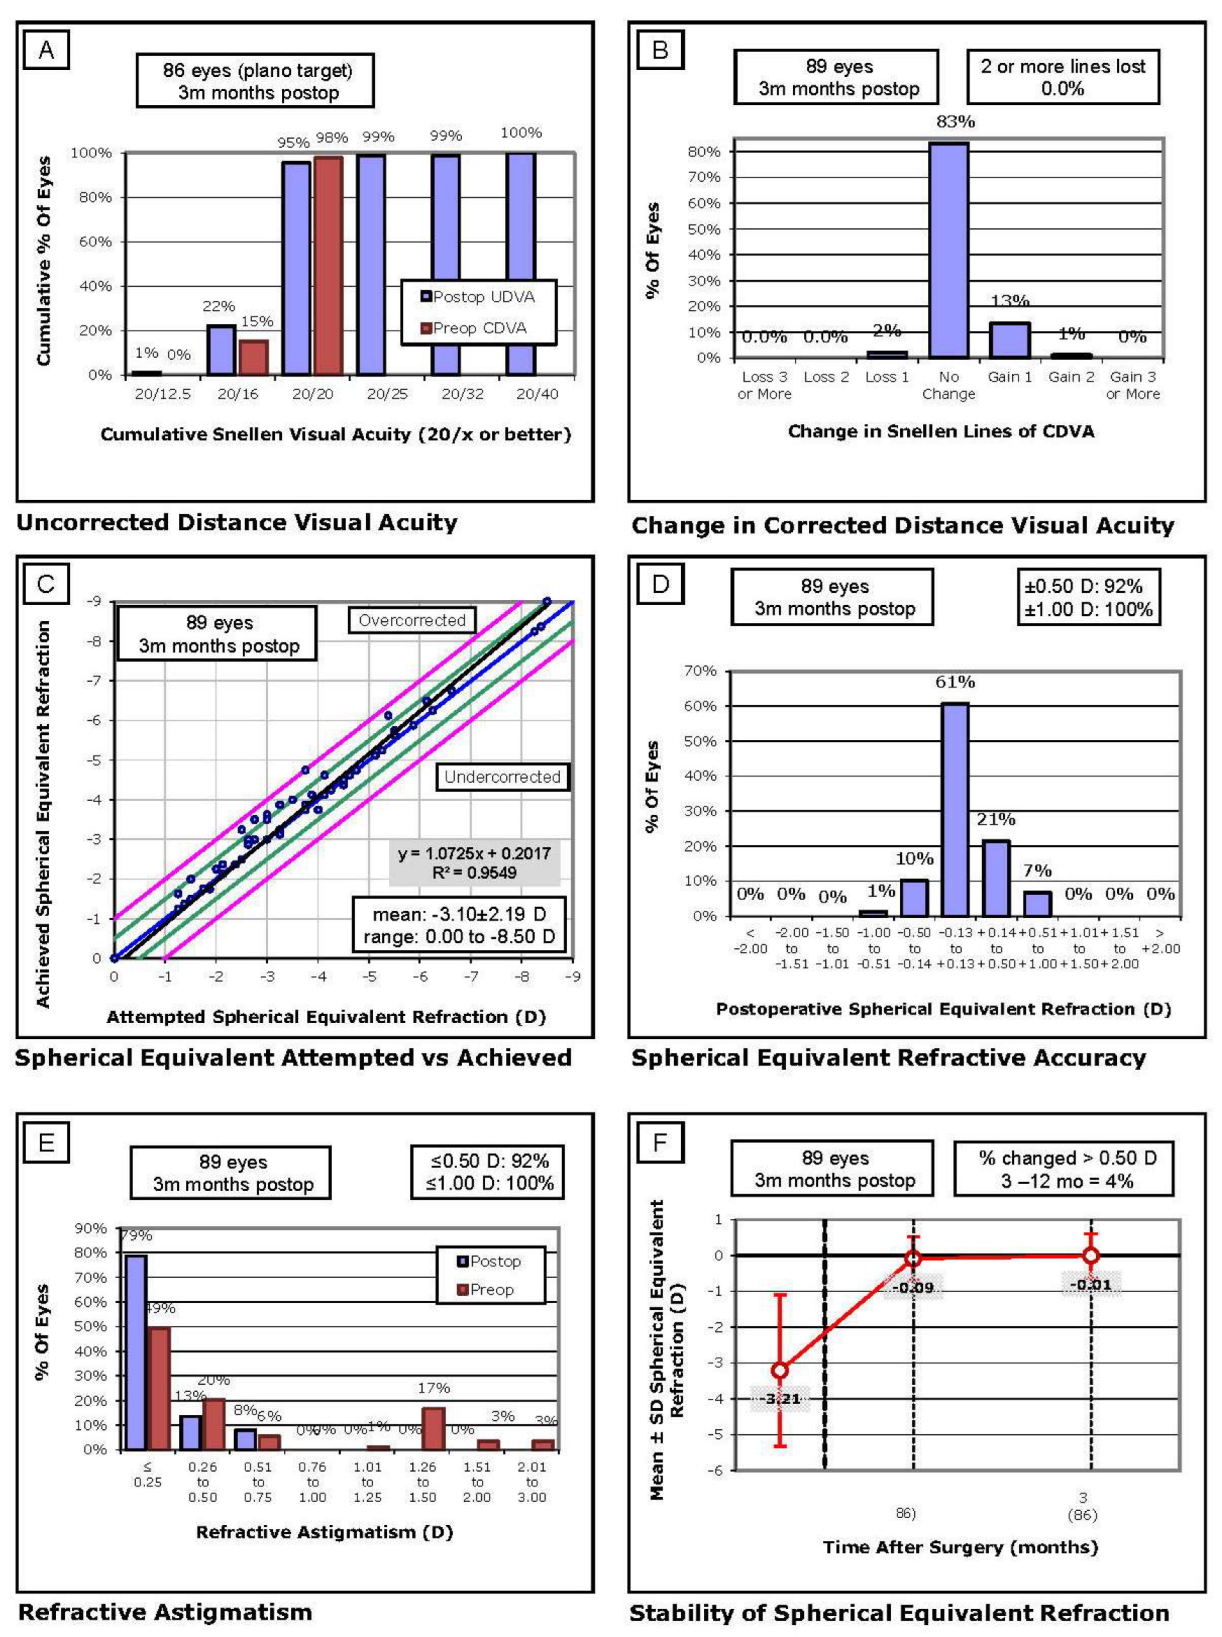
| Parameters | LASIK (n = 52 Eyes) | PRK (n = 89 Eyes) | p |
|---|---|---|---|
| Age (years) | 36.17 ± 10.3 (22; 57) | 33.9 ± 10.1 (18; 55) | 0.21 |
| Gender (% female) | 49% (n = 26) | 51.6% (n = 48) | 0.08 |
| Preop SE (D) | −2.3 ± 2.67 (−8; −0.75) | −3.21 ± 2.12 (−8.5; −1.25) | 0.05 |
| Postop SE (D) | −0.08 ± 0.57 (−1; 0.5) | −0.01 ± 0.62 (−0.5; 1) | 0.54 |
| OSI | 0.65 ± 0.40 (0.2; 1.8) | 0.66 ± 0.32 (0.1; 2.1) | 0.87 |
| MTF (c/deg) | 39.5 ± 8.5 (18.7; 53.9) | 38.2 ± 8.9 (17.3; 54.1) | 0.65 |
| Strehl Ratio | 0.22 ± 0.05 (0.12; 0.33) | 0.21 ± 0.05 (0.11; 0.34) | 0.15 |
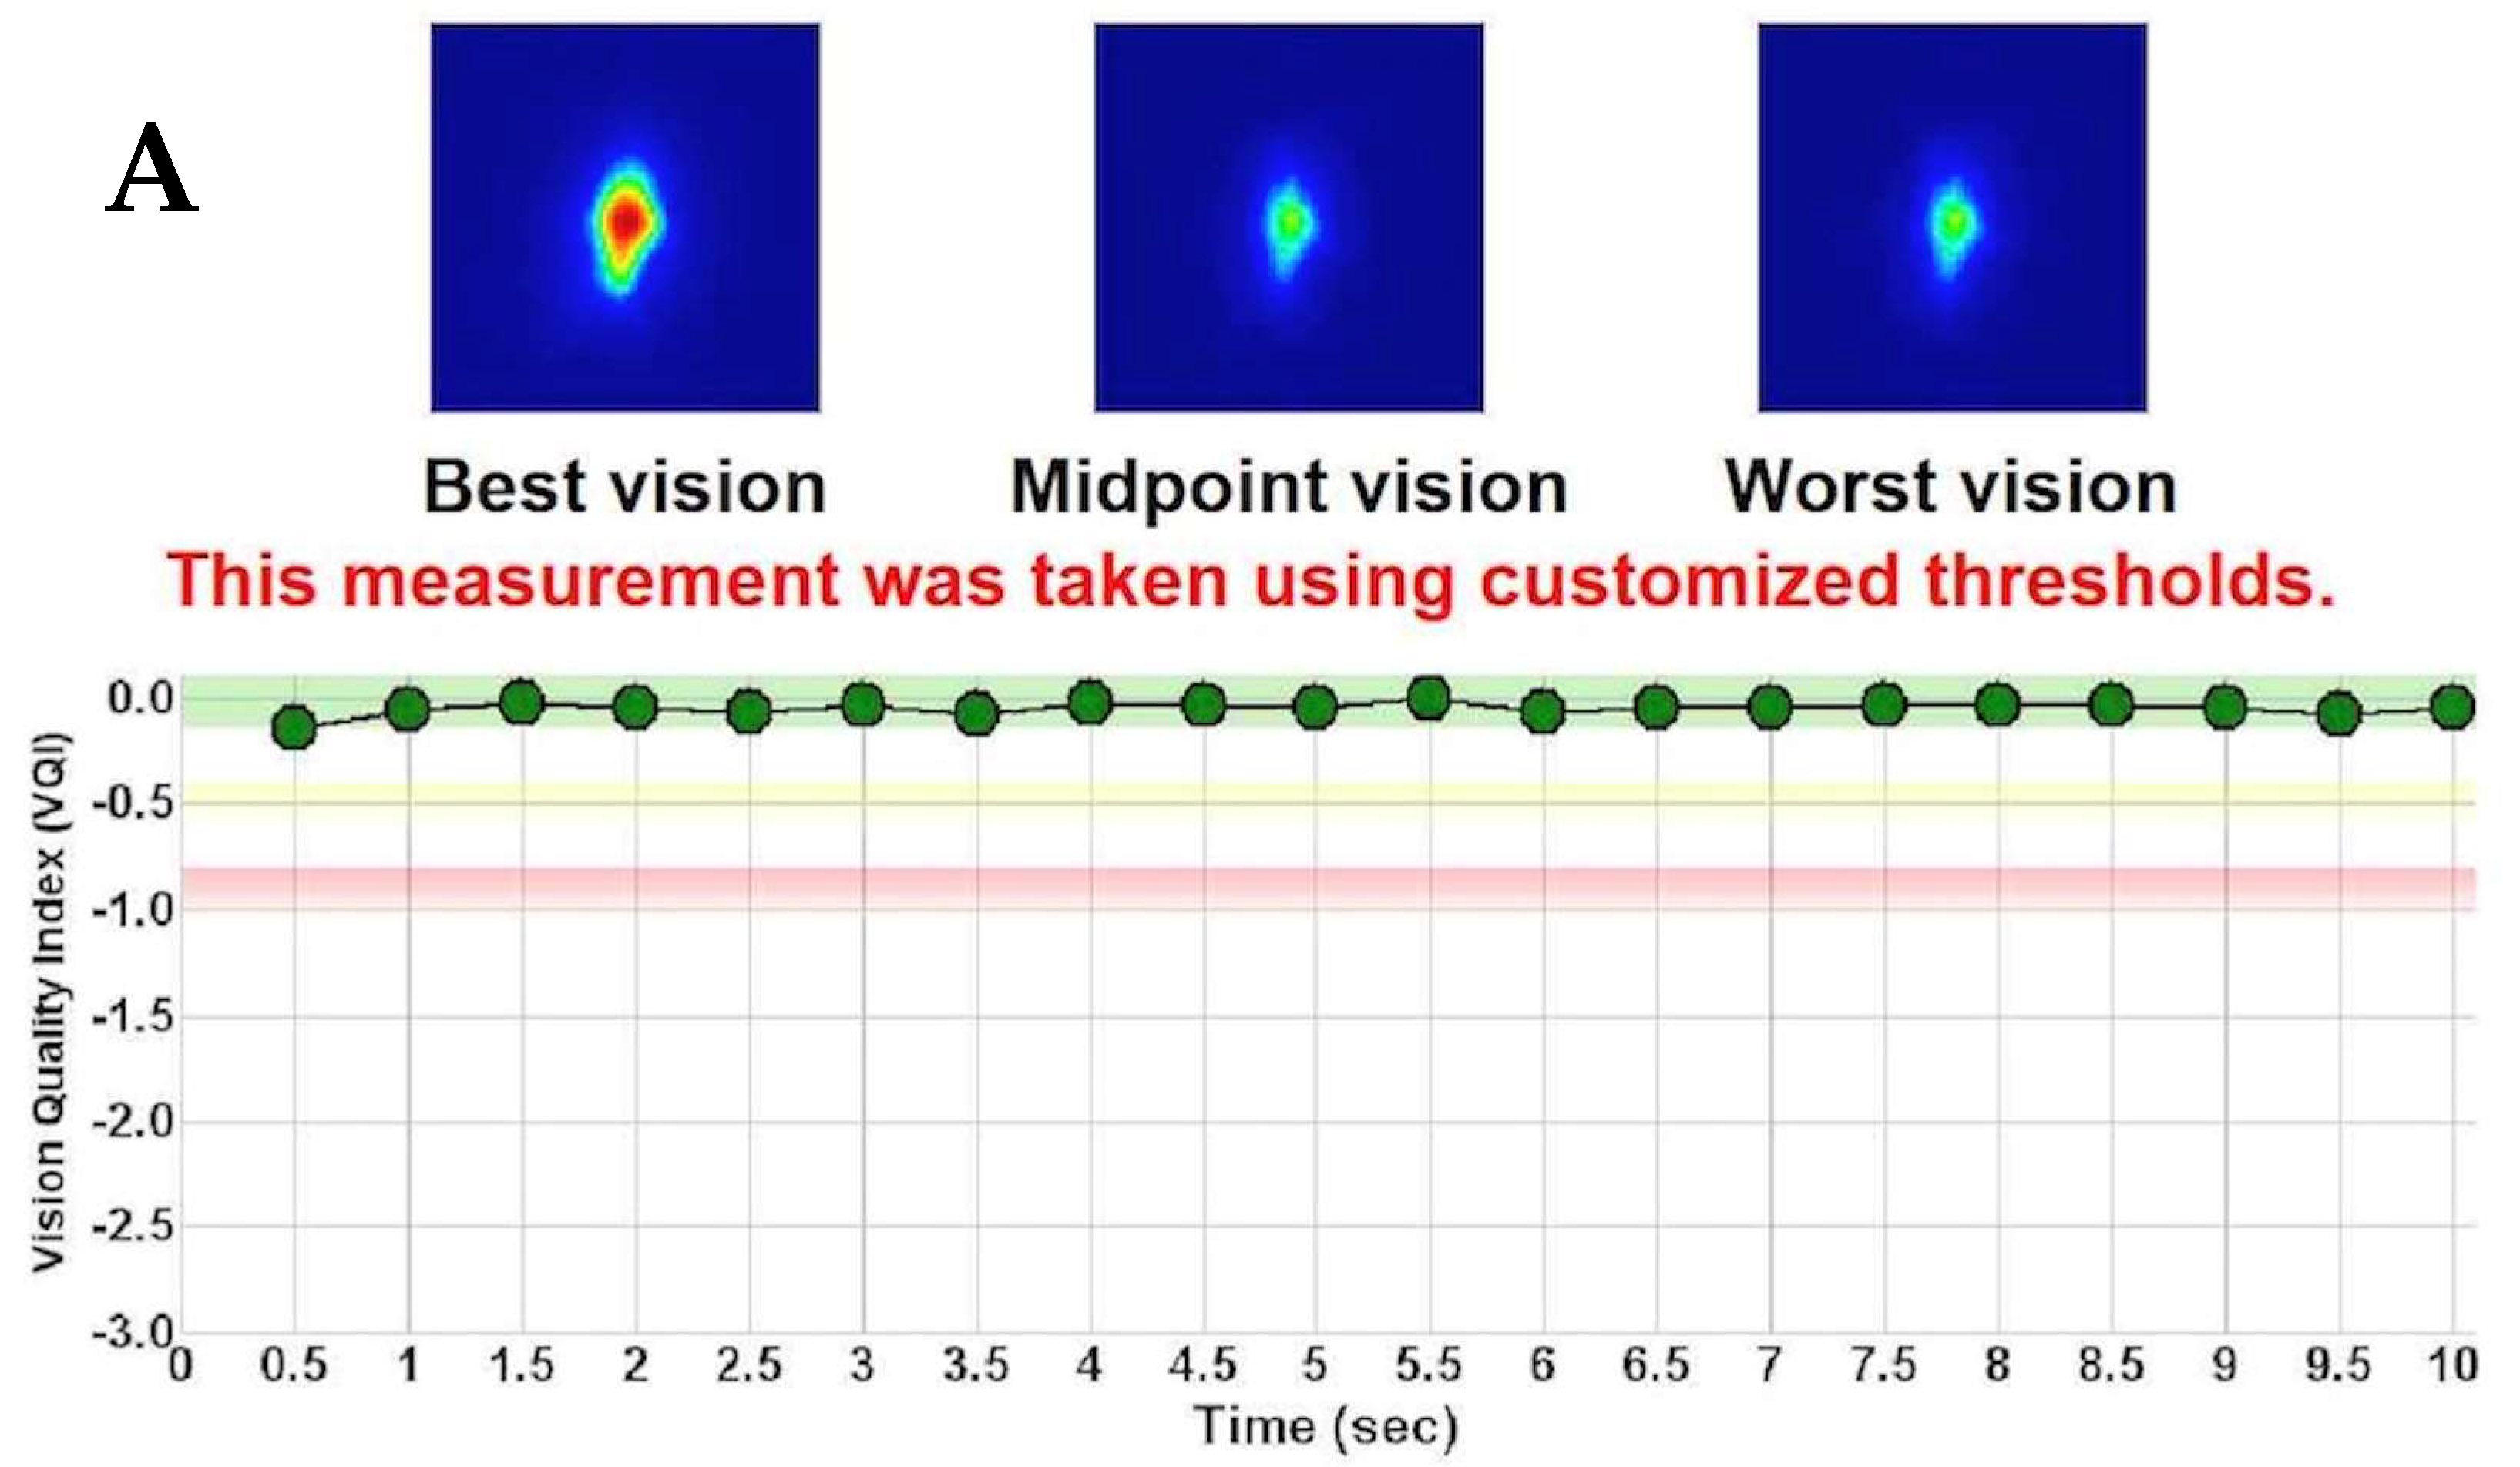
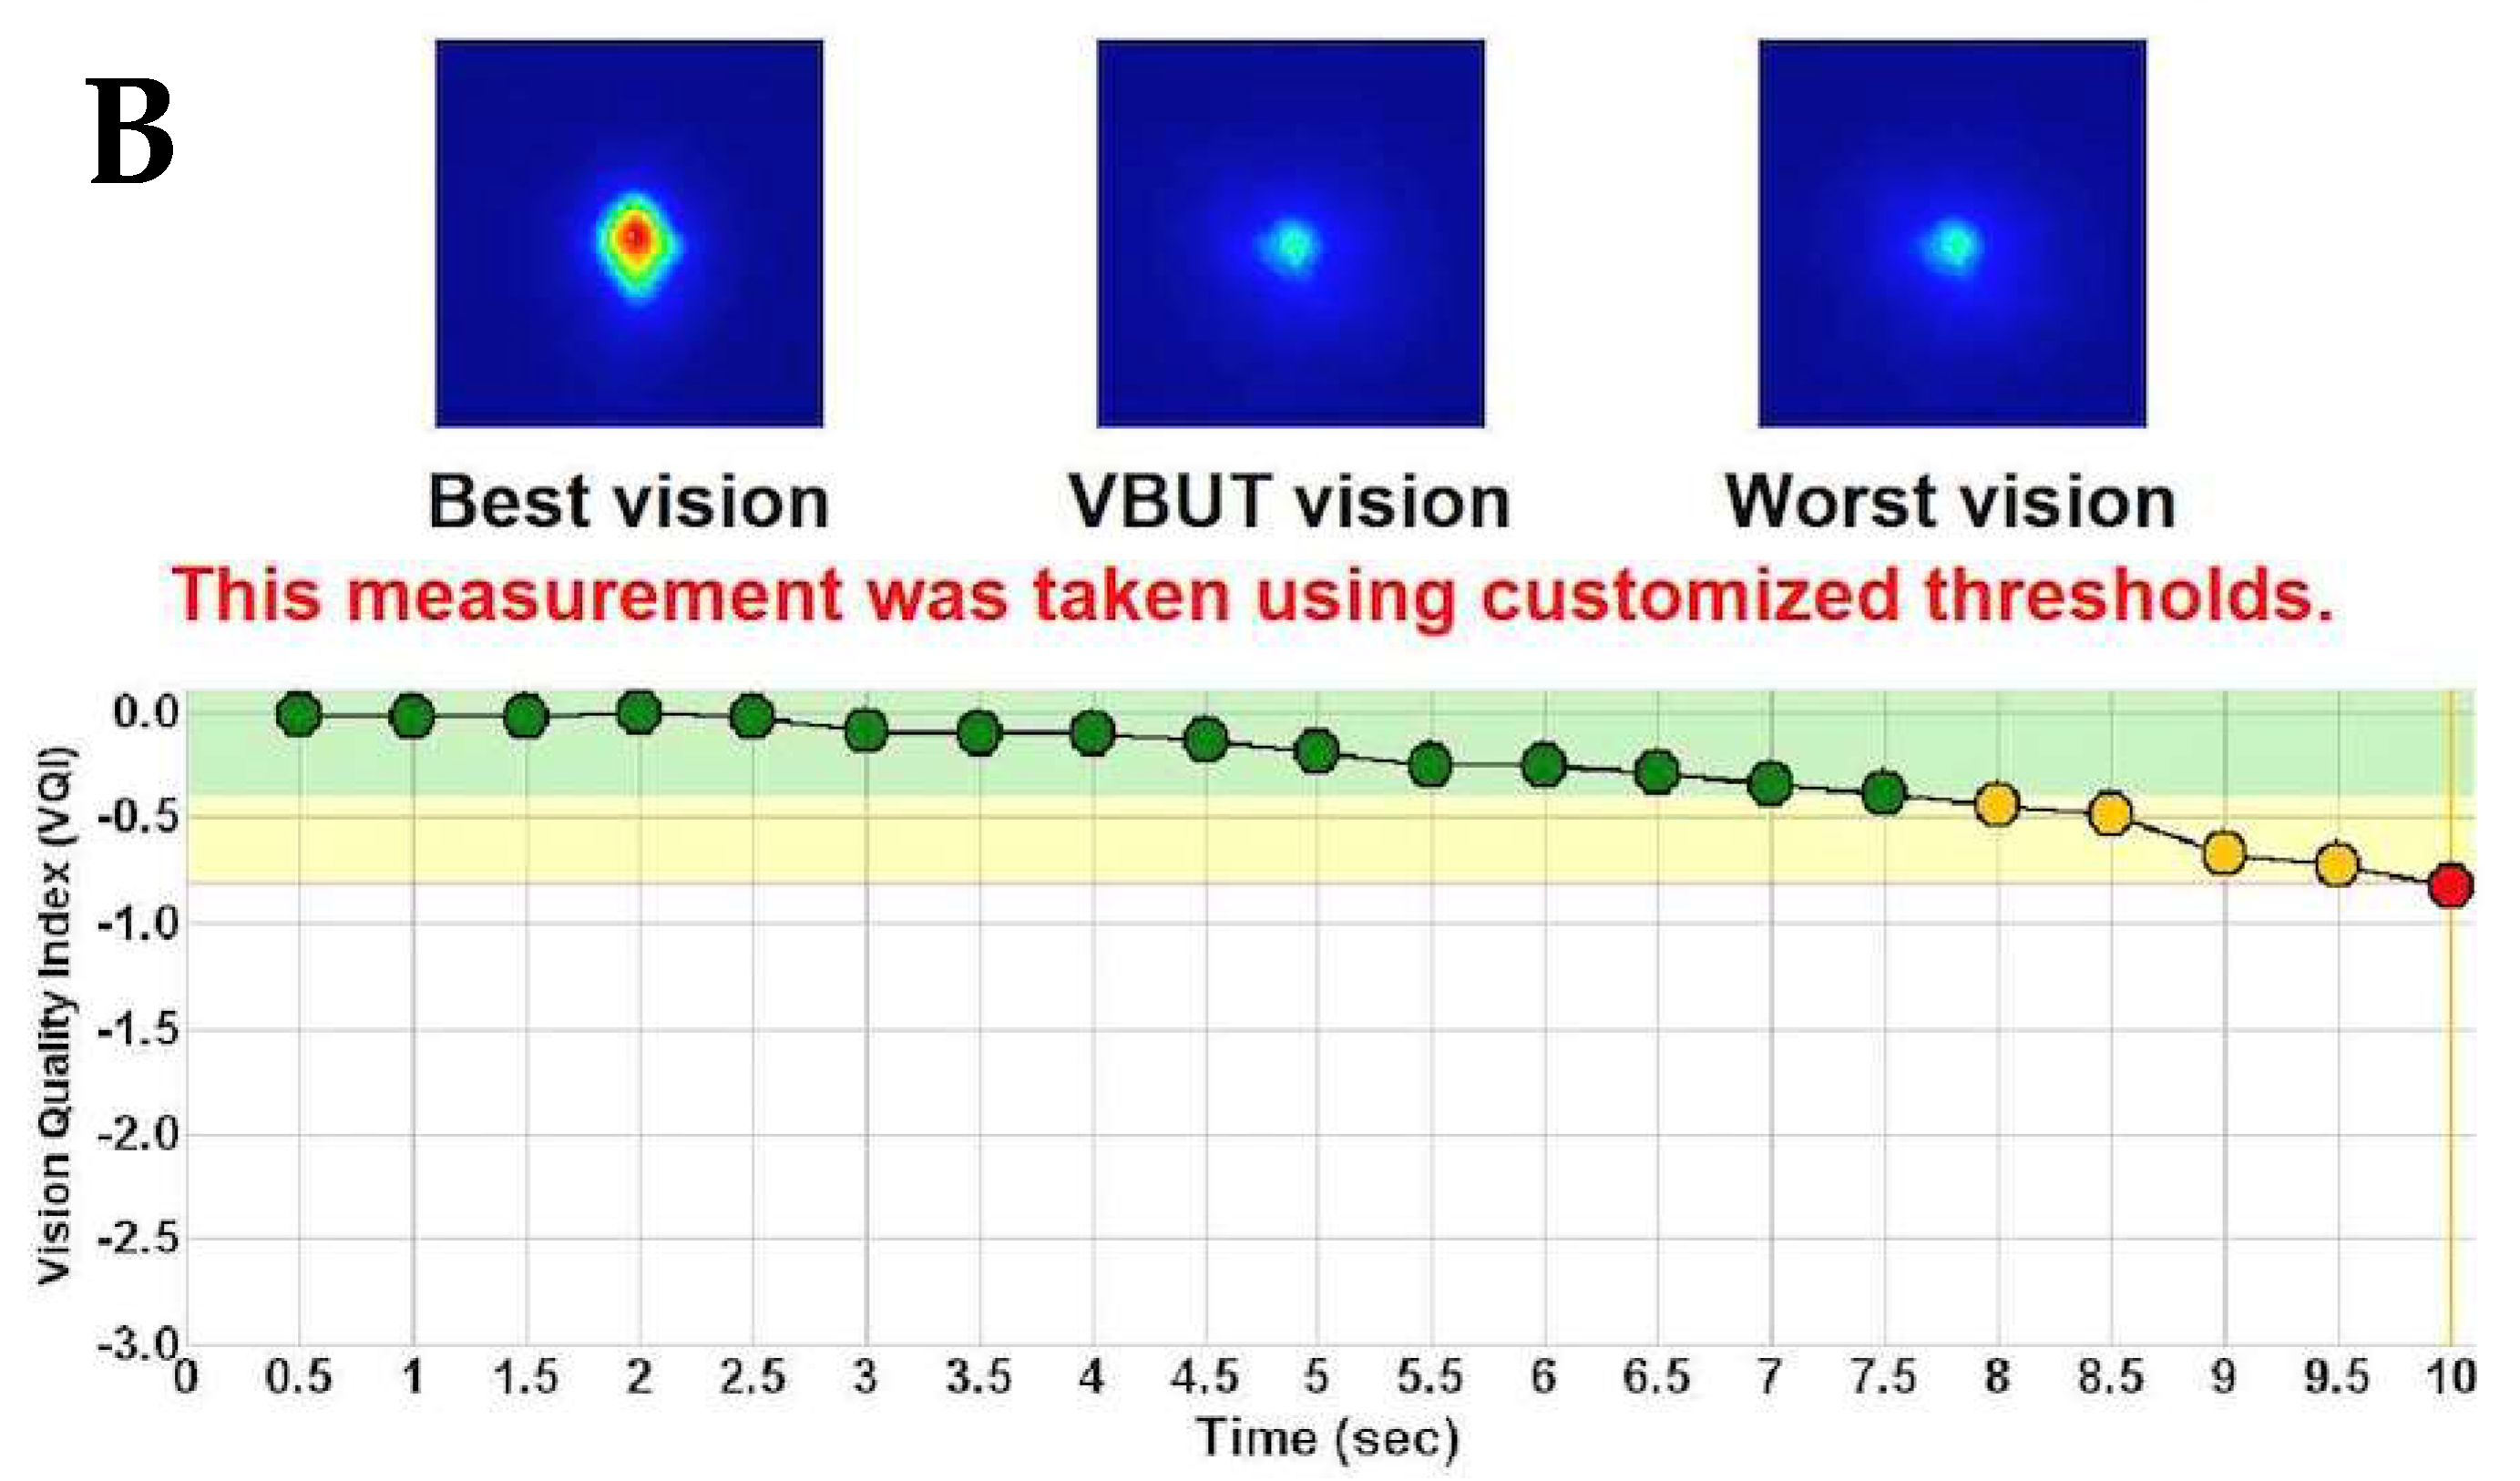
| Visual BUT (sec) | 9.47 ± 1.3 (5; 10) | 9.7 ± 1.1 (3; 10) | 0.09 |
| Parameters | LASIK (n = 52) | PRK (n =89) | p |
|---|---|---|---|
| Postop 1 Month | |||
| Sphere (D) | −0.08 ± 0.6 (−1.25; 0.75) | 0.12 ± 0.58 (−0.75; 1.5) | 0.14 |
| Cylinder (D) | −0.39 ± 0.13 (−0.5; 0) | −0.62 ± 0.33 (−1.5; −0.25) | 0.08 |
| SE (D) | −0.16 ± 0.61 (−1.25; −0.5) | −0.09 ± 0.61 (−1; 1.25) | 0.96 |
| Postop 3 Months | |||
| Sphere (D) | −0.07 ± 0.6 (−1; 0.75) | 0.17 ± 0.66 (−0.5; 2.5) | 0.17 |
| Cylinder (D) | −0.35 ± 0.24 (−0.5; 0) | −0.49 ± 0.18 (−0.75; −0.25) | 0.07 |
| SE (D) | −0.08 ± 0.57 (−1; 0.5) | −0.01 ± 0.62 (−0.5; 1) | 0.54 |
| Baseline | LASIK (n = 52) | PRK (n = 89) | p |
|---|---|---|---|
| OSI | 0.65 ± 0.40 | 0.66 ± 0.32 | 0.87 |
| MTF (c/deg) | 39.5 ± 8.5 | 38.2 ± 8.9 | 0.65 |
| Strehl Ratio | 0.22 ± 0.05 | 0.21 ± 0.05 | 0.15 |
| Visual BUT (sec) | 9.47 ± 1.3 | 9.7 ± 1.1 | 0.09 |
| Postop 1M | |||
| OSI | 0.78 ± 0.54 | 1.2 ± 0.67 | <0.001 |
| MTF (c/deg) | 38.8 ± 10 | 30.9 ± 10.1 | <0.001 |
| SR | 0.22 ± 0.05 | 0.16 ± 0.06 | <0.001 |
| VBUT (sec) | 8.8 ± 2.1 | 8.1 ± 3.2 | 0.17 |
| Postop 3M | |||
| OSI | 0.75 ± 0.43 | 0.8 ± 0.36 | 0.45 |
| MTF (c/deg) | 38.3 ± 10.1 | 36.2 ± 9.1 | 0.22 |
| SR | 0.21 ± 0.04 | 0.2 ± 0.04 | 0.11 |
| VBUT (sec) | 9.6 ± 1.05 | 9.1 ± 2.2 | 0.11 |
| LASIK (n = 52) | PRK (n = 89) | p (LASIK vs. PRK) | |
|---|---|---|---|
| Δ1M | |||
| OSI | 0.14 ± 0.35 (0.18) | 0.54 ± 0.58 (<0.01) | <0.001 |
| MTF (c/deg) | −1.24 ± 8.3 (0.7) | −7.7 ± 11.6 (<0.01) | 0.002 |
| Strehl Ratio | −0.01 ± 0.05 (0.89) | −0.04 ± 0.06 (<0.01) | 0.001 |
| Visual BUT (sec) | −0.64 ± 2.1 (0.09) | −1.63 ± 3.1 (<0.01) | 0.04 |
| Δ1–3M | |||
| OSI | −0.04 ± 0.24 (0.77) | −0.42 ± 0.56 (<0.01) | <0.001 |
| MTF (c/deg) | 0.09 ± 7.9 (0.82) | 6.24 ± 10.1 (<0.01) | <0.001 |
| SR | −0.01 ± 0.04 (0.57) | 0.04 ± 0.06 (<0.01) | <0.001 |
| VBUT (sec) | 0.78 ± 1.9 (0.02) | 1.1 ± 2.7 (0.01) | 0.54 |
| Δ3M | |||
| OSI | 0.10 ± 0.31 (0.23) | 0.14 ± 0.36 (<0.01) | 0.45 |
| MTF (c/deg) | −1.17 ± 10 (0.5) | −1.93 ± 11 (0.15) | 0.68 |
| SR | −0.01 ± 0.06 (0.46) | −0.01 ± 0.05 (0.57) | 0.73 |
| VBUT (sec) | 0.15 ± 1.9 (0.53) | −0.57 ± 2.3 (0.01) | 0.06 |
| r Coefficient (p Value) | Age | Ablation Depth | Postop SE | Preop OSI | Preop MTF | Preop SR | Preop VBUT |
|---|---|---|---|---|---|---|---|
| ΔVBUT | −0.04 (0.97) | −0.11 (0.48) | −0.25 (0.07) | 0.05 (0.78) | 0.02 (0.9) | 0.02 (0.9) | −0.71 (p < 0.01) |
| ΔOSI | 0.19 (0.17) | −0.03 (0.8) | −0.05 (0.78) | −0.28 (0.03) | 0.31 (0.02) | 0.34 (0.02) | 0.19 (0.17) |
| ΔMTF | −0.15 (0.28) | 0.08 (0.57) | 0.01 (0.95) | 0.25 (0.04) | −0.41 (p < 0.01) | −0.44 (p < 0.01) | −0.14 (0.32) |
| ΔSR | −0.21 (0.06) | 0.09 (0.53) | −0.25 (0.07) | 0.26 (0.04) | −0.31 (0.02) | −0.63 (p < 0.01) | −0.2 (0.15) |
| r Coefficient (p Value) | Age | Ablation Depth | Postop SE | Preop OSI | Preop MTF | Preop SR | Preop VBUT |
|---|---|---|---|---|---|---|---|
| ΔVBUT | −0.03 (0.97) | −0.01 (0.9) | 0.14 (0.19) | 0.03 (0.78) | 0.09 (0.38) | 0.06 (0.64) | −0.55 (p < 0.01) |
| ΔOSI | 0.01 (0.9) | 0.01 (0.9) | 0.08 (0.78) | −0.44 (p < 0.01) | 0.46 (p < 0.01) | 0.28 (0.01) | 0.19 (0.08) |
| ΔMTF | 0.03 (0.78) | 0.01 (0.9) | −0.01 (0.91) | 0.27 (0.01) | −0.59 (p < 0.01) | −0.35 (p < 0.01) | −0.13 (0.22) |
| ΔSR | 0.1 (0.35) | −0.02 (0.8) | 0.01 (0.97) | 0.31 (0.01) | −0.59 (p < 0.01) | −0.57 (p < 0.01) | 0.1 (0.5) |
Disclaimer/Publisher’s Note: The statements, opinions and data contained in all publications are solely those of the individual author(s) and contributor(s) and not of MDPI and/or the editor(s). MDPI and/or the editor(s) disclaim responsibility for any injury to people or property resulting from any ideas, methods, instructions or products referred to in the content. |
© 2023 by the authors. Licensee MDPI, Basel, Switzerland. This article is an open access article distributed under the terms and conditions of the Creative Commons Attribution (CC BY) license (https://creativecommons.org/licenses/by/4.0/).
Share and Cite
Smadja, D.; Erdinest, N.; Wajnsztajn, D.; Weill, Y.; Abulafia, A.; Zadok, D.; Lavy, I. Early Impact of Laser Vision Correction (LVC) on the Stability and Quality of the Retinal Image. J. Clin. Med. 2023, 12, 1779. https://doi.org/10.3390/jcm12051779
Smadja D, Erdinest N, Wajnsztajn D, Weill Y, Abulafia A, Zadok D, Lavy I. Early Impact of Laser Vision Correction (LVC) on the Stability and Quality of the Retinal Image. Journal of Clinical Medicine. 2023; 12(5):1779. https://doi.org/10.3390/jcm12051779
Chicago/Turabian StyleSmadja, David, Nir Erdinest, Denise Wajnsztajn, Yishay Weill, Adi Abulafia, David Zadok, and Itay Lavy. 2023. "Early Impact of Laser Vision Correction (LVC) on the Stability and Quality of the Retinal Image" Journal of Clinical Medicine 12, no. 5: 1779. https://doi.org/10.3390/jcm12051779