
Heterogeneous Damage to the Olfactory Epithelium in Patients with Post-Viral Olfactory Dysfunction


Abstract
:1. Introduction
2. Materials and Methods
2.1. Animals
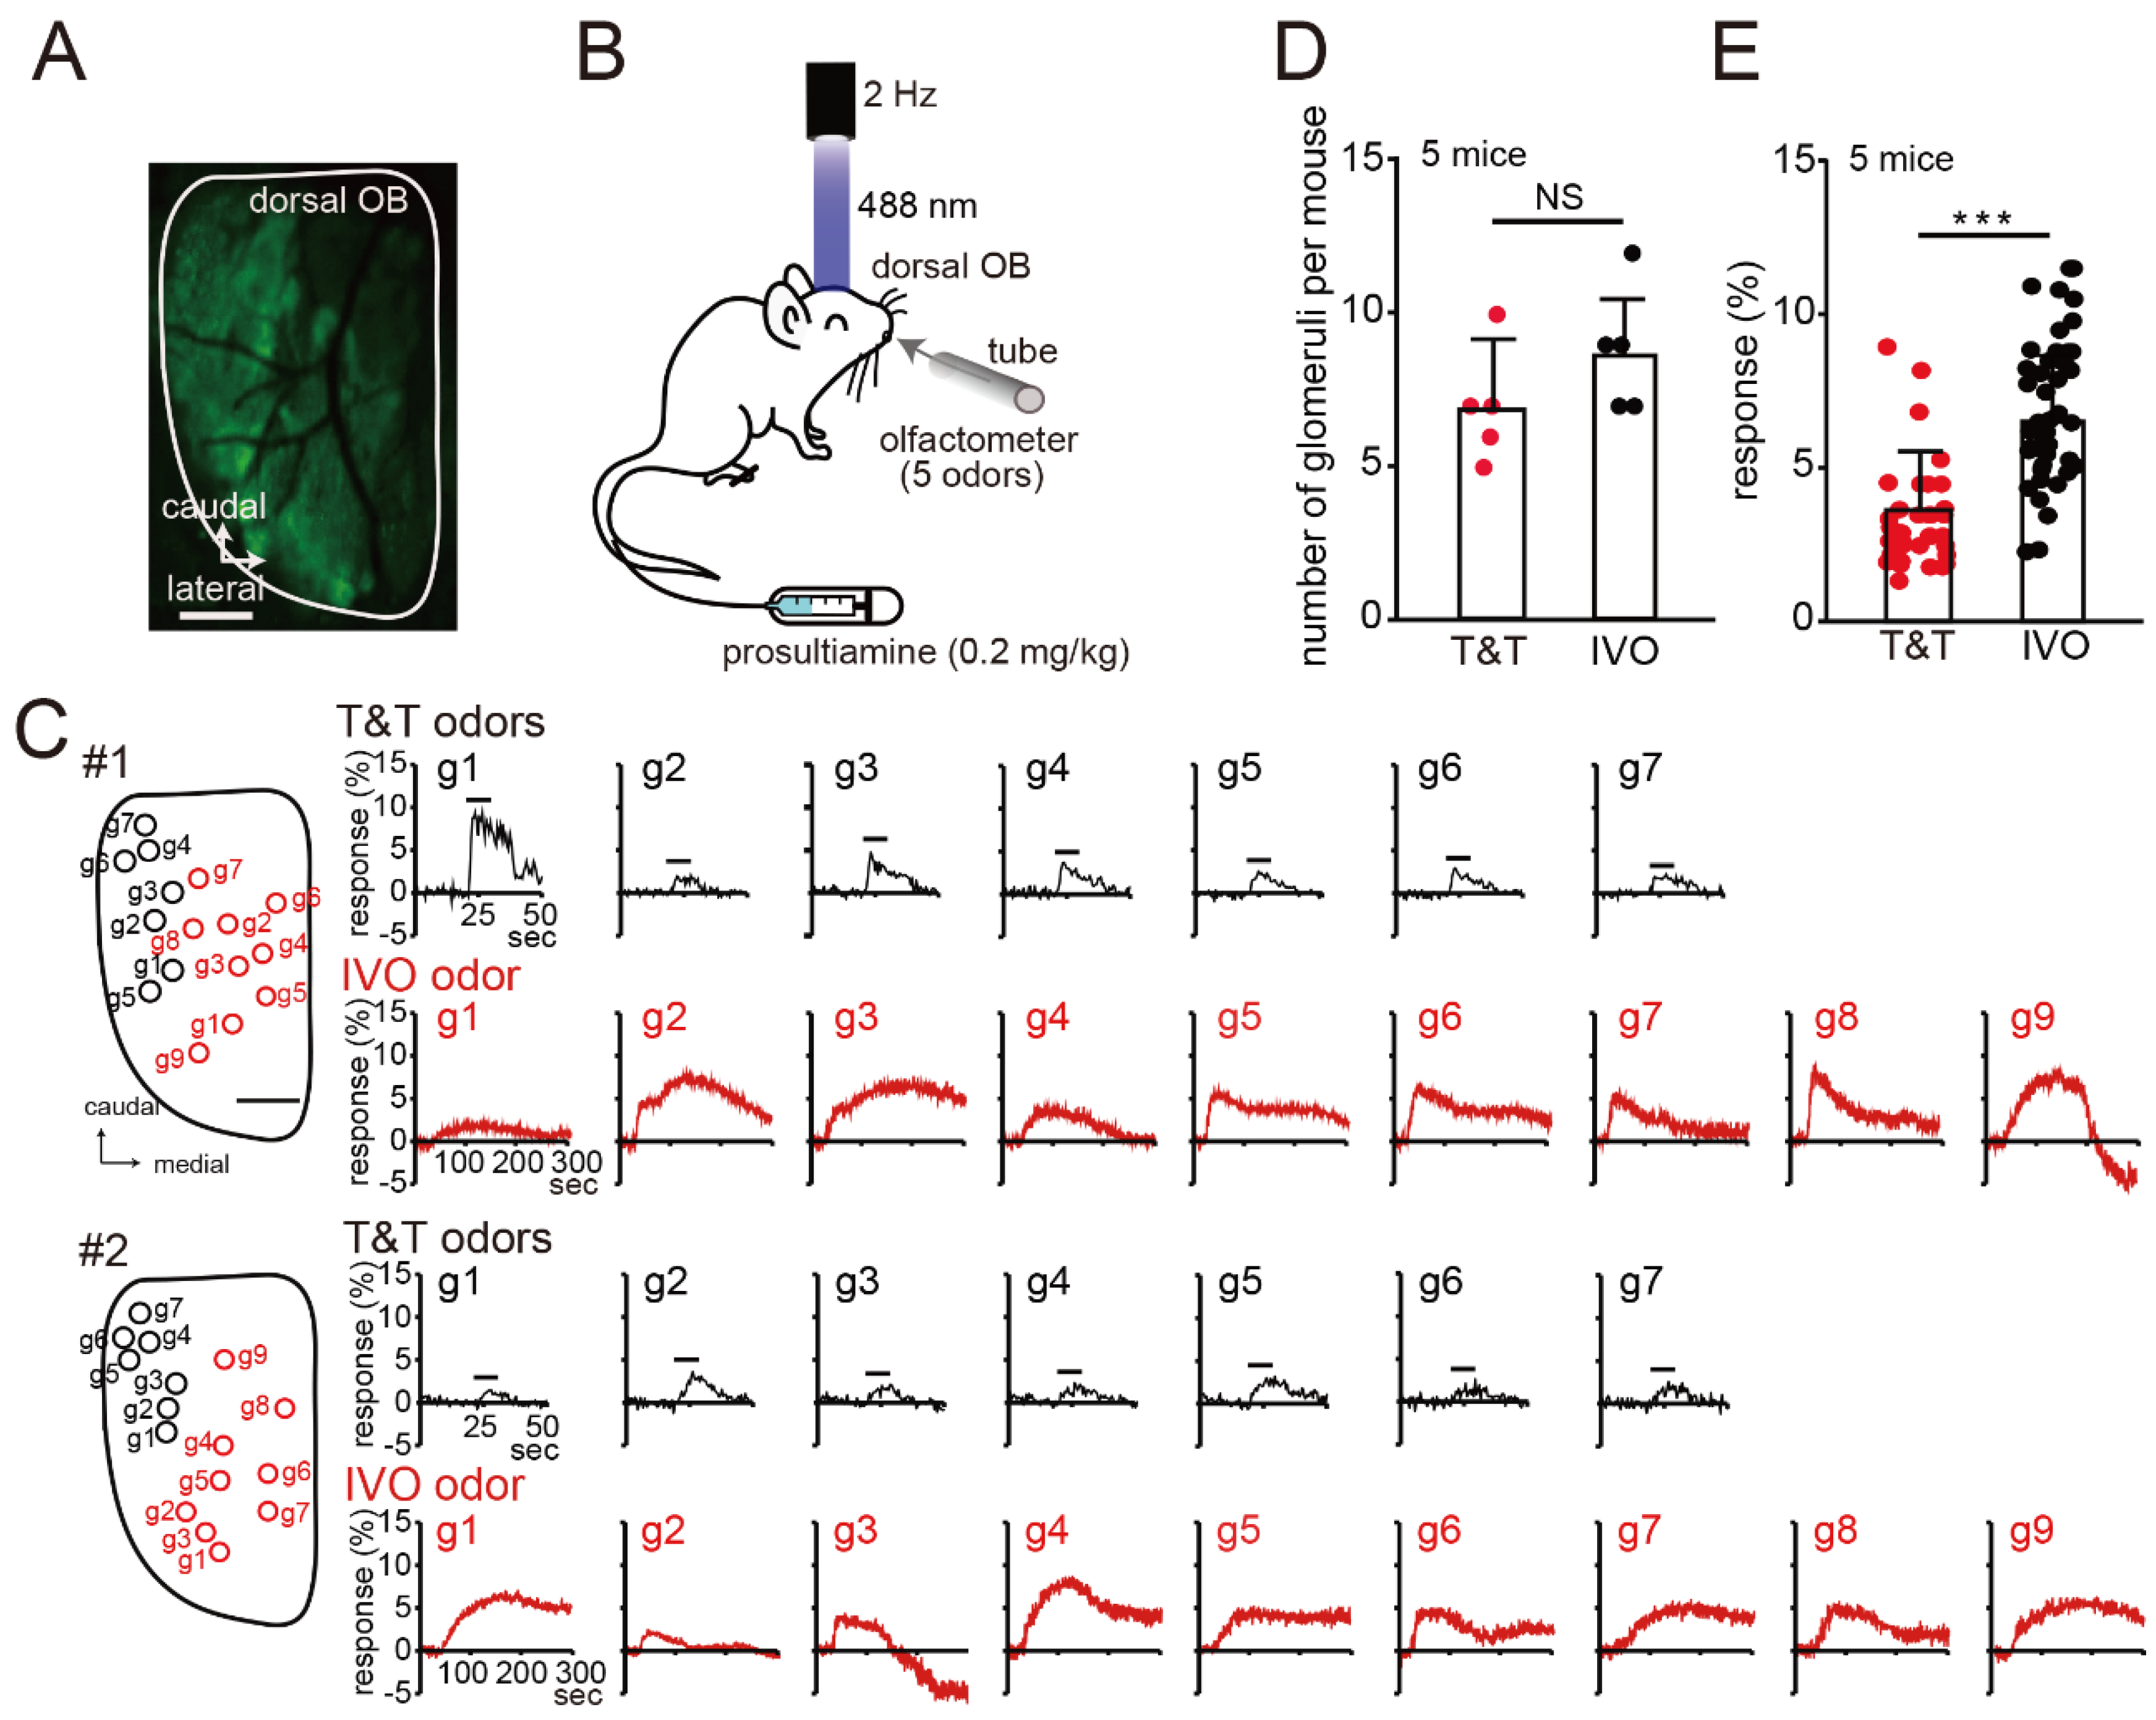
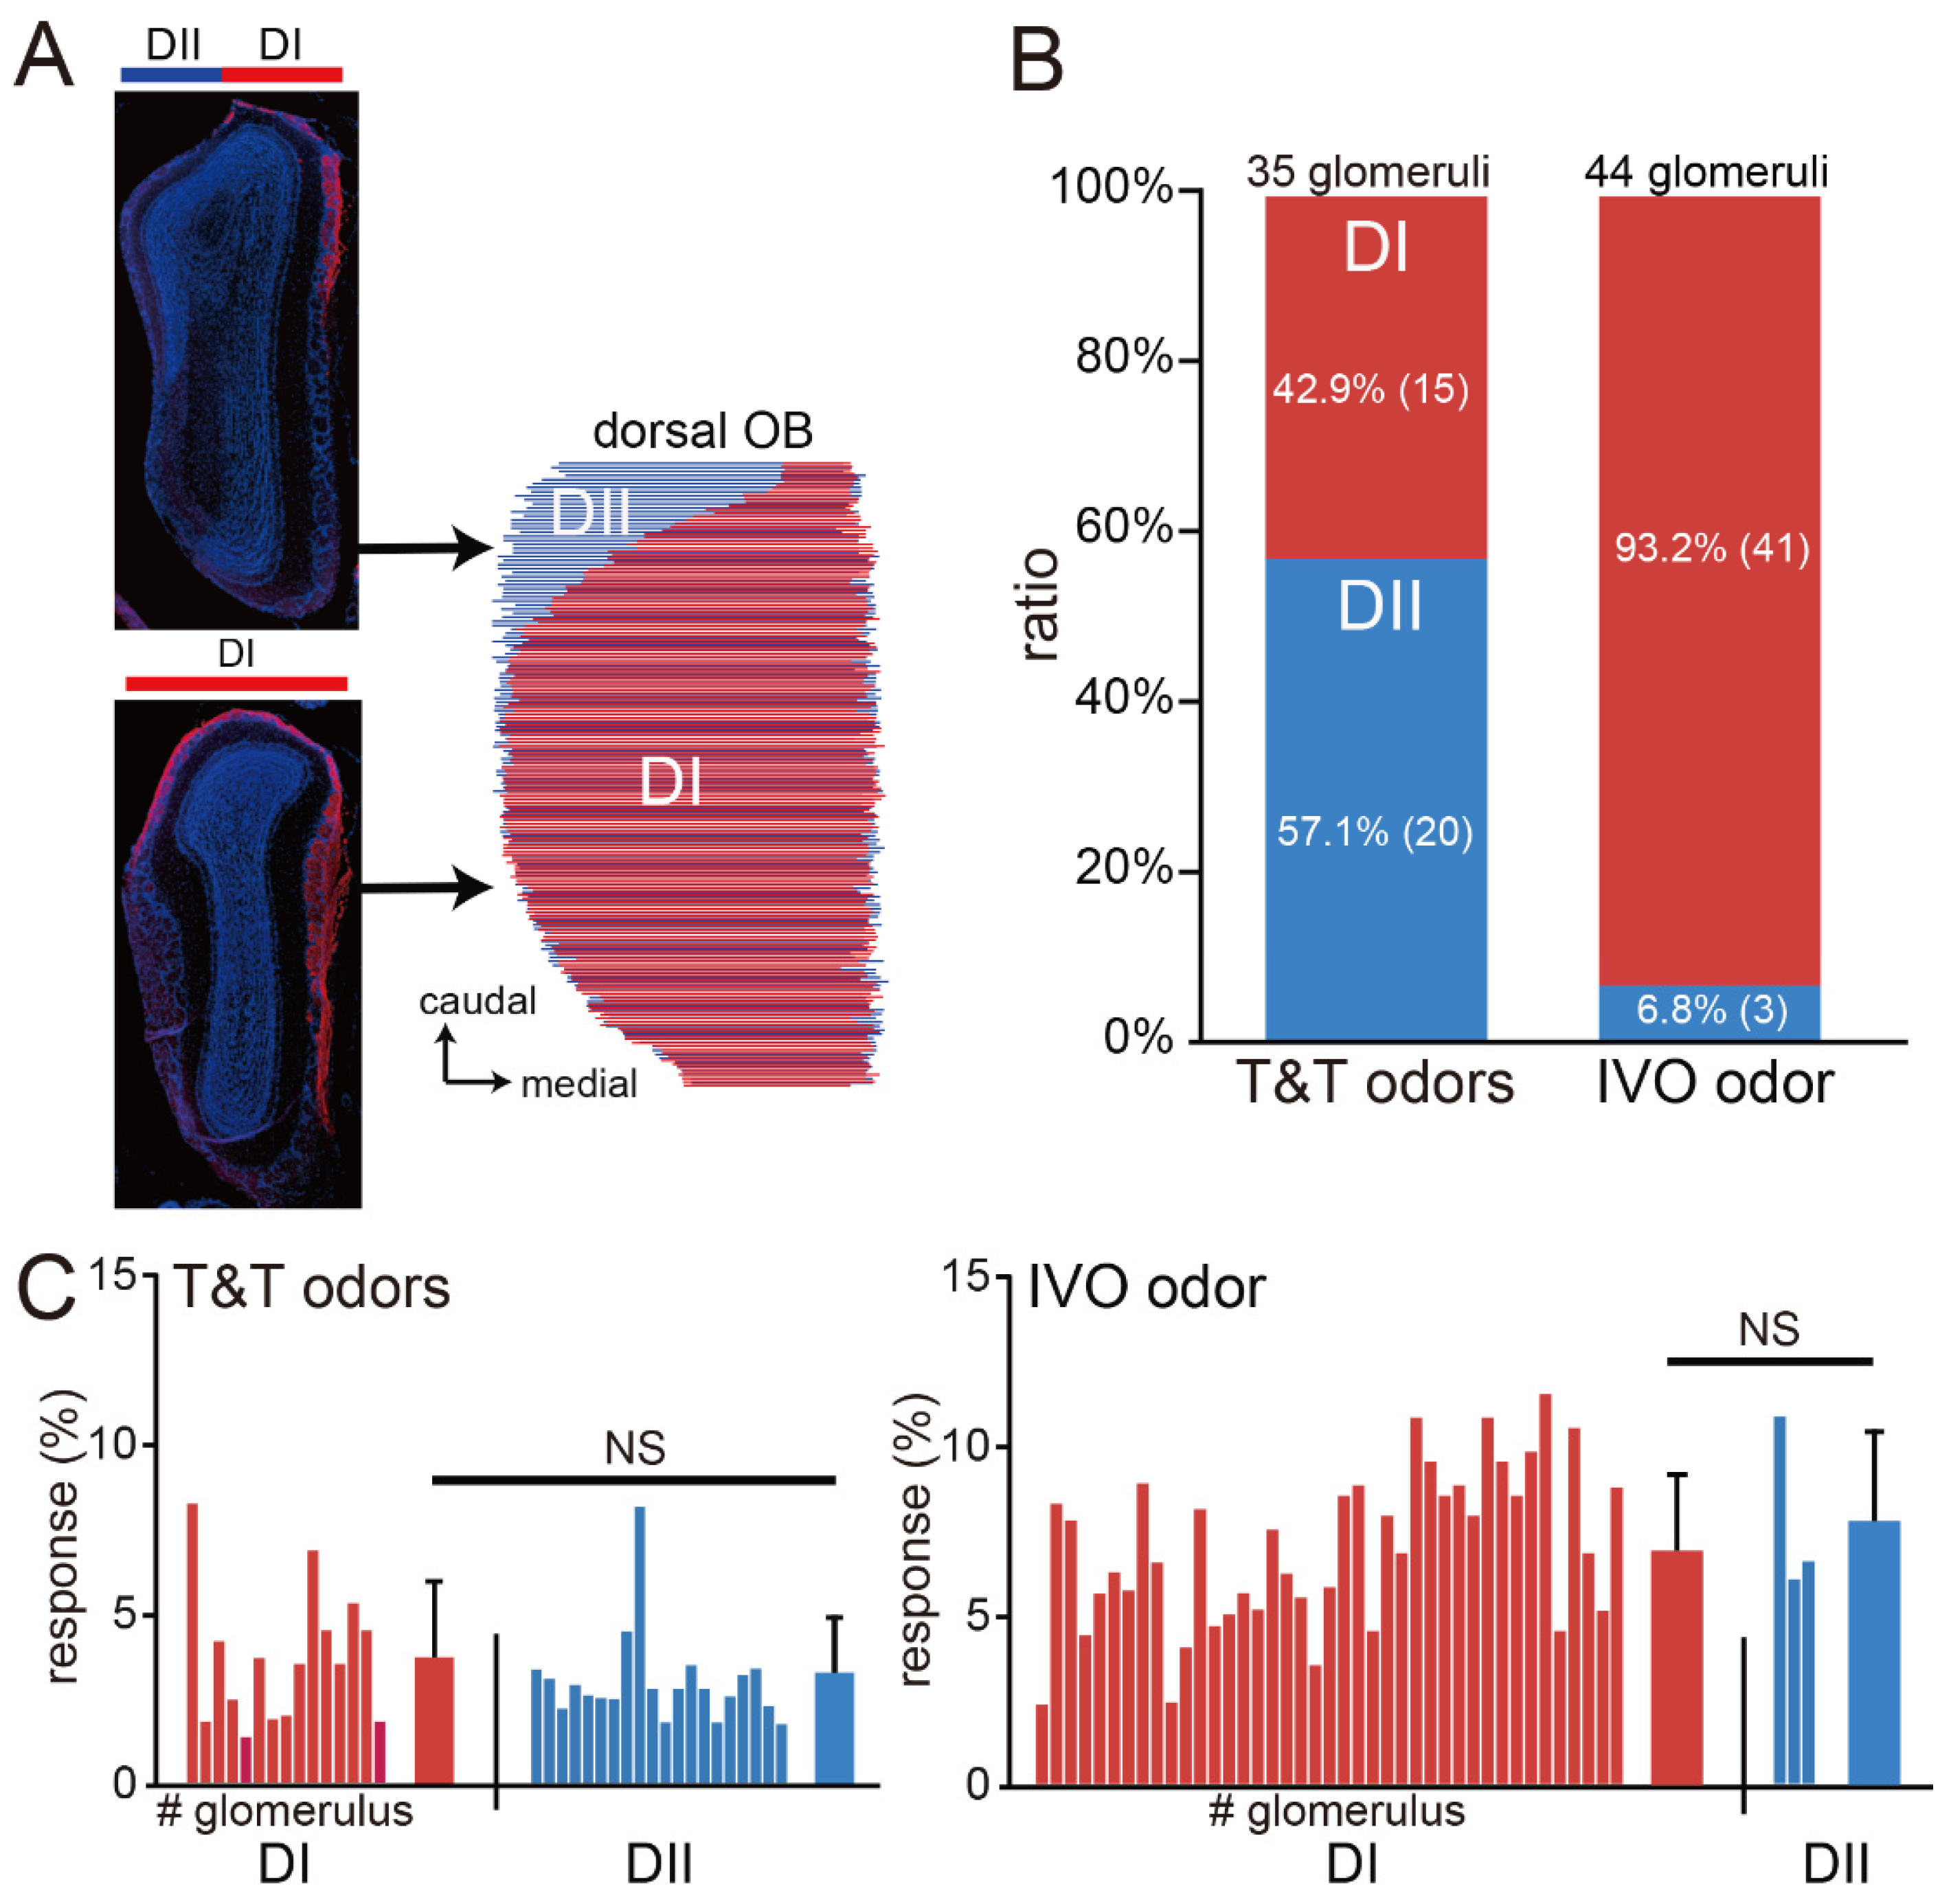
2.2. Optical Imaging of GCaMP3 Signals
2.3. Immunohistochemical Analyses
2.4. Study Participants and Analyses Performed for the Clinical Study
2.5. Statistical Analyses
3. Results
Imaging of the Mouse OB
4. Discussion
5. Conclusions
Author Contributions
Funding
Institutional Review Board Statement
Informed Consent Statement
Data Availability Statement
Conflicts of Interest
References
- Welge-Lüssen, A.; Wolfensberger, M. Olfactory disorders following upper respiratory tract infections. Adv. Otorhinolaryngol. 2006, 63, 125–132. [Google Scholar]
- Deems, D.A.; Doty, R.L.; Settle, R.G.; Moore-Gillon, V.; Shaman, P.; Mester, A.F.; Kimmelman, C.P.; Brightman, V.J.; Snow, J.B., Jr. Smell and taste disorders, a study of 750 patients from the University of Pennsylvania Smell and Taste Center. Arch. Otolaryngol. Head. Neck Surg. 1991, 117, 519–528. [Google Scholar] [CrossRef] [PubMed]
- Brämerson, A.; Johansson, L.; Ek, L.; Nordin, S.; Bende, M. Prevalence of olfactory dysfunction: The skövde population-based study. Laryngoscope 2004, 114, 733–737. [Google Scholar] [CrossRef] [PubMed]
- Seiden, A.M. Postviral olfactory loss. Otolaryngol. Clin. North. Am. 2004, 37, 1159–1166. [Google Scholar] [CrossRef]
- Hummel, T.; Whitcroft, K.L.; Andrews, P.; Altundag, A.; Cinghi, C.; Costanzo, R.M.; Damm, M.; Frasnelli, J.; Gudziol, H.; Gupta, N.; et al. Position paper on olfactory dysfunction. Rhinology 2016, 56, 1–30. [Google Scholar]
- Fokkens, W.J.; Lund, V.J.; Mullol, J.; Bachert, C.; Alobid, I.; Baroody, F.; Cohen, N.; Cervin, A.; Douglas, R.; Gevaert, P.; et al. European Position Paper on Rhinosinusitis and Nasal Polyps 2012. Rhinol. Suppl. 2012, 23, 1–298. [Google Scholar]
- Nakashima, T.; Kidera, K.; Miyazaki, J.; Kuratomi, Y.; Inokuchi, A. Smell intensity monitoring using metal oxide semiconductor odor sensors during intravenous olfaction test. Chem. Senses 2006, 31, 43–47. [Google Scholar] [CrossRef] [PubMed] [Green Version]
- Kikuta, S.; Matsumoto, Y.; Kuboki, A.; Nakayama, T.; Asaka, D.; Otori, N.; Kojima, H.; Sakamoto, T.; Akinori, K.; Kanaya, K.; et al. Longer latency of sensory response to intravenous odor injection predicts olfactory neural disorder. Sci. Rep. 2016, 6, 35361. [Google Scholar] [CrossRef] [PubMed] [Green Version]
- Bozza, T.; Vassalli, A.; Fuss, S.; Zhang, J.J.; Weiland, B.; Pacifico, R.; Feinstein, P.; Mombaerts, P. Mapping of class I and class II odorant receptors to glomerular domains by two distinct types of olfactory sensory neurons in the mouse. Neuron 2009, 61, 220–233. [Google Scholar] [CrossRef] [Green Version]
- Glusman, G.; Yanai, I.; Rubin, I.; Lancet, D. The complete human olfactory subgenome. Genome Res. 2001, 11, 685–702. [Google Scholar] [CrossRef] [Green Version]
- Mori, K.; Sakano, H. How is the olfactory map formed and interpreted in the mammalian brain? Annu. Rev. Neurosci. 2011, 34, 467–499. [Google Scholar] [CrossRef] [PubMed]
- Zhang, X.; Firestein, S. The olfactory receptor gene superfamily of the mouse. Nat. Neurosci. 2002, 5, 124–133. [Google Scholar] [CrossRef] [PubMed]
- Damm, M.; Pikart, L.K.; Reimann, H.; Burkert, S.; Göktas, Ö.; Haxel, B.; Frey, S.; Charalampakis, I.; Beule, A.; Renner, B.; et al. Olfactory training is helpful in postinfectious olfactory loss: A randomized, controlled, multicenter study. Laryngoscope 2014, 124, 826–831. [Google Scholar] [CrossRef] [PubMed]
- Kikuta, S.; Sakamoto, T.; Nagayama, S.; Kanaya, K.; Kinoshita, M.; Kondo, K.; Tsunoda, K.; Mori, K.; Yamasoba, T. Sensory deprivation disrupts homeostatic regeneration of newly generated olfactory sensory neurons after injury in adult mice. J. Neurosci. 2015, 35, 2657–2673. [Google Scholar] [CrossRef] [Green Version]
- Kikuta, S.; Sato, K.; Kashiwadani, H.; Tsunoda, K.; Yamasoba, T.; Mori, K. From the Cover: Neurons in the anterior olfactory nucleus pars externa detect right or left localization of odor sources. Proc. Natl. Acad. Sci. USA 2010, 107, 12363–12368. [Google Scholar] [CrossRef]
- Kikuta, S.; Kashiwadani, H.; Mori, K. Compensatory rapid switching of binasal inputs in the olfactory cortex. J. Neurosci. 2008, 28, 11989–11997. [Google Scholar] [CrossRef] [Green Version]
- Matsumoto, Y.; Nomoto, T.; Cabral, H.; Matsumoto, Y.; Watanabe, S.; Christie, R.J.; Miyata, K.; Oba, M.; Ogura, T.; Yamasaki, Y.; et al. Direct and instantaneous observation of intravenously injected substances using intravital confocal micro-videography. Biomed. Opt. Express 2010, 1, 1209–1216. [Google Scholar] [CrossRef]
- Kikuta, S.; Fletcher, M.L.; Homma, R.; Yamasoba, T.; Nagayama, S. Odorant response properties of individual neurons in an olfactory glomerular module. Neuron 2013, 77, 1122–1135. [Google Scholar] [CrossRef] [Green Version]
- Tuerdi, A.; Kikuta, S.; Kinoshita, M.; Kamogashira, T.; Kondo, K.; Yamasoba, T. Zone-specific damage of the olfactory epithelium under protein restriction. Sci. Rep. 2020, 10, 22175. [Google Scholar] [CrossRef]
- Cooper, K.W.; Brann, D.H.; Farruggia, M.C.; Bhutani, S.; Pellegrino, R.; Tsukahara, T.; Weinreb, C.; Joseph, P.V.; Larson, E.D.; Parma, V.; et al. COVID-19 and the Chemical Senses: Supporting Players Take Center Stage. Neuron 2020, 107, 219–233. [Google Scholar] [CrossRef]
- Takagi, S.F. A standardized olfactometer in Japan. A review over ten years. Ann. N. Y. Acad. Sci. 1987, 510, 113–118. [Google Scholar] [CrossRef]
- Zusho, H. Olfactometry in Japan. Rhinology 1983, 21, 281–285. [Google Scholar] [PubMed]
- Kondo, H.; Matsuda, T.; Hashiba, M.; Baba, S. A study of the relationship between the T&T olfactometer and the University of Pennsylvania Smell Identification Test in a Japanese population. Am. J. Rhinol. 1998, 12, 353–358. [Google Scholar] [PubMed]
- Okabe, E. A study on the mechanism of phleboid olfactory function. Nihon Jibiinkoka Gakkai Kaiho 1989, 92, 111–120. [Google Scholar] [CrossRef] [PubMed] [Green Version]
- Bozza, T.; McGann, J.P.; Mombaerts, P.; Wachowiak, M. In vivo imaging of neuronal activity by targeted expression of a genetically encoded probe in the mouse. Neuron 2004, 42, 9–21. [Google Scholar] [CrossRef] [Green Version]
- Igarashi, K.M.; Mori, K. Spatial representation of hydrocarbon odorants in the ventrolateral zones of the rat olfactory bulb. J. Neurophysiol. 2005, 93, 1007–1019. [Google Scholar] [CrossRef] [Green Version]
- Johnson, B.A.; Ho, S.L.; Xu, Z.; Yihan, J.S.; Yip, S.; Hingco, E.E.; Leon, M. Functional mapping of the rat olfactory bulb using diverse odorants reveals modular responses to functional groups and hydrocarbon structural features. J. Comp. Neurol. 2002, 449, 180–194. [Google Scholar] [CrossRef]
- Uchida, N.; Takahashi, Y.K.; Tanifuji, M.; Mori, K. Odor maps in the mammalian olfactory bulb: Domain organization and odorant structural features. Nat. Neurosci. 2000, 3, 1035–1043. [Google Scholar] [CrossRef]
- Takahashi, Y.K.; Kurosaki, M.; Hirono, S.; Mori, K. Topographic representation of odorant molecular features in the rat olfactory bulb. J. Neurophysiol. 2004, 92, 2413–2427. [Google Scholar] [CrossRef] [Green Version]
- Malnic, B.; Hirono, J.; Sato, T.; Buck, L.B. Combinatorial receptor codes for odors. Cell. 1999, 96, 713–723. [Google Scholar] [CrossRef] [Green Version]
- Omura, K.; Han, B.; Nishijima, H.; Aoki, S.; Ebihara, T.; Kondo, K.; Otori, N.; Kojima, H.; Yamasoba, T.; Kikuta, S. Heterogeneous distribution of mature olfactory sensory neurons in human olfactory epithelium. Int. Forum Allergy Rhinol. 2021, 12, 266–277. [Google Scholar] [CrossRef] [PubMed]
- Durante, M.A.; Kurtenbach, S.; Sargi, Z.B.; Harbour, J.W.; Choi, R.; Kurtenbach, S.; Goss, G.M.; Matsunami, H.; Goldstein, B.J. Single-cell analysis of olfactory neurogenesis and differentiation in adult humans. Nat. Neurosci. 2020, 23, 323–326. [Google Scholar] [CrossRef] [PubMed]
- Maresh, A.; Rodriguez Gil, D.; Whitman, M.C.; Greer, C.A. Principles of glomerular organization in the human olfactory bulb--implications for odor processing. PLoS ONE 2008, 3, e2640. [Google Scholar] [CrossRef] [Green Version]
- Cadenas, E. Antioxidant and prooxidant functions of DT-diaphorase in quinone metabolism. Biochem. Pharmacol. 1995, 49, 127–140. [Google Scholar] [CrossRef] [PubMed]
- Eriksson, C.; Brittebo, E.B. Metabolic activation of the herbicide dichlobenil in the olfactory mucosa of mice and rats. Chem. Biol. Interact. 1991, 79, 165–177. [Google Scholar] [CrossRef] [PubMed]
- Smythies, J.; Galzigna, L. The oxidative metabolism of catecholamines in the brain: A review. Biochim. Biophys. Acta 1998, 1380, 159–162. [Google Scholar] [CrossRef]
- Hernaez, B.; Alcamí, A. Virus-encoded cytokine and chemokine decoy receptors. Curr. Opin. Immunol. 2020, 66, 50–56. [Google Scholar] [CrossRef]
- Gu, Y.; Zuo, X.; Zhang, S.; Ouyang, Z.; Jiang, S.; Wang, F.; Wang, G. The Mechanism behind Influenza Virus Cytokine Storm. Viruses 2021, 13, 1362. [Google Scholar] [CrossRef]
- Han, X.; Liu, X.; Wang, X.; Guo, W.; Wen, Y.; Meng, W.; Peng, D.; Lv, P.; Zhang, X.; Shen, H. TNF-α-dependent lung inflammation upregulates superoxide dismutase-2 to promote tumor cell proliferation in lung adenocarcinoma. Mol. Carcinog. 2020, 59, 1088–1099. [Google Scholar] [CrossRef]
- Knowles, M.R.; Boucher, R.C. Mucus clearance as a primary innate defense mechanism for mammalian airways. J. Clin. Invest. 2002, 109, 571–577. [Google Scholar] [CrossRef]
- Stevens, W.W.; Lee, R.J.; Schleimer, R.P.; Cohen, N.A. Chronic rhinosinusitis pathogenesis. J. Allergy Clin. Immunol. 2015, 136, 1442–1453. [Google Scholar] [CrossRef] [PubMed] [Green Version]
- Soyka, M.B.; Wawrzyniak, P.; Eiwegger, T.; Holzmann, D.; Treis, A.; Wanke, K.; Kast, J.I.; Akdis, C.A. Defective epithelial barrier in chronic rhinosinusitis: The regulation of tight junctions by IFN-gamma and IL-4. J. Allergy Clin. Immunol. 2012, 130, 1087–1096 e10. [Google Scholar] [CrossRef]
- Howell, J.; Costanzo, R.M.; Reiter, E.R. Head trauma and olfactory function. World J. Otorhinolaryngol. Head. Neck Surg. 2018, 4, 39–45. [Google Scholar] [CrossRef] [PubMed]
- Haxel, B.R.; Grant, L.; Mackay-Sim, A. Olfactory dysfunction after head injury. J. Head. Trauma. Rehabil. 2008, 23, 407–413. [Google Scholar] [CrossRef] [PubMed]
- Gudziol, V.; Hoenck, I.; Landis, B.; Podlesek, D.; Bayn, M.; Hummel, T. The impact and prospect of traumatic brain injury on olfactory function: A cross-sectional and prospective study. Eur. Arch. Otorhinolaryngol. 2014, 271, 1533–1540. [Google Scholar] [CrossRef] [PubMed]
- Ikeda, K.; Sakurada, T.; Takasaka, T.; Okitsu, T.; Yoshida, S. Anosmia following head trauma: Preliminary study of steroid treatment. Tohoku J. Exp. Med. 1995, 177, 343–351. [Google Scholar] [CrossRef] [Green Version]
- Frasnelli, J.; Laguë-Beauvais, M.; LeBlanc, J.; Alturki, A.Y.; Champoux, M.C.; Couturier, C.; Anderson, K.; Lamoureux, J.; Marcoux, J.; Tinawi, S.; et al. Olfactory function in acute traumatic brain injury. Clin. Neurol. Neurosurg. 2016, 140, 68–72. [Google Scholar] [CrossRef]


| Disease Type | N | Period to Exam. (Months) | Age (y) | Sex (M/F) | IVO Test | T&T Test | |||
|---|---|---|---|---|---|---|---|---|---|
| Response (Yes/No) | Latency (s) | Duration (s) | Response (Yes/No) | Recognition Score | |||||
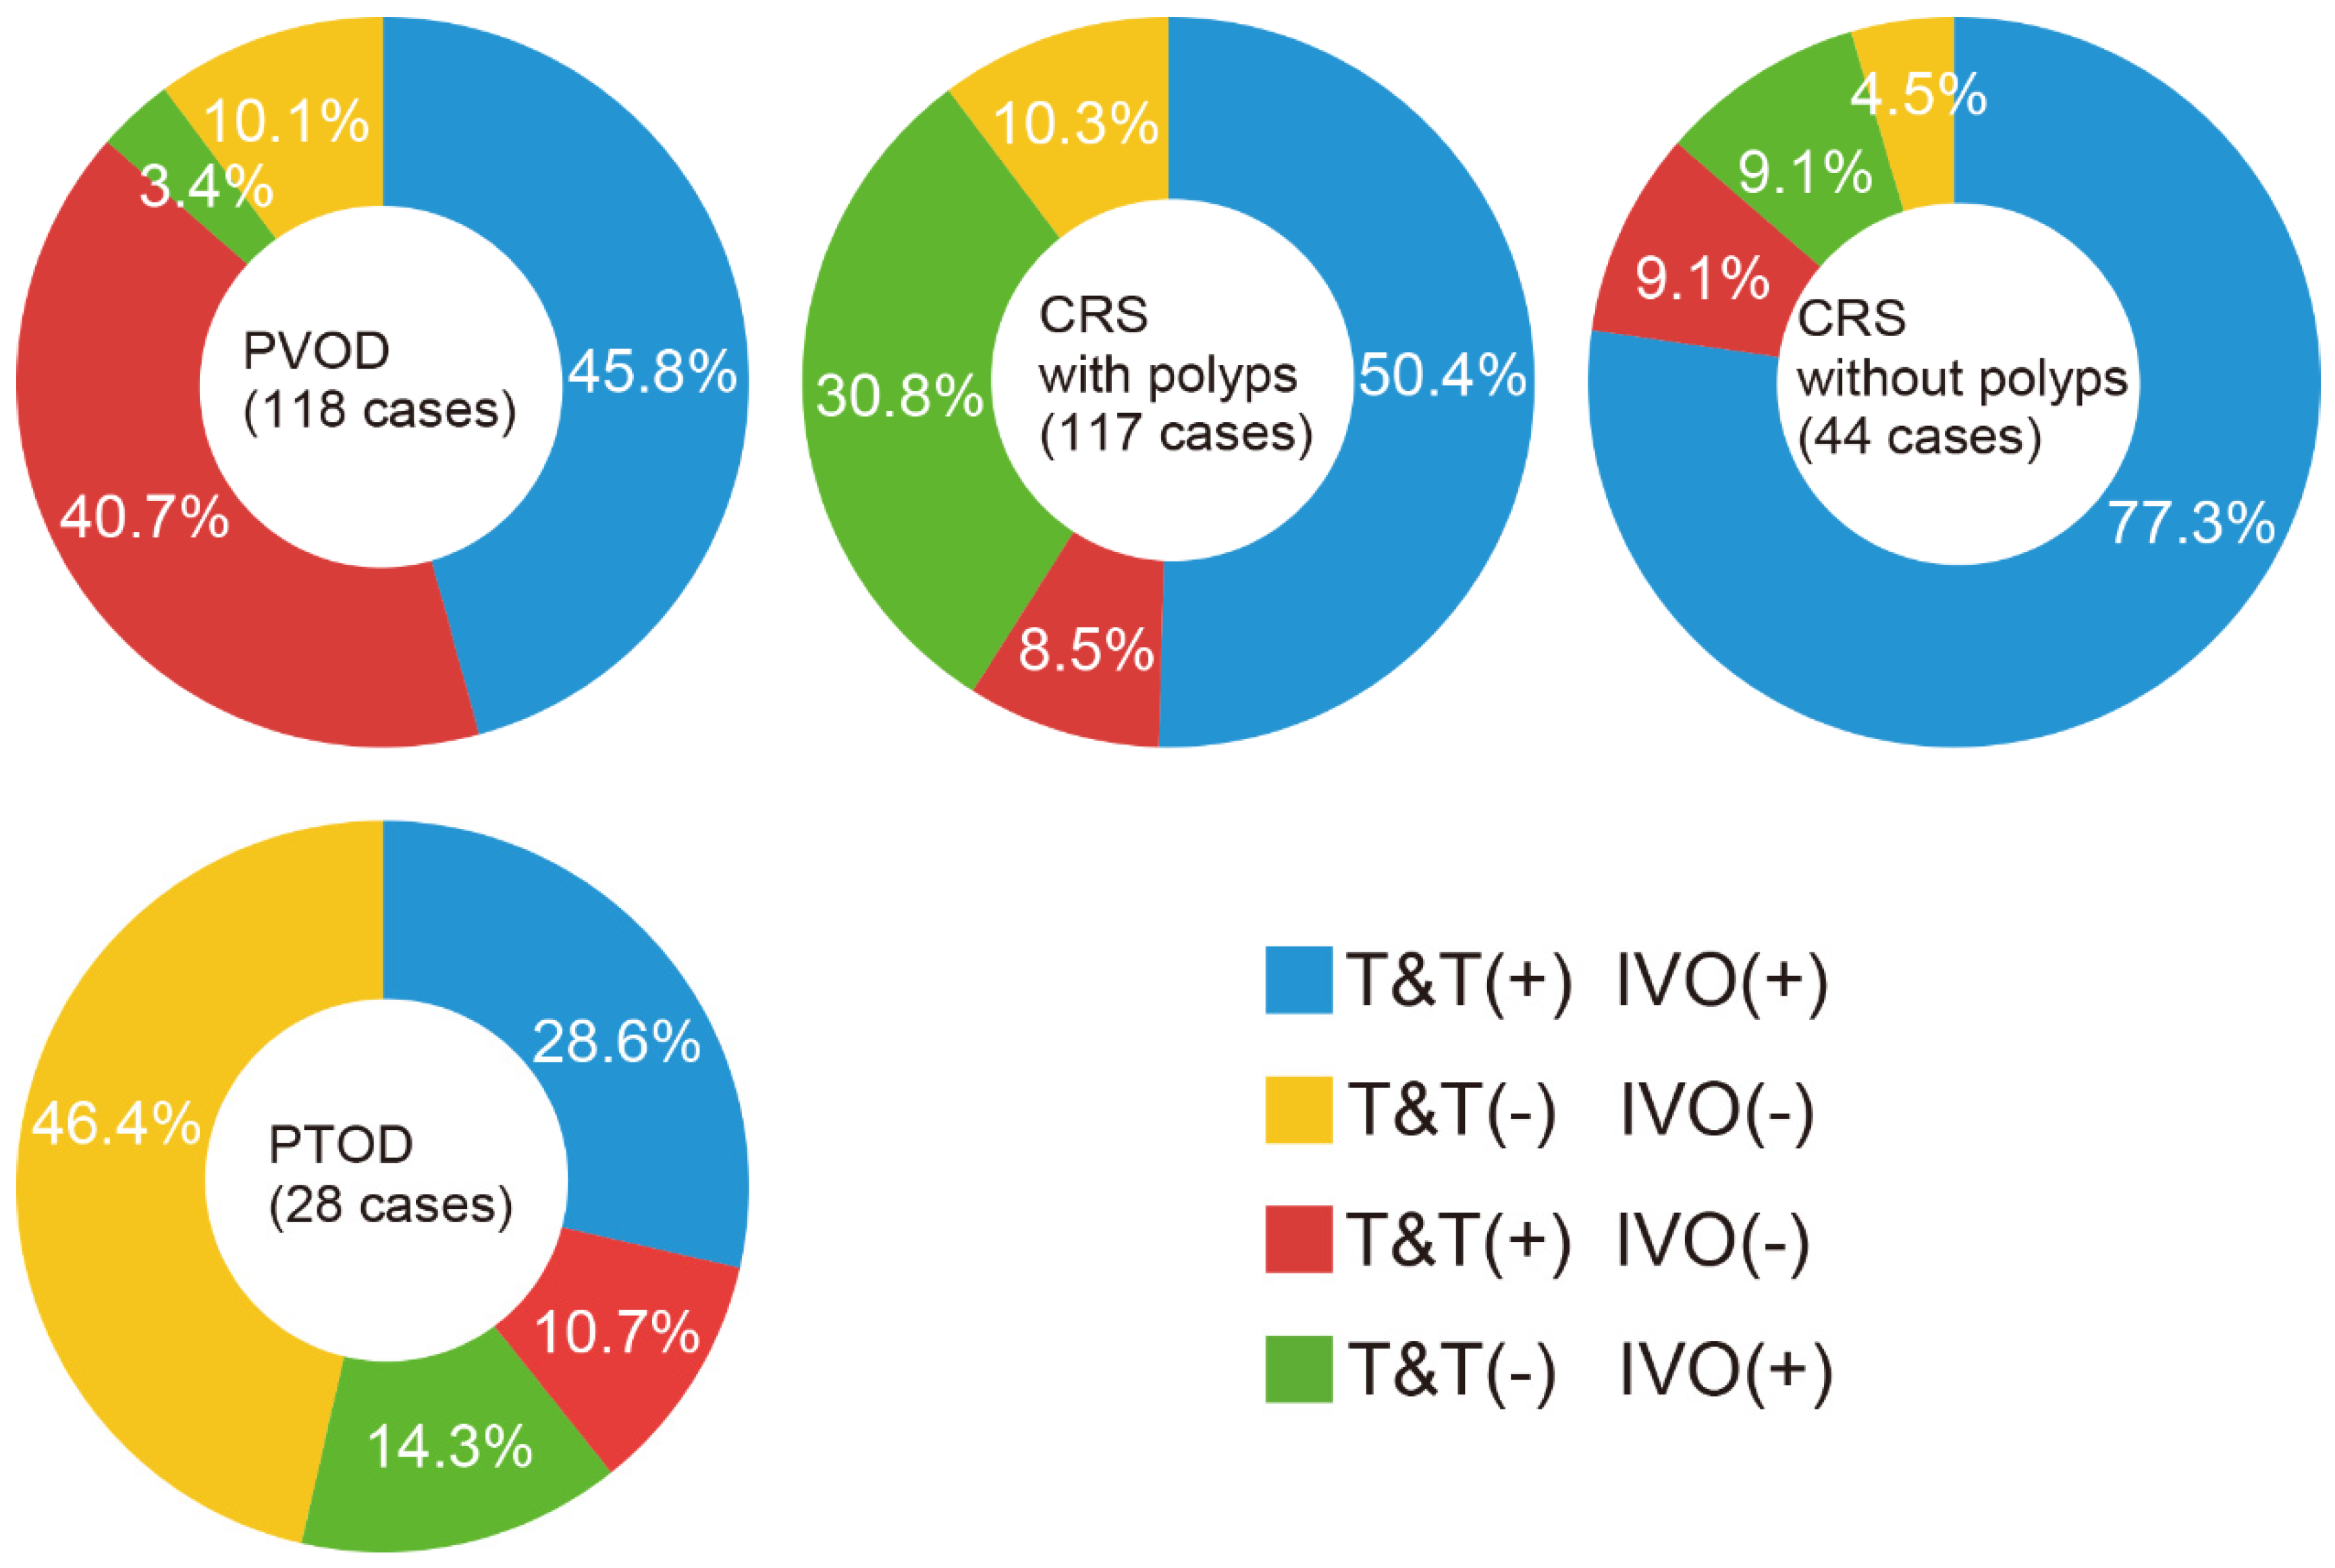
| PVOD | 118 | 3.0 ± 1.5 | 54.1 ± 12.5 | M: 26 (22%) F: 92 (78%) | 58 (49%) /60 (51%) | 22.1 ± 10.5 | 71.3 ± 46.9 | 102 (86%) /16 (14%) | 3.6 ± 1.7 |
| CRS with polyps | 117 | n.d. | 54.4 ± 10.2 | M: 79 (68%) F: 38 (32%) | 95 (81%) /22 (19%) | 18.9 ± 7.8 | 66.9 ± 35.3 | 69 (59%) /48 (41%) | 4.4 ± 1.5 |
| CRS without polyps | 44 | n.d. | 52.1 ± 9.2 | M: 30 (68%) F: 14 (32%) | 39 (89%) /5 (11%) | 15.5 ± 7.9 | 80.6 ± 51.8 | 37 (84%) /7 (16%) | 3.3 ± 1.7 |
| PTOD | 28 | 3.0 ± 1.6 | 46.3 ± 12.6 | M: 14 (50%) F: 14 (50%) | 12 (43%) /16 (57%) | 17.3 ± 7.3 | 55.9 ± 30.4 | 11 (39%) /17 (61%) | 5.2 ± 1.1 |
| Variable | N | Univariable Coefficient (95%CI) | p-Value | Multivariable, OR (95%CI) | p-Value | |
|---|---|---|---|---|---|---|
| PVOD | Age | 0.01 (−0.01–0.03) | 0.32 | |||
| Sex | M: 26 F: 92 | −2.0 (−2.52–(−1.55)) | <0.001 | 0.13 (0.07–0.24) | <0.001 | |
| T&T(+) IVO(+) | 54 | −0.42 (−0.84–(−0.01)) | 0.04 | 1.35 (0.59–3.1) | 0.48 | |
| T&T(−) IVO(+) | 4 | −2.27 (−3.3–(−1.25)) | <0.001 | 0.22 (0.06–0.81) | 0.02 | |
| T&T(+) IVO(−) | 48 | 2.15 (1.63–2.67) | <0.001 | 8.42 (3.14–22.56) | <0.001 | |
| T&T(−) IVO(−) | 12 | −0.07 (−0.75–0.6) | 0.83 |
| Variable | N | Mean | Univariate Coefficient (95% CI) | p-Value | Multivariate, OR (95% CI) | p-Value | |
|---|---|---|---|---|---|---|---|
| T&T(+) IVO(+) | Age | 155 | 52.8 ± 10.8 | −0.01 (−0.02–0.02) | 0.77 | ||
| Sex | M: 77 F: 78 | 0.09 (−0.36–0.54) | 0.69 | ||||
| PVOD | 54 | −0.31 (−0.77–0.15) | 0.19 | ||||
| CRS with polyps | 59 | −0.01 (−0.46–0.46) | 0.99 | ||||
| CRS without polyps | 34 | 1.38 (0.64–2.13) | <0.001 | 3.67 (1.73–7.77) | <0.001 | ||
| PTOD | 8 | −1.02 (−1.88–(−0.17)) | 0.02 | 0.43 (0.18–1.02) | 0.56 |
| Variable | N | Mean | Univariate Coefficient, (95% CI) | p-Value | Multivariate, OR (95% CI) | p-Value | |
|---|---|---|---|---|---|---|---|
| T&T(−) IVO(+) | Age | 53.8 ± 10.1 | 0.01 (−0.02–0.03) | 0.61 | |||
| Sex | M: 29 F: 19 | 0.57 (−0.06–1.20) | 0.08 | ||||
| PVOD | 4 | −2.16 (−3.21–(−1.10)) | <0.001 | 0.28 (0.08–0.97) | 0.04 | ||
| CRS with polyps | 36 | 1.89 (1.18–2.59) | <0.001 | 3.56 (1.55–8.18) | 0.003 | ||
| CRS without polyps | 4 | −0.69 (−1.78–(−0.38)) | 0.2 | ||||
| PTOD | 4 | −0.12 (−1.22–0.99) | 0.84 |
| Variable | N | Mean | Univariate Coefficient (95% CI) | p-Value | Multivariate, OR (95%CI) | p-Value | |
|---|---|---|---|---|---|---|---|
| T&T(+) IVO(−) | Age | 54.1 ± 12.5 | 0.02 (−0.02–0.04) | 0.35 | |||
| Sex | M: 25 F: 40 | 0.89 (0.004–1.78) | 0.04 | 1.52 (0.76–3.03) | 0.24 | ||
| PVOD | 48 | 1.94 (1.32–2.56) | <0.001 | 6.52 (1.82–23.42) | 0.004 | ||
| CRS with polyps | 10 | −1.47 (−2.19–(−0.75)) | <0.001 | 0.73 (0.18–2.85) | 0.65 | ||
| CRS without polyps | 4 | −1.11 (−2.17–(−0.04)) | 0.04 | 0.77 (0.16–3.78) | 0.75 | ||
| PTOD | 3 | −0.87 (−2.10–0.36) | 0.17 |
| Variable | N | Mean | Univariate Coefficient (95% CI) | p-Value | |
|---|---|---|---|---|---|
| T&T(−) IVO(−) | Age | 53.2 ± 13.5 | 0.01 (−0.03–0.03) | 0.89 | |
| Sex | M: 18 F: 21 | −0.11 (−0.78–0.56) | 0.75 | ||
| PVOD | 12 | −0.39 (−1.11–0.34) | 0.29 | ||
| CRS with polyps | 12 | −0.37 (−1.09–0.35) | 0.31 | ||
| CRS without polyps | 2 | −1.23 (−2.7–(−0.23)) | 0.09 | ||
| PTOD | 13 | 2.13 (1.29–2.98) | <0.001 |
Disclaimer/Publisher’s Note: The statements, opinions and data contained in all publications are solely those of the individual author(s) and contributor(s) and not of MDPI and/or the editor(s). MDPI and/or the editor(s) disclaim responsibility for any injury to people or property resulting from any ideas, methods, instructions or products referred to in the content. |
© 2023 by the authors. Licensee MDPI, Basel, Switzerland. This article is an open access article distributed under the terms and conditions of the Creative Commons Attribution (CC BY) license (https://creativecommons.org/licenses/by/4.0/).
Share and Cite
Kikuta, S.; Han, B.; Yamasoba, T. Heterogeneous Damage to the Olfactory Epithelium in Patients with Post-Viral Olfactory Dysfunction. J. Clin. Med. 2023, 12, 5007. https://doi.org/10.3390/jcm12155007
Kikuta S, Han B, Yamasoba T. Heterogeneous Damage to the Olfactory Epithelium in Patients with Post-Viral Olfactory Dysfunction. Journal of Clinical Medicine. 2023; 12(15):5007. https://doi.org/10.3390/jcm12155007
Chicago/Turabian StyleKikuta, Shu, Bing Han, and Tatsuya Yamasoba. 2023. "Heterogeneous Damage to the Olfactory Epithelium in Patients with Post-Viral Olfactory Dysfunction" Journal of Clinical Medicine 12, no. 15: 5007. https://doi.org/10.3390/jcm12155007