

Effect of Exercise Interventions on Irisin and Interleukin-6 Concentrations and Indicators of Carbohydrate Metabolism in Males with Metabolic Syndrome


Abstract
:1. Introduction
2. Materials and Methods
2.1. Materials
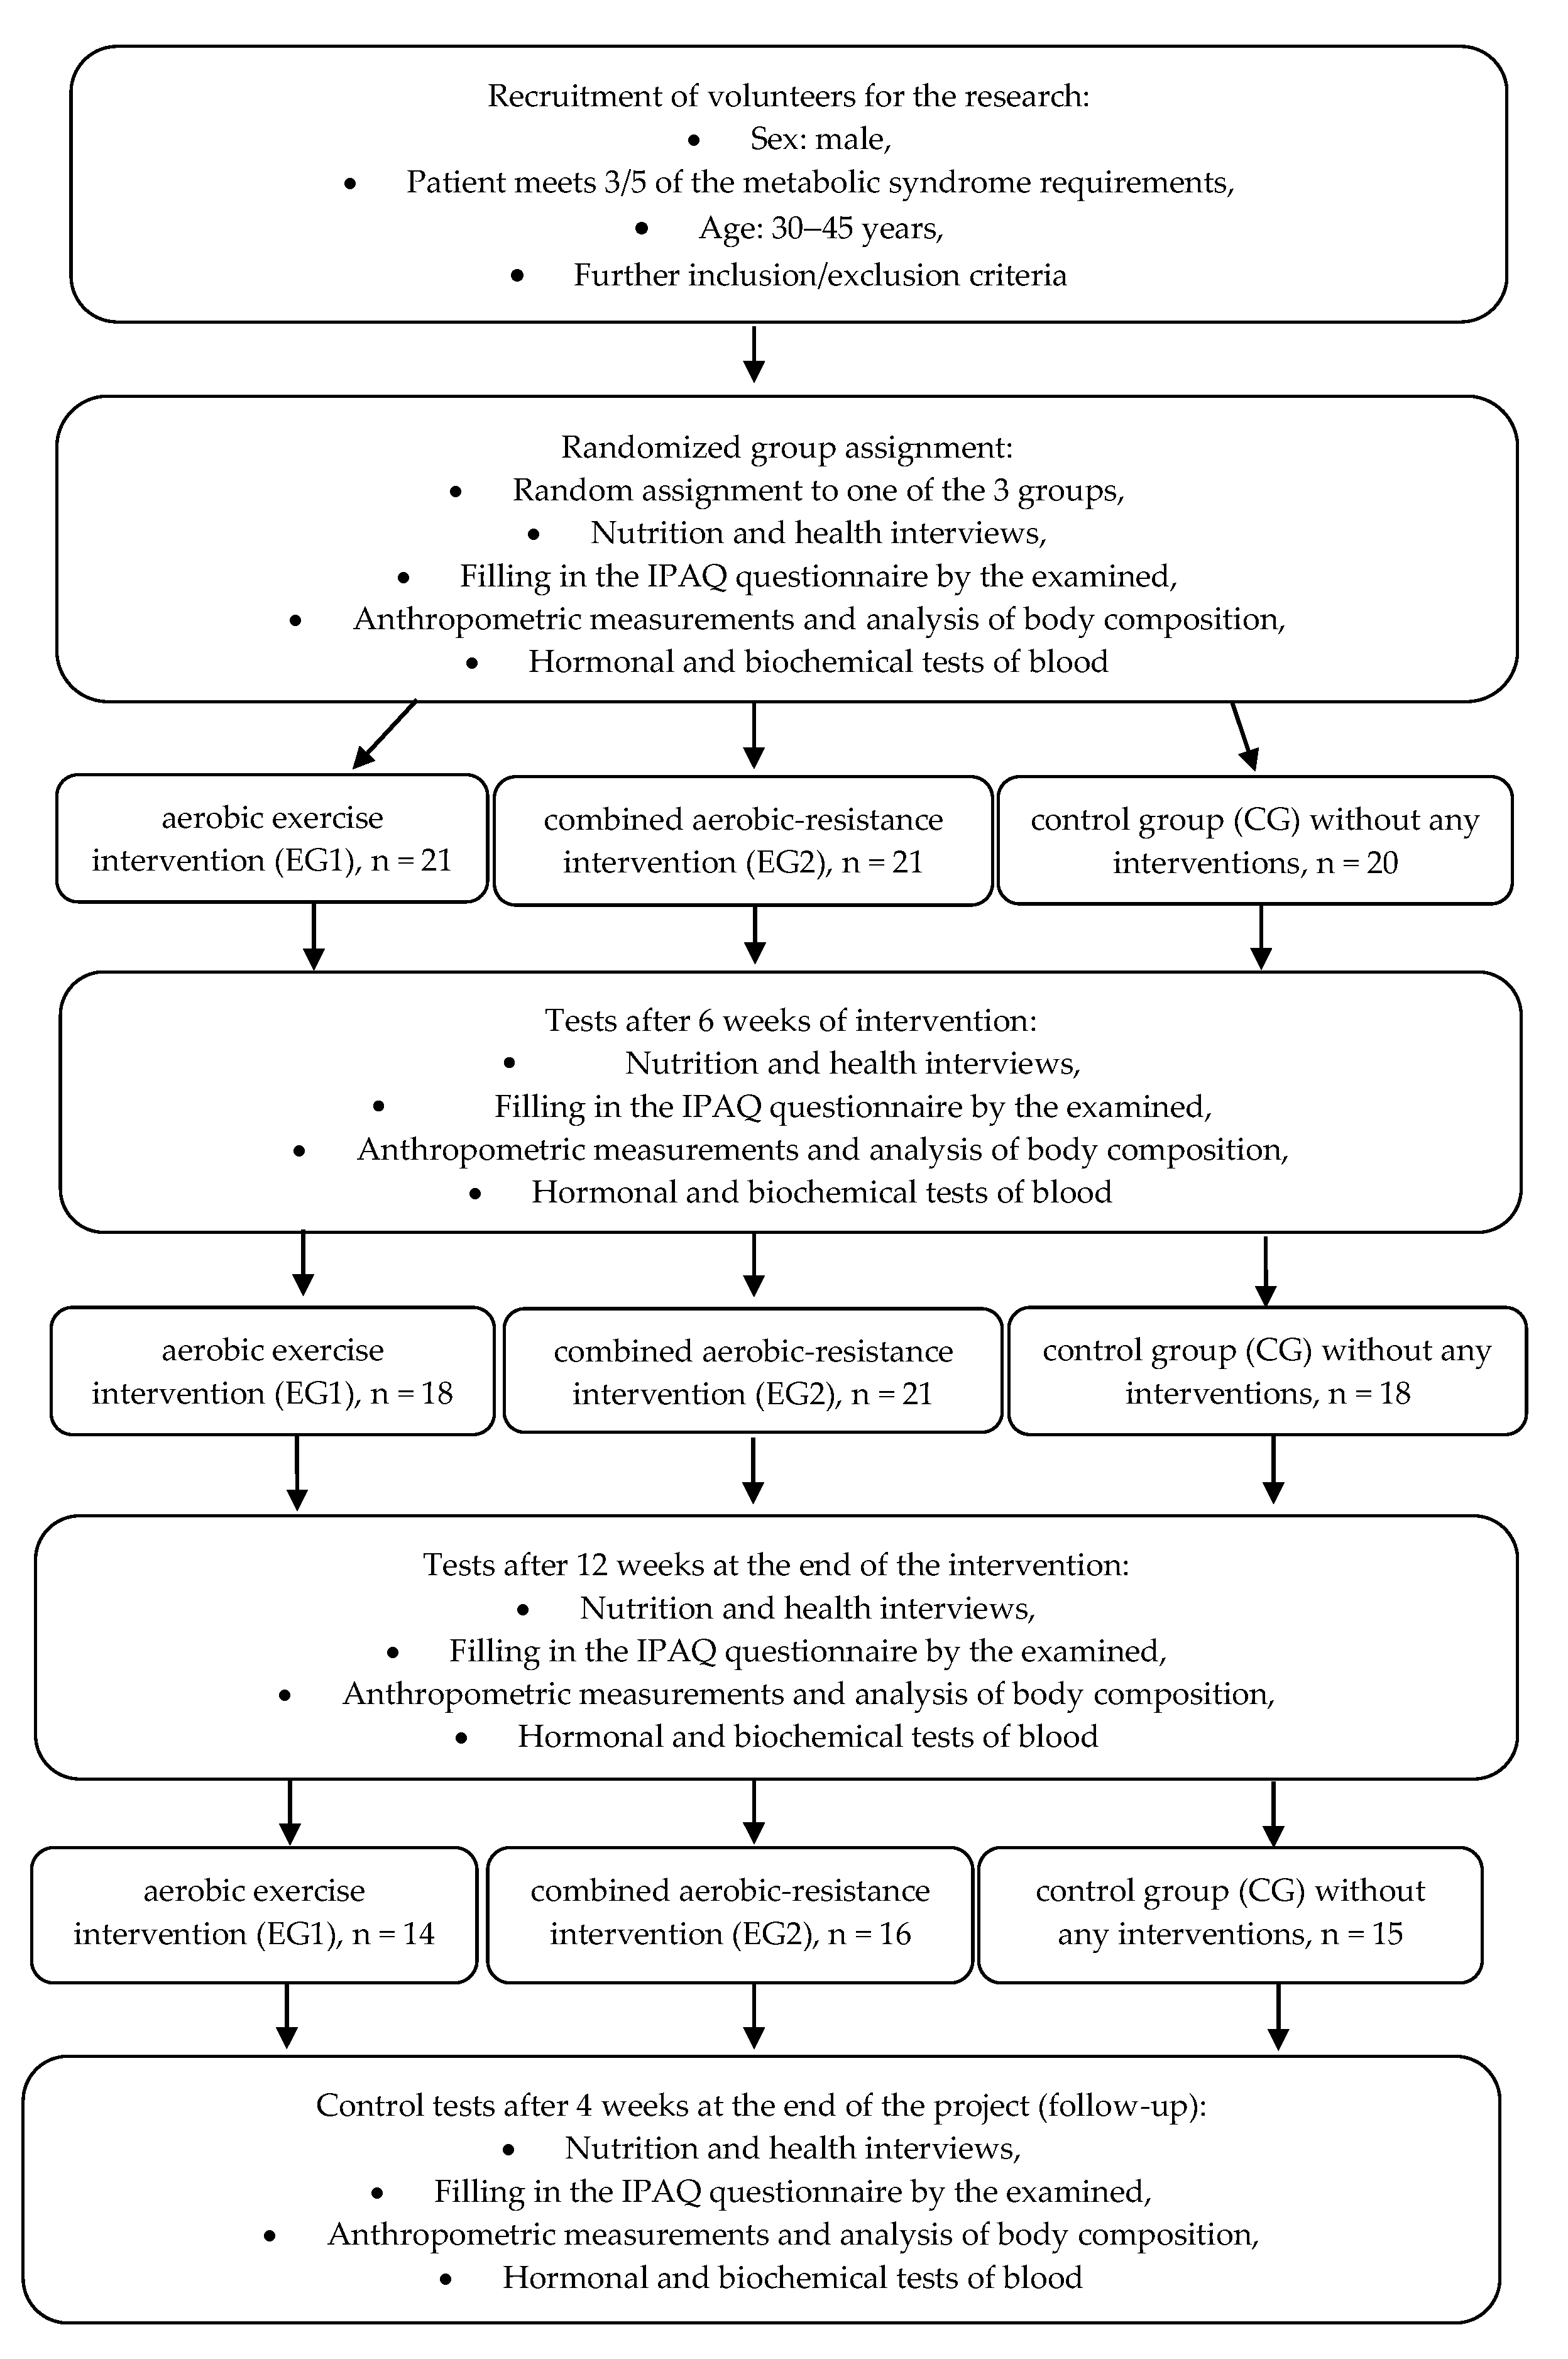
- Experimental group 1 (EG1) of males with MetS (n = 21) performing aerobic exercise intervention;
- Experimental group 2 (EG2) of males with MetS (n = 21) performing combined aerobic-resistance exercise intervention;
- Control group (CG) of males with MetS (n = 20) not undertaking any physical activity.
2.2. Methods
2.2.1. Anthropometry
2.2.2. Body Composition
2.2.3. Hormonal Blood Indices
2.2.4. Biochemical Blood Indices
2.2.5. Evaluation of Energy Expenditure and Energy Value of Diet
2.3. Exercise Interventions
2.3.1. Aerobic Training
2.3.2. Combined Aerobic-Resistance Training
2.4. Statistical Analysis
3. Results
4. Discussion
Supplementary Materials
Author Contributions
Funding
Institutional Review Board Statement
Informed Consent Statement
Data Availability Statement
Acknowledgments
Conflicts of Interest
References
- Fahed, G.; Aoun, L.; Bou Zerdan, M.; Allam, S.; Bou Zerdan, M.; Bouferraa, Y.; Assi, H.I. Metabolic Syndrome: Updates on Pathophysiology and Management in 2021. Int. J. Mol. Sci. 2022, 23, 786. [Google Scholar] [CrossRef] [PubMed]
- Fathi Dizaji, B. The investigations of genetic determinants of the metabolic syndrome. Diabetes Metab. Syndr. 2018, 12, 783–789. [Google Scholar] [CrossRef] [PubMed]
- Matsuzawa, Y.; Funahashi, T.; Nakamura, T. The concept of metabolic syndrome: Contribution of visceral fat accumulation and its molecular mechanism. J. Atheroscler. Thromb. 2011, 18, 629–639. [Google Scholar] [CrossRef] [Green Version]
- Suder, A. Socioeconomic and lifestyle determinants of body fat distribution in young working males from Cracow, Poland. Am. J. Hum. Biol. 2008, 20, 100–109. [Google Scholar] [CrossRef]
- Suder, A. Body fatness and its social and lifestyle determinants in young working males from Cracow, Poland. J. Bios. Sci. 2009, 41, 139–154. [Google Scholar] [CrossRef] [PubMed]
- Pedersen, B.K. Physical activity and muscle-brain crosstalk. Nat. Rev. Endocrinol. 2019, 15, 383–392. [Google Scholar] [CrossRef] [PubMed]
- Das, D.K.; Graham, Z.A.; Cardozo, C.P. Myokines in skeletal muscle physiology and metabolism: Recent advances and future perspectives. Acta Physiol. 2020, 228, e13367. [Google Scholar] [CrossRef] [PubMed]
- Huh, J.Y. The role of exercise-induced myokines in regulating metabolism. Arch. Pharmacal Res. 2018, 41, 14–29. [Google Scholar] [CrossRef] [PubMed]
- Yu, Q.; Kou, W.; Xu, X.; Zhou, S.; Luan, P.; Li, H.; Zhuang, J.; Wang, J.; Zhao, Y.; Xu, Y.; et al. FNDC5/Irisin inhibits pathological cardiac hypertrophy. Clin. Sci. 2019, 133, 611–627. [Google Scholar] [CrossRef]
- Roca-Rivada, A.; Castelao, C.; Senin, L.L.; Landrove, M.O.; Baltar, J.; Crujeiras, A.B.; Seoane, L.M.; Casanueva, F.F.; Pardo, M. FNDC5/irisin is not only a myokine but also an adipokine. PLoS ONE 2013, 8, e60563. [Google Scholar] [CrossRef]
- Boström, P.; Wu, J.; Jedrychowski, M.P.; Korde, A.; Ye, L.; Lo, J.C.; Rasbach, K.A.; Boström, E.A.; Choi, J.H.; Long, J.Z.; et al. A PGC1-α-dependent myokine that drives brown-fat-like development of white fat and thermogenesis. Nature 2012, 481, 463–468. [Google Scholar] [CrossRef] [PubMed] [Green Version]
- Xin, C.; Liu, J.; Zhang, J.; Zhu, D.; Wang, H.; Xiong, L.; Lee, Y.; Ye, J.; Lian, K.; Xu, C.; et al. Irisin improves fatty acid oxidation and glucose utilization in type 2 diabetes by regulating the AMPK signaling pathway. Int. J. Obes. 2016, 40, 443–451. [Google Scholar] [CrossRef] [PubMed]
- Polyzos, S.A.; Anastasilakis, A.D.; Efstathiadou, Z.A.; Makras, P.; Perakakis, N.; Kountouras, J.; Mantzoros, C.S. Irisin in metabolic diseases. Endocrine 2018, 59, 260–274. [Google Scholar] [CrossRef] [PubMed]
- Chen, N.; Li, Q.; Liu, J.; Jia, S. Irisin, an exercise-induced myokine as a metabolic regulator: An updated narrative review. Diabetes Metab. Res. Rev. 2016, 32, 51–59. [Google Scholar] [CrossRef] [PubMed]
- Park, K.H.; Zaichenko, L.; Brinkoetter, M.; Thakkar, B.; Sahin-Efe, A.; Joung, K.E.; Tsoukas, M.A.; Geladari, E.V.; Huh, J.Y.; Dincer, F.; et al. Circulating irisin in relation to insulin resistance and the metabolic syndrome. J. Clin. Endocrinol. Metab. 2013, 98, 4899–4907. [Google Scholar] [CrossRef]
- Jia, J.; Yu, F.; Wei, W.P.; Yang, P.; Zhang, R.; Sheng, Y.; Shi, Y.Q. Relationship between circulating irisin levels and over-weight/obesity: A meta-analysis. World J. Clin. Cases 2019, 7, 1444–1455. [Google Scholar] [CrossRef]
- Huh, J.Y.; Siopi, A.; Mougios, V.; Park, K.H.; Mantzoros, C.S. Irisin in response to exercise in humans with and without metabolic syndrome. J. Clin. Endocrinol. Metab. 2015, 100, 453–457. [Google Scholar] [CrossRef] [PubMed]
- Pal, M.; Febbraio, M.A.; Whitham, M. From cytokine to myokine: The emerging role of interleukin-6 in metabolic regulation. Immunol. Cell Biol. 2014, 92, 331–339. [Google Scholar] [CrossRef]
- Werida, R.H.; El-Gharbawy, N.M.; Mostafa, T.M. Circulating IL-6, clusterin and irisin in obese subjects with differentgrades of obesity: Association with insulin resistance and sexual dimorphism. Arch. Endocrinol. Metab. 2021, 65, 126–136. [Google Scholar] [CrossRef]
- Nash, D.; Hughes, M.G.; Butcher, L.; Aicheler, R.; Smith, P.; Cullen, T.; Webb, R. IL-6 signaling in acute exercise and chronic training: Potential consequences for health and athletic performance. Scand. J. Med. Sci. Sports 2022, 33, 4–19. [Google Scholar] [CrossRef]
- Fischer, C.P. Interleukin-6 in acute exercise and training: What is the biological relevance? Exerc. Immunol. Rev. 2006, 12, 6–33. [Google Scholar] [PubMed]
- Gonzalez-Gil, A.M.; Elizondo-Montemayor, L. The Role of Exercise in the Interplay between Myokines, Hepatokines, Osteokines, Adipokines, and Modulation of Inflammation for Energy Substrate Redistribution and Fat Mass Loss: A Review. Nutrients 2020, 12, 1899. [Google Scholar] [CrossRef] [PubMed]
- Turcotte, L.P.; Fisher, J.S. Skeletal muscle insulin resistance: Roles of fatty acid metabolism and exercise. Phys. Ther. 2008, 88, 1279–1296. [Google Scholar] [CrossRef] [PubMed] [Green Version]
- Gleeson, M.; Bishop, N.C.; Stensel, D.J.; Lindley, M.R.; Mastana, S.S.; Nimmo, M.A. The anti-inflammatory effects of exercise: Mechanisms and implications for the prevention and treatment of disease. Nat. Rev. Immunol. 2011, 11, 607–615. [Google Scholar] [CrossRef] [PubMed]
- Vincent, H.K.; Raiser, S.N.; Vincent, K.R. The aging musculoskeletal system and obesity-related considerations with exercise. Ageing. Res. Rev. 2012, 11, 361–373. [Google Scholar] [CrossRef] [Green Version]
- Jurca, R.; Lamonte, M.J.; Barlow, C.E.; Kampert, J.B.; Church, T.S.; Blair, S.N. Association of muscular strength with incidence of metabolic syndrome in men. Med. Sci. Sports Exerc. 2005, 37, 1849–1855. [Google Scholar] [CrossRef] [Green Version]
- Alberti, K.G.; Zimmet, P.; Shaw, J. Metabolic syndrome—A new world-wide definition. A Consensus Statement from the International Diabetes Federation. Diabet. Med. 2006, 23, 469–480. [Google Scholar] [CrossRef]
- Craig, C.L.; Marshall, A.J.; Sjöström, M.; Bauman, A.E.; Booth, M.L.; Ainsworth, B.E.; Pratt, M.; Ekelund, U.; Yngve, A.; Sallis, J.F.; et al. International Physical Activity Questionnaire: 12-country reliability and validity. Med. Sci. Sports Exerci. 2003, 35, 1381–1395. [Google Scholar] [CrossRef] [Green Version]
- Garber, C.E.; Blissmer, B.; Deschenes, M.R.; Franklin, B.A.; Lamonte, M.J.; Lee, I.M.; Nieman, D.C.; Swain, D.P.; American College of Sports Medicine; American College of Sports Medicine position stand. Quantity and quality of exercise for developing and maintaining cardiorespiratory, musculoskeletal, and neuromotor fitness in apparently healthy adults: Guidance for prescribing exercise. Med. Sci. Sports. Exerc. 2011, 43, 1334–1359. [Google Scholar] [CrossRef]
- Grgic, J.; Lazinica, B.; Schoenfeld, B.J.; Pedisic, Z. Test-Retest Reliability of the One-Repetition Maximum (1RM) Strength Assessment: A Systematic Review. Sports Med. Open. 2020, 6, 31. [Google Scholar] [CrossRef]
- Ainsworth, B.E.; Haskell, W.L.; Herrmann, S.D.; Meckes, N.; Bassett, D.R., Jr.; Tudor-Locke, C.; Greer, J.L.; Vezina, J.; Whitt-Glover, M.C.; Leon, A.S. 2011 Compendium of Physical Activities: A second update of codes and MET values. Med. Sci. Sports Exerc. 2011, 43, 1575–1581. [Google Scholar] [CrossRef] [PubMed] [Green Version]
- Levinger, I.; Goodman, C.; Hare, D.L.; Jerums, G.; Toia, D.; Selig, S. The reliability of the 1RM strength test for untrained middle-aged individuals. J. Sci. Med. Sport. 2009, 12, 310–316. [Google Scholar] [CrossRef]
- Fritz, C.O.; Morris, P.E.; Richler, J.J. Effect size estimates: Current use, calculations, and interpretation. J. Exp. Psychol. Gen. 2012, 141, 2–18. [Google Scholar] [CrossRef] [PubMed] [Green Version]
- Steensberg, A.; van Hall, G.; Osada, T.; Sacchetti, M.; Saltin, B.; Klarlund Pedersen, B. Production of interleukin-6 in contracting human skeletal muscles can account for the exercise-induced increase in plasma interleukin-6. J. Physiol. 2000, 529, 237–242. [Google Scholar] [CrossRef]
- Wiecek, M.; Szymura, J.; Maciejczyk, M.; Kantorowicz, M.; Szygula, Z. Acute Anaerobic Exercise Affects the Secretion of Asprosin, Irisin, and Other Cytokines—A Comparison Between Sexes. Front. Physiol. 2018, 9, 1782. [Google Scholar] [CrossRef] [PubMed] [Green Version]
- Kraemer, R.; Shockett, P.; Webb, N.; Shah, U.; Castracane, V.A. Transient Elevated Irisin Blood Concentration in Response to Prolonged, Moderate Aerobic Exercise in Young Men and Women. Horm. Metab. Res. 2013, 46, 150–154. [Google Scholar] [CrossRef] [Green Version]
- Löffler, D.; Müller, U.; Scheuermann, K.; Friebe, D.; Gesing, J.; Bielitz, J.; Erbs, S.; Landgraf, K.; Wagner, I.V.; Kiess, W.; et al. Serum Irisin Levels Are Regulated by Acute Strenuous Exercise. J. Clin. Endocrinol. Metab. 2015, 100, 1289–1299. [Google Scholar] [CrossRef] [Green Version]
- Daskalopoulou, S.S.; Cooke, A.B.; Gomez, Y.H.; Mutter, A.F.; Filippaios, A.; Mesfum, E.T.; Mantzoros, C.S. Plasma irisin levels progressively increase in response to increasing exercise workloads in young, healthy, active subjects. Eur. J. Endocrinol. 2014, 171, 343–352. [Google Scholar] [CrossRef] [Green Version]
- Kazeminasab, F.; Sadeghi, E.; Afshari-Safavi, A. Comparative Impact of Various Exercises on Circulating Irisin in Healthy Subjects: A Systematic Review and Network Meta-Analysis. Oxidative Med. Cell. Longev. 2022, 22, 8235809. [Google Scholar] [CrossRef]
- Cosio, P.L.; Crespo-Posadas, M.; Velarde-Sotres, Á.; Pelaez, M. Effect of Chronic Resistance Training on Circulating Irisin: Systematic Review and Meta-Analysis of Randomized Controlled Trials. Int. J. Environ. Res. Public Health. 2021, 18, 2476. [Google Scholar] [CrossRef]
- Qiu, S.; Cai, X.; Sun, Z.; Schumann, U.; Zügel, M.; Steinacker, J.M. Chronic Exercise Training and Circulating Irisin in Adults: A Meta-Analysis. Sports Med. 2015, 45, 1577–1588. [Google Scholar] [CrossRef] [PubMed]
- Rodrigues, A.C.; Ferreira, E.F.; Carneiro-Júnior, M.A.; Natalia, A.J.; Bressanc, J. Effects of exercise on the circulating concentrations of irisin in healthy adult individuals: A review. Sci. Sports 2016, 31, 251–260. [Google Scholar] [CrossRef]
- Rodriguez, A.; Becerril, S.; Ezquerro, S.; Mendez-Gimenez, L.; Fruhbeck, G. Crosstalk between adipokines and myokines in fat browning. Acta Physiol. 2017, 219, 362–381. [Google Scholar] [CrossRef] [PubMed]
- Moreno-Navarrete, J.M.; Ortega, F.; Serrano, M.; Guerra, E.; Pardo, G.; Tinahones, F.; Ricart, W.; Fernández-Real, J.M. Irisin is expressed and produced by human muscle and adipose tissue in association with obesity and insulin resistance. J. Clin. Endocrinol. Metab. 2013, 98, 769–778. [Google Scholar] [CrossRef]
- Perakakis, N.; Triantafyllou, G.A.; Fernández-Real, J.M.; Huh, J.Y.; Park, K.H.; Seufert, J.; Mantzoros, C.S. Physiology and role of irisin in glucose homeostasis. Nat. Rev. Endocrinol. 2017, 13, 324–337. [Google Scholar] [CrossRef] [Green Version]
- Norheim, F.; Langleite, T.M.; Hjorth, M.; Holen, T.; Kielland, A.; Stadheim, H.K.; Gulseth, H.L.; Birkeland, K.I.; Jensen, J.; Drevon, C.A. The effects of acute and chronic exercise on PGC-1α, irisin and browning of subcutaneous adipose tissue in humans. FEBS J. 2014, 281, 739–749. [Google Scholar] [CrossRef]
- Mai, S.; Grugni, G.; Mele, C.; Vietti, R.; Vigna, L.; Sartorio, A.; Aimaretti, G.; Scacchi, M.; Marzullo, P. Irisin levels in genetic and essential obesity: Clues for a potential dual role. Sci. Rep. 2020, 10, 1020. [Google Scholar] [CrossRef] [Green Version]
- Stengel, A.; Hofmann, T.; Goebel-Stengel, M.; Elbelt, U.; Kobelt, P.; Klapp, B.F. Circulating levels of irisin in patients with anorexia nervosa and different stages of obesity-correlation with body mass index. Peptides 2013, 39, 125–130. [Google Scholar] [CrossRef]
- Hebebrand, J.; Holm, J.C.; Woodward, E.; Baker, J.L.; Blaak, E.; Durrer Schutz, D.; Farpour-Lambert, N.J.; Frühbeck, G.; Halford, J.G.C.; Lissner, L.; et al. A Proposal of the European Association for the Study of Obesity to Improve the ICD-11 Diagnostic Criteria for Obesity Based on the Three Dimensions Etiology, Degree of Adiposity and Health Risk. Obes. Facts 2017, 10, 284–307. [Google Scholar] [CrossRef]
- Hotamisligil, G.S. Inflammation and metabolic disorders. Nature 2006, 444, 860–867. [Google Scholar] [CrossRef]
- Scheja, L.; Heeren, J. The endocrine function of adipose tissues in health and cardiometabolic disease. Nat. Rev. Endocrinol. 2019, 15, 507–524. [Google Scholar] [CrossRef] [PubMed]
- Raschke, S.; Eckel, J. Adipo-myokines: Two sides of the same coin-mediators of inflammation and mediators of exercise. Mediat. Inflamm. 2013, 2013, 320724. [Google Scholar] [CrossRef] [PubMed] [Green Version]
- Park, S.E.; Park, C.Y.; Sweeney, G. Biomarkers of insulin sensitivity and insulin resistance: Past, present and future. Crit. Rev. Clin. Lab. Sci. 2015, 52, 180–190. [Google Scholar] [CrossRef] [PubMed]
- Mazur-Bialy, A.I.; Pochec, E.; Zarawski, M. Anti-Inflammatory Properties of Irisin, Mediator of Physical Activity, Are Connected with TLR4/MyD88 Signaling Pathway Activation. Int. J. Mol. Sci. 2017, 18, 701. [Google Scholar] [CrossRef] [PubMed] [Green Version]
- Choi, Y.K.; Kim, M.K.; Bae, K.H.; Seo, H.A.; Jeong, J.Y.; Lee, W.K.; Kim, J.G.; Lee, I.K.; Park, K.G. Serum irisin levels in new-onset type 2 diabetes. Diabetes Res. Clin. Pract. 2013, 100, 96–101. [Google Scholar] [CrossRef] [PubMed]
- Orava, J.; Nuutila, P.E.; Lidell, M.; Oikonen, V.; Noponen, T.; Viljanen, T.; Scheinin, M.; Taittonen, M.; Niemi, T.; Enerbäck, S.A.; et al. Different metabolic responses of human brown adipose tissue to activation by cold and insulin. Cell Metab. 2011, 14, 272–279. [Google Scholar] [CrossRef] [PubMed] [Green Version]
- Huh, J.Y.; Dincer, F.; Mesfum, E.; Mantzoros, C.S. Irisin stimulates muscle growth-related genes and regulates adipocyte differentiation and metabolism in humans. Int. J. Obes. 2014, 38, 1538–1544. [Google Scholar] [CrossRef] [PubMed]
- Huh, J.Y.; Mougios, V.; Kabasakalis, A.; Fatouros, I.; Siopi, A.; Douroudos, I.; Filippaios, A.; Panagiotou, G.; Park, K.H.; Mantzoros, C.S. Exercise-induced irisin secretion is independent of age or fitness level and increased irisin may directly modulate muscle metabolism through AMPK activation. J. Clin. Endocrinol. Metab. 2014, 99, E2154–E2161. [Google Scholar] [CrossRef] [Green Version]
- Huh, J.Y.; Panagiotou, G.; Mougios, V.; Brinkoetter, M.; Vamvini, M.T.; Schneider, B.E.; Mantzoros, C.S. FNDC5 and irisin in humans: I. Predictors of circulating concentrations in serum and plasma and II mRNA expression and circulating concentrations in response to weight loss and exercise. Metabolism 2012, 61, 1725–1738. [Google Scholar] [CrossRef] [Green Version]
- Kurdiova, T.; Balaz, M.; Vician, M.; Maderova, D.; Vlcek, M.; Valkovic, L.; Srbecky, M.; Imrich, R.; Kyselovicova, O.; Belan, V.; et al. Effects of obesity, diabetes and exercise on Fndc5 gene expression and irisin release in human skeletal muscle and adipose tissue: In vivo and in vitro studies. J. Physiol. 2014, 592, 1091–1107. [Google Scholar] [CrossRef]
- Smirmaul, B.P.; Bertucci, D.R.; Teixeira, I.P. Is the VO2max that we measure really maximal? Front. Physiol. 2013, 5, 4–203. [Google Scholar] [CrossRef] [PubMed]


| Time of Observation | Barbell Bench Press | Lat Pull Down | Dumbbell Squat | Total Load of 3 Exercises |
|---|---|---|---|---|
| After 6 weeks of intervention | 15.32 | 11.76 | 16.77 | 15.50 |
| After 12 weeks of intervention | 23.84 | 23.02 | 25.41 | 24.35 |
| After 16 weeks, follow-up period | 26.92 | 25.70 | 26.30 | 26.50 |
| p-Value | 0.00 | 0.00 | 0.00 | 0.00 |
| Index | Group | p-Value | ||
|---|---|---|---|---|
| EG1 | EG2 | CG | ||
| Age [years] | 34.21 ± 6.06 | 37.37 ± 7.08 | 38.26 ± 7.43 | 0.20 |
| MetS criterion acc. to IDF | 3.07 ± 0.83 | 3.25 ± 0.86 | 3.47 ± 0.74 | 0.30 |
| BMI [kg/m2] | 34.57 ± 4.58 | 33.14 ± 4.32 | 33.20 ± 4.31 | 0.62 |
| WC [cm] | 114.7 ± 10.93 | 114.8 ± 11.64 | 115.3 ± 10.54 | 0.93 |
| Gr. | Week 1 Baseline | Week 6 Intervention | Week 12 Intervention | Week 16 Follow-Up | p-Value | ||||||||
|---|---|---|---|---|---|---|---|---|---|---|---|---|---|
| Me | Q1; Q3 | Me | Q1; Q3 | Me | Q1; Q3 | Me | Q1; Q3 | F. T. (E.S.) | d 6-1 (E.S.) | d 12-1 (E.S.) | d 16-1 (E.S.) | ||
| Energy expenditure [kcal/ week] | EG1 | 3813.7 | 3329.3; 4714.2 | 5697.3 | 4777.5; 6217.7 | 5593.5 | 4495.1; 6249.7 | 4757.5 | 4486.6; 6720.4 | 0.00 (0.70) | 0.00 (0.88) | 0.00 (0.88) | 0.00 (0.83) |
| EG2 | 3746.5 | 3412.3; 4465.5 | 5058.9 | 4419.3; 5903.6 | 5252.7 | 4249.9; 5632.8 | 5520.2 | 4609.0; 5648.4 | 0.00 (0.42) | 0.00 (0.86) | 0.00 (0.86) | 0.03 (0.64) | |
| CG | 4465.1 | 2978.1; 5811.5 | 3955.1 | 2760.3; 5497.6 | 4605.2 | 3425.4; 5481.4 | 4682.8 | 3473.8; 6137.9 | 0.73 (0.03) | 1.00 (0.00) | 0.68 (0.13) | 0.27 (0.34) | |
| T.K. | 0.90 | 0.03 | 0.13 | 0.60 | |||||||||
| Energy value of diet [kcal/day] | EG1 | 2761.5 | 2085.8; 3107.0 | 2445.5 | 2222.5; 3032.3 | 2708.5 | 2327.0; 3336.0 | 3134.0 | 2415.5; 3447.5 | 0.00 (0.32) | 0.53 (0.17) | 0.22 (0.34) | 0.01 (0.66) |
| EG2 | 2669.5 | 2325.5; 2786.0 | 2680.5 | 2531.8; 2996.8 | 2685.5 | 2612.3; 3127.0 | 2900.5 | 2671.0; 3251.3 | 0.00 (0.35) | 0.03 (0.63) | 0.01 (0.83) | 0.00 (0.86) | |
| CG | 2689.0 | 2411.5; 2975.5 | 2782.0 | 2653.8; 3055.0 | 2803.5 | 2683.8; 3138.3 | 3112.0 | 2855.0; 3274.0 | 0.35 (0.07) | 0.27 (0.34) | 0.43 (0.24) | 0.04 (0.59) | |
| T.K. | 0.81 | 0.50 | 0.77 | 0.95 | |||||||||
| Gr. | Week 1 Baseline | Week 6 Intervention | Week 12 Intervention | Week 16 Follow-Up | p-Value | ||||||||
|---|---|---|---|---|---|---|---|---|---|---|---|---|---|
| Me | Q1; Q3 | Me | Q1; Q3 | Me | Q1; Q3 | Me | Q1; Q3 | T.F. (E.S.) | d 6-1 (E.S.) | d 12-1 (E.S.) | d 16-1 (E.S.) | ||
| FFM [kg] | EG1 | 70.30 | 67.06; 74.83 | 70.86 | 66.40; 73.15 | 69.80 | 66.01; 73.33 | 70.06 | 66.79; 75.20 | 0.72 (0.03) | 0.24 (0.34) | 0.69 (0.13) | 0.79 (0.09) |
| EG2 | 67.75 | 60.39; 73.22 | 71.82 | 65.25; 76.00 | 69.66 | 63.49; 73.71 | 67.66 | 64.61; 74.27 | 0.00 (0.30) | 0.00 (0.89) | 0.00 (0.77) | 0.00 (0.89) | |
| CG | 67.78 | 62.69;76.68 | 68.35 | 62.63; 77.42 | 71.25 | 63.45; 77.44 | 72.36 | 65.49; 76.25 | 0.77 (0.02) | 0.74 (0.14) | 0.57 (0.22) | 0.91 (0.06) | |
| T.K. | 0.46 | 0.81 | 0.86 | 0.79 | |||||||||
| BF [%] | EG1 | 37.40 | 35.67; 40.25 | 37.25 | 35.07; 39.38 | 38.10 | 33.80; 39.90 | 36.95 | 33.18; 40.25 | 0.05 (0.18) | 0.05 (0.55) | 0.03 (0.61) | 0.02 (0.60) |
| EG2 | 36.40 | 34.05; 39.7 | 35.80 | 33.80; 38.47 | 35.00 | 33.40; 37.80 | 33.90 | 33.15; 37.15 | 0.01 (0.27) | 0.01 (0.76) | 0.01 (0.79) | 0.00 (0.86) | |
| CG | 36.95 | 34.82; 40.73 | 37.20 | 34.53; 42.10 | 37.55 | 35.42; 42.12 | 38.55 | 36.53; 41.85 | 0.15 (0.11) | 0.16 (0.49) | 0.19 (0.46) | 0.25 (0.42) | |
| T.K. | 0.87 | 0.60 | 0.38 | 0.26 | |||||||||
| Gr. | Week 1 Baseline | Week 6 Intervention | Week 12 Intervention | Week 16 Follow-Up | p-Value | ||||||||
|---|---|---|---|---|---|---|---|---|---|---|---|---|---|
| Me | Q1; Q3 | Me | Q1; Q3 | Me | Q1; Q3 | Me | Q1; Q3 | T.F. (E.S.) | d 6-1 (E.S.) | d 12-1 (E.S.) | d 16-1 (E.S.) | ||
| INS [μIU/mL] | EG1 | 14.65 | 10.50; 21.70 | 10.45 | 7.60; 16.48 | 15.05 | 8.52; 24.3 | 12.35 | 8.68; 18.02 | 0.36 (0.08) | 0.23 (0.40) | 0.38 (0.31) | 0.13 (0.50) |
| EG2 | 16.25 | 11.20; 22.12 | 18.75 | 13.32; 22.18 | 12.00 | 8.20; 14.9 | 10.75 | 7.66; 12.95 | 0.03 (0.19) | 0.08 (0.56) | 0.41 (0.29) | 0.03 (0.69) | |
| CG | 20.60 | 11.15; 22.90 | 18.70 | 13.62; 27.25 | 20.30 | 13.40; 28.4 | 16.80 | 11.80; 28.40 | 0.12 (0.12) | 0.34 (0.34) | 0.25 (0.42) | 0.91 (0.06) | |
| T.K. | 0.77 | 0.06 | 0.06 | 0.13 | |||||||||
| GL [mmol/L] | EG1 | 5.16 | 4.75; 5.61 | 4.96 | 4.77; 5.16 | 4.84 | 4.70; 5.03 | 4.78 | 4.64; 5.07 | 0.12 (0.14) | 0.11 (0.39) | 0.17 (0.38) | 0.02 (0.66) |
| EG2 | 5.13 | 4.94; 5.30 | 5.26 | 5.17; 5.42 | 5.06 | 4.86; 5.27 | 5.00 | 4.75; 5.20 | 0.12 (0.12) | 0.17 (0.45) | 0.73 (0.16) | 0.24 (0.42) | |
| CG | 5.31 | 4.99; 5.48 | 5.18 | 5.00; 5.41 | 4.96 | 4.84; 5.65 | 5.14 | 4.79; 5.38 | 0.23 (0.09) | 0.52 (0.20) | 0.20 (0.39) | 0.05 (0.57) | |
| T.K. | 0.38 | 0.08 | 0.18 | 0.28 | |||||||||
| Gr. | Week 1 Baseline | Week 6 Intervention | Week 12 Intervention | Week 16 Follow-Up | p-Value | ||||||||
|---|---|---|---|---|---|---|---|---|---|---|---|---|---|
| Me | Q1; Q3 | Me | Q1; Q3 | Me | Q1; Q3 | Me | Q1; Q3 | T.F. (E.S.) | d 6-1 (E.S.) | d 12-1 (E.S.) | d 16-1 (E.S.) | ||
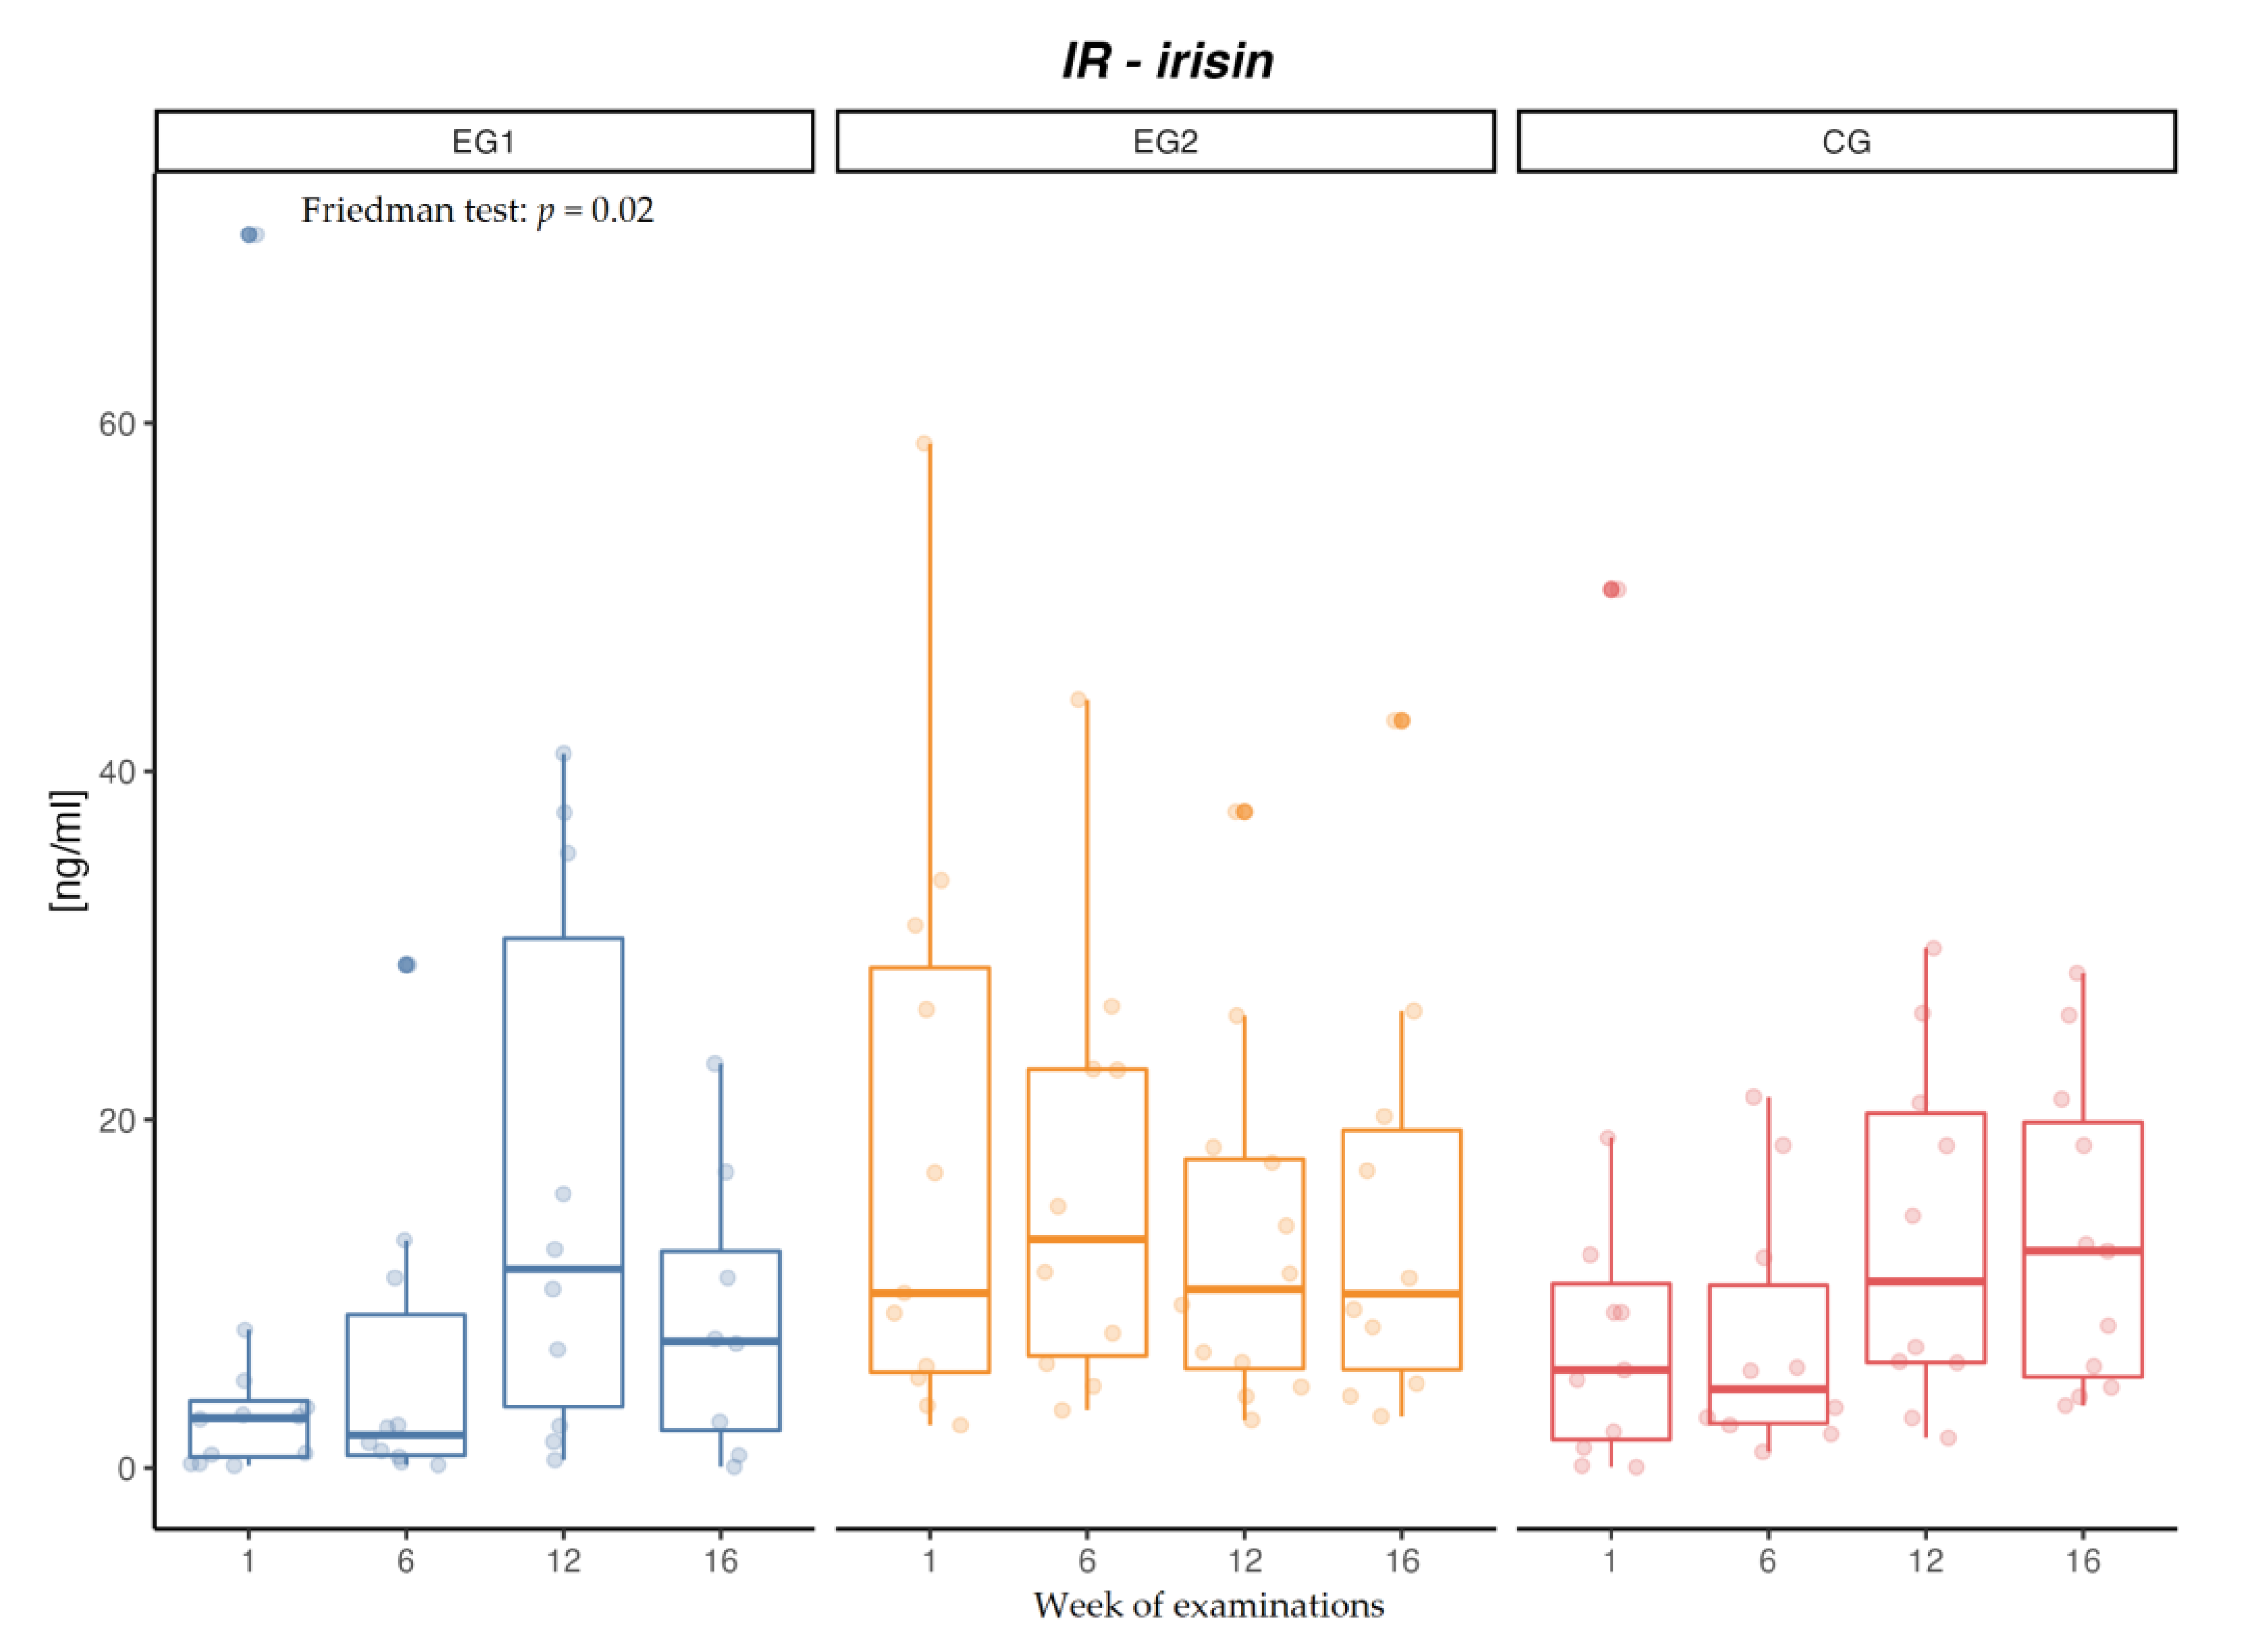
| IR [ng/mL] | EG1 | 3.05 | 2.80; 5.01 | 2.40 | 1.34; 11.46 | 12.56 | 6.80; 35.31 | 7.41 | 4.89; 13.95 | 0.02 (0.24) | 0.06 (0.91) | 0.81 (0.18) | 0.06 (0.91) |
| EG2 | 10.05 | 5.50; 28.74 | 13.14 | 6.43; 22.90 | 10.27 | 5.71; 17.75 | 10.00 | 5.66; 19.41 | 0.69 (0.03) | 0.16 (0.58) | 0.94 (0.06) | 0.58 (0.26) | |
| CG | 8.93 | 5.07; 12.24 | 4.53 | 2.57; 10.50 | 10.71 | 6.06; 20.35 | 12.46 | 5.23; 19.85 | 0.05 (0.20) | 0.58 (0.26) | 0.58 (0.26) | 0.30 (0.48) | |
| T.K. | 0.07 | 0.14 | 0.99 | 0.36 | |||||||||
| IL-6 [pg/mL] | EG1 | 17.56 | 12.59; 22.44 | 18.98 | 16.16; 24.95 | 15.99 | 14.58; 18.23 | 14.38 | 7.94; 15.59 | 0.01 (0.29) | 0.21 (0.40) | 0.58 (0.19) | 0.10 (0.51) |
| EG2 | 11.79 | 4.65; 16.40 | 8.10 | 2.80; 12.07 | 5.03 | 3.10; 9.22 | 3.10 | 1.08; 5.17 | 0.00 (0.32) | 0.03 (0.71) | 0.01 (0.85) | 0.01 (0.85) | |
| CG | 15.19 | 10.46; 15.99 | 14.70 | 12.97; 15.99 | 15.99 | 15.39; 17.41 | 14.38 | 5.17; 18.43 | 0.23 (0.09) | 0.10 (0.51) | 0.07 (0.51) | 0.97 (0.02) | |
| T.K. | 0.08 | 0.00 | 0.00 | 0.01 | |||||||||
| IR EG1 [ng/mL] | IR EG2 [ng/mL] | IR CG [ng/mL] | IL-6 EG1 [pg/mL] | IL-6 EG2 [pg/mL] | IL-6 CG [pg/mL] | |
|---|---|---|---|---|---|---|
| Energy value of diet [kcal] | 0.23 | 0.27 * | 0.08 | −0.05 | −0.07 | 0.06 |
| Energy expenditure [kcal/week] | 0.27 * | 0.05 | 0.06 | 0.35 * | −0.35 * | −0.10 |
| BF [%] | −0.19 | −0.11 | −0.30 * | 0.19 | 0.38 * | 0.05 |
| FFM [kg] | 0.35 * | −0.05 | −0.06 | 0.44 * | −0.18 | 0.22 |
| IR [ng/mL] | 1.00 | 1.00 | 1.00 | 0.16 | −0.31 * | 0.10 |
| IL-6 [pg/mL] | 0.16 | −0.31 * | 0.10 | 1.00 | 1.00 | 1.00 |
| GL [mmol/L] | 0.44 * | −0.14 | −0.36 * | 0.31 * | 0.06 | −0.12 |
| INS [µIU/mL] | 0.37 * | −0.09 | −0.42 * | 0.36 * | 0.22 | −0.04 |
| Dependent Variable | Parameter Assessment | Standard Error | t Value | p-Value |
|---|---|---|---|---|
| Free parameter | 11.83 | 10.34 | 1.14 | 0.25 |
| BF [%] | −0.72 | 0.21 | −3.45 | 0.00 |
| FFM [kg] | 0.43 | 0.12 | 3.48 | 0.00 |
| Dummy: EG2 | −6.40 | 3.08 | −2.08 | 0.04 |
| Dummy: CG | −3.62 | 2.55 | −1.42 | 0.16 |
| Dependent Variable | Parameter Assessment | Standard Error | t Value | p-Value |
|---|---|---|---|---|
| Free parameter | −15.26 | 7.33 | −2.08 | 0.04 |
| BF [%] | 0.25 | 0.11 | 2.23 | 0.03 |
| FFM [kg] | 0.19 | 0.09 | 2.06 | 0.04 |
| Dummy: EG2 | 9.90 | 1.52 | 6.51 | 0.00 |
| Dummy: CG | 6.63 | 1.27 | 5.21 | 0.00 |
Disclaimer/Publisher’s Note: The statements, opinions and data contained in all publications are solely those of the individual author(s) and contributor(s) and not of MDPI and/or the editor(s). MDPI and/or the editor(s) disclaim responsibility for any injury to people or property resulting from any ideas, methods, instructions or products referred to in the content. |
© 2023 by the authors. Licensee MDPI, Basel, Switzerland. This article is an open access article distributed under the terms and conditions of the Creative Commons Attribution (CC BY) license (https://creativecommons.org/licenses/by/4.0/).
Share and Cite
Makiel, K.; Suder, A.; Targosz, A.; Maciejczyk, M.; Haim, A. Effect of Exercise Interventions on Irisin and Interleukin-6 Concentrations and Indicators of Carbohydrate Metabolism in Males with Metabolic Syndrome. J. Clin. Med. 2023, 12, 369. https://doi.org/10.3390/jcm12010369
Makiel K, Suder A, Targosz A, Maciejczyk M, Haim A. Effect of Exercise Interventions on Irisin and Interleukin-6 Concentrations and Indicators of Carbohydrate Metabolism in Males with Metabolic Syndrome. Journal of Clinical Medicine. 2023; 12(1):369. https://doi.org/10.3390/jcm12010369
Chicago/Turabian StyleMakiel, Karol, Agnieszka Suder, Aneta Targosz, Marcin Maciejczyk, and Alon Haim. 2023. "Effect of Exercise Interventions on Irisin and Interleukin-6 Concentrations and Indicators of Carbohydrate Metabolism in Males with Metabolic Syndrome" Journal of Clinical Medicine 12, no. 1: 369. https://doi.org/10.3390/jcm12010369