
Relationship between Residual Urine Output and Type of Dialysis with FGF23 Levels
 , , , ,
Abstract
:1. Introduction
2. Materials and Methods
2.1. Study Population
- Inclusion criteria
- Exclusion criteria
2.2. Data Collection and Measurements
2.3. Statistical Analysis
3. Results
4. Discussion
Limitations
- (1)
- The cohort was obtained from a current study. Therefore, our studied population was not specifically chosen ad hoc; despite this, we defend the quality of the data obtained as they allowed us to confirm the data from the literature and provided us with points of reflection even for new investigations. What could be especially interesting is obtaining more data about the UO collection;
- (2)
- The two groups (patients in HD and patients in PD) were different in number and characteristics;
- (3)
- We only used single urinary output data and a single biohumoral examination data point;
- (4)
- The compliance with the phosphorus binding therapy and a low phosphorus diet was unknown.
5. Conclusions
Author Contributions
Funding
Institutional Review Board Statement
Informed Consent Statement
Data Availability Statement
Acknowledgments
Conflicts of Interest
References
- KDIGO 2017 Clinical Practice Guideline Update for the Diagnosis, Evaluation, Prevention, and Treatment of Chronic Kidney Disease-Mineral and Bone Disorder (CKD-MBD). Kidney Int. Suppl. 2017, 7, 1–59. [CrossRef] [PubMed] [Green Version]
- Prie, D.; Urena Torres, P.; Friedlander, G. Latest findings in phosphate homeostasis. Kidney Int. 2009, 75, 882–889. [Google Scholar] [CrossRef] [PubMed] [Green Version]
- Saito, H.; Maeda, A.; Ohtomo, S.; Hirata, M.; Kusano, K.; Kato, S.; Ogata, E.; Segawa, H.; Miyamoto, K.; Fukushima, N. Circulating FGF-23 is regulated by 1alpha, 25-dihydroxyvitamin D3 and phosphorus in vivo. J. Biol. Chem. 2005, 280, 2543–2549. [Google Scholar] [CrossRef] [PubMed] [Green Version]
- Ferrari, S.L.; Bonjour, J.P.; Rizzoli, R. Fibroblast growth factor-23 relationship to dietary phosphate and renal phosphate handling in healthy young men. J. Clin. Endocrinol. Metab. 2005, 90, 1519–1524. [Google Scholar] [CrossRef] [PubMed] [Green Version]
- Nishida, Y.; Taketani, Y.; Yamanaka-Okumura, H.; Imamura, F.; Taniguchi, A.; Sato, T.; Shuto, E.; Nashiki, K.; Arai, H.; Yamamoto, H.; et al. Acute effect of oral phosphate loading on serum fibroblast growth factor 23 levels in healthy men. Kidney Int. 2006, 70, 2141–2147. [Google Scholar] [CrossRef] [PubMed] [Green Version]
- Samadfam, R.; Richard, C.; Nguyen-Yamamoto, L.; Bolivar, I.; Goltzman, D. Bone formation regulates circulating concentrations of fibroblast growth factor 23. Endocrinology 2009, 150, 4835–4845. [Google Scholar] [CrossRef] [Green Version]
- Liu, S.; Tang, W.; Zhou, J.; Stubbs, J.R.; Luo, Q.; Pi, M.; Quarles, L.D. Fibroblast growth factor 23 is a counter-regulatory phosphaturic hormone for vitamin D. J. Am. Soc. Nephrol. 2006, 17, 1305–1315. [Google Scholar] [CrossRef] [Green Version]
- Gattineni, J.; Bates, C.; Twombley, K.; Dwarakanath, V.; Robinson, M.L.; Goetz, R.; Mohammadi, M.; Baum, M. FGF23 decreases renal NaPi-2a and NaPi-2c expression and induces hypophosphatemia in vivo predominantly via FGF receptor 1. Am. J. Physiol. Ren. Physiol. 2009, 297, F282–F291. [Google Scholar] [CrossRef] [Green Version]
- Evenepoel, P.; Meijers, B.; Viaene, L.; Bammens, B.; Claes, K.; Kuypers, D.; Vanderschueren, D.; Vanrenterghem, Y. Fibroblast growth factor-23 in early chronic kidney disease: Additional support in favor of a phosphate-centric paradigm for the pathogenesis of secondary hyperparathyroidism. Clin. J. Am. Soc. Nephrol. 2010, 5, 1268–1276. [Google Scholar] [CrossRef] [Green Version]
- Isakova, T.; Wahl, P.; Vargas, G.S.; Gutierrez, O.M.; Scialla, J.; Xie, H.; Appleby, D.; Nessel, L.; Bellovich, K.; Chen, J.; et al. Fibroblast growth factor 23 is elevated before parathyroid hormone and phosphate in chronic kidney disease. Kidney Int. 2011, 79, 1370–1378. [Google Scholar] [CrossRef]
- Leaf, D.E.; Wolf, M.; Waikar, S.S.; Chase, H.; Christov, M.; Cremers, S.; Stern, L. FGF-23 levels in patients with AKI and risk of adverse outcomes. Clin. J. Am. Soc. Nephrol. 2012, 7, 1217–1223. [Google Scholar] [CrossRef] [PubMed] [Green Version]
- Christov, M.; Waikar, S.S.; Pereira, R.C.; Havasi, A.; Leaf, D.E.; Goltzman, D.; Pajevic, P.D.; Wolf, M.; Juppner, H. Plasma FGF23 levels increase rapidly after acute kidney injury. Kidney Int. 2013, 84, 776–785. [Google Scholar] [CrossRef] [PubMed] [Green Version]
- Krishnasamy, R.; Tan, S.J.; Hawley, C.M.; Johnson, D.W.; Stanton, T.; Lee, K.; Mudge, D.W.; Campbell, S.; Elder, G.J.; Toussaint, N.D.; et al. Progression of arterial stiffness is associated with changes in bone mineral markers in advanced CKD. BMC Nephrol. 2017, 18, 281. [Google Scholar] [CrossRef] [PubMed] [Green Version]
- Unsal, A.; Kose Budak, S.; Koc, Y.; Basturk, T.; Sakaci, T.; Ahbap, E.; Sinangil, A. Relationship of fibroblast growth factor 23 with left ventricle mass index and coronary calcificaton in chronic renal disease. Kidney Blood Press. Res. 2012, 36, 55–64. [Google Scholar] [CrossRef]
- Sarmento-Dias, M.; Santos-Araujo, C.; Poinhos, R.; Oliveira, B.; Silva, I.S.; Silva, L.S.; Sousa, M.J.; Correia, F.; Pestana, M. Fibroblast growth factor 23 is associated with left ventricular hypertrophy, not with uremic vasculopathy in peritoneal dialysis patients. Clin. Nephrol. 2016, 85, 135–141. [Google Scholar] [CrossRef]
- Zoccali, C.; Yilmaz, M.I.; Mallamaci, F. FGF23: A mature renal and cardiovascular risk factor? Blood Purif. 2013, 36, 52–57. [Google Scholar] [CrossRef]
- Rroji, M.; Seferi, S.; Cafka, M.; Petrela, E.; Likaj, E.; Barbullushi, M.; Thereska, N.; Spasovski, G. Is residual renal function and better phosphate control in peritoneal dialysis an answer for the lower prevalence of valve calcification compared to hemodialysis patients? Int. Urol. Nephrol. 2014, 46, 175–182. [Google Scholar] [CrossRef]
- Wang, M.; You, L.; Li, H.; Lin, Y.; Zhang, Z.; Hao, C.; Chen, J. Association of circulating fibroblast growth factor-23 with renal phosphate excretion among hemodialysis patients with residual renal function. Clin. J. Am. Soc. Nephrol. 2013, 8, 116–125. [Google Scholar] [CrossRef] [Green Version]
- Viaene, L.; Bammens, B.; Meijers, B.K.; Vanrenterghem, Y.; Vanderschueren, D.; Evenepoel, P. Residual renal function is an independent determinant of serum FGF-23 levels in dialysis patients. Nephrol. Dial. Transplant. 2012, 27, 2017–2022. [Google Scholar] [CrossRef] [Green Version]
- Yamada, S.; Tsuruya, K.; Taniguchi, M.; Yoshida, H.; Tokumoto, M.; Hasegawa, S.; Tanaka, S.; Eriguchi, M.; Nakano, T.; Kitazono, T. Relationship between residual renal function and serum fibroblast growth factor 23 in patients on peritoneal dialysis. Ther. Apher. Dial. 2014, 18, 383–390. [Google Scholar] [CrossRef]
- Dong, J.; Wang, H.; Wang, M. Low prevalence of hyperphosphatemia independent of residual renal function in peritoneal dialysis patients. J. Ren. Nutr. 2007, 17, 389–396. [Google Scholar] [CrossRef] [PubMed]
- Evenepoel, P.; Meijers, B.K.; Bammens, B.; Viaene, L.; Claes, K.; Sprangers, B.; Naesens, M.; Hoekstra, T.; Schlieper, G.; Vanderschueren, D.; et al. Phosphorus metabolism in peritoneal dialysis- and haemodialysis-treated patients. Nephrol. Dial. Transplant. 2016, 31, 1508–1514. [Google Scholar] [CrossRef] [PubMed]
- Bi, S.; Liang, Y.; Cheng, L.; Wang, Y.; Wang, T.; Han, Q.; Zhang, A. Hemodialysis is associated with higher serum FGF23 level when compared with peritoneal dialysis. Int. Urol. Nephrol. 2017, 49, 1653–1659. [Google Scholar] [CrossRef] [PubMed]
- Shafi, T.; Jaar, B.G.; Plantinga, L.C.; Fink, N.E.; Sadler, J.H.; Parekh, R.S.; Powe, N.R.; Coresh, J. Association of residual urine output with mortality, quality of life, and inflammation in incident hemodialysis patients: The Choices for Healthy Outcomes in Caring for End-Stage Renal Disease (CHOICE) Study. Am. J. Kidney Dis. 2010, 56, 348–358. [Google Scholar] [CrossRef] [Green Version]
- Kalantar-Zadeh, K.; Ganz, T.; Trumbo, H.; Seid, M.H.; Goodnough, L.T.; Levine, M.A. Parenteral iron therapy and phosphorus homeostasis: A review. Am. J. Hematol. 2021, 96, 606–616. [Google Scholar] [CrossRef]
- Fouque, D.; Vennegoor, M.; Ter Wee, P.; Wanner, C.; Basci, A.; Canaud, B.; Haage, P.; Konner, K.; Kooman, J.; Martin-Malo, A.; et al. EBPG guideline on nutrition. Nephrol. Dial. Transplant. 2007, 22 (Suppl. S2), ii45–ii87. [Google Scholar] [CrossRef] [Green Version]
- Heaf, J.G. Chronic Kidney Disease-Mineral Bone Disorder in the Elderly Peritoneal Dialysis Patient. Perit. Dial. Int. 2015, 35, 640–644. [Google Scholar] [CrossRef]
- Rosner, M.H.; Reis, T.; Husain-Syed, F.; Vanholder, R.; Hutchison, C.; Stenvinkel, P.; Blankestijn, P.J.; Cozzolino, M.; Juillard, L.; Kashani, K.; et al. Classification of Uremic Toxins and Their Role in Kidney Failure. Clin. J. Am. Soc. Nephrol. 2021, 16, 1918–1928. [Google Scholar] [CrossRef]
- Lameire, N.; Vanholder, R.; De Smet, R. Uremic toxins and peritoneal dialysis. Kidney Int. 2001, 78, S292–S297. [Google Scholar] [CrossRef]


| Variable | Full Cohort (N = 133) | HD (N = 58) | PD (N = 75) | p Value |
|---|---|---|---|---|
| Age (years) | 66.0 (22.9–90.8) | 67.7 (33.6–90.8) | 64.8 (22.9–87.6) | 0.46 |
| Gender | 1.00 | |||
| Female sex (%) | 39 (29.3%) | 17 (29.3%) | 22 (29.3%) | |
| Male sex (%) | 94 (70.7%) | 41 (70.7%) | 53 (70.7%) | |
| Hypertension (%) | 124 (93.2%) | 54 (93.1%) | 70 (93.3%) | 1.00 |
| Diabetes (%) | 34 (25.6%) | 16 (27.6%) | 18 (24.0%) | 0.64 |
| Cause of CKD | 0.90 | |||
| Primary glomerular disease | 24 (18.0%) | 11 (19.0%) | 13 (17.3%) | |
| Genetic disease | 16 (12.0%) | 7 (12.1%) | 9 (12.0%) | |
| Secondary kidney disease | 73 (54.9%) | 30 (51.7%) | 43 (57.3%) | |
| Unknown | 20 (15.0%) | 10 (17.2%) | 10 (13.3%) | |
| Residual UO (%) | 93 (69.9%) | 27 (46.6%) | 66 (88.0%) | <0.0001 |
| Laboratory test | ||||
| Creatinine (mg/dL) | 9.1 (3.2–19.5) | 9.6 (3.8–18.6) | 8.8 (3.2–19.5) | 0.11 |
| Urea (mg/dL) | 129.3 ± 33.3 | 136.7 ± 36.1 | 123.6 ± 30.1 | 0.024 |
| Calcium (mg/dL) | 9.0 (7.6–12.8) | 9.0 (7.9–10.4) | 9.2 (7.6–12.8) | 0.11 |
| Phosphorus (mg/dL) | 4.8 (2.1–8.9) | 4.5 (2.1–8.9) | 5.0 (2.5–8.9) | 0.0041 |
| iPTH (pg/mL) | 99.0 (4.0–1010.0) | 167.0 (4.0–1010.0) | 80.0 (7.0–732.0) | 0.065 |
| 25-(OH) D3 (ng/mL) | 16.8 (5.0–71.9) | 21.7 (5.0–71.9) | 11.5 (5.0–29.8) | <0.0001 |
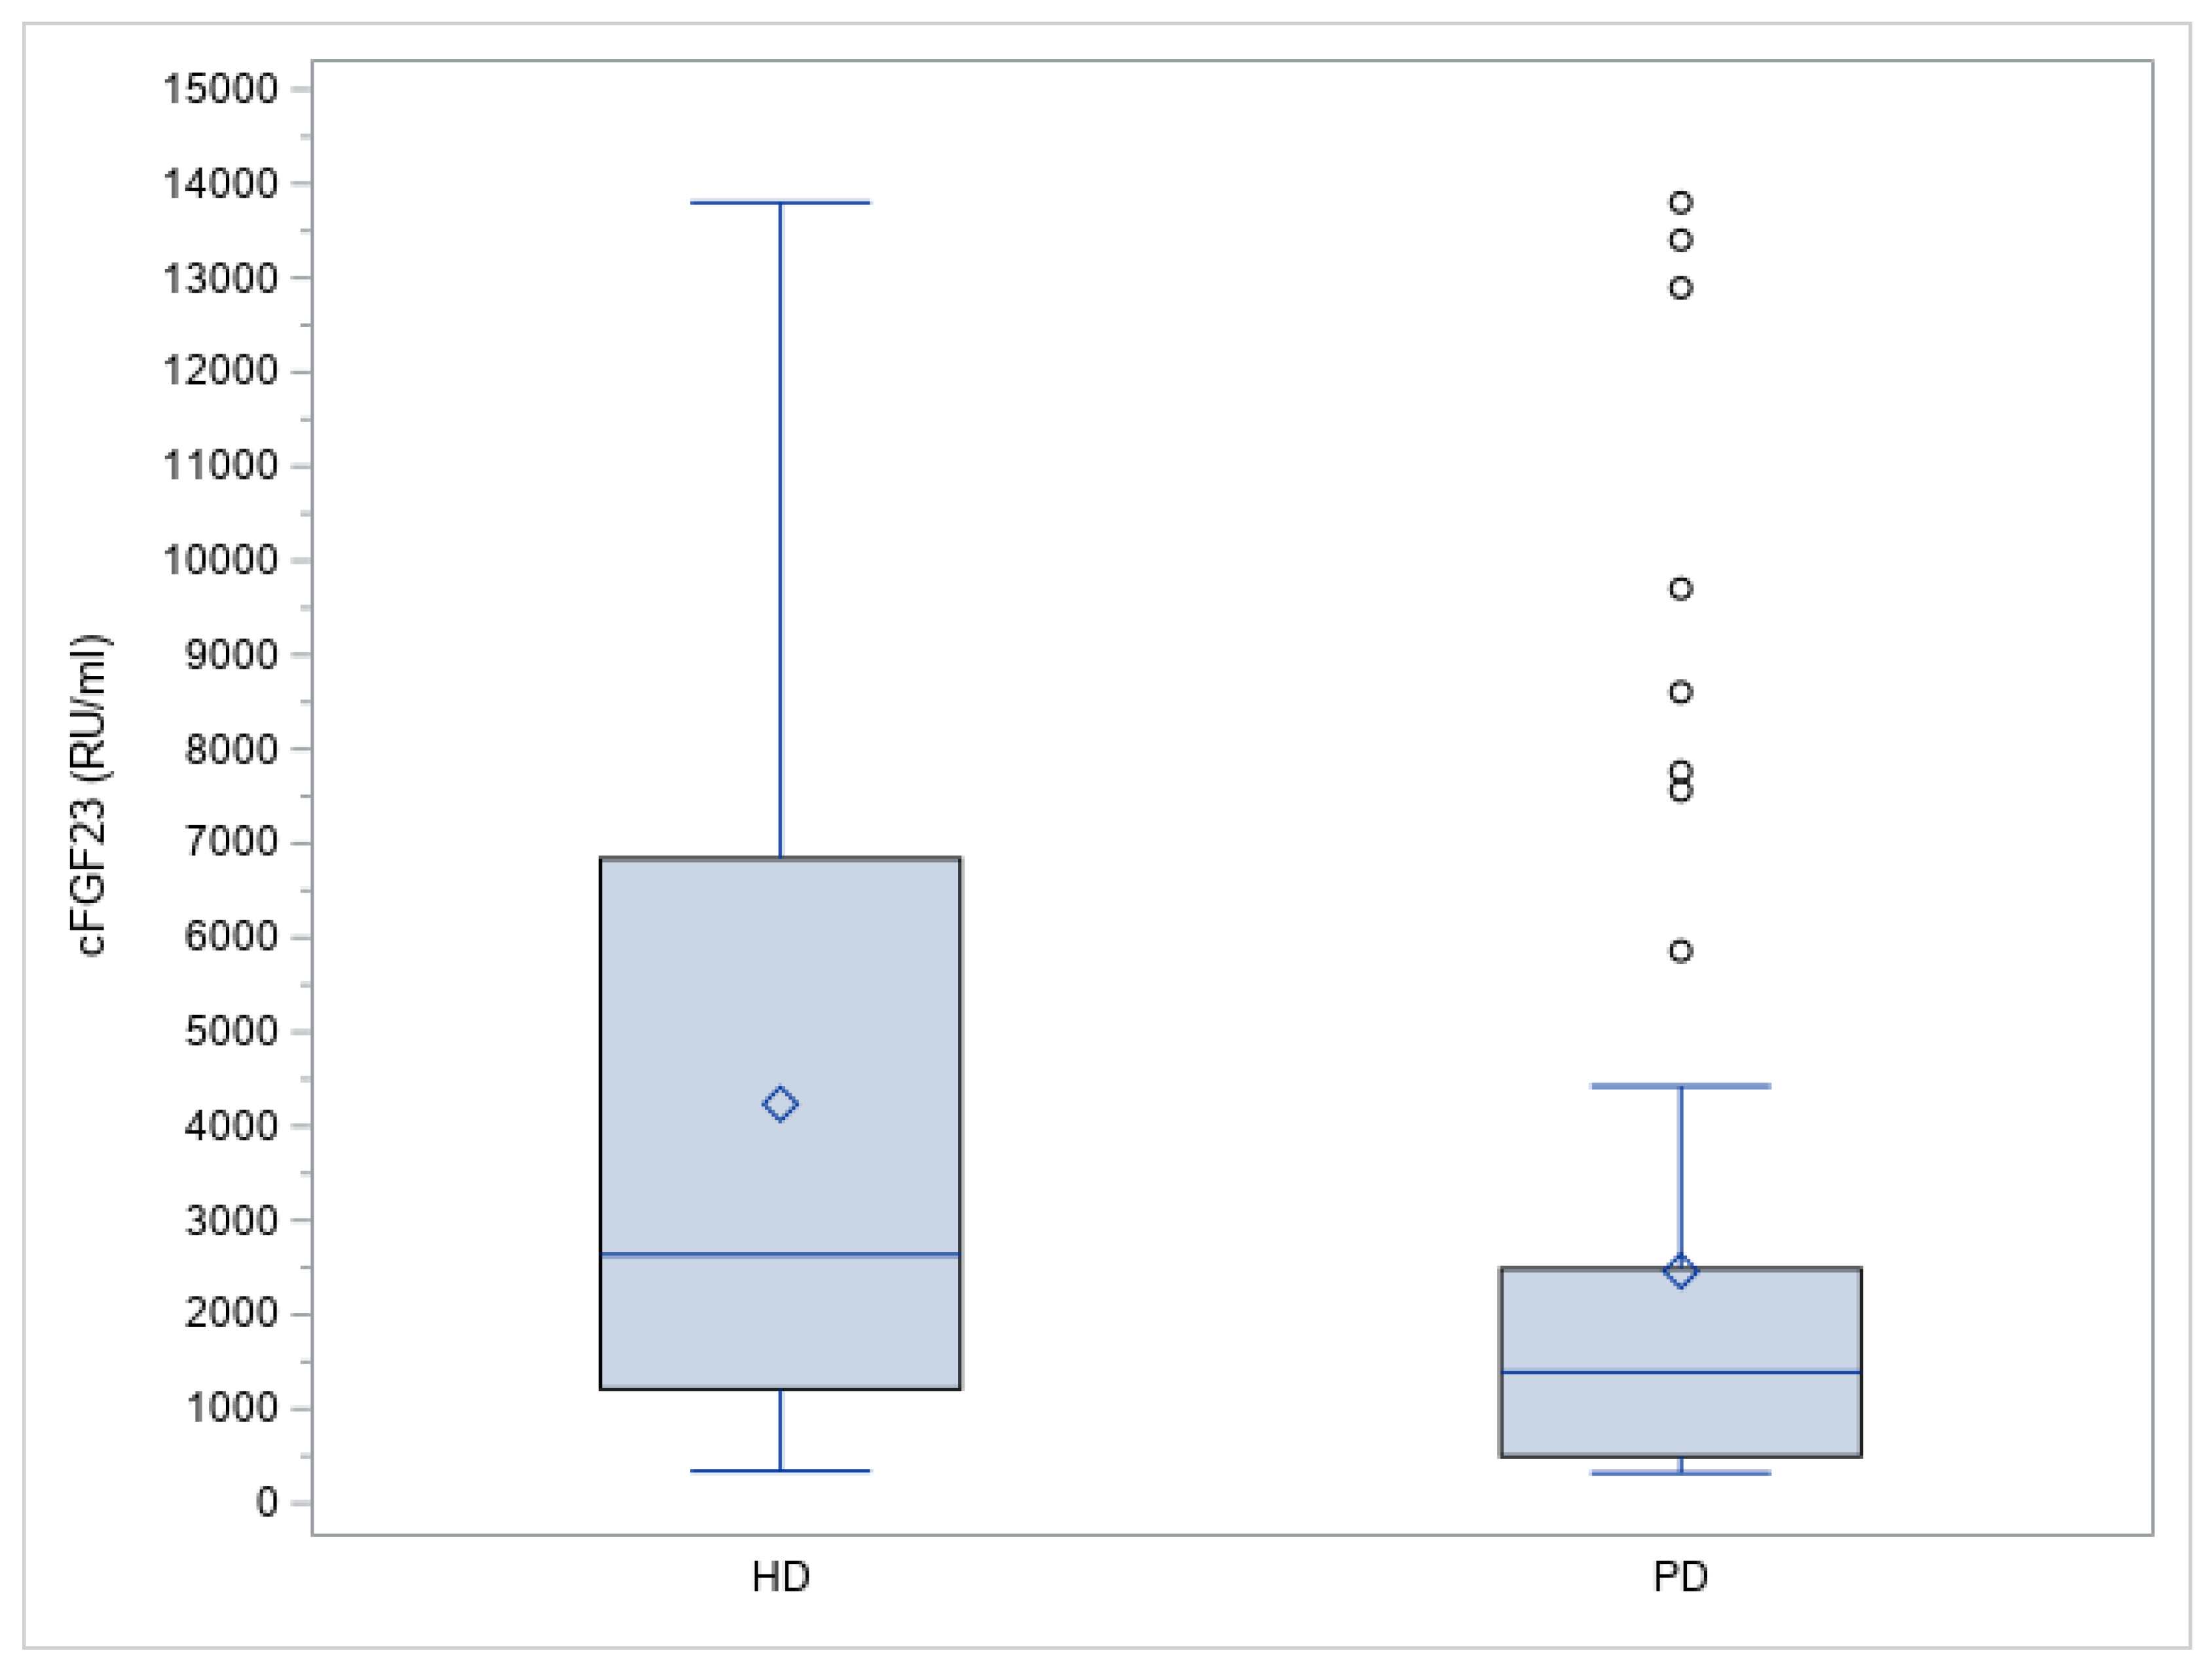
| cFGF23 (RU/mL) | 1493.1 (320.5–13,800.0) | 2634.9 (340.8–13,800.0) | 1391.7 (320.5–13,800.0) | 0.0017 |
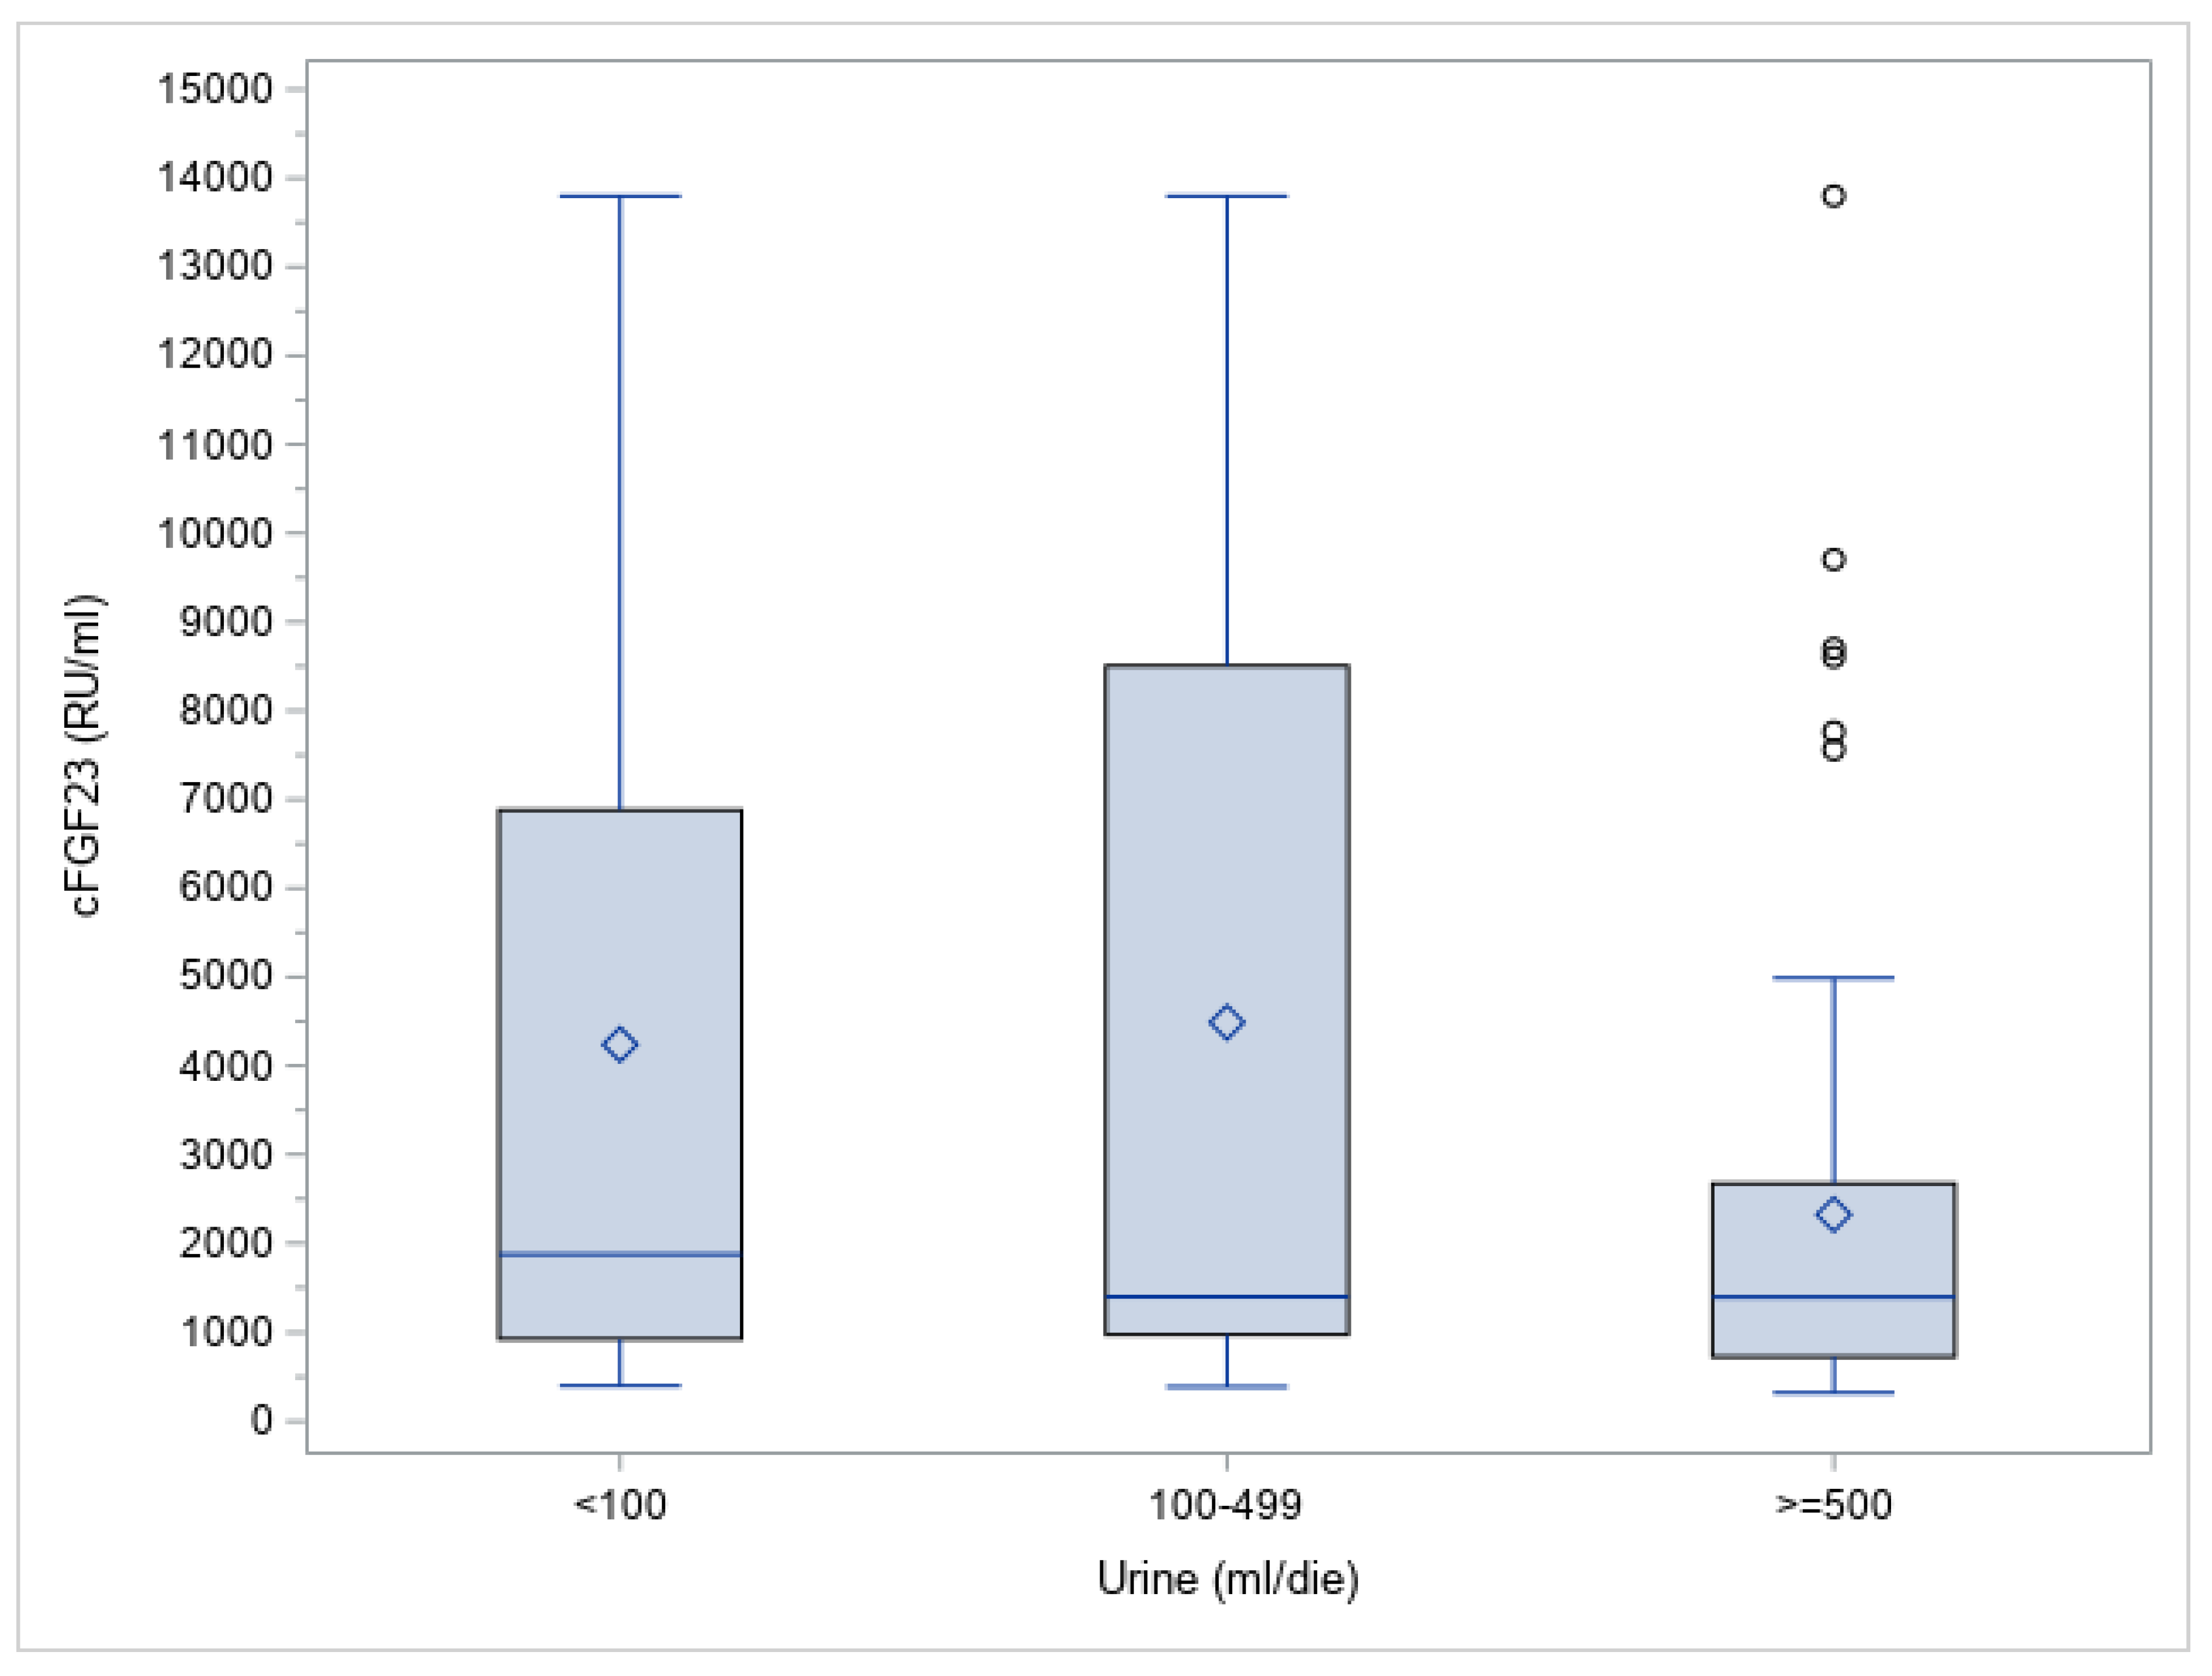
| UO volume (mL/day) | 500.0 (0.0–4200.0) | 0.0 (0.0–1600.0) | 1000.0 (0.0–4200.0) | <0.0001 |
| Variable | Full Cohort (N = 133) | Without UO (N = 40) | With UO (N = 93) | p Value |
|---|---|---|---|---|
| Age (years) | 66.0 (22.9–90.8) | 58.5 (33.6–86.7) | 68.0 (22.9–90.8) | 0.093 |
| Gender | 0.029 | |||
| Female sex (%) | 39 (29.3%) | 17 (42.5%) | 22 (23.7%) | |
| Male sex (%) | 94 (70.7%) | 23 (57.5%) | 71 (76.3%) | |
| Hypertension (%) | 124 (93.2%) | 38 (95%) | 86 (92.5%) | 0.72 |
| Diabetes (%) | 34 (25.6%) | 16 (27.6%) | 18 (24.0%) | 0.64 |
| Cause of CKD | 0.0016 | |||
| Primary glomerular disease | 24 (18.0%) | 14 (35.0%) | 10 (10.8%) | |
| Genetic disease | 16 (12.0%) | 5 (12.5%) | 11 (11.8%) | |
| Secondary kidney disease | 73 (54.9%) | 13 (32.5%) | 60 (64.5%) | |
| Unknown | 20 (15.0%) | 8 (20%) | 12 (12.9%) | |
| Laboratory test | ||||
| Creatinine (mg/dL) | 9.1 (3.2–19.5) | 10.3 (5.3–18.6) | 8.7 (3.2–19.5) | 0.0005 |
| Urea (mg/dL) | 129.3 ± 33.3 | 129.7 ± 37.5 | 129.1 ± 31.6 | 0.93 |
| Calcium (mg/dL) | 9.0 (7.6–12.8) | 9.0 (8.1–10.4) | 9.1 (7.6–12.8) | 0.87 |
| Phosphorus (mg/dL) | 4.8 (2.1–8.9) | 4.1 (2.1–8.9) | 5.0 (2.1–8.9) | 0.0016 |
| iPTH (pg/mL) | 99.0 (4.0–1010.0) | 181.0 (4.0–1010.0) | 82.5 (7.0–732.0) | 0.20 |
| 25-(OH) D3 (ng/mL) | 16.8 (5.0–71.9) | 20.8 (5.0–71.9) | 16.6 (5.0–54.9) | 0.0096 |
| cFGF23 (RU/mL) | 1493.1 (320.5–13,800.0) | 1874.4 (399.4–13,800.0) | 1400.1 (320.5–13,800.0) | 0.12 |
| Variable | Univariable | Multivariable | ||||
|---|---|---|---|---|---|---|
| ß | 95% CI | p Value | ß | 95% CI | p Value | |
| Age | −0.02062 | −0.03517; −0.00607 | 0.0059 | |||
| Sex (F) | −0.29946 | −0.73660; 0.13768 | 0.1775 | |||
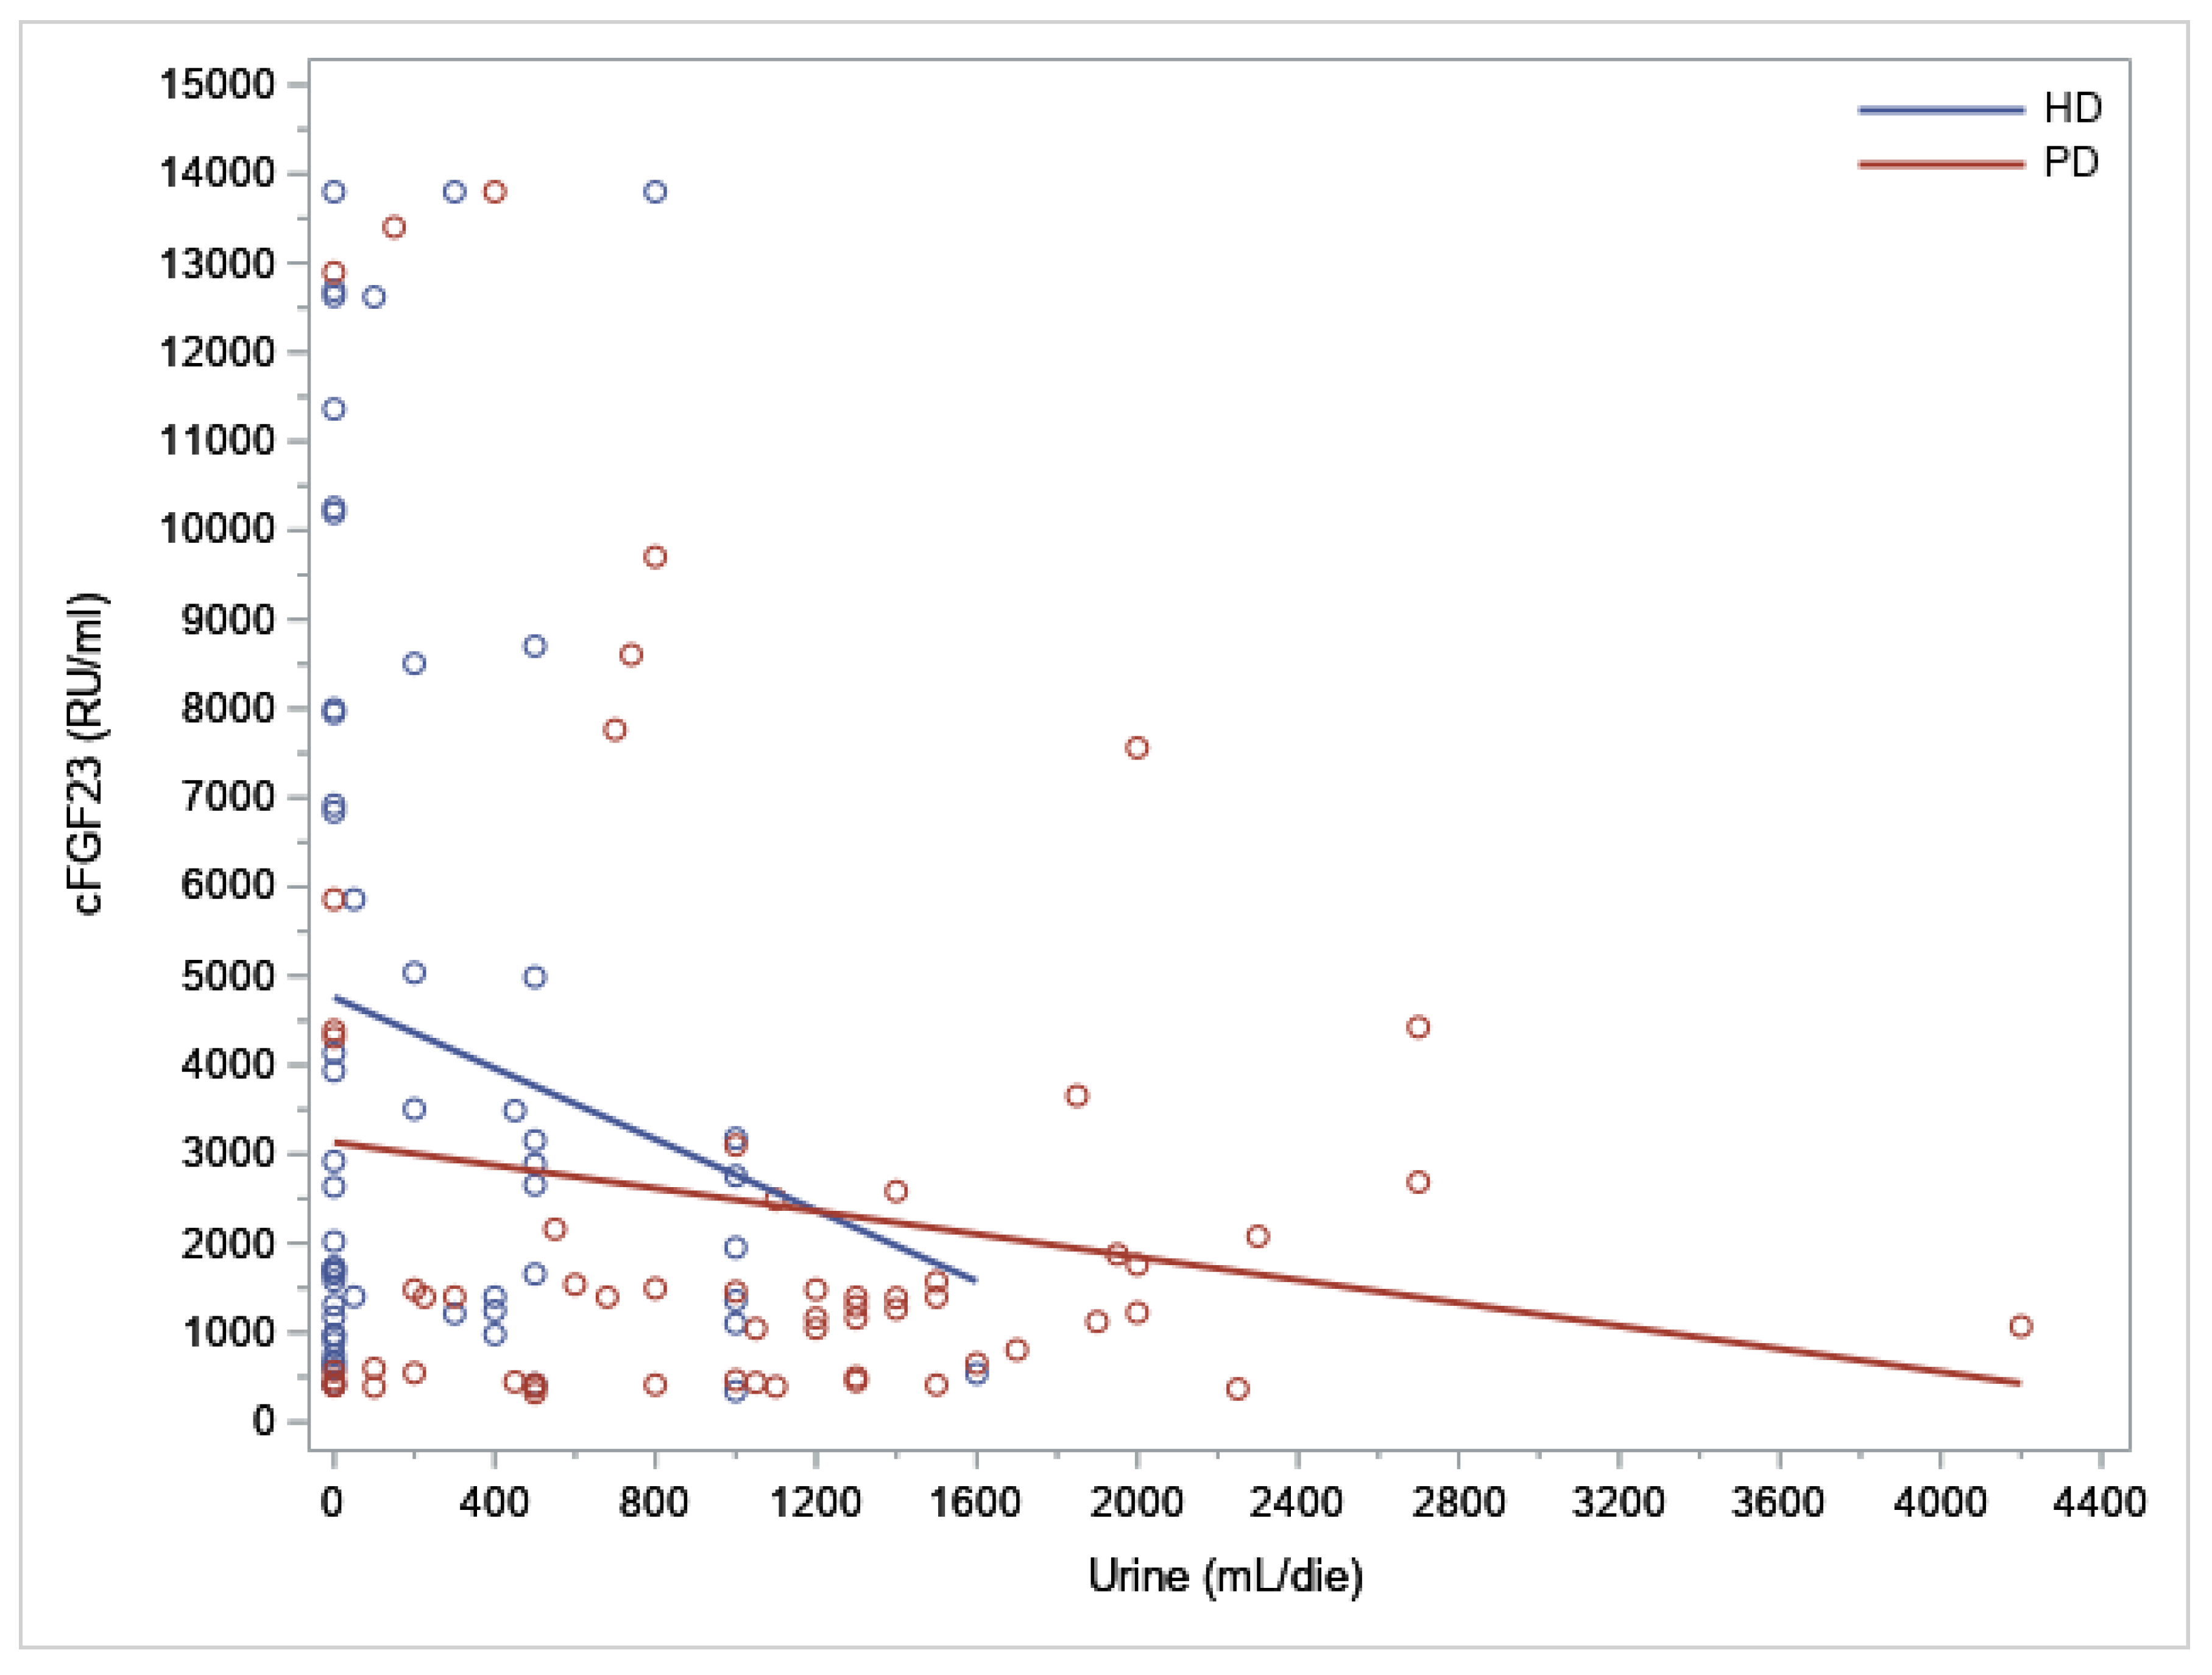
| Dialysis (PD) | −0.62306 | −1.00102; −0.24509 | 0.0014 | −0.68392 | −1.04698; −0.32086 | 0.0003 |
| Residual UO | −0.35999 | −0.77786; 0.05789 | 0.0906 | |||
| Hypertension | 0.76648 | −0.12389; 1.65686 | 0.0909 | |||
| Diabetes | 0.28007 | −0.16636; 0.72649 | 0.2166 | |||
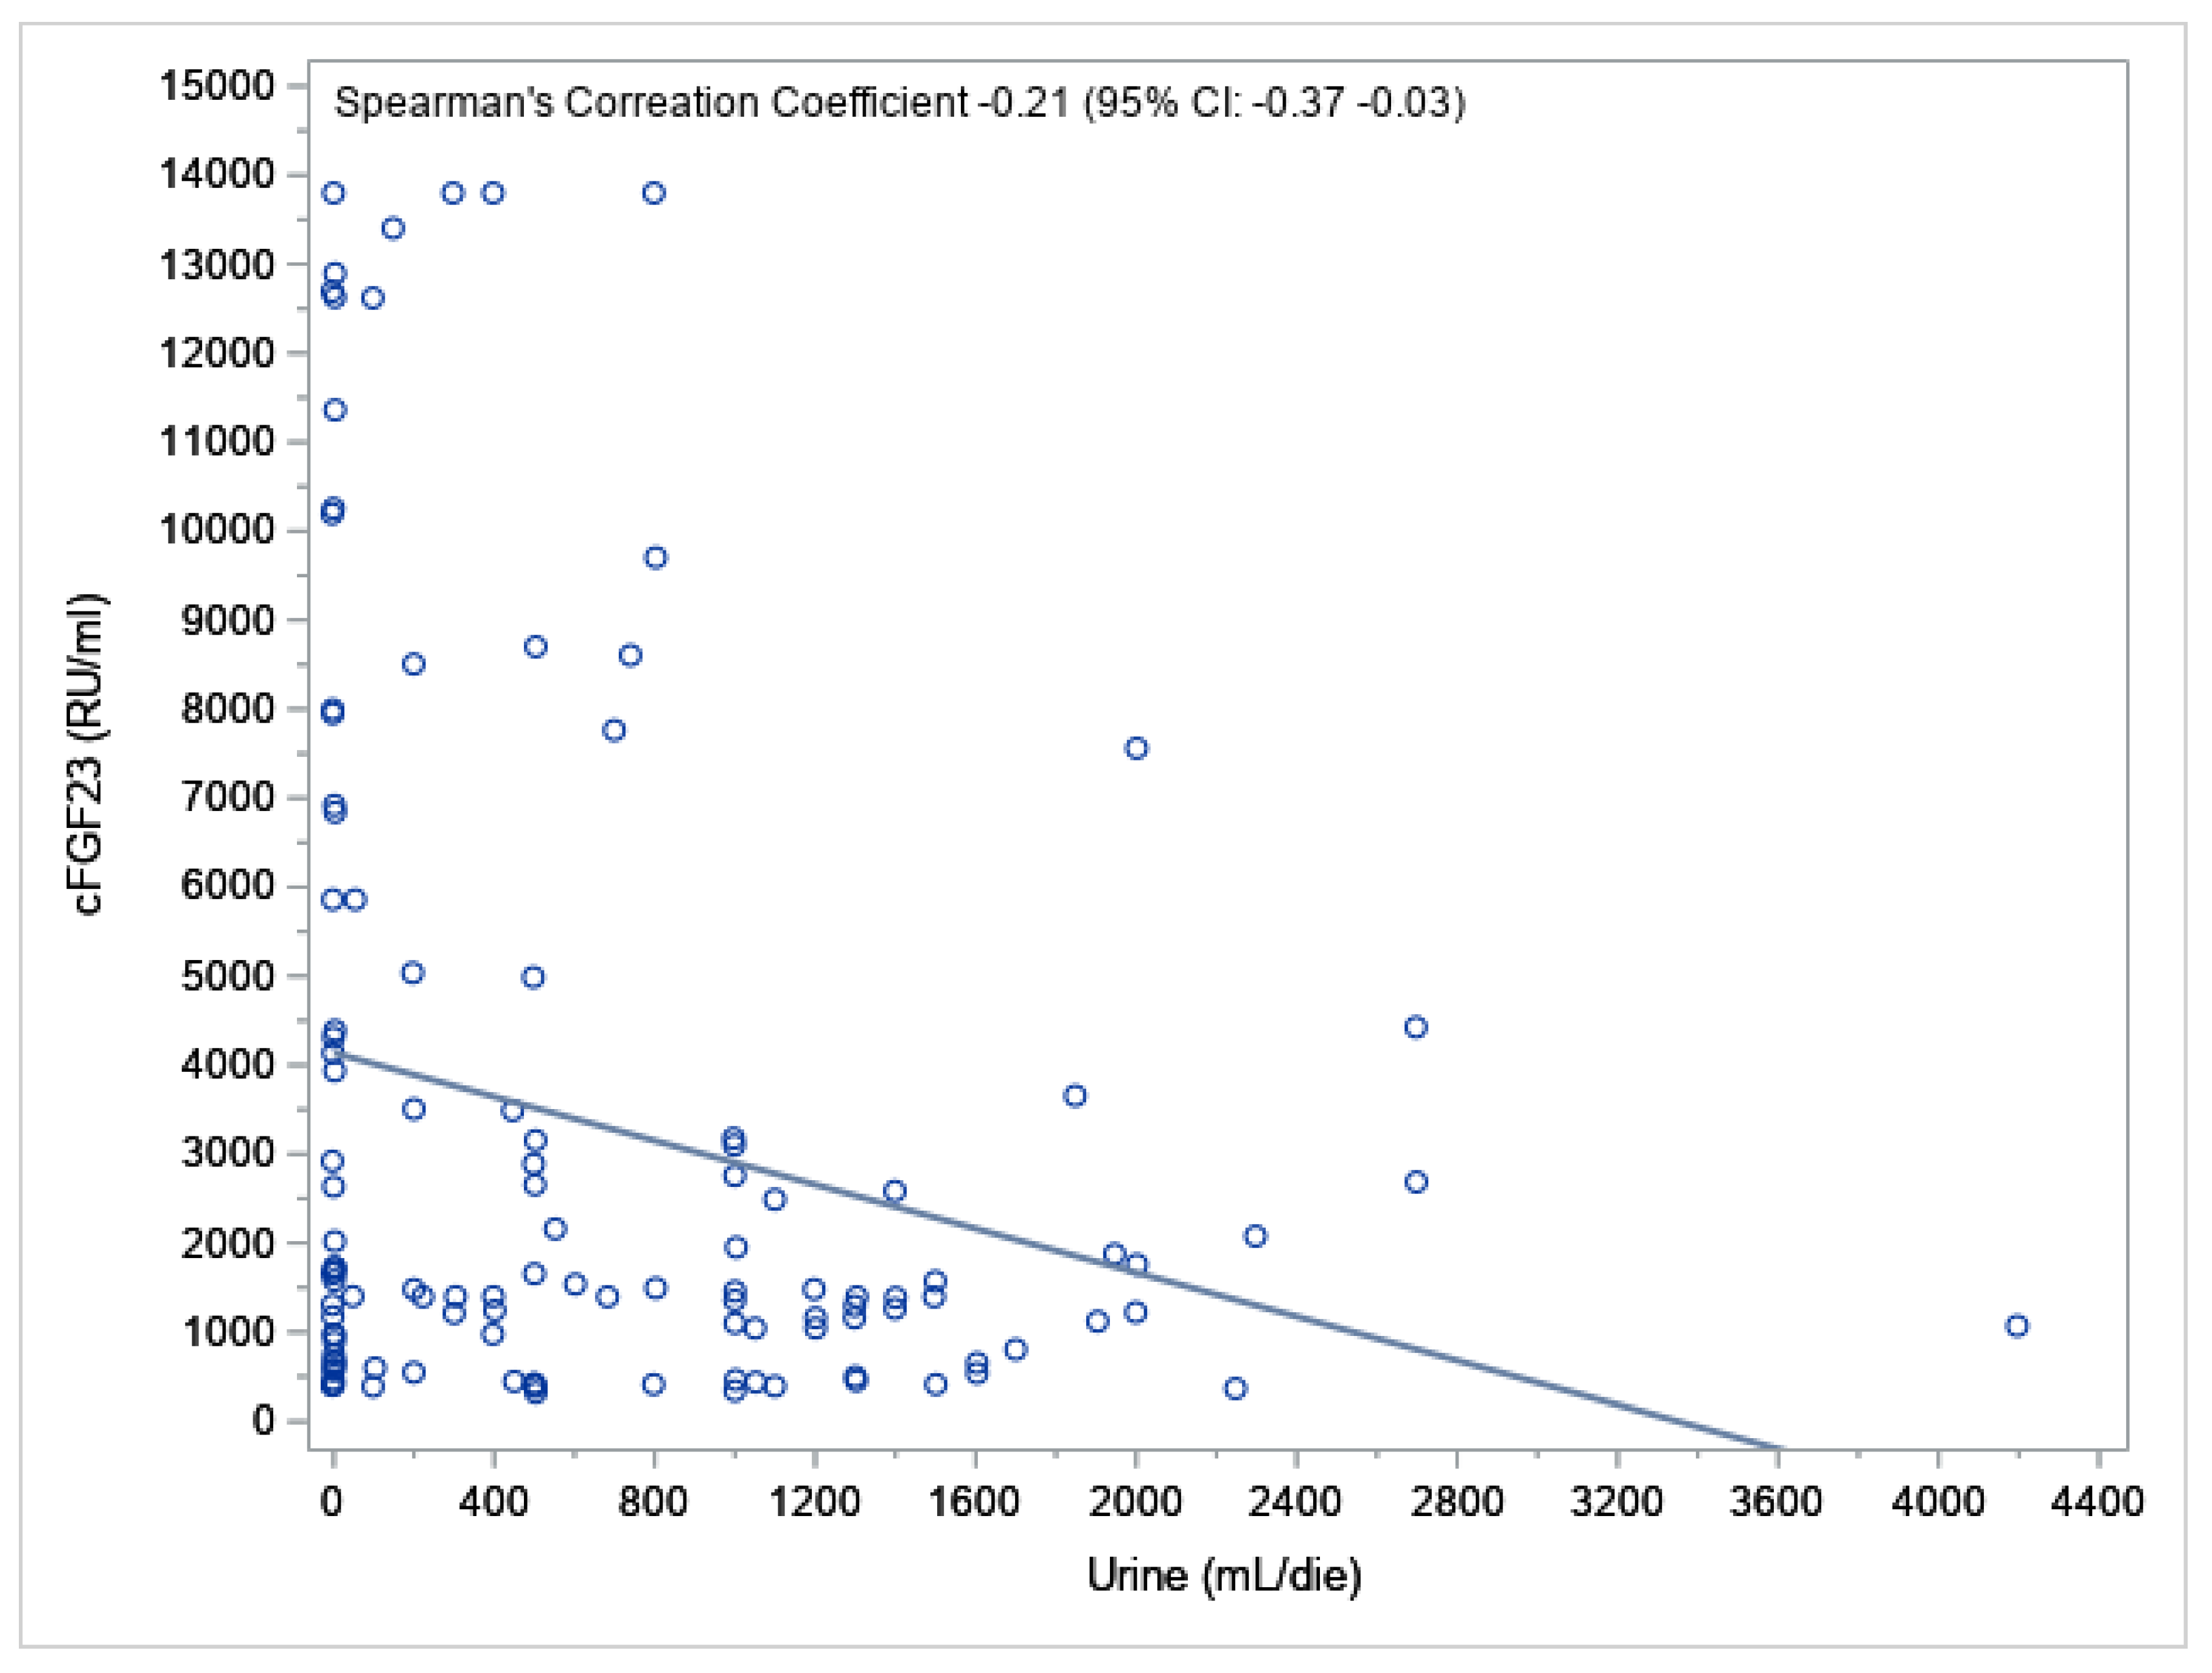
| Urine (mL/day) | −0.00026 | −0.00052233; −0.00001042 | 0.0415 | |||
| Creatinine (mg/dL) | 0.13441 | 0.07054; 0.19828 | <0.0001 | 0.08130 | 0.01723; 0.14537 | 0.0133 |
| Urea (mg/dL) | 0.00704 | 0.00097556; 0.01311 | 0.0233 | |||
| Calcium (mg/dL) | −0.11283 | −0.40967; 0.18402 | 0.4531 | |||
| Phosphorus (mg/dL) | 0.20957 | 0.08667; 0.33247 | 0.0010 | 0.21677 | 0.09372; 0.33982 | 0.0007 |
| iPTH (pg/mL) | 0.00092 | −0.00034267; 0.00219 | 0.1514 | |||
| 25-(OH) D3 (ng/mL) | 0.00812 | −0.01006; 0.02630 | 0.3784 | |||
Disclaimer/Publisher’s Note: The statements, opinions and data contained in all publications are solely those of the individual author(s) and contributor(s) and not of MDPI and/or the editor(s). MDPI and/or the editor(s) disclaim responsibility for any injury to people or property resulting from any ideas, methods, instructions or products referred to in the content. |
© 2022 by the authors. Licensee MDPI, Basel, Switzerland. This article is an open access article distributed under the terms and conditions of the Creative Commons Attribution (CC BY) license (https://creativecommons.org/licenses/by/4.0/).
Share and Cite
Corradi, V.; Samoni, S.; Mariotto, A.; Caprara, C.; Scalzotto, E.; Frigo, A.C.; Martino, F.K.; Giavarina, D.; Ronco, C.; Zanella, M. Relationship between Residual Urine Output and Type of Dialysis with FGF23 Levels. J. Clin. Med. 2023, 12, 222. https://doi.org/10.3390/jcm12010222
Corradi V, Samoni S, Mariotto A, Caprara C, Scalzotto E, Frigo AC, Martino FK, Giavarina D, Ronco C, Zanella M. Relationship between Residual Urine Output and Type of Dialysis with FGF23 Levels. Journal of Clinical Medicine. 2023; 12(1):222. https://doi.org/10.3390/jcm12010222
Chicago/Turabian StyleCorradi, Valentina, Sara Samoni, Alice Mariotto, Carlotta Caprara, Elisa Scalzotto, Anna Chiara Frigo, Francesca K. Martino, Davide Giavarina, Claudio Ronco, and Monica Zanella. 2023. "Relationship between Residual Urine Output and Type of Dialysis with FGF23 Levels" Journal of Clinical Medicine 12, no. 1: 222. https://doi.org/10.3390/jcm12010222