
Assessment of Telomere Length and Mitochondrial DNA Copy Number in Granulosa Cells as Predictors of Aneuploidy Rate in Young Patients

 , ,
, ,  and
and
Abstract
:1. Introduction
2. Materials and Methods
2.1. Patient Selection
2.2. Controlled Ovarian Stimulation (COH) Protocol
2.3. Collection of Granulosa Cells and Leukocytes
2.4. Telomere Length Evaluation
2.5. Quantification of mtDNA Copy Number
2.6. ART and Embryo Biopsy
2.7. Examination of Diploid–Aneuploid Levels through Next Generation Sequencing
2.8. Statistical Analysis
3. Results
4. Discussion
5. Conclusions
Author Contributions
Funding
Institutional Review Board Statement
Informed Consent Statement
Data Availability Statement
Conflicts of Interest
References
- Nelson, S.M.; Telfer, E.E.; Anderson, R.A. The ageing ovary and uterus: New biological insights. Hum. Reprod. Update 2013, 19, 67–83. [Google Scholar] [CrossRef] [PubMed] [Green Version]
- Dunson, D.B.; Colombo, B.; Baird, D.D. Changes with age in the level and duration of fertility in the menstrual cycle. Hum. Reprod. 2002, 17, 1399–1403. [Google Scholar] [CrossRef] [PubMed]
- May-Panloup, P.; Boucret, L.; Chao de la Barca, J.M.; Desquiret-Dumas, V.; Ferre-L’Hotellier, V.; Moriniere, C.; Descamps, P.; Procaccio, V.; Reynier, P. Ovarian ageing: The role of mitochondria in oocytes and follicles. Hum. Reprod. Update 2016, 22, 725–743. [Google Scholar] [CrossRef] [PubMed] [Green Version]
- La Marca, A.; Sunkara, S.K. Individualization of controlled ovarian stimulation in IVF using ovarian reserve markers: From theory to practice. Hum. Reprod. Update 2014, 20, 124–140. [Google Scholar] [CrossRef] [Green Version]
- Nelson, S.M.; Klein, B.M.; Arce, J.C. Comparison of antimullerian hormone levels and antral follicle count as predictor of ovarian response to controlled ovarian stimulation in good-prognosis patients at individual fertility clinics in two multicenter trials. Fertil. Steril. 2015, 103, 923–930.e921. [Google Scholar] [CrossRef] [Green Version]
- Arce, J.C.; Andersen, A.N.; Fernandez-Sanchez, M.; Visnova, H.; Bosch, E.; Garcia-Velasco, J.A.; Barri, P.; de Sutter, P.; Klein, B.M.; Fauser, B.C. Ovarian response to recombinant human follicle-stimulating hormone: A randomized, antimullerian hormone-stratified, dose-response trial in women undergoing in vitro fertilization/intracytoplasmic sperm injection. Fertil. Steril. 2014, 102, 1633–1640.e1635. [Google Scholar] [CrossRef]
- Nelson, S.M.; Yates, R.W.; Lyall, H.; Jamieson, M.; Traynor, I.; Gaudoin, M.; Mitchell, P.; Ambrose, P.; Fleming, R. Anti-Mullerian hormone-based approach to controlled ovarian stimulation for assisted conception. Hum. Reprod. 2009, 24, 867–875. [Google Scholar] [CrossRef] [Green Version]
- Lee, T.H.; Liu, C.H.; Huang, C.C.; Wu, Y.L.; Shih, Y.T.; Ho, H.N.; Yang, Y.S.; Lee, M.S. Serum anti-Mullerian hormone and estradiol levels as predictors of ovarian hyperstimulation syndrome in assisted reproduction technology cycles. Hum. Reprod. 2008, 23, 160–167. [Google Scholar] [CrossRef] [Green Version]
- Iliodromiti, S.; Kelsey, T.W.; Wu, O.; Anderson, R.A.; Nelson, S.M. The predictive accuracy of anti-Mullerian hormone for live birth after assisted conception: A systematic review and meta-analysis of the literature. Hum. Reprod. Update 2014, 20, 560–570. [Google Scholar] [CrossRef]
- Tal, R.; Tal, O.; Seifer, B.J.; Seifer, D.B. Antimullerian hormone as predictor of implantation and clinical pregnancy after assisted conception: A systematic review and meta-analysis. Fertil. Steril. 2015, 103, 119–130.e113. [Google Scholar] [CrossRef]
- Wang, J.G.; Douglas, N.C.; Nakhuda, G.S.; Choi, J.M.; Park, S.J.; Thornton, M.H.; Guarnaccia, M.M.; Sauer, M.V. The association between anti-Mullerian hormone and IVF pregnancy outcomes is influenced by age. Reprod. Biomed. Online 2010, 21, 757–761. [Google Scholar] [CrossRef] [PubMed] [Green Version]
- Lee, T.H.; Liu, C.H.; Huang, C.C.; Hsieh, K.C.; Lin, P.M.; Lee, M.S. Impact of female age and male infertility on ovarian reserve markers to predict outcome of assisted reproduction technology cycles. Reprod. Biol. Endocrinol. 2009, 7, 100. [Google Scholar] [CrossRef] [PubMed] [Green Version]
- Franasiak, J.M.; Forman, E.J.; Hong, K.H.; Werner, M.D.; Upham, K.M.; Treff, N.R.; Scott, R.T., Jr. The nature of aneuploidy with increasing age of the female partner: A review of 15,169 consecutive trophectoderm biopsies evaluated with comprehensive chromosomal screening. Fertil. Steril. 2014, 101, 656–663.e651. [Google Scholar] [CrossRef] [PubMed]
- Marteil, G.; Richard-Parpaillon, L.; Kubiak, J.Z. Role of oocyte quality in meiotic maturation and embryonic development. Reprod. Biol. 2009, 9, 203–224. [Google Scholar] [CrossRef]
- Lee, C.I.; Wu, C.H.; Pai, Y.P.; Chang, Y.J.; Chen, C.I.; Lee, T.H.; Lee, M.S. Performance of preimplantation genetic testing for aneuploidy in IVF cycles for patients with advanced maternal age, repeat implantation failure, and idiopathic recurrent miscarriage. Taiwan J. Obstet. Gynecol. 2019, 58, 239–243. [Google Scholar] [CrossRef]
- Murphy, L.A.; Seidler, E.A.; Vaughan, D.A.; Resetkova, N.; Penzias, A.S.; Toth, T.L.; Thornton, K.L.; Sakkas, D. To test or not to test? A framework for counselling patients on preimplantation genetic testing for aneuploidy (PGT-A). Hum. Reprod. 2019, 34, 268–275. [Google Scholar] [CrossRef]
- Wang, T.; Babayev, E.; Jiang, Z.; Li, G.; Zhang, M.; Esencan, E.; Horvath, T.; Seli, E. Mitochondrial unfolded protein response gene Clpp is required to maintain ovarian follicular reserve during aging, for oocyte competence, and development of pre-implantation embryos. Aging Cell 2018, 17, e12784. [Google Scholar] [CrossRef]
- Cecchino, G.N.; Seli, E.; Alves da Motta, E.L.; Garcia-Velasco, J.A. The role of mitochondrial activity in female fertility and assisted reproductive technologies: Overview and current insights. Reprod. Biomed. Online 2018. [Google Scholar] [CrossRef] [Green Version]
- Chiaratti, M.R.; Garcia, B.M.; Carvalho, K.F.; Machado, T.S.; Ribeiro, F.; Macabelli, C.H. The role of mitochondria in the female germline: Implications to fertility and inheritance of mitochondrial diseases. Cell Biol. Int. 2018, 42, 711–724. [Google Scholar] [CrossRef]
- De Boer, K.; Jasen, R.; Leigh, D.; Mortimer, D. O-165 quantification of mtDNA copy number in the human secondary oocyte. Hum. Reprod. 1999, 14, 2419. [Google Scholar] [CrossRef] [Green Version]
- Duran, H.E.; Simsek-Duran, F.; Oehninger, S.C.; Jones, H.W., Jr.; Castora, F.J. The association of reproductive senescence with mitochondrial quantity, function, and DNA integrity in human oocytes at different stages of maturation. Fertil. Steril. 2011, 96, 384–388. [Google Scholar] [CrossRef] [PubMed]
- May-Panloup, P.; Chretien, M.F.; Jacques, C.; Vasseur, C.; Malthiery, Y.; Reynier, P. Low oocyte mitochondrial DNA content in ovarian insufficiency. Hum. Reprod. 2005, 20, 593–597. [Google Scholar] [CrossRef] [PubMed] [Green Version]
- Boucret, L.; Chao de la Barca, J.M.; Moriniere, C.; Desquiret, V.; Ferre-L’Hotellier, V.; Descamps, P.; Marcaillou, C.; Reynier, P.; Procaccio, V.; May-Panloup, P. Relationship between diminished ovarian reserve and mitochondrial biogenesis in cumulus cells. Hum. Reprod. 2015, 30, 1653–1664. [Google Scholar] [CrossRef] [PubMed] [Green Version]
- Taugourdeau, A.; Desquiret-Dumas, V.; Hamel, J.F.; Chupin, S.; Boucret, L.; Ferré-L’Hotellier, V.; Bouet, P.E.; Descamps, P.; Procaccio, V.; Reynier, P.; et al. The mitochondrial DNA content of cumulus cells may help predict embryo implantation. J. Assist. Reprod. Genet. 2018, 36, 223–228. [Google Scholar] [CrossRef]
- Liu, L.; Blasco, M.A.; Keefe, D.L. Requirement of functional telomeres for metaphase chromosome alignments and integrity of meiotic spindles. EMBO Rep. 2002, 3, 230–234. [Google Scholar] [CrossRef] [PubMed] [Green Version]
- Xu, X.; Chen, X.; Zhang, X.; Liu, Y.; Wang, Z.; Wang, P.; Du, Y.; Qin, Y.; Chen, Z.J. Impaired telomere length and telomerase activity in peripheral blood leukocytes and granulosa cells in patients with biochemical primary ovarian insufficiency. Hum. Reprod. 2017, 32, 201–207. [Google Scholar] [CrossRef] [PubMed]
- Kosebent, E.G.; Uysal, F.; Ozturk, S. Telomere length and telomerase activity during folliculogenesis in mammals. J. Reprod. Dev. 2018, 64, 477–484. [Google Scholar] [CrossRef] [Green Version]
- Cheng, E.H.; Chen, S.U.; Lee, T.H.; Pai, Y.P.; Huang, L.S.; Huang, C.C.; Lee, M.S. Evaluation of telomere length in cumulus cells as a potential biomarker of oocyte and embryo quality. Hum. Reprod. 2013, 28, 929–936. [Google Scholar] [CrossRef] [Green Version]
- Lopez-Otin, C.; Blasco, M.A.; Partridge, L.; Serrano, M.; Kroemer, G. The hallmarks of aging. Cell 2013, 153, 1194–1217. [Google Scholar] [CrossRef] [Green Version]
- Revesz, D.; Verhoeven, J.E.; Picard, M.; Lin, J.; Sidney, S.; Epel, E.S.; Penninx, B.; Puterman, E. Associations Between Cellular Aging Markers and Metabolic Syndrome: Findings From the CARDIA Study. J. Clin. Endocrinol. Metab. 2018, 103, 148–157. [Google Scholar] [CrossRef] [Green Version]
- Zole, E.; Zadinane, K.; Pliss, L.; Ranka, R. Linkage between mitochondrial genome alterations, telomere length and aging population. Mitochondrial. DNA DNA Mapp. Seq. Anal. 2018, 29, 431–438. [Google Scholar] [CrossRef] [PubMed]
- Hanson, B.M.; Tao, X.; Zhan, Y.; Kim, J.G.; Klimczak, A.M.; Herlihy, N.S.; Scott, R.T., Jr.; Seli, E. Shorter telomere length of white blood cells is associated with higher rates of aneuploidy among infertile women undergoing in vitro fertilization. Fertil. Steril. 2021, 115, 957–965. [Google Scholar] [CrossRef] [PubMed]
- Lee, C.I.; Chen, C.H.; Huang, C.C.; Cheng, E.H.; Chen, H.H.; Ho, S.T.; Lin, P.Y.; Lee, M.S.; Lee, T.H. Embryo morphokinetics is potentially associated with clinical outcomes of single-embryo transfers in preimplantation genetic testing for aneuploidy cycles. Reprod. Biomed. Online 2019, 39, 569–579. [Google Scholar] [CrossRef] [PubMed]
- Cawthon, R.M. Telomere measurement by quantitative PCR. Nucleic Acids Res. 2002, 30, e47. [Google Scholar] [CrossRef]
- Gardner, D.K.; Lane, M.; Stevens, J.; Schlenker, T.; Schoolcraft, W.B. Blastocyst score affects implantation and pregnancy outcome: Towards a single blastocyst transfer. Fertil. Steril. 2000, 73, 1155–1158. [Google Scholar] [CrossRef]
- Munne, S.; Alikani, M.; Ribustello, L.; Colls, P.; Martinez-Ortiz, P.A.; McCulloh, D.H.; Referring Physician, G. Euploidy rates in donor egg cycles significantly differ between fertility centers. Hum. Reprod. 2017, 32, 743–749. [Google Scholar] [CrossRef] [Green Version]
- Desai, N.; Goldberg, J.M.; Austin, C.; Falcone, T. Are cleavage anomalies, multinucleation, or specific cell cycle kinetics observed with time-lapse imaging predictive of embryo developmental capacity or ploidy? Fertil. Steril. 2018, 109, 665–674. [Google Scholar] [CrossRef] [Green Version]
- Munne, S.; Wells, D. Detection of mosaicism at blastocyst stage with the use of high-resolution next-generation sequencing. Fertil. Steril. 2017, 107, 1085–1091. [Google Scholar] [CrossRef] [Green Version]
- Fazzini, F.; Schopf, B.; Blatzer, M.; Coassin, S.; Hicks, A.A.; Kronenberg, F.; Fendt, L. Plasmid-normalized quantification of relative mitochondrial DNA copy number. Sci. Rep. 2018, 8, 15347. [Google Scholar] [CrossRef]
- Fattet, A.J.; Toupance, S.; Thornton, S.N.; Monnin, N.; Gueant, J.L.; Benetos, A.; Koscinski, I. Telomere length in granulosa cells and leukocytes: A potential marker of female fertility? A systematic review of the literature. J. Ovarian Res. 2020, 13, 96. [Google Scholar] [CrossRef]
- Zhu, Y.; Liu, X.; Ding, X.; Wang, F.; Geng, X. Telomere and its role in the aging pathways: Telomere shortening, cell senescence and mitochondria dysfunction. Biogerontology 2019, 20, 1–16. [Google Scholar] [CrossRef] [PubMed]
- Li, Y.; Sundquist, K.; Wang, X.; Zhang, N.; Hedelius, A.; Sundquist, J.; Memon, A.A. Association of Mitochondrial DNA Copy Number and Telomere Length with Prevalent and Incident Cancer and Cancer Mortality in Women: A Prospective Swedish Population-Based Study. Cancers 2021, 13, 3842. [Google Scholar] [CrossRef] [PubMed]
- Correia-Melo, C.; Marques, F.D.; Anderson, R.; Hewitt, G.; Hewitt, R.; Cole, J.; Carroll, B.M.; Miwa, S.; Birch, J.; Merz, A.; et al. Mitochondria are required for pro-ageing features of the senescent phenotype. EMBO J. 2016, 35, 724–742. [Google Scholar] [CrossRef]
- Bone Marrow, Thymus and Blood: Changes across the Lifespan. Aging Health 2009, 5, 385–393. [CrossRef] [Green Version]
- Weyand, C.M.; Goronzy, J.J. Aging of the Immune System. Mechanisms and Therapeutic Targets. Ann. Am. Thorac. Soc. 2016, 13 (Suppl. S5), S422–S428. [Google Scholar] [CrossRef]
- de Vet, A.; Laven, J.S.; de Jong, F.H.; Themmen, A.P.; Fauser, B.C. Antimüllerian hormone serum levels: A putative marker for ovarian aging. Fertil. Steril. 2002, 77, 357–362. [Google Scholar] [CrossRef]


| Group | Young (<38 y/o) n = 60 | Advanced (≥38 y/o) n = 50 | p Value |
|---|---|---|---|
| Age (year) | 33.5 ± 3.1 | 40.7 ± 1.9 | <0.001 |
| AMH (ng/mL) | 5.04 ± 3.59 | 3.19 ± 3.03 | 0.001 |
| BMI (kg/m2) | 23.0 ± 4.7 | 23.1 ± 3.4 | 0.501 |
| Baseline FSH (IU/L) | 6.63 ± 3.04 | 7.76 ± 4.12 | 0.144 |
| Baseline LH (IU/L) | 6.01 ± 4.68 | 8.06 ± 12.92 | 0.746 |
| Baseline E2 (pg/mL) | 46.3 ± 34.8 | 46.8 ± 41.9 | 0.696 |
| Number of oocytes retrieved | 16.0 ± 11.9 | 11.2 ± 6.4 | 0.017 |
| Number of metaphase II oocytes | 12.8 ± 9.8 | 9.1 ± 5.7 | 0.048 |
| Number of 2 pronuclei (2PN) | 10.0 ± 8.6 | 6.7 ± 4.3 | 0.057 |
| Fertilization rate | 74.3 ± 24.3 | 76.2 ± 22.6 | 0.653 |
| D3 good quality embryo number | 7.2 ± 6.0 | 4.9 ± 3.5 | 0.031 |
| D5 good blastocyst number | 4.4 ± 3.2 (n = 51) | 3.3 ± 2.7 (n = 43) | 0.044 |
| Aneuploidy number | 0.9 ± 0.9 (n = 51) | 1.8 ± 1.5 (n = 43) | 0.001 |
| Aneuploidy rate (%) | 23.2 ± 28.6 (n = 51) | 61.1 ± 39.1 (n = 43) | <0.001 |
| TL in leukocytes | 0.76 ± 0.43 a | 0.66 ± 0.37 b | 0.214 |
| TL in granulosa cells | 0.37 ± 0.16 a | 0.33 ± 0.12 b | 0.094 |
| mtDNA copy number in leukocytes | 143.01 ± 76.5 c | 146.4 ± 89.26 d | 0.83 |
| mtDNA copy number in granulosa cells | 306.47 ± 137.2 c | 288.3 ± 100.85 d | 0.439 |
| Spearman Correlation Coefficient | Leukocyte TL | Granulosa Cell TL | Leukocyte mtDNA Copy Number | Granulosa Cell mtDNA Copy Number |
|---|---|---|---|---|
| Age | −0.093 | −0.186 | −0.069 | −0.019 |
| p = 0.334 | p = 0.051 | p = 0.472 | p = 0.846 | |
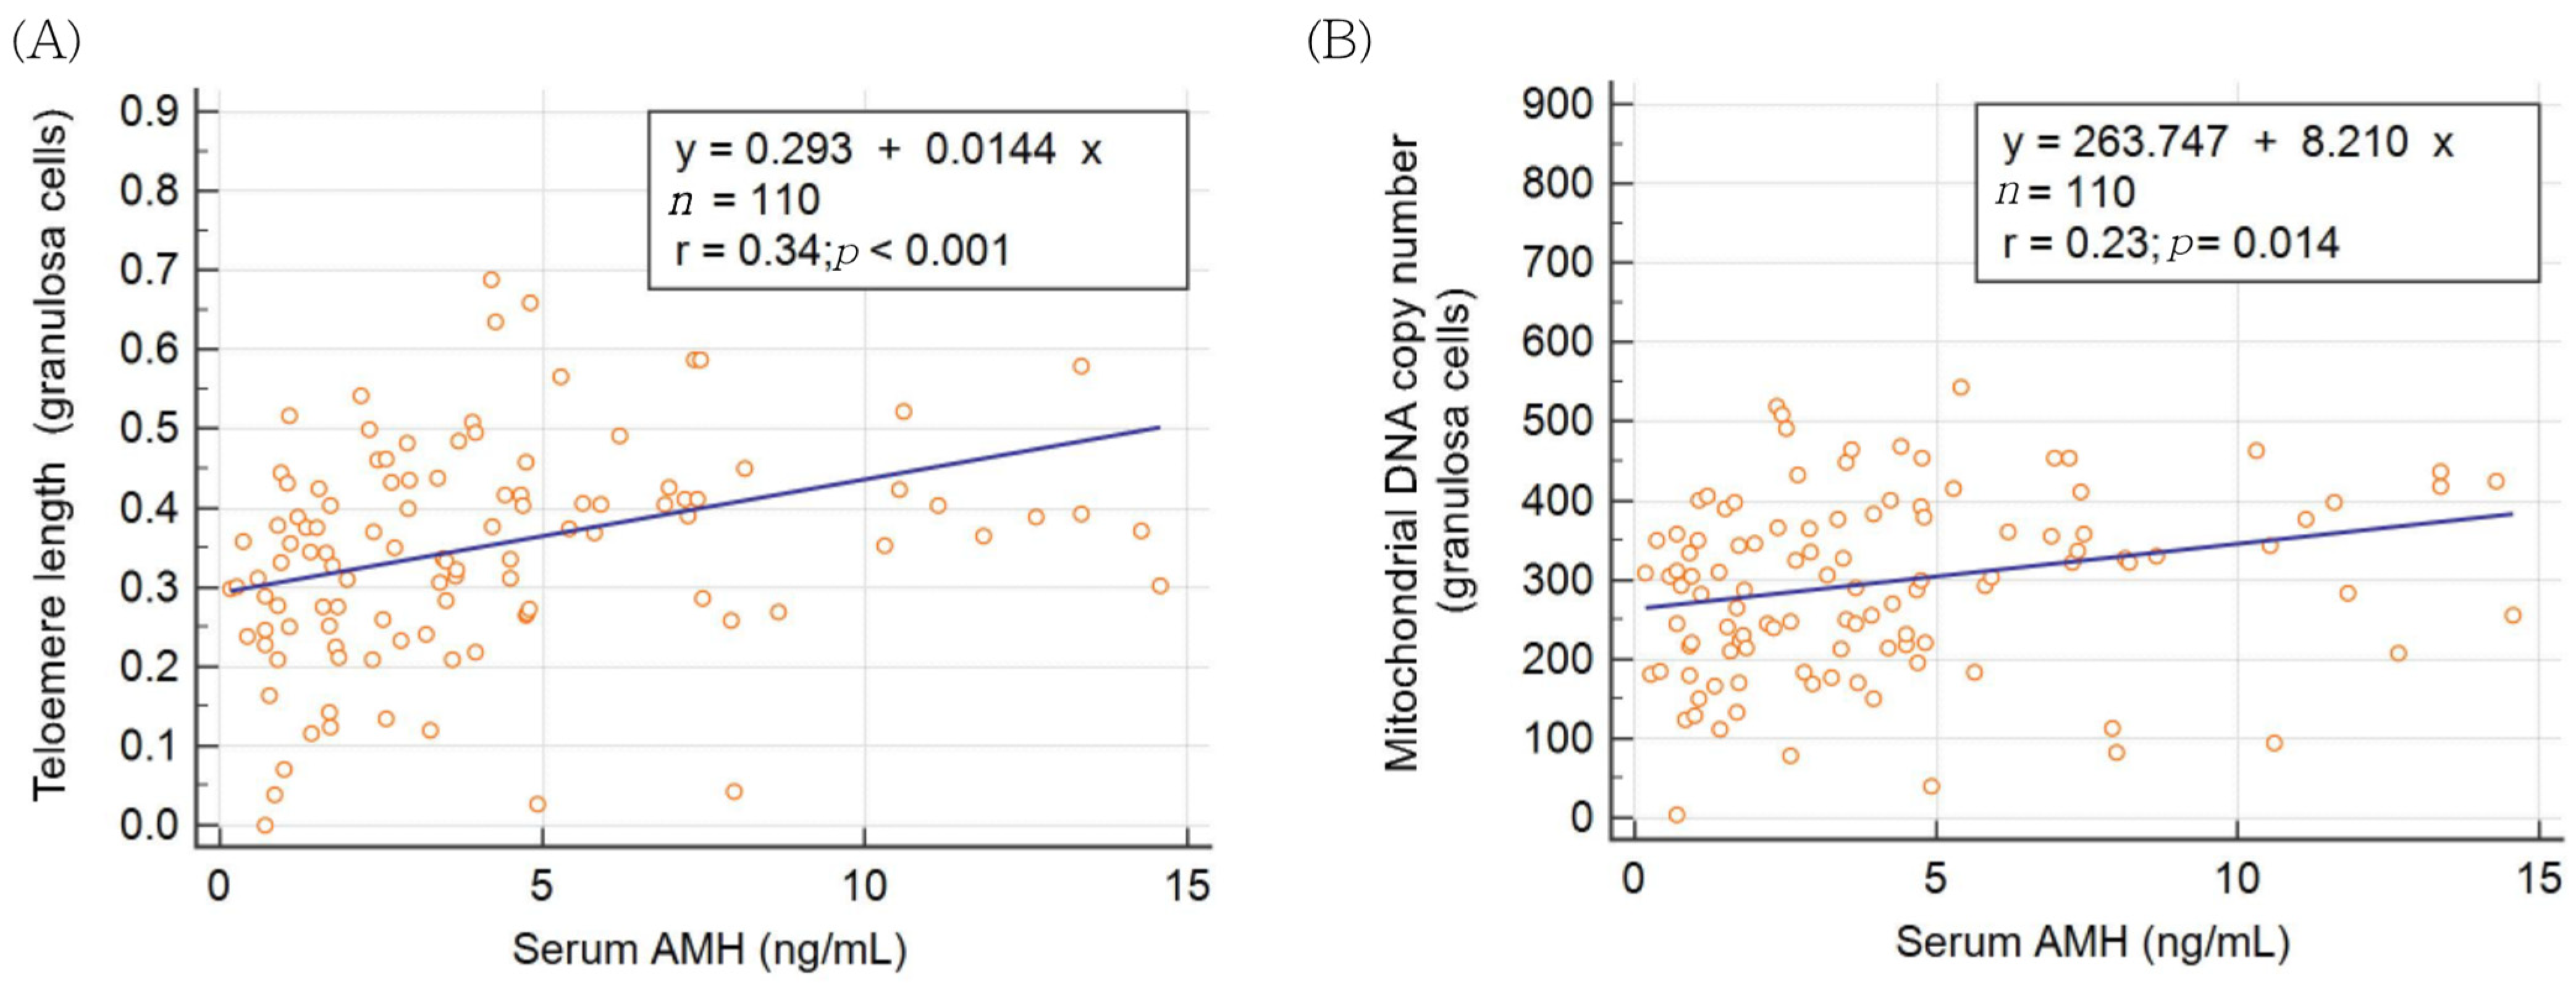
| AMH | −0.015 | 0.385 *** | 0.006 | 0.261 ** |
| p = 0.875 | p < 0.001 | p = 0.954 | p = 0.006 |
| Group | Young (<38 y/o) n = 51 | Advanced (≥38) n = 43 | Total n = 94 |
|---|---|---|---|
| Age | 0.145 | 0.358 * | 0.496 *** |
| p = 0.308 | p = 0.018 | p < 0.001 | |
| AMH | 0.015 | −0.263 | −0.204 * |
| p = 0.915 | p = 0.088 | p = 0.049 | |
| Leukocyte TL | 0.222 | 0.166 | 0.139 |
| p = 0.118 | p = 0.287 | p = 0.182 | |
| Granulosa cell TL | −0.283 * | −0.093 | −0.241 * |
| p = 0.044 | p = 0.552 | p = 0.020 | |
| Leukocyte mtDNA copy number | −0.156 | −0.060 | −0.118 |
| p = 0.275 | p = 0.702 | p = 0.256 | |
| Granulosa cell mtDNA copy number | −0.162 | −0.193 | −0.140 |
| p = 0.255 | p = 0.216 | p = 0.180 |
Publisher’s Note: MDPI stays neutral with regard to jurisdictional claims in published maps and institutional affiliations. |
© 2022 by the authors. Licensee MDPI, Basel, Switzerland. This article is an open access article distributed under the terms and conditions of the Creative Commons Attribution (CC BY) license (https://creativecommons.org/licenses/by/4.0/).
Share and Cite
Yu, T.-N.; Cheng, E.-H.; Tsai, H.-N.; Lin, P.-Y.; Chen, C.-H.; Huang, C.-C.; Lee, T.-H.; Lee, M.-S. Assessment of Telomere Length and Mitochondrial DNA Copy Number in Granulosa Cells as Predictors of Aneuploidy Rate in Young Patients. J. Clin. Med. 2022, 11, 1824. https://doi.org/10.3390/jcm11071824
Yu T-N, Cheng E-H, Tsai H-N, Lin P-Y, Chen C-H, Huang C-C, Lee T-H, Lee M-S. Assessment of Telomere Length and Mitochondrial DNA Copy Number in Granulosa Cells as Predictors of Aneuploidy Rate in Young Patients. Journal of Clinical Medicine. 2022; 11(7):1824. https://doi.org/10.3390/jcm11071824
Chicago/Turabian StyleYu, Tzu-Ning, En-Hui Cheng, Han-Ni Tsai, Pin-Yao Lin, Chien-Hong Chen, Chun-Chia Huang, Tsung-Hsien Lee, and Maw-Sheng Lee. 2022. "Assessment of Telomere Length and Mitochondrial DNA Copy Number in Granulosa Cells as Predictors of Aneuploidy Rate in Young Patients" Journal of Clinical Medicine 11, no. 7: 1824. https://doi.org/10.3390/jcm11071824