
Blood Pressure and Heart Rate Responses to an Isokinetic Testing Protocol in Professional Soccer Players


 , and
, and 
Abstract
:1. Introduction
2. Materials and Methods
2.1. Participants
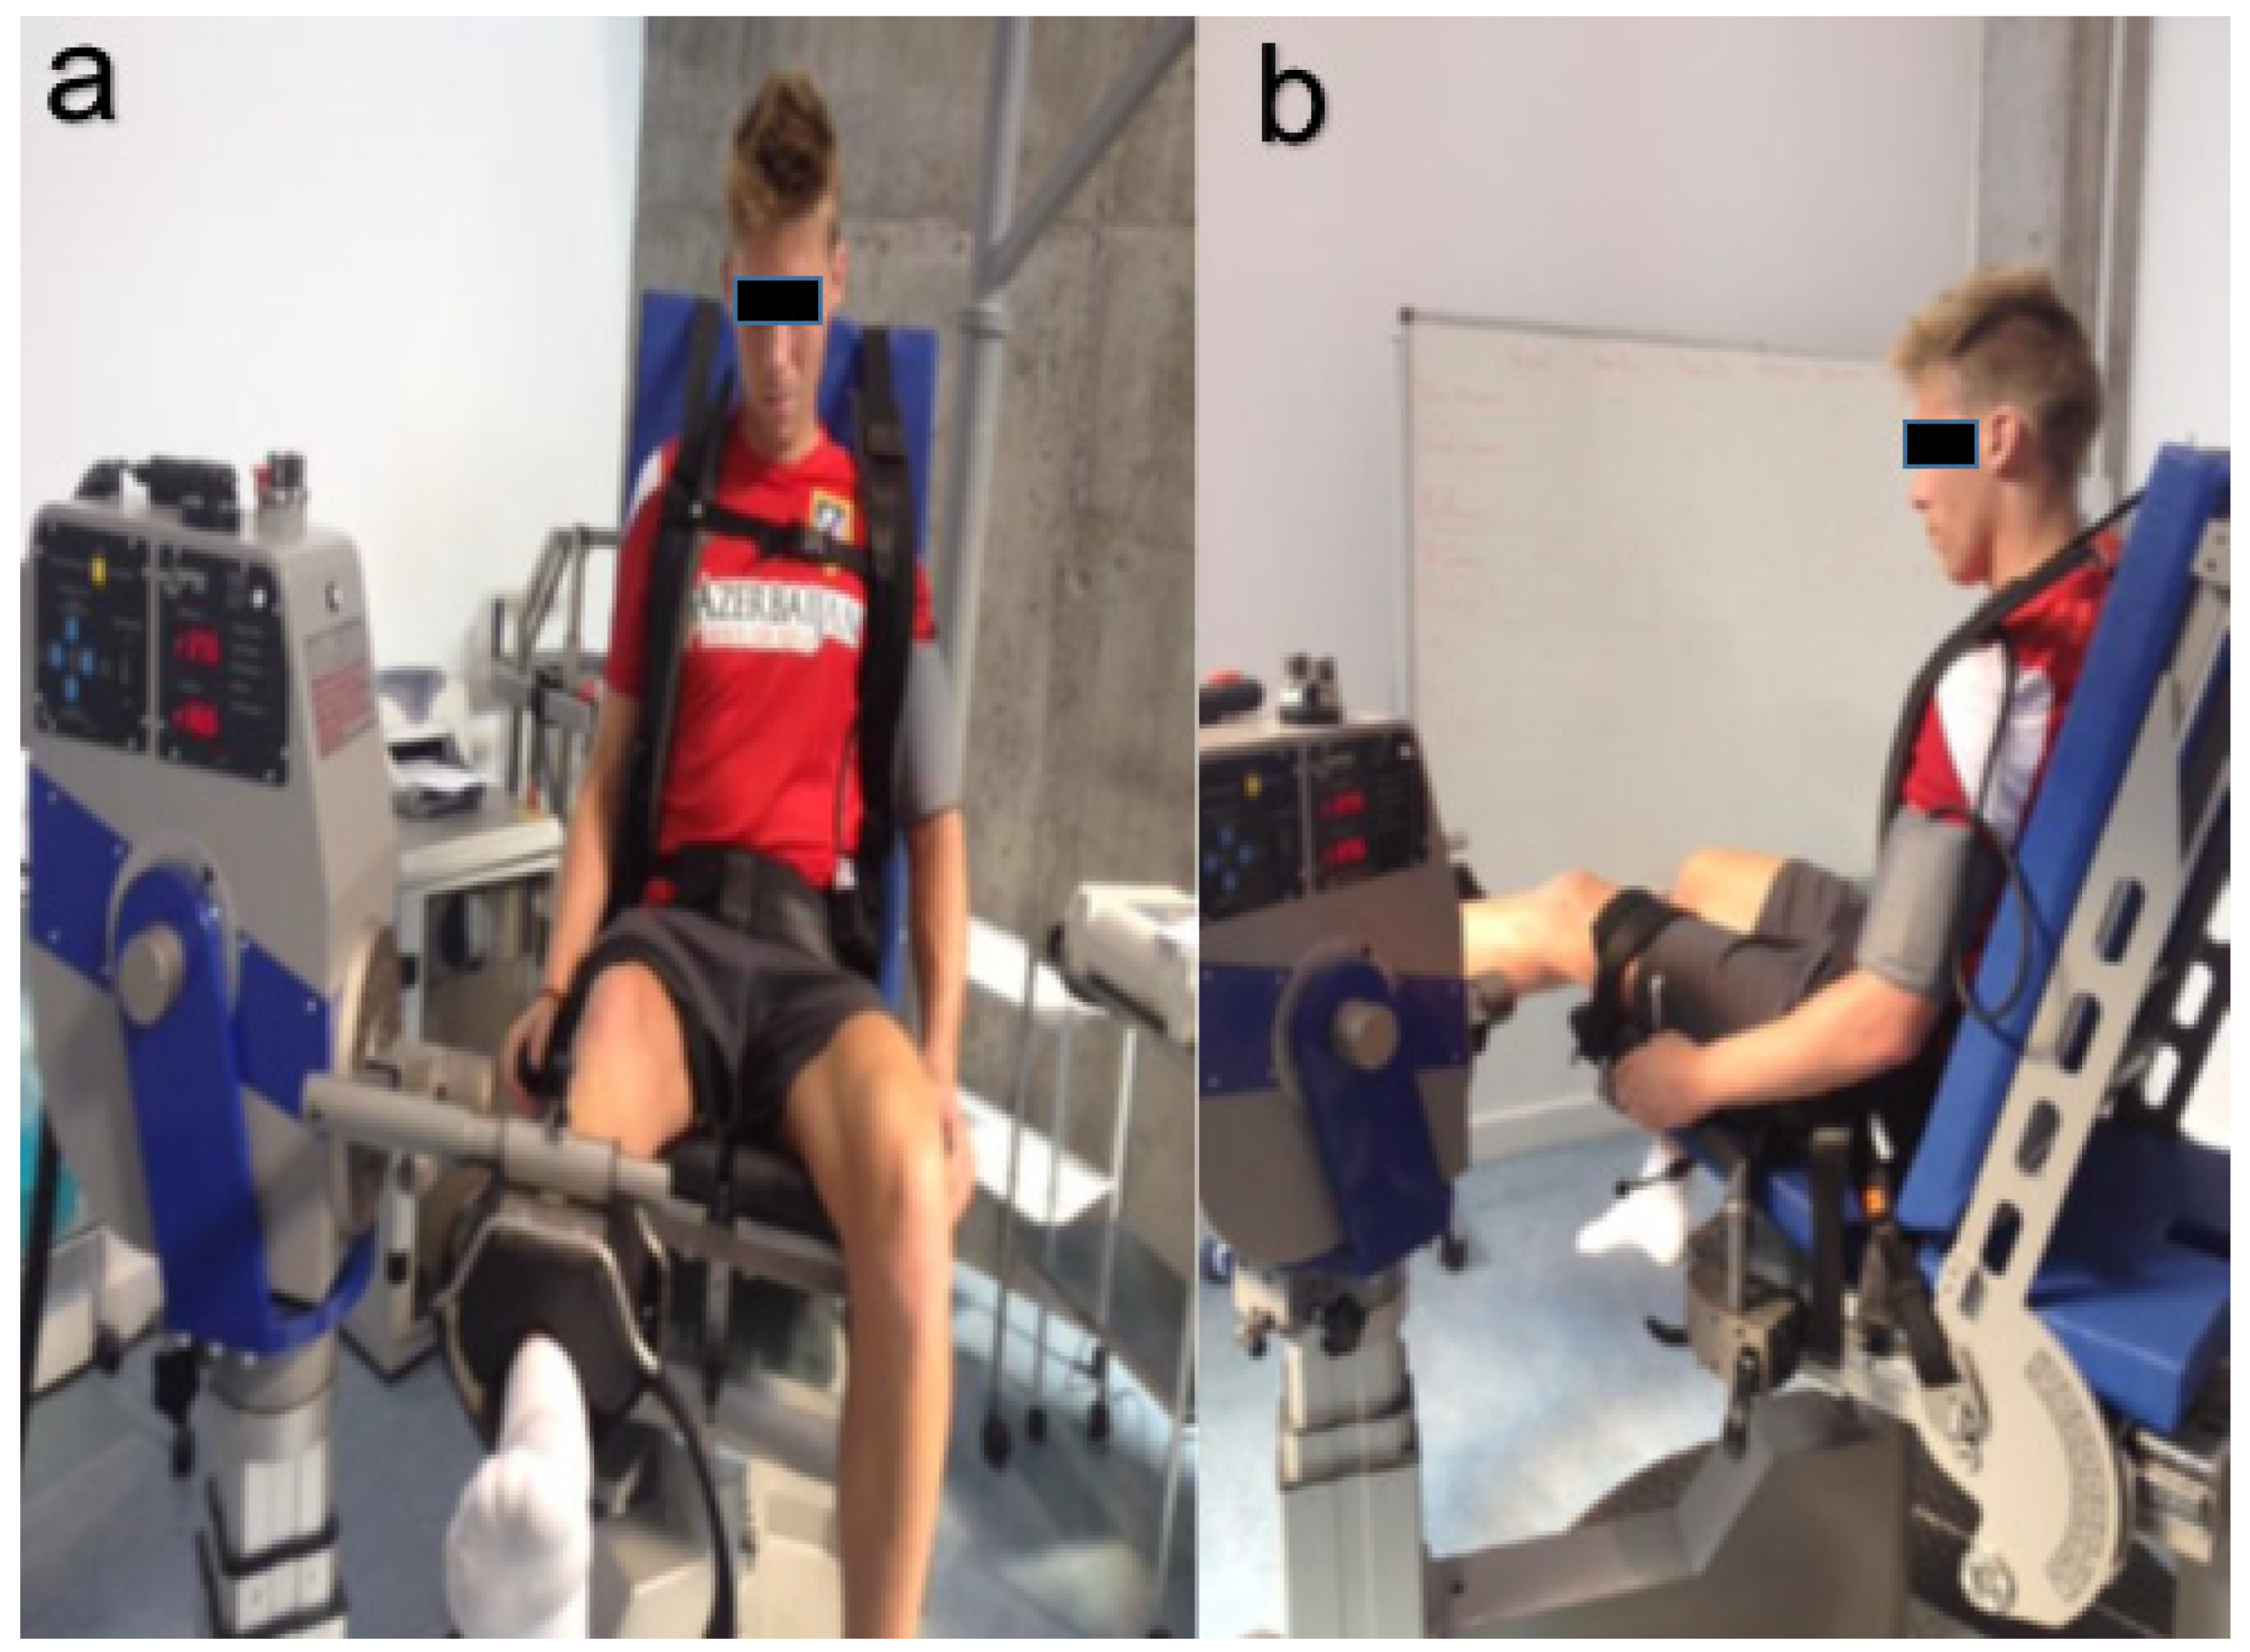
2.2. Isokinetic Testing Protocol Description
2.3. Treadmill Ergospirometry Test Description
2.4. Statistical Analyses
3. Results
Descriptive
4. Discussion
4.1. Heart Rate
4.2. Blood Pressure
5. Conclusions
Author Contributions
Funding
Institutional Review Board Statement
Informed Consent Statement
Data Availability Statement
Acknowledgments
Conflicts of Interest
References
- Kunz, M. “265 Million Playing Football” Big Count Survey. FIFA Magazine, July 2007; 10–15. [Google Scholar]
- Ekblom, B. Applied physiology of soccer. Sports Med. 1986, 3, 50–60. [Google Scholar] [CrossRef]
- Bangsbo, J.; Nørregaard, L.; Thorsø, F. Activity profile of competition soccer. Can. J. Sport Sci. 1991, 16, 110–116. [Google Scholar]
- Bangsbo, J.; Iaia, F.M.; Krustrup, P. Metabolic Response and Fatigue in Soccer. Int. J. Sports Physiol. Perform. 2007, 2, 111–127. [Google Scholar] [CrossRef] [Green Version]
- Clemente, F.M.; Couceiro, M.S.; Martins, F.M.L.; Ivanova, M.O.; Mendes, R. Activity profiles of soccer players during the 2010 world cup. J. Hum. Kinet. 2013, 38, 201–211. [Google Scholar] [CrossRef]
- Stølen, T.; Chamari, K.; Castagna, C.; Wisløff, U. Physiology of Soccer. Sport Med. 2005, 35, 501–536. [Google Scholar] [CrossRef]
- Shephard, R.J. Biology and medicine of soccer: An update. J. Sports Sci. 1999, 17, 757–786. [Google Scholar] [CrossRef]
- Aslan, A.; Acikada, C.; Güvenç, A.; Gören, H.; Hazir, T.; Ozkara, A. Metabolic demands of match performance in young soccer players. J. Sports Sci. Med. 2012, 11, 170–179. [Google Scholar]
- Reilly, T. Aspectos fisiológicos del futbol. Actual Cienc. Deport. 1996, 4, 1–14. [Google Scholar]
- Baker, J.S.; McCormick, M.C.; Robergs, R.A. Interaction among Skeletal Muscle Metabolic Energy Systems during Intense Exercise. J. Nutr. Metab. 2010, 2010, 905612. [Google Scholar] [CrossRef] [Green Version]
- Maron, B.J.; Doerer, J.J.; Haas, T.S.; Tierney, D.M.; Mueller, F.O. Sudden deaths in young competitive athletes: Analysis of 1866 deaths in the United States, 1980–2006. Circulation 2009, 119, 1085–1092. [Google Scholar] [CrossRef]
- Suárez-Mier, M.P.; Aguilera, B.; Mosquera, R.M.; Sánchez-de-León, M.S. Pathology of sudden death during recreational sports in Spain. Forensic Sci. Int. 2013, 226, 188–196. [Google Scholar] [CrossRef]
- Morentin, B.; Suárez-Mier, M.P.; Monzó, A.; Molina, P.; Lucena, J.S. Sports-related sudden cardiac death due to myocardial diseases on a population from 1–35 years: A multicentre forensic study in Spain. Forensic Sci. Res. 2019, 4, 257–266. [Google Scholar] [CrossRef]
- Metaxas, T.I.; Koutlianos, N.A.; Kouidi, E.J.; Deligiannis, A.P. Comparative study of field and laboratory tests for the evaluation of aerobic capacity in soccer players. J. Strength Cond. Res. 2005, 19, 79–84. [Google Scholar]
- Chamari, K.; Hachana, Y.; Ahmed, Y.; Galy, O.; Sghaïer, F.; Chatard, J.-C.; Hue, O.; Wisløff, U. Field and laboratory testing in young elite soccer players. Br. J. Sports Med. 2004, 38, 191–196. [Google Scholar] [CrossRef]
- O’Reilly, J.; Wong, S.H. The development of aerobic and skill assessment in soccer. Sports Med. 2012, 42, 1029–1040. [Google Scholar] [CrossRef]
- Ramos, J.; Segovia, J.; Lopez-Silvarrey Varela, F. Laboratory Test versus field test in football (soccer) players assessment. Rev. Int. Med. Y Cienc. Act Física Y Deport. 2009, 9, 312–321. [Google Scholar]
- Bangsbo, J.; Mohr, M.; Krustrup, P. Physical and metabolic demands of training and match-play in the elite football player. J. Sports Sci. 2006, 24, 665–674. [Google Scholar] [CrossRef]
- Fousekis, K.; Tsepis, E.; Poulmedis, P.; Athanasopoulos, S.; Vagenas, G. Intrinsic risk factors of non-contact quadriceps and hamstring strains in soccer: A prospective study of 100 professional players. Br. J. Sports Med. 2011, 45, 709–714. [Google Scholar] [CrossRef] [Green Version]
- Della Villa, S.; Boldrini, L.; Ricci, M.; Danelon, F.; Snyder-Mackler, L.; Nanni, G.; Giulio Sergio, R. Clinical outcomes, and return-to-sports participation of 50 soccer players after anterior cruciate ligament reconstruction through a sport-specific rehabilitation protocol. Sports Health 2012, 4, 17–24. [Google Scholar] [CrossRef] [Green Version]
- Pereira, M.T.; Della Villa, S.; Roi, G.S. Isokinetic rehabilitation after anterior cruciate ligament (ACL) reconstruction. Arch. Med. Deport. 2005, 22, 19–25. [Google Scholar]
- Vidmar, M.F.; Baroni, B.M.; Michelin, A.F.; Mezzomo, M.; Lugokenski, R.; Pimentel, G.L.; Silva, M.F. Isokinetic eccentric training is more effective than constant load eccentric training on the quadriceps rehabilitation following anterior cruciate ligament reconstruction: A randomized controlled trial. Braz. J. Phys. Ther. 2020, 24, 424–432. [Google Scholar] [CrossRef]
- Dauty, M.; Potiron-Josse, M.; Rochcongar, P. Consequences and prediction of hamstring muscle injury with concentric and eccentric isokinetic parameters in elite soccer players. Ann. Readapt. Med. Phys. 2003, 46, 601–606. [Google Scholar] [CrossRef]
- Brito, J.; Figueiredo, P.; Fernandes, L.; Seabra, A.; Soares, J.M.; Krustrup, P.; Rebelo, A. Isokinetic strength effects of FIFA’a “The 11+” injury prevention training programme. Isokinet. Exerc. Sci. 2010, 18, 211–215. [Google Scholar] [CrossRef]
- Dauty, M.; Menu, P.; Fouasson-Chailloux, A.; Ferréol, S.; Dubois, C. Prediction of hamstring injury in professional soccer players by isokinetic measurements. Muscles Ligaments Tendons J. 2016, 6, 116–123. [Google Scholar] [CrossRef]
- Rahnama, N.; Lees, A.; Bambaecichi, E. A comparison of muscle strength and flexibility between the preferred and non-preferred leg in English soccer players. Ergonomics 2005, 48, 1568–1575. [Google Scholar] [CrossRef]
- Bogdanis, G.; Kalapotharakos, V. Knee Extension Strength and Hamstrings-to-Quadriceps Imbalances in Elite Soccer Players. Int. J. Sports Med. 2015, 37, 119–124. [Google Scholar] [CrossRef]
- Paul, D.J.; Nassis, G.P. Testing strength and power in soccer players: The application of conventional and traditional methods of assessment. J. Strength Cond. Res. 2015, 29, 1748–1758. [Google Scholar] [CrossRef]
- Marcos, M.A.; Koulla, P.M.; Anthos, Z.I. Preseason maximal aerobic power in professional soccer players among different divisions. J. Strength Cond. Res. 2018, 32, 356–363. [Google Scholar] [CrossRef]
- Horstmann, T.; Mayer, F.; Fischer, J.; Maschmann, J.; Röcker, K.; Dickhuth, H.H. The cardiocirculatory reaction to isokinetic exercises in dependence on the form of exercise and age. Int. J. Sports Med. 1994, 15 (Suppl. S1), S50–S55. [Google Scholar] [CrossRef]
- Thompson, E.; Versteegh, T.H.; Overend, T.J.; Birmingham, T.B.; Vandervoort, A.A. Cardiovascular responses to submaximal concentric and eccentric isokinetic exercise in older adults. J. Aging Phys. Act. 1999, 7, 20–31. [Google Scholar] [CrossRef]
- Kleiner, D.M.; Blessing, D.L.; Mitchell, J.W.; Davis, W.R. A Description of the Acute Cardiovascular Responses to Isokinetic Resistance at Three Different Speeds. J. Strength Cond. Res. 1999, 13, 360–366. [Google Scholar]
- Okamoto, T.; Masuhara, M.; Ikuta, K. Cardiovascular responses induced during high-intensity eccentric and concentric isokinetic muscle contraction in healthy young adults. Clin. Physiol. Funct. Imaging 2006, 26, 39–44. [Google Scholar] [CrossRef]
- Lamotte, M.; Chevalier, A.; Jamon, A.; Brassine, E.; Van De Borne, P. Hemodynamic response of an isokinetic testing and training session. Isokinet. Exerc. Sci. 2009, 17, 135–143. [Google Scholar] [CrossRef]
- Czamara, A.; Krzemińska, A.; Szuba, L. The influence of exercises under isokinetic conditions on heart rate in males aged between 40 and 51. Acta Bioeng. Biomech. 2011, 13, 95–104. [Google Scholar] [PubMed]
- GRANMO. Sample Size and Power Calculator. 2012. Available online: https://www.imim.cat/ofertadeserveis/software-public/granmo/ (accessed on 15 June 2020).
- UEFA. UEFA Medical Regulations; UEFA: Nyon, Switzerland, 2017; pp. 1–20. [Google Scholar]
- American College of Sports Medicine. ACSM’s Resource Manual for Guidelines for Exercise Testing and Prescription; 7a. Lippincot Williams and Wilkins; Wolters Kluwer Health: Philadelphia, PA, USA, 2013; 896p. [Google Scholar]
- Myers, J.; Arena, R.; Franklin, B.; Pina, I.; Kraus, W.E.; McInnis, K.; Balady, G.J. Recommendations for clinical exercise laboratories: A scientific statement from the american heart association. Circulation 2009, 119, 3144–3161. [Google Scholar] [CrossRef] [Green Version]
- AEMEF. AEMEF Protocol: Medical Examination in the Transfer of Professional Football Players; AEMEF: Bilbao, Spain, 2014; pp. 1–13. [Google Scholar]
- Magnusson, S.P.; Geismar, R.A.; Gleim, G.W.; Nicholas, J.A. The effect of stabilization on isokinetic knee extension and flexion torque production. J. Athl. Train. 1993, 28, 221–225. [Google Scholar]
- Johnson, J.; Siegel, D. Reliability of an isokinetic movement of the knee extensors. Res. Q 1978, 49, 88–90. [Google Scholar] [CrossRef]
- Perrin, D.H. Reliability of isokinetic measures. Athl. Train. 1986, 21, 319–321. [Google Scholar]
- Hackett, D.A.; Chow, C.-M. The Valsalva maneuver: Its effect on intra-abdominal pressure and safety issues during resistance exercise. J. Strength Cond. Res. 2013, 27, 2338–2345. [Google Scholar] [CrossRef]
- Baltzopoulos, V.; Williams, J.G.; Brodie, D.A. Sources of error in isokinetic dynamometry: Effects of visual feedback on maximum torque. J. Orthop. Sports Phys. Ther. 1991, 13, 138–142. [Google Scholar] [CrossRef] [Green Version]
- Kellis, E.; Baltzopoulos, V. Resistive eccentric exercise: Effects of visual feedback on maximum moment of knee extensors and flexors. J. Orthop. Sports Phys. Ther. 1996, 23, 120–124. [Google Scholar] [CrossRef] [Green Version]
- Eniseler, N.; Sahan, C.; Vurgun, H.; Mavi, H.F. Isokinetic Strength Responses to Season-long Training and Competition in Turkish Elite Soccer Players. J. Hum. Kinet. 2012, 31, 159–168. [Google Scholar] [CrossRef] [Green Version]
- Lehnert, M.; Xaverová, Z.; Croix, M.D.S. Changes in Muscle Strength in U19 Soccer Players during an Annual Training Cycle. J. Hum. Kinet. 2014, 42, 175–185. [Google Scholar] [CrossRef] [PubMed] [Green Version]
- Segovia, J.; López-Silvarrey, F.; Ramos, J.; Legido Arce, J. Valoración funcional en el fútbol. In El fútbol: Valoración Clínica y Funcional; Segovia, J., Ramos, J., López-Silvarrey, F., Eds.; Fundación Instituto SEK: Madrid, Spain, 2013; pp. 191–238. [Google Scholar]
- Ramos, J. Valoración Ergoespirométrica en Futbolistas Profesionales: Estudio de la Recuperación Tras Prueba de Esfuerzo Máxima; Universidad Complutense de Madrid: Madrid, Spain, 2007. [Google Scholar]
- Bishop, D. Warm up II: Performance changes following active warm up and how to structure the warm up. Sports Med. 2003, 33, 483–498. [Google Scholar] [CrossRef]
- Bishop, D. Warm up I: Potential mechanisms and the effects of passive warm up on exercise performance. Sports Med. 2003, 33, 439–454. [Google Scholar] [CrossRef] [PubMed]
- Fletcher, G.F.; Ades, P.A.; Kligfield, P.; Arena, R.; Balady, G.J.; Bittner, V.A.; Coke, L.A.; Fleg, J.L.; Forman, D.E.; Gerber, T.C.; et al. Exercise standards for testing and training: A scientific statement from the American heart association. Circulation 2013, 128, 873–934. [Google Scholar] [CrossRef]
- Gibbons, R.J.; Balady, G.J.; Bricker, J.T.; Chaitman, B.R.; Fletcher, G.F.; Froelicher, V.F.; Mark, D.B.; McCallister, B.D.; Mooss, A.N.; O’Reilly, M.G.; et al. ACC/AHA 2002 guideline update for exercise testing: Summary article. A report of the American College of Cardiology/American Heart Association Task Force on Practice Guidelines (Committee to Update the 1997 Exercise Testing Guidelines). J. Am. Coll. Cardiol. 2002, 40, 1531–1540. [Google Scholar] [CrossRef] [Green Version]
- Sieira, M.C.; Ricart, A.O.; Estrany, R.S. Respuesta de la tensión arterial a la prueba de esfuerzo. Apunt. Med. Esport. 2010, 45, 191–200. [Google Scholar] [CrossRef]
- Morris, S.N.; Phillips, J.F.; Jordan, J.W.; McHenry, P.L. Incidence and significance of decreases in systolic blood pressure during graded treadmill exercise testing. Am. J. Cardiol. 1978, 41, 221–226. [Google Scholar] [CrossRef]
- Tanaka, H.; Bassett, D.R.; Turner, M.J. Exaggerated blood pressure response to maximal exercise in endurance-trained individuals. Am. J. Hypertens. 1996, 9, 1099–1103. [Google Scholar] [CrossRef] [Green Version]
- Turmel, J.; Poirier, P.; Bougault, V.; Blouin, E.; Belzile, M.; Boulet, L.-P. Cardiorespiratory screening in elite endurance sports athletes: The Quebec study. Phys. Sportsmed. 2012, 40, 55–65. [Google Scholar] [CrossRef]
- Holland, D.; Sacre, J.; McFarlane, S.; Coombes, J.; Sharman, J. Pulse wave analysis is a reproducible technique for measuring central blood pressure during hemodynamic perturbations induced by exercise. Am. J. Hypertens. 2008, 21, 1100–1106. [Google Scholar] [CrossRef] [Green Version]
- Douris, P.C. Cardiovascular responses to velocity-specific isokinetic exercise. J. Orthop. Sports Phys. Ther. 1991, 13, 28–32. [Google Scholar] [CrossRef]
- Kleiner, D.M. The effects of manipulating the speed of maximal isokinetic resistance training on heart rate. Med. Sci. Sport Exerc. 1990, 22, 45. [Google Scholar] [CrossRef]
- Quitério, R.J.; Melo, R.C.; Takahashi, A.C.M.; Aniceto, I.a.V.; Silva, E.; Catai, A.M. Torque, myoeletric sygnal and heart rate responses during concentric and eccentric exercises in older men. Rev. Bras. Fisioter. 2011, 15, 8–14. [Google Scholar] [CrossRef] [PubMed] [Green Version]
- Lamotte, M.; Fournier, F.; Vanissum, A.; van de Borne, P. Influence of rest period duration between successive muscular strength sets on acute modifications of blood pressure and heart rate in the healthy subject. Isokinet. Exerc. Sci. 2006, 14, 1–6. [Google Scholar] [CrossRef]
- Kleiner, D.M.; Blessing, D.L.; Davis, W.R.; Mitchell, J.W. Acute Cardiovascular Responses to Various Forms of Resistance Exercise. J. Strength Cond. Res. 1996, 10, 56–61. [Google Scholar]
- Gür, H.; Akova, B.; Pündük, Z.; Küçükoğlu, S. Effects of age on the reciprocal peak torque ratios during knee muscle contractions in elite soccer players. Scand. J. Med. Sci. Sports 1999, 9, 81–87. [Google Scholar] [CrossRef] [PubMed]
- Śliwowski, R.; Grygorowicz, M.; Hojszyk, R.; Jadczak, Ł. The isokinetic strength profile of elite soccer players according to playing position. PLoS ONE 2017, 12, e0182177. [Google Scholar] [CrossRef] [Green Version]
- Hayashi, N.; Koba, S.; Yoshida, T. The effect of muscle contraction velocity on cardiorespiratory responses to repetitive isokinetic exercise in humans. Jpn. J. Physiol. 2003, 53, 327–333. [Google Scholar] [CrossRef] [Green Version]
- Overend, T.J.; Versteegh, T.H.; Thompson, E.; Birmingham, T.B.; Vandervoort, A.A. Cardiovascular stress associated with concentric and eccentric isokinetic exercise in young and older adults. J. Gerontol. A Biol. Sci. Med. Sci. 2000, 55, B177–B182. [Google Scholar] [CrossRef] [Green Version]
- Haff, G.; Dumke, C. Laboratory Manual for Exercise Physiology with Web Resource; Human Kinetics: Champaign, IL, USA, 2012; p. 464. [Google Scholar]
- Le, V.-V.; Mitiku, T.; Sungar, G.; Myers, J.; Froelicher, V. The blood pressure response to dynamic exercise testing: A systematic review. Prog. Cardiovasc. Dis. 2008, 51, 135–160. [Google Scholar] [CrossRef]
- Freedson, P.; Chang, B.; Katch, F.; Kroll, W.; Rippe, J.; Alpert, J.S.; Byrnes, W. Intraarterial blood pressure during free weight and hydraulic resistive exercise. Med. Sci. Sport Exerc. 1984, 16, 131. [Google Scholar] [CrossRef]
- Vincenzi da Silva, E.; Pila Hernández, H.; Estévez Perera, A. Comportamiento de Parámetros Cardiovasculares Durante Evaluaciones Isocinética de Rodilla en Deportistas de Alto Rendimiento de Balonmano; INDER: La Habana, Cuba, 2008. [Google Scholar]
- Narloch, J.A.; Brandstater, M.E. Influence of breathing technique on arterial blood pressure during heavy weight lifting. Arch. Phys. Med. Rehabil. 1995, 76, 457–462. [Google Scholar] [CrossRef]
- Palatini, P.; Mos, L.; Munari, L.; Valle, F.; Del Torre, M.; Rossi, A.; Varotto, L.; Macor, F.; Martina, S.; Pessina, A.C.; et al. Blood pressure changes during heavy-resistance exercise. J. Hypertens Suppl. 1989, 7, S72–S73. [Google Scholar] [CrossRef]
- Sale, D.G.; Moroz, D.E.; McKelvie, R.S.; MacDougall, J.D.; McCartney, N. Comparison of blood pressure response to isokinetic and weight-lifting exercise. Eur. J. Appl. Physiol. Occup. Physiol. 1993, 67, 115–120. [Google Scholar] [CrossRef]
- Iellamo, F.; Legramante, J.M.; Raimondi, G.; Castrucci, F.; Damiani, C.; Foti, C.; Peruzzi, G.; Caruso, I. Effects of isokinetic, isotonic and isometric submaximal exercise on heart rate and blood pressure. Eur. J. Appl. Physiol. Occup. Physiol. 1997, 75, 89–96. [Google Scholar] [CrossRef] [PubMed]
- Huggett, D.L.; Elliott, I.D.; Overend, T.J.; Vandervoort, A.A. Comparison of heart-rate and blood-pressure increases during isokinetic eccentric versus isometric exercise in older adults. J. Aging Phys. Act. 2004, 12, 157–169. [Google Scholar] [CrossRef] [Green Version]
- Chapman, J.H.; Elliott, P.W. Cardiovascular effects of static and dynamic exercise. Eur. J. Appl. Physiol. Occup. Physiol. 1988, 58, 152–157. [Google Scholar] [CrossRef]
- Weippert, M.; Behrens, K.; Rieger, A.; Stoll, R.; Kreuzfeld, S. Heart rate variability and blood pressure during dynamic and static exercise at similar heart rate levels. PLoS ONE 2013, 8, e83690. [Google Scholar] [CrossRef]
- Di Blasio, A.; Sablone, A.; Civino, P.; D’Angelo, E.; Gallina, S.; Ripari, P. Arm vs. Combined Leg and Arm Exercise: Blood Pressure Responses and Ratings of Perceived Exertion at the Same Indirectly Determined Heart Rate. J. Sports Sci. Med. 2009, 8, 401–409. [Google Scholar]
- MacDougall, J.D.; Tuxen, D.; Sale, D.G.; Moroz, J.R.; Sutton, J.R. Arterial blood pressure response to heavy resistance exercise. J. Appl. Physiol. 1985, 58, 785–790. [Google Scholar] [CrossRef] [PubMed] [Green Version]
- Kaşikçioğlu, E.; Oflaz, H.; Akhan, H.; Kayserilioğlu, A.; Umman, S. Peak pulse pressure during exercise and left ventricular hypertrophy in athletes. Anadolu. Kardiyol. Derg. 2005, 5, 64–65. [Google Scholar]
- Rawlins, J.; Bhan, A.; Sharma, S. Left ventricular hypertrophy in athletes. Eur. J. Echocardiogr. 2009, 10, 350–356. [Google Scholar] [CrossRef] [PubMed] [Green Version]
- Metaxas, T.; Sendelides, T.; Koutlianos, N.; Mandroukas, K. Seasonal variation of aerobic performance in soccer players according to positional role. J. Sports Med. Phys. Fit. 2006, 46, 520–525. [Google Scholar]
- Lago-Peñas, C.; Casais, L.; Dellal, A.; Rey, E.; Domínguez, E. Anthropometric and physiological characteristics of young soccer players according to their playing positions: Relevance for competition success. J. Strength Cond. Res. 2011, 25, 3358–3367. [Google Scholar] [CrossRef]
- Sales, M.M.; Brownec, R.A.V.; Asanod, R.Y.; Olher, R.; dos Reis, V.; Vila Novad, J.; Moraese; Simões, H.G. Physical fitness and anthropometric characteristics in professional soccer players of the United Arab Emirates. Rev. Andal. Med. Deport. 2014, 7, 106–110. [Google Scholar] [CrossRef] [Green Version]
- Di Paco, A.; Catapano, G.a.; Vagheggini, G.; Mazzoleni, S.; Micheli, M.L.; Ambrosino, N. Ventilatory response to exercise of elite soccer players. Multidiscip. Respir. Med. 2014, 9, 20. [Google Scholar] [CrossRef] [PubMed] [Green Version]
- Haennel, R.G.; Snydmiller, G.D.; Teo, K.K.; Greenwood, P.V.; Quinney, H.A.; Kappagoda, C.T. Change in blood pressure and cardiac output during maximal isokinetic exercise. Arch. Phys. Med. Rehabil. 1992, 73, 150–155. [Google Scholar] [PubMed]
- Nelson, R.R.; Gobel, F.L.; Jorgensen, C.R.; Wang, K.; Wang, Y.; Taylor, H.L. Hemodynamic predictors of myocardial oxygen consumption during static and dynamic exercise. Circulation 1974, 50, 1179–1189. [Google Scholar] [CrossRef] [Green Version]
- Moreu-Burgos, J.; Macaya-Miguel, C. Fisiopatología del miocardio isquémico. Importancia de la frecuencia cardiaca. Rev Española Cardiol. 2007, 7 (Suppl. D), 19–25. [Google Scholar] [CrossRef]
- Isner-Horobeti, M.-E.; Dufour, S.P.; Vautravers, P.; Geny, B.; Coudeyre, E.; Richard, R. Eccentric Exercise Training: Modalities, Applications and Perspectives. Sport Med. 2013, 43, 483–512. [Google Scholar] [CrossRef] [PubMed]
- Kitamura, K.; Jorgensen, C.R.; Gobel, F.L.; Taylor, H.L.; Wang, Y. Hemodynamic correlates of myocardial oxygen consumption during upright exercise. J. Appl. Physiol. 1972, 32, 516–522. [Google Scholar] [CrossRef] [PubMed]
- Solomon, K. Blood pressure and heart rate responses to a standard lower limb isokinetic test. Aust. J. Physiother. 1992, 38, 95–102. [Google Scholar] [CrossRef] [Green Version]
- Garcia-Retortillo, S.; Gacto, M.; O’Leary, T.J.; Noon, M.; Hristovski, R.; Balagué, N.; Morris, M.G. Cardiorespiratory coordination reveals training-specific physiological adaptations. Eur. J. Appl. Physiol. 2019, 119, 1701–1709. [Google Scholar] [CrossRef] [PubMed]
- Balagué, N.; Hristovski, R.; Almarcha, M.C.; Garcia-Retortillo, S.; Ivanov, P.C. Network Physiology of Exercise: Vision and Perspectives. Front. Physiol. 2020, 11, 611550. [Google Scholar] [CrossRef]
- Ivanov, P.C. The New Field of Network Physiology: Building the Human Physiolome. Front. Netw. Physiol. 2021, 1, 711778. [Google Scholar] [CrossRef]


| Rest | Post-Bike | RLE 60°/s | RLE 180°/s | RLE 240°/s | LLE 60°/s | LLE 180°/s | LLE 240°/s | |
|---|---|---|---|---|---|---|---|---|
| General (n = 63) | ||||||||
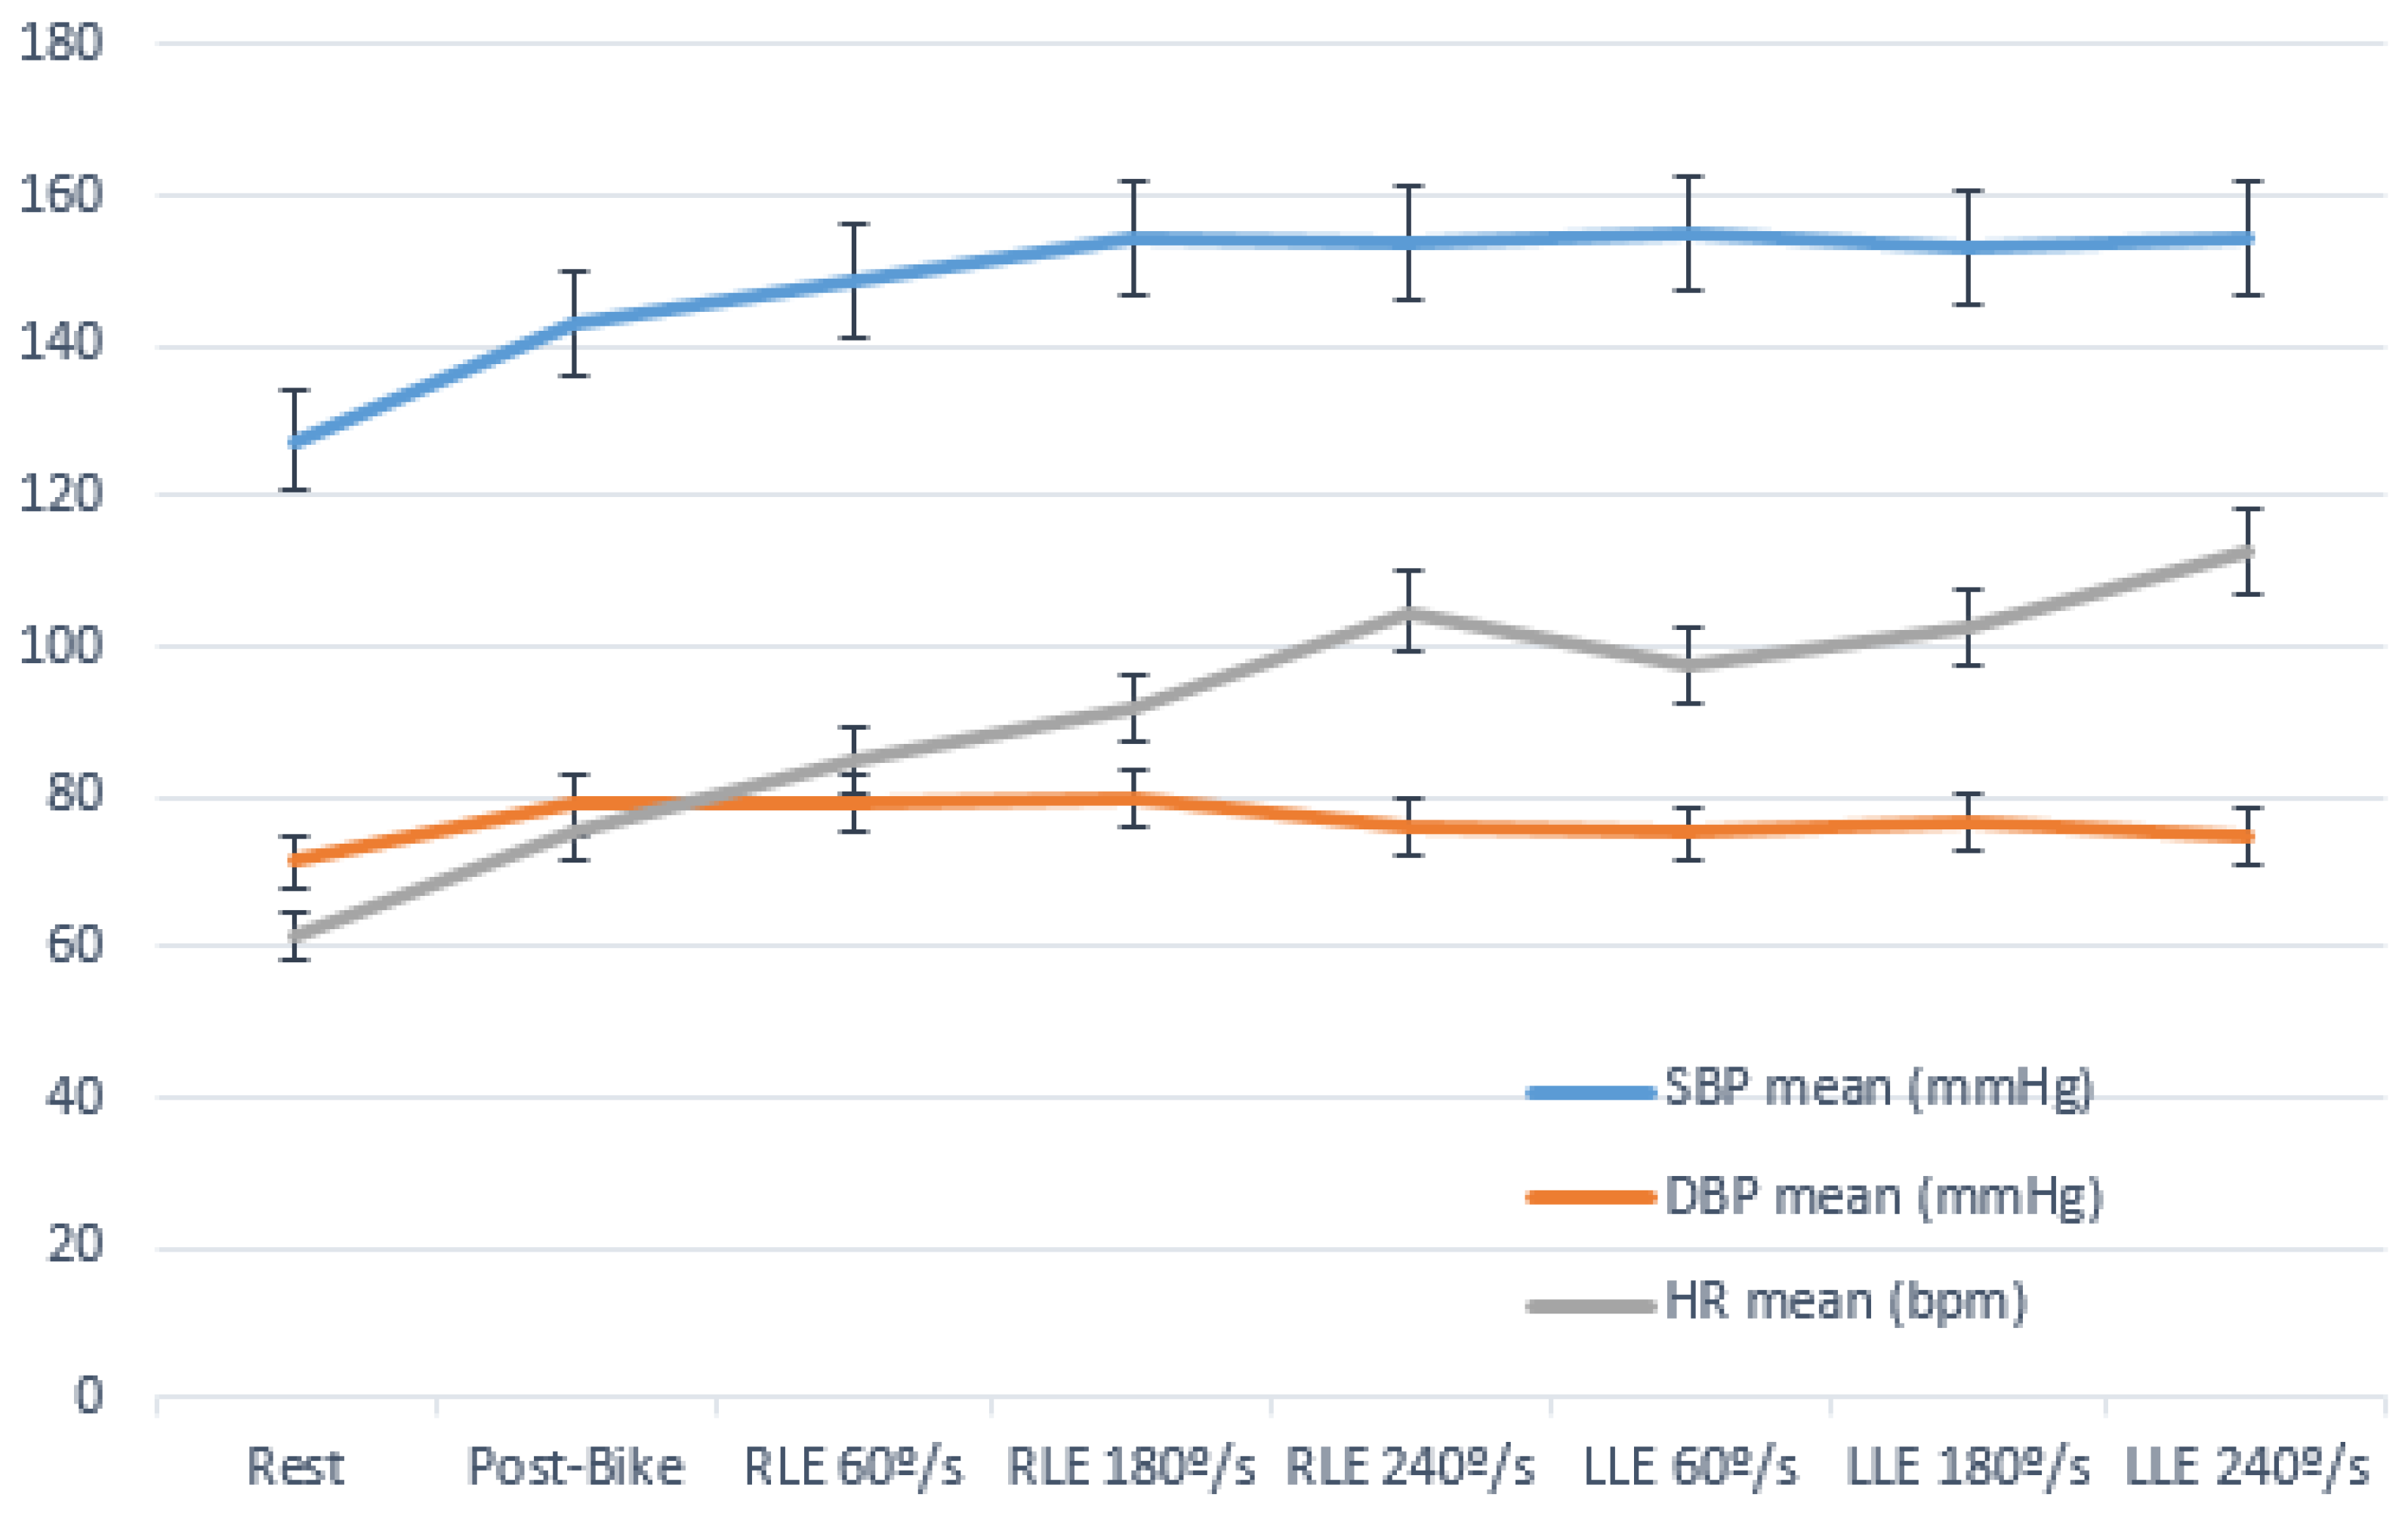
| SBP | 127.8 ± 10.5 (152–102) | 143.6± 12.4 * (181–118) | 149.1 ± 14.7 *† (191–127) | 155.2 ± 15.7 *† (207–119) | 154.7 ± 14.3 *† (187–129) | 155.2 ± 13.7 *† (189–128) | 127.8 ± 10.5 (152–102) | 127.8 ± 10.5 (152–102) |
| DBP | 71.2 ± 8.4 (90–47) | 79.3 ± 8.6 * (101–61) | 79.1 ± 9.9 *‖ (103–57) | 79.5 ± 10.1 ‡‖ʂ (102–58) | 76.4 ± 9.8 ‡ (96–54) | 75.5 ± 10.6 (96–50) | 77.5 ± 10.3 ‡ (94–57) | 74.9 ± 9.9 (93–44) |
| MAP | 90.3 ± 7.4 (108.5–76.5) | 100.7 ± 8.4 * (127.6–82) | 102.4 ± 9.4 * (121.3–85.6) | 104.5 ± 9.4 *† (122–86) | 102.4 ± 8.8 * (125–84.6) | 102 ± 9.7 * (123–78.3) | 102.5 ± 10 * (124–80.3) | 101.2 ± 10 * (127.6–72.3) |
| HR | 61.3 ± 10.4 (92–39) | 74.5 ± 13 ђ (103–45) | 84.1 ± 17.5 ђ (121–48) | 91.2 ± 18.4 ђ (126–49) | 104.3 ± 18.7 ђ (139–65) | 97 ± 19.5 ҂ (141–51) | 102.3 ± 18.3 Ʉ (138–51) | 112.9 ± 18.9 ђ (148–61) |
| RPP | 7860.9 (11,088–4641) | 10,786.1 ђ (16.109–66.72) | 12,602.5 ђ (19.656–6.419) | 14,189.6 ђ (21.452–7.301) | 16,123.6 ђ (25.993–9.417) | 15,140.5 ҂ (24.150–7.191) | 15,798.1 Ʉ (23.046–7.089) | 17,442.3 ђ (26.069–8.784) |
| By Field Position | ||||||||
| Forwards (n = 15) | ||||||||
| SBP | 125.4 ± 8.4 | 142.6 ± 12 | 146.1 ± 13.3 | 151 ± 14.6 | 152.3 ± 12.4 | 150.1 ± 8.9 | 151.8 ± 13.5 | 153.3 ± 14.8 |
| DBP | 69.3 ± 8.3 | 76 ± 8.7 | 77.2 ± 8.7 | 74.5 ± 10 | 71.7 ± 8.8 | 72.8 ± 11 | 78.6 ± 9.4 | 74.3 ± 8.8 |
| MAP | 87.8 ± 7.4 | 98.2 ± 8 | 100.1 ± 8.8 | 99.8 ± 8 | 98.5 ± 8.1 | 98.6 ± 8.5 | 102.9 ± 9.7 | 100.6 ± 10 |
| HR | 61.1 ± 14 | 78.3 ± 17 | 86.9 ± 19.6 | 90.9 ± 17.9 | 106.4 ± 18.3 | 97.1 ± 20.2 | 101.2 ± 21.8 | 109.5 ± 23.1 |
| RPP | 7683.8 | 11,219 | 12,822 | 13,781 | 16,255 | 14,612 | 15,505 | 16,854 |
| Midfielders (n = 25) | ||||||||
| SBP | 130.8 ± 9.5 | 146.7 ± 12.4 | 153.7 ± 17 | 156.3 ± 15.1 | 156.2 ± 16.2 | 156.2 ± 13.7 | 152.9 ± 18 | 158 ± 16.3 |
| DBP | 73.3 ± 7.1 | 79.7 ± 8.6 | 79.1 ± 10.2 | 80.1 ± 9.9 | 77.4 ± 10.8 | 72.9 ± 10.1 | 74.7 ± 10.6 | 72.1 ± 8.4 |
| MAP | 92.3 ± 6.6 | 102 ± 9.2 | 103.4 ± 11.1 | 105.5 ± 9.6 | 103.7 ± 10.8 | 100.6 ± 10.5 | 100.7 ± 11.8 | 100.7 ± 9.9 |
| HR | 59.5 ± 9.2 | 73.6 ± 14.7 | 80.5 ± 15.3 | 87.8 ± 20 | 98.1 ± 20.2 | 90.2 ± 18.4 | 98.3 ± 18.3 | 108.4 ± 19.2 |
| RPP | 7815 | 10,854 | 12,458 | 13,779 | 15,425 | 14,151 | 15,075 | 17,148 |
| Defenders (n = 23) | ||||||||
| SBP | 126.4 ± 12.2 | 139.8 ± 12.5 | 145.2 ± 12.6 | 154.3 ± 13.7 | 152.2 ± 12.3 | 157.6 ± 16 | 154.3 ± 15.5 | 151.4 ± 15.8 |
| DBP | 71.2 ± 8.4 | 80.3 ± 8.6 | 80.4 ± 11.1 | 83 ± 8.8 Ω | 77.9 ± 9.2 | 78.8 ± 10.2 | 77.5 ± 8.8 | 77.4 ± 11.2 |
| MAP | 89.4 ± 7.8 | 100.1 ± 7.8 | 102 ± 8.3 | 106.7 ± 8.6 | 102.6 ± 6.6 | 105.1 ± 9 | 103.1 ± 8.7 | 101.7 ± 10.7 |
| HR | 63.2 ± 8.9 | 74.7 ± 9.9 | 87.5 ± 17.8 | 96.5 ± 16.5 | 110.2 ± 16.1 | 105.5 ± 17.7 # | 107.3 ± 14.8 | 119.1 ± 13.8 |
| RPP | 8019.6 | 10,436 | 12,731 | 14,855 | 16,705 | 16,605 | 16,503 | 17,925 |
| By Competition Level | ||||||||
| 1st team (n = 20) | ||||||||
| SBP | 127.1 ±12.1 | 144 ± 14.4 | 149.4 ± 15.1 | 154.1 ± 15.3 | 153 ± 16.3 | 153.3 ± 16.3 | 151.6 ± 16.1 | 153.9 ± 15.8 |
| DBP | 70.8 ± 8.7 | 78 ± 9.9 | 79.4 ± 12.2 | 81.8 ± 8.6 | 75.8 ± 9.9 | 75.6 ± 10 | 77.1 ± 10 | 76.6 ± 9.6 |
| MAP | 89.4 ± 8.2 | 100 ± 9.6 | 102.7 ± 12.5 | 105.9 ± 7.8 | 101.5 ± 9.3 | 101.5 ± 9.6 | 101.9 ± 9.9 | 102.4 ± 10.3 |
| HR | 64.2 ± 12.5 | 76.4 ± 13.4 | 85.8 ± 17.2 | 92.1 ± 19.4 | 102.8 ± 20.3 | 96.6 ± 21 | 101.2 ± 16.6 | 103 ± 19.1 |
| RPP | 8127.2 ± 1598.7 | 10,996.7 ± 2353.8 | 12,801.6 ± 2753.5 | 14,123.5 ± 3005.2 | 15,723.7 ± 3608.7 | 14,804.7 ± 3643.6 | 15,329.4 ± 2978.4 | 15,908.8 ± 3509.4 |
| 2nd Team (n = 43) | ||||||||
| SBP | 127.7 ± 9.9 | 142.7 ± 11.7 | 148.2 ± 14.9 | 154.3 ± 14.1 | 154.1 ± 12.6 | 156.1 ± 12.4 | 154.9 ± 16.5 | 154.1 ± 15.6 |
| DBP | 71.6 ± 7.6 | 79.5 ± 8.1 | 79 ± 9 | 78.7 ± 10.5 | 76.3 ± 10 | 74.8 ± 11.1 | 75.2 ± 8.5 | 74.4 ± 10.4 |
| MAP | 90.1 ± 7 | 100.5 ± 7.8 | 102 ± 9.1 | 103.8 ± 9.8 | 102.2 ± 8.7 | 101.9 ± 9.8 | 101.7 ± 9.1 | 100.8 ± 10.7 |
| HR | 59.9 ± 9.5 | 74.7 ± 13.7 | 84.2 ± 17.7 | 91.7 ± 18.1 | 105.7 ± 18.2 | 98.2 ± 18.9 | 112.7 ± 16.6 | 112.6 ± 20.2 |
| RPP | 7691.3 ± 1570.9 | 10,694.5 ± 2353.9 | 12,580.1 ± 3309 | 14,206.1 ± 3299.6 | 16,309.9 ± 3132.8 | 15,367.6 ± 3370.7 | 17,419.8 ± 3002.9 | 17,330.1 ± 3429.1 |
| Variable | Rest | Final | ||||
|---|---|---|---|---|---|---|
| Isokinetic | Ergospirometry | p-Value | Isokinetic | Ergospirometry | p-Value | |
| SBP | 127.8 ± 10.5 (152–102) | 117.4 ± 8.5 (138–95) | <0.001 * | 154.6 ± 14.5 (199–119) | 172.4 ± 19.1 (220–120) | <0.001 * |
| DBP | 71.2 ± 8.4 (90–47) | 70.8 ± 8.2 (90–50) | 0.529 | 74.8 ± 10.2 (93–44) | 72.1 ± 12.8 (100–50) | 0.279 |
| MAP | 90.3 ± 7.4 (108.5–76.5) | 86.3 ± 6.8 (101.6–70) | 0.814 | 101.2 ± 10 (127.6–72.3) | 105.5 ± 11.8 (126.6–73.3) | 0.044 * |
| HR | 61.3 ± 10.4 (92–39) | 60.9 ± 10.4 (92–39) | 0.820 | 113.7 ± 19.2 (148–61) | 191.5 ± 7.9 (205–173) | <0.001 * |
| RPP | 7860.9 (11,088–4641) | 7137 ± 1473 (11,960–4410) | <0.001 * | 17,504 ± 3230 (26,069–8784) | 33,143 ± 3852 (22,080–44,000) | <0.001 * |
Publisher’s Note: MDPI stays neutral with regard to jurisdictional claims in published maps and institutional affiliations. |
© 2022 by the authors. Licensee MDPI, Basel, Switzerland. This article is an open access article distributed under the terms and conditions of the Creative Commons Attribution (CC BY) license (https://creativecommons.org/licenses/by/4.0/).
Share and Cite
Pérez-Gosalvez, A.; García-Muro San José, F.; Carrión-Otero, O.; Pérez-Fernández, T.; Fernández-Rosa, L. Blood Pressure and Heart Rate Responses to an Isokinetic Testing Protocol in Professional Soccer Players. J. Clin. Med. 2022, 11, 1539. https://doi.org/10.3390/jcm11061539
Pérez-Gosalvez A, García-Muro San José F, Carrión-Otero O, Pérez-Fernández T, Fernández-Rosa L. Blood Pressure and Heart Rate Responses to an Isokinetic Testing Protocol in Professional Soccer Players. Journal of Clinical Medicine. 2022; 11(6):1539. https://doi.org/10.3390/jcm11061539
Chicago/Turabian StylePérez-Gosalvez, Arturo, Francisco García-Muro San José, Ofelia Carrión-Otero, Tomás Pérez-Fernández, and Luis Fernández-Rosa. 2022. "Blood Pressure and Heart Rate Responses to an Isokinetic Testing Protocol in Professional Soccer Players" Journal of Clinical Medicine 11, no. 6: 1539. https://doi.org/10.3390/jcm11061539