
Conditional Process Analysis for Effective Lens Position According to Preoperative Axial Length

Abstract
:1. Introduction
2. Materials and Methods
- AL ≤ 23.0 mm (n = 144)
- 23.0 mm < AL ≤ 24.5 mm (n = 291)
- 24.5 mm < AL ≤ 26.0 mm (n = 119)
- AL > 26.0 mm (n = 67)
Statistical Analysis
3. Results
4. Discussion
4.1. What Was Known
- The formula that produces high accuracy for postoperative refractive outcomes differs according to preoperative axial length.
- The prediction of effective lens position is the most important process in modern IOL calculation formulas.
4.2. What This Parer Adds
- In conditional process analysis, the ideal model for the prediction of effective lens position varies according to preoperative axial length.
- Structural equation modeling from conditional process analysis is an effective tool for the prediction of an effective lens position.
Author Contributions
Funding
Institutional Review Board Statement
Informed Consent Statement
Data Availability Statement
Conflicts of Interest
References
- Kershner, R.M. Clear corneal cataract surgery and the correction of myopia, hyperopia, and astigmatism. Ophthalmology 1997, 104, 381–389. [Google Scholar] [CrossRef]
- Kohnen, T.; Koch, M.J. Refractive aspects of cataract surgery. Curr. Opin. Ophthalmol. 1998, 9, 55–59. [Google Scholar] [CrossRef] [PubMed]
- Drexler, W.; Findl, O.; Menapace, R.; Rainer, G.; Vass, C.; Hitzenberger, C.; Fercher, A.F. Partial coherence interferometry: A novel approach to biometry in cataract surgery. Am. J. Ophthalmol. 1998, 126, 524–534. [Google Scholar] [CrossRef]
- Norrby, S. Sources of error in intraocular lens power calculation. J. Cataract Refract. Surg. 2008, 34, 368–376. [Google Scholar] [CrossRef]
- Cooke, D.L.; Cooke, T.L. Comparison of 9 intraocular lens power calculation formulas. J. Cataract Refract. Surg. 2016, 42, 1157–1164. [Google Scholar] [CrossRef]
- Melles, R.B.; Holladay, J.T.; Chang, W.J. Accuracy of Intraocular Lens Calculation Formulas. Ophthalmology 2018, 125, 169–178. [Google Scholar] [CrossRef] [Green Version]
- Savini, G.; Hoffer, K.J.; Balducci, N.; Barboni, P.; Schiano-Lomoriello, D. Comparison of formula accuracy for intraocular lens power calculation based on measurements by a swept-source optical coherence tomography optical biometer. J. Cataract Refract. Surg. 2020, 46, 27–33. [Google Scholar]
- Haigis, W. Intraocular lens calculation after refractive surgery for myopia: Haigis-L formula. J. Cataract Refract. Surg. 2008, 34, 1658–1663. [Google Scholar] [CrossRef]
- Sheard, R.M.; Smith, G.T.; Cooke, D.L. Improving the prediction accuracy of the SRK/T formula: The T2 formula. J. Cataract Refract. Surg. 2010, 36, 1829–1834. [Google Scholar] [CrossRef]
- Hirnschall, N.; Amir-Asgari, S.; Maedel, S.; Findl, O. Predicting the postoperative intraocular lens position using continuous intraoperative optical coherence tomography measurements. Investig. Ophthalmol. Vis. Sci. 2013, 54, 5196–5203. [Google Scholar] [CrossRef]
- Norrby, S.; Bergman, R.; Hirnschall, N.; Nishi, Y.; Findl, O. Prediction of the true IOL position. Br. J. Ophthalmol. 2017, 101, 1440–1446. [Google Scholar] [CrossRef]
- Hayes, A.F.; Scharkow, M. The relative trustworthiness of inferential tests of the indirect effect in statistical mediation analysis: Does method really matter? Psychol. Sci. 2013, 24, 1918–1927. [Google Scholar] [CrossRef]
- Hayes, A.F.; Preacher, K.J. Statistical mediation analysis with a multicategorical independent variable. Br. J. Math. Stat. Psychol. 2014, 67, 451–470. [Google Scholar] [CrossRef]
- Hayes, A.F.; Rockwood, N.J. Regression-based statistical mediation and moderation analysis in clinical research: Observations, recommendations, and implementation. Behav. Res. Ther. 2017, 98, 39–57. [Google Scholar] [CrossRef]
- Olsen, T. Calculation of intraocular lens power: A review. Acta Ophthalmol. Scand. 2007, 85, 472–485. [Google Scholar] [CrossRef] [PubMed]
- Hoffer, K.J.; Aramberri, J.; Haigis, W.; Olsen, T.; Savini, G.; Shammas, H.J.; Bentow, S. Protocols for studies of intraocular lens formula accuracy. Am. J. Ophthalmol. 2015, 160, 403–405. [Google Scholar] [CrossRef] [PubMed]
- Melles, R.B.; Kane, J.X.; Olsen, T.; Chang, W.J. Update on Intraocular Lens Calculation Formulas. Ophthalmology 2019, 126, 1334–1335. [Google Scholar] [CrossRef]
- Fernandez-Alvarez, J.C.; Hernandez-Lopez, I.; Cruz-Cobas, P.P.; Cardenas-Diaz, T.; Batista-Leyva, A.J. Using a multilayer perceptron in intraocular lens power calculation. J. Cataract Refract. Surg. 2019, 45, 1753–1761. [Google Scholar] [CrossRef]
- Kohli, M.; Prevedello, L.M.; Filice, R.W.; Geis, J.R. Implementing Machine Learning in Radiology Practice and Research. AJR Am. J. Roentgenol. 2017, 208, 754–760. [Google Scholar] [CrossRef]
- Gavin, E.A.; Hammond, C.J. Intraocular lens power calculation in short eyes. Eye 2008, 22, 935–938. [Google Scholar] [CrossRef] [PubMed] [Green Version]
- Aristodemou, P.; Knox Cartwright, N.E.; Sparrow, J.M.; Johnston, R.L. Formula choice: Hoffer Q, Holladay 1, or SRK/T and refractive outcomes in 8108 eyes after cataract surgery with biometry by partial coherence interferometry. J. Cataract Refract. Surg. 2011, 37, 63–71. [Google Scholar] [CrossRef] [PubMed]
- Wang, J.K.; Hu, C.Y.; Chang, S.W. Intraocular lens power calculation using the IOLMaster and various formulas in eyes with long axial length. J. Cataract Refract. Surg. 2008, 34, 262–267. [Google Scholar] [CrossRef] [PubMed]
- Rosa, N.; Cione, F.; Pepe, A.; Musto, S.; De Bernardo, M. An Advanced Lens Measurement Approach (ALMA) in post refractive surgery IOL power calculation with unknown preoperative parameters. PLoS ONE 2020, 15, e0237990. [Google Scholar] [CrossRef]
- Rosa, N.; Capasso, L.; Romano, A. A new method of calculating intraocular lens power after photorefractive keratectomy. J. Refract. Surg. 2002, 18, 720–724. [Google Scholar] [CrossRef] [PubMed]
- Rosa, N.; De Bernardo, M.; Borrelli, M.; Lanza, M. New factor to improve reliability of the clinical history method for intraocular lens power calculation after refractive surgery. J. Cataract Refract. Surg. 2010, 36, 2123–2128. [Google Scholar] [CrossRef] [PubMed]
- Shammas, H.J.; Shammas, M.C. Improving the preoperative prediction of the anterior pseudophakic distance for intraocular lens power calculation. J. Cataract Refract. Surg. 2015, 41, 2379–2386. [Google Scholar] [CrossRef]
- Hoffer, K.J. The Hoffer Q formula: A comparison of theoretic and regression formulas. (errata, 20, 677 (1994)). J. Cataract Refract. Surg. 1993, 19, 700–712. [Google Scholar] [CrossRef]
- Holladay, J.T.; Prager, T.C.; Chandler, T.Y.; Musgrove, K.H.; Lewis, J.W.; Ruiz, R.S. A three-part system for refining intraocular lens power calculations. J. Cataract Refract. Surg. 1988, 14, 17–24. [Google Scholar] [CrossRef]
- Fyodorov, S.N.; Galin, M.A.; Linksz, A. Calculation of the optical power of intraocular lenses. Investig. Ophthalmol. Vis. Sci. 1975, 14, 625–628. [Google Scholar]
- Retzlaff, J.A.; Sanders, D.R.; Kraff, M.C. Development of the SRK/T intraocular lens implant power calculation formula. (erratum, 528). J. Cataract Refract. Surg. 1990, 16, 333–340. [Google Scholar] [CrossRef]
- Haigis, W. Occurrence of erroneous anterior chamber depth in the SRK/T formula. J. Cataract Refract. Surg. 1993, 19, 442–446. [Google Scholar] [CrossRef]
- Haigis, W.; Lege, B.; Miller, N.; Schneider, B. Comparison of immersion ultrasound biometry and partial coherence interferometry for intraocular lens calculation according to Haigis. Graefes Arch. Clin. Exp. Ophthalmol. 2000, 238, 765–773. [Google Scholar] [CrossRef] [PubMed]
- Reitblat, O.; Levy, A.; Kleinmann, G.; Lerman, T.T.; Assia, E.I. Intraocular lens power calculation for eyes with high and low average keratometry readings: Comparison between various formulas. J. Cataract Refract. Surg. 2017, 43, 1149–1156. [Google Scholar] [CrossRef]
- Plat, J.; Hoa, D.; Mura, F.; Busetto, T.; Schneider, C.; Payerols, A.; Villain, M.; Daien, V. Clinical and biometric determinants of actual lens position after cataract surgery. J. Cataract Refract. Surg. 2017, 43, 195–200. [Google Scholar] [CrossRef]
- Savini, G.; Hoffer, K.J.; Barboni, P. Influence of corneal asphericity on the refractive outcome of intraocular lens implantation in cataract surgery. J. Cataract Refract. Surg. 2015, 41, 785–789. [Google Scholar] [CrossRef] [PubMed]
- Savini, G.; Hoffer, K.J.; Barboni, P.; Schiano Lomoriello, D.; Ducoli, P. Corneal Asphericity and IOL Power Calculation in Eyes With Aspherical IOLs. J. Refract. Surg. 2017, 33, 476–481. [Google Scholar] [CrossRef] [PubMed]
- De Bernardo, M.; Salerno, G.; Cornetta, P.; Rosa, N. Axial Length Shortening after Cataract Surgery: New Approach to Solve the Question. Transl. Vis. Sci. Technol. 2018, 7, 34. [Google Scholar] [CrossRef] [PubMed] [Green Version]


| Model Number from PROCESS Macro [12,13,14] | Case | Mediating Variable | Moderating Variable |
|---|---|---|---|
| 1 | case 1 | ACD | |
| case 2 | K | ||
| 2 | case 1 | ACD and K | |
| 3 | case 1 | ACD as a primary variable K as a secondary variable | |
| case 2 | K as a primary variable ACD as a secondary variable | ||
| 4 | case 1 | ACD | |
| case 2 | K | ||
| case 3 | ACD and K | ||
| 5 | case 1 | ACD | K |
| case 2 | K | ACD | |
| 6 | case 1 | ACD as a first variable K as a second variable | |
| case 2 | K as a first variable ACD as a second variable | ||
| 7 | case 1 | ACD | K as a moderating variable for ACD |
| case 2 | K | ACD as a moderating variable for K | |
| 8 | case 1 | ACD | K as a moderating variable for ACD and ELP |
| case 2 | K | ACD as a moderating variable for K and ELP | |
| 14 | case 1 | ACD | K as a moderating variable in the process from ACD to ELP |
| case 2 | K | ACD as a moderating variable in the process from K to ELP | |
| 15 | case 1 | ACD | K as a moderating variable in the processes from ACD to ELP and from AL to ELP |
| case 2 | K | ACD as a moderating variable in the processes from K to ELP and from AL to ELP | |
| 58 | case 1 | ACD | K as a moderating variable in the processes from AL to ACD and from ACD to ELP |
| case 2 | K | ACD as a moderating variable in the process from AL to K and from K to ELP | |
| 59 | case 1 | ACD | K as a moderating variable in the processes from AL to ACD, from ACD to ELP, and from AL to ELP |
| case 2 | K | ACD as a moderating variable in the process from AL to K, from K to ELP, and from AL to ELP |
| Number | Mean | Min. | Max. | |
|---|---|---|---|---|
| Axial length (mm) | 621 | 24.08 ± 1.54 | 21.41 | 30.60 |
| Anterior chamber depth (mm) | 621 | 3.20 ± 0.41 | 2.02 | 4.29 |
| Mean keratometry (diopter) | 621 | 44.12 ± 1.42 | 40.30 | 49.28 |
| Age | 621 | 69.46 ± 10.20 | 37 | 98 |
| Effective lens position (mm) | 621 | 5.16 ± 0.63 | 3.67 | 8.76 |
| IOL power (diopter) | 621 | 19.98 ± 3.47 | 5.5 | 27.0 |
| Postoperative spherical equivalent of refraction (diopter) | 621 | −0.85 ± 1.06 | −4.13 | 1.00 |
| Number | Mean | Min. | Max. | ||
|---|---|---|---|---|---|
| AL 23.0 mm | AL (mm) | 144 | 22.42 ± 0.39 | 21.41 | 23.00 |
| ACD (mm) | 144 | 2.86 ± 0.34 | 2.23 | 3.68 | |
| K (D) | 144 | 45.26 ± 1.24 | 42.32 | 48.63 | |
| ELP (mm) | 144 | 4.75 ± 0.40 | 3.67 | 5.69 | |
| 23.0 mm < AL 24.5 mm | AL (mm) | 291 | 23.67 ± 0.41 | 23.01 | 24.50 |
| ACD (mm) | 291 | 3.17 ± 0.33 | 2.02 | 4.11 | |
| K (D) | 291 | 43.93 ± 1.23 | 40.82 | 49.28 | |
| ELP (mm) | 291 | 5.02 ± 0.39 | 3.95 | 6.56 | |
| 24.5 mm < AL 26.0 mm | AL (mm) | 119 | 25.05 ± 0.37 | 24.51 | 25.99 |
| ACD (mm) | 119 | 3.43 ± 0.31 | 2.56 | 4.13 | |
| K (D) | 119 | 43.48 ± 1.44 | 40.30 | 47.05 | |
| ELP (mm) | 119 | 5.38 ± 0.48 | 4.21 | 7.05 | |
| AL 26.0 mm | AL (mm) | 67 | 27.50 ± 1.17 | 26.06 | 30.60 |
| ACD (mm) | 67 | 3.64 ± 0.30 | 3.01 | 4.29 | |
| K (D) | 67 | 43.64 ± 1.17 | 40.38 | 45.65 | |
| ELP (mm) | 67 | 6.25 ± 0.76 | 4.98 | 8.76 |
| Regression Formula for ELP Prediction | ||
|---|---|---|
| Haigis Formula | Conditional Process Analysis | |
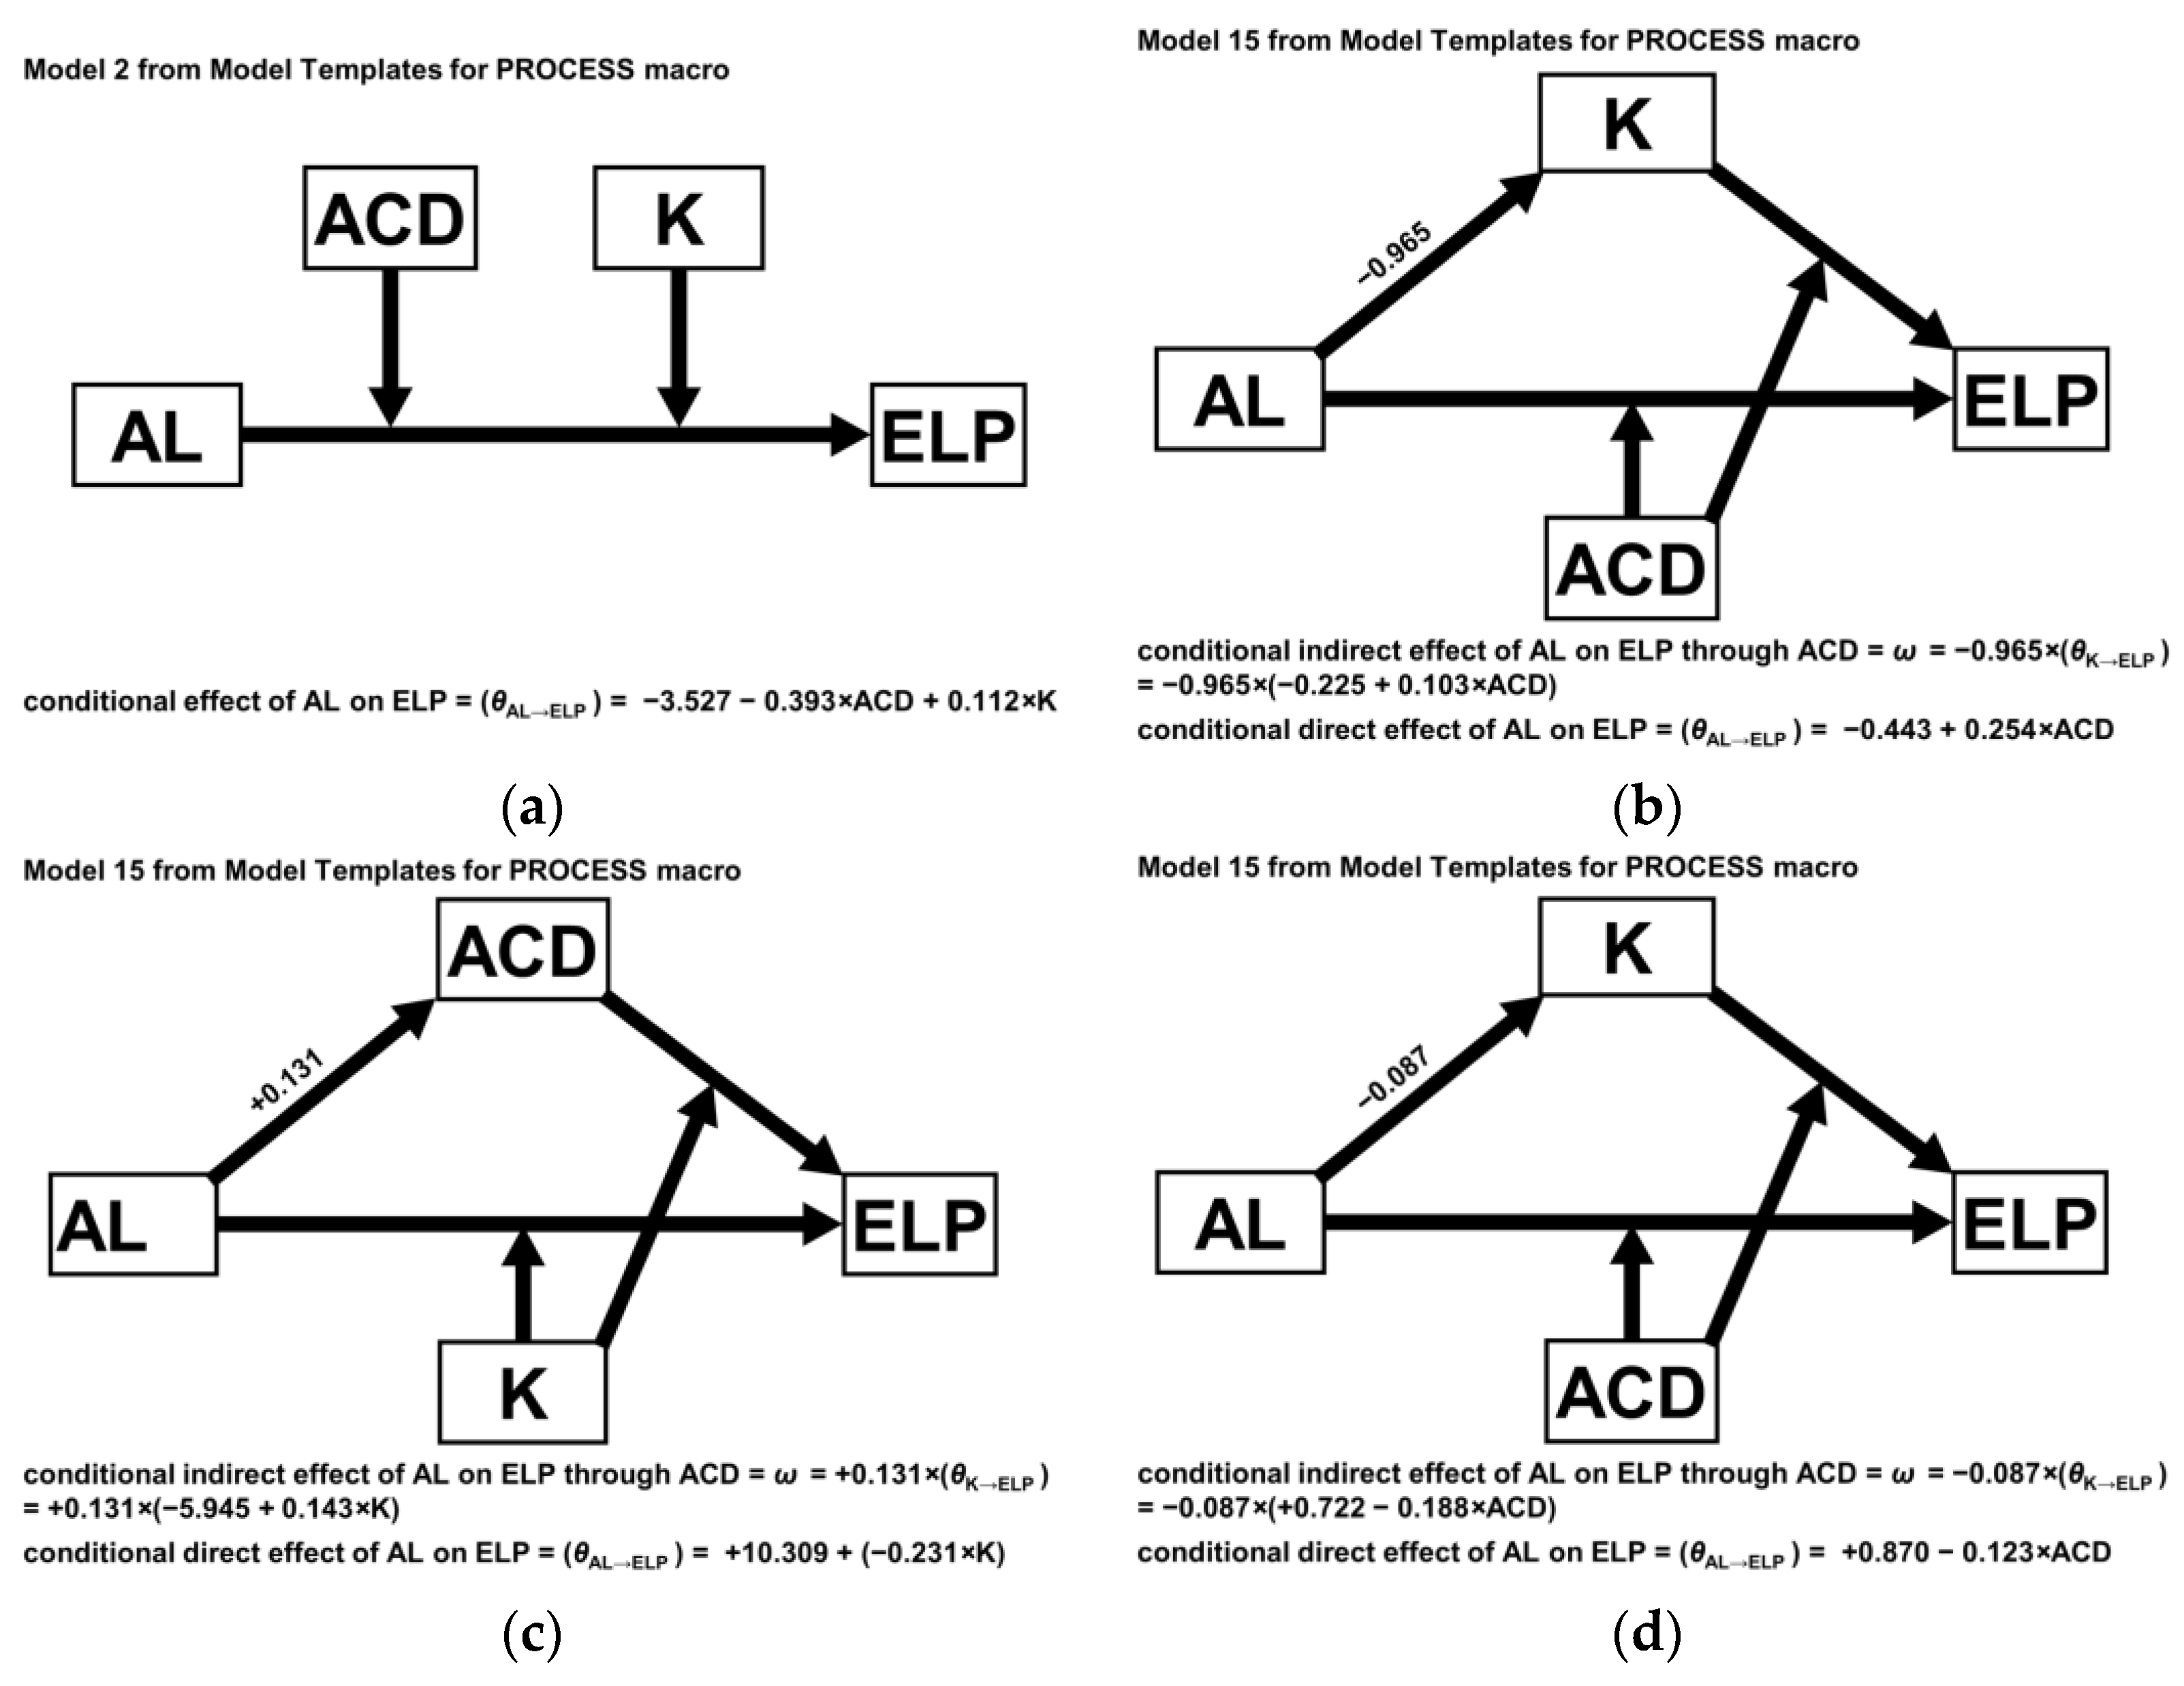
| AL 23.0 mm | −2.123 + 0.288 AL + 0.107 ACD | 78.662 − 3.527 AL + 8.784 ACD − 2.399 K −0.393 AL ACD + 0.112 AL K |
| 23.0 mm < AL 24.5 mm | 25.237 − 0.443 AL − 10.495 ACD − 0.225 K + 0.254 AL ACD + 0.103 ACD K | |
| 24.5 mm < AL 26.0 mm | −236.636 + 10.309 AL − 5.945 ACD + 5.380 K −0.231 AL K + 0.143 ACD K | |
| AL 26.0 mm | −49.768 + 0.870 AL + 11.757 ACD + 0.722 K −0.123 AL ACD − 0.188 ACD K | |
| Haigis Formula | Conditional Process Analysis | ||
|---|---|---|---|
| Mean ELP prediction error (D) | 0.000 ± 0.424 | 0.000 ± 0.396 | |
| Mean prediction error (D) | 0.000 ± 0.521 | 0.000 ± 0.488 | |
| Median absolute error (D) | 0.344 | 0.331 | |
| Mean absolute error (D) | 0.408 ± 0.324 | 0.386 ± 0.299 | |
| Percentages of Eyes within (D) | ±0.25 | 39.1 | 39.8 |
| ±0.50 | 68.6 | 70.9 | |
| ±1.00 | 94.0 | 95.3 | |
Publisher’s Note: MDPI stays neutral with regard to jurisdictional claims in published maps and institutional affiliations. |
© 2022 by the authors. Licensee MDPI, Basel, Switzerland. This article is an open access article distributed under the terms and conditions of the Creative Commons Attribution (CC BY) license (https://creativecommons.org/licenses/by/4.0/).
Share and Cite
Yoo, Y.-S.; Whang, W.-J. Conditional Process Analysis for Effective Lens Position According to Preoperative Axial Length. J. Clin. Med. 2022, 11, 1469. https://doi.org/10.3390/jcm11061469
Yoo Y-S, Whang W-J. Conditional Process Analysis for Effective Lens Position According to Preoperative Axial Length. Journal of Clinical Medicine. 2022; 11(6):1469. https://doi.org/10.3390/jcm11061469
Chicago/Turabian StyleYoo, Young-Sik, and Woong-Joo Whang. 2022. "Conditional Process Analysis for Effective Lens Position According to Preoperative Axial Length" Journal of Clinical Medicine 11, no. 6: 1469. https://doi.org/10.3390/jcm11061469