
Comparison between Two Different Scanners for the Evaluation of the Role of 18F-FDG PET/CT Semiquantitative Parameters and Radiomics Features in the Prediction of Final Diagnosis of Thyroid Incidentalomas

 , , ,
, , ,
Abstract
:1. Introduction
2. Materials and Methods
2.1. Patients Selection
2.2. 18F-FDG PET/CT Acquisition and Interpretation
2.3. Radiomics Features Extraction
2.4. Statistical Analysis
3. Results
3.1. Patients Characteristics
3.2. Comparison between the Two Scanners
3.3. Predictive Accuracy
4. Discussion
5. Conclusions
Author Contributions
Funding
Institutional Review Board Statement
Informed Consent Statement
Data Availability Statement
Conflicts of Interest
References
- DeGroot, L.J.; Kaplan, E.L.; McCormick, M.; Straus, F.H. Natural history, treatment, and course of papillary thyroid carcinoma. J. Clin. Endocrinol. Metab. 1990, 71, 414–424. [Google Scholar] [CrossRef] [PubMed]
- Schlumberger, M.J. Papillary and follicular thyroid carcinoma. N. Engl. J. Med. 1998, 338, 297–306. [Google Scholar] [CrossRef] [PubMed]
- Stokkel, M.P.; Duchateau, C.S.; Dragoiescu, C. The value of FDG-PET in the follow-up of differentiated thyroid cancer: A review of the literature. Q. J. Nucl. Med. Mol. Imaging 2006, 50, 78–87. [Google Scholar] [PubMed]
- Bertagna, F.; Treglia, G.; Piccardo, A.; Giubbini, R. Diagnostic and clinical significance of F-18-FDG-PET/CT thyroid incidentalomas. J. Clin. Endocrinol. Metab. 2012, 97, 3866–3875. [Google Scholar] [CrossRef] [PubMed] [Green Version]
- Filetti, S.; Durante, C.; Hartl, D.; Leboulleux, S.; Locati, L.D.; Newbold, K.; Papotti, M.G.; Berruti, A.; ESMO Guidelines Committee. Thyroid cancer: ESMO Clinical Practice Guidelines for diagnosis, treatment and follow-up. Ann. Oncol. 2019, 30, 1856–1883. [Google Scholar] [CrossRef] [PubMed] [Green Version]
- Vaccarella, S.; Franceschi, S.; Bray, F.; Wild, C.P.; Plummer, M.; Dal Maso, L. Worldwide Thyroid-Cancer Epidemic? The Increasing Impact of Overdiagnosis. N. Engl. J. Med. 2016, 375, 614–617. [Google Scholar] [CrossRef] [PubMed]
- Haugen, B.R.; Alexander, E.K.; Bible, K.C.; Doherty, G.M.; Mandel, S.J.; Nikiforov, Y.E.; Pacini, F.; Randolph, G.W.; Sawka, A.M.; Schlumberger, M.; et al. 2015 American Thyroid Association Management Guidelines for Adult Patients with Thyroid Nodules and Differentiated Thyroid Cancer: The American Thyroid Association Guidelines Task Force on Thyroid Nodules and Differentiated Thyroid Cancer. Thyroid 2016, 26, 1–133. [Google Scholar] [CrossRef] [Green Version]
- Luster, M.; Clarke, S.E.; Dietlein, M.; Lassmann, M.; Lind, P.; Oyen, W.J.; Tennvall, J.; Bombardieri, E. European Association of Nuclear Medicine (EANM). Guidelines for radioiodine therapy of differentiated thyroid cancer. Eur. J. Nucl. Med. Mol. Imaging 2008, 35, 1941–1959. [Google Scholar] [CrossRef]
- Bertagna, F.; Bosio, G.; Biasiotto, G.; Rodella, C.; Puta, E.; Gabanelli, S.; Lucchini, S.; Merli, G.; Savelli, G.; Giubbini, R.; et al. F-18 FDG-PET/CT evaluation of patients with differentiated thyroid cancer with negative I-131 total body scan and high thyroglobulin level. Clin. Nucl. Med. 2009, 34, 756–761. [Google Scholar] [CrossRef]
- Dong, M.J.; Liu, Z.F.; Zhao, K.; Ruan, L.X.; Wang, G.L.; Yang, S.Y.; Sun, F.; Luo, X.G. Value of 18F-FDG-PET/PET-CT in differentiated thyroid carcinoma with radioiodine-negative whole-body scan: A meta-analysis. Nucl. Med. Commun. 2009, 30, 639–650. [Google Scholar] [CrossRef]
- Elzein, S.; Ahmed, A.; Lorenz, E.; Balasubramanian, S.P. Thyroid incidentalomas on PET imaging—Evaluation of management and clinical outcomes. Surgeon 2015, 13, 116–120. [Google Scholar] [CrossRef] [PubMed]
- Bomanji, J.B.; Costa, D.C.; Ell, P.J. Clinical role of positron emission tomography in oncology. Lancet Oncol. 2001, 2, 157–164. [Google Scholar] [CrossRef]
- Chen, Y.K.; Ding, H.J.; Chen, K.T.; Chen, Y.L.; Liao, A.C.; Shen, Y.Y.; Su, C.T.; Kao, C.H. Prevalence and risk of cancer of focal thyroid incidentaloma identified by 18F-fluorodeoxyglucose positron emission tomography for cancer screening in healthy subjects. Anticancer Res. 2005, 25, 1421–1426. [Google Scholar] [PubMed]
- Shi, H.; Yuan, Z.; Yuan, Z.; Yang, C.; Zhang, J.; Shou, Y.; Zhang, W.; Ping, Z.; Gao, X.; Liu, S. Diagnostic Value of Volume-Based Fluorine-18-Fluorodeoxyglucose PET/CT Parameters for Characterizing Thyroid Incidentaloma. Korean J. Radiol. 2018, 19, 342–351. [Google Scholar] [CrossRef] [PubMed] [Green Version]
- Burguera, B.; Gharib, H. Thyroid incidentalomas. Prevalence, diagnosis, significance, and management. Endocrinol. Metab. Clin. N. Am. 2000, 29, 187–203. [Google Scholar] [CrossRef]
- Are, C.; Hsu, J.F.; Schoder, H.; Shah, J.P.; Larson, S.M.; Shaha, A.R. FDG-PET detected thyroid incidentalomas: Need for further investigation? Ann. Surg. Oncol. 2007, 14, 239–247. [Google Scholar] [CrossRef]
- Kim, T.Y.; Kim, W.B.; Ryu, J.S.; Gong, G.; Hong, S.J.; Shong, Y.K. 18F-fluorodeoxyglucose uptake in thyroid from positron emission tomogram (PET) for evaluation in cancer patients: High prevalence of malignancy in thyroid PET incidentaloma. Laryngoscope 2005, 115, 1074–1078. [Google Scholar] [CrossRef]
- Kim, B.H.; Na, M.A.; Kim, I.J.; Kim, S.J.; Kim, Y.K. Risk stratification and prediction of cancer of focal thyroid fluorodeoxyglucose uptake during cancer evaluation. Ann. Nucl. Med. 2010, 24, 721–728. [Google Scholar] [CrossRef]
- Wilson, R.; Devaraj, A. Radiomics of pulmonary nodules and lung cancer. Transl. Lung Cancer Res. 2017, 6, 86–91. [Google Scholar] [CrossRef] [Green Version]
- Albano, D.; Gatta, R.; Marini, M.; Rodella, C.; Camoni, L.; Dondi, F.; Giubbini, R.; Bertagna, F. Role of 18F-FDG PET/CT Radiomics Features in the Differential Diagnosis of Solitary Pulmonary Nodules: Diagnostic Accuracy and Comparison between Two Different PET/CT Scanners. J. Clin. Med. 2021, 10, 5064. [Google Scholar] [CrossRef]
- Ceriani, L.; Milan, L.; Virili, C.; Cascione, L.; Paone, G.; Trimboli, P.; Giovanella, L. Radiomics Analysis of [18F]-Fluorodeoxyglucose-Avid Thyroid Incidentalomas Improves Risk Stratification and Selection for Clinical Assessment. Thyroid 2021, 31, 88–95. [Google Scholar] [CrossRef] [PubMed]
- Aksu, A.; Şen, N.P.K.; Acar, E.; Kaya, G.Ç. Evaluating Focal 18F-FDG Uptake in Thyroid Gland with Radiomics. Nucl. Med. Mol. Imaging 2020, 54, 241–248. [Google Scholar] [CrossRef] [PubMed]
- Sollini, M.; Cozzi, L.; Pepe, G.; Antunovic, L.; Lania, A.; Di Tommaso, L.; Magnoni, P.; Erba, P.A.; Kirienko, M. [18F]FDG-PET/CT texture analysis in thyroid incidentalomas: Preliminary results. Eur. J. Hybrid Imaging 2017, 1, 3. [Google Scholar] [CrossRef] [PubMed] [Green Version]
- Kim, S.J.; Chang, S. Predictive value of intratumoral heterogeneity of F-18 FDG uptake for characterization of thyroid nodules according to Bethesda categories of fine needle aspiration biopsy results. Endocrine 2015, 50, 681–688. [Google Scholar] [CrossRef]
- Boellaard, R.; Delgado-Bolton, R.; Oyen, W.J.; Giammarile, F.; Tatsch, K.; Eschner, W.; Verzijlbergen, F.J.; Barrington, S.F.; Pike, L.C.; Weber, W.A.; et al. FDG PET/CT: EANM procedure guidelines for tumour imaging: Version 2.0. Eur. J. Nucl. Med. Mol. Imaging 2014, 42, 328–354. [Google Scholar] [CrossRef]
- Nioche, C.; Orlhac, F.; Boughdad, S.; Reuzè, S.; Goya-Outi, J.; Robert, C.; Pellot-Barakt, C.; Soussan, M.; Frouin, F.; Buvat, I. LIFEx: A Freeware for Radiomic Feature Calculation in Multimodality Imaging to Accelerate Advances in the Characterization of Tumor Heterogeneity. Cancer Res. 2018, 78, 4786–4789. [Google Scholar] [CrossRef] [Green Version]
- Nardi, F.; Basolo, F.; Crescenzi, A.; Fadda, G.; Frasoldati, A.; Orlandi, F.; Palombini, L.; Papini, E.; Zini, M.; Pontecorvi, A.; et al. Italian consensus for the classification and reporting of thyroid cytology. J. Endocrinol. Investig. 2014, 37, 593–599. [Google Scholar] [CrossRef]
- Reynes-Llompart, G.; Sabatè-Llobera, A.; Linares-Tello, E.; Martì-Climent, J.; Gamez-Cenzano, C. Image quality evaluation in a modern PET system: Impact of new reconstructions methods and a radiomics approach. Sci. Rep. 2019, 9, 10640. [Google Scholar] [CrossRef]
- Ha, S.; Choi, H.; Paeng, J.C.; Cheon, G.J. Radiomics in Oncological PET/CT: A Methodological Overview. Nucl. Med. Mol. Imaging 2019, 53, 14–29. [Google Scholar] [CrossRef]
- Lodge, M.A. Repeatability of SUV in Oncologic 18F-FDG PET. J. Nucl. Med. 2017, 58, 523–532. [Google Scholar] [CrossRef] [Green Version]
- Cook, G.J.R.; Azad, G.; Owczarczyk, K.; Siddique, M.; Goh, V. Challenges and Promises of PET Radiomics. Int. J. Radiat. Oncol. Biol. Phys. 2018, 102, 1083–1089. [Google Scholar] [CrossRef] [PubMed] [Green Version]
- Zwanenburg, A. Radiomics in nuclear medicine: Robustness, reproducibility, standardization, and how to avoid data analysis traps and replication crisis. Eur. J. Nucl. Med. Mol. Imaging 2019, 46, 2638–2655. [Google Scholar] [CrossRef] [PubMed]
- Lovinfosse, P.; Visvikis, D.; Hustinx, R.; Hatt, M. FDG PET radiomics: A review of the methodological aspects. Clin. Transl. Imaging 2018, 6, 379–391. [Google Scholar] [CrossRef]
- Pfaehler, E.; van Sluis, J.; Merema, B.B.J.; van Ooijen, P.; Berendsen, R.C.M.; van Velden, F.H.P.; Boellaard, R. Experimental Multicenter and Multivendor Evaluation of the Performance of PET Radiomic Features Using 3-Dimensionally Printed Phantom Inserts. J. Nucl. Med. 2020, 61, 469–476. [Google Scholar] [CrossRef]


| Semiquantitave Parameters |
|---|
| SUV-related |
| SUVmax |
| SUVmean |
| SUVlbm |
| SUVbsa |
| Volumetric parameters |
| MTV |
| TLG |
| Radiomics features |
| First order features |
| Histogram related |
| Histo skewness |
| Histo kurtosis |
| Histo excess kurtosis |
| Histo entropy_log10 |
| Histo entropy_log2 |
| Histo energy |
| Shape related |
| Shape volume_mL |
| Shape volume_vx |
| Shape sphericity |
| Shape compacity |
| Second order features |
| Grey level co-occurrence matrix (GLCM) related |
| GLCM homogeneity |
| GLCM energy |
| GLCM contrast |
| GLCM correlation |
| GLCM entropy_log10 |
| GLCM entropy_log2 |
| GLCM dissimilarity |
| Grey-level run length matrix (GLRLM) related |
| GLRLM SRE |
| GLRLM LRE |
| GLRLM LGRE |
| GLRLM HGRE |
| GLRLM SRLGE |
| GLRLM SRHGE |
| GLRLM LRLGE |
| GLRLM LRHGE |
| GLRLM GLNU |
| GLRLM RLNU |
| GLRLM RP |
| Neighborhood grey level different matrix (NGLDM) related |
| NGLDM coarseness |
| NGLDM contrast |
| NGLDM busyness |
| Grey-level zone length matrix (GLZLM) related |
| GLZLM SZE |
| GLZLM LZE |
| GLZLM LGZE |
| GLZLM HGZE |
| GLZLM SZLGE |
| GLZLM SZHGE |
| GLZLM LZLGE |
| GLZLM LZHGE |
| GLZLM GLNU |
| GLZLM ZLNU |
| GLZLM ZP |
| Characteristic | N. (%) |
|---|---|
| Age, mean ± SD (range) | 66 ± 14 (16–88) |
| Sex | |
| Male | 72 (33%) |
| Female | 149 (67%) |
| Thyroid Lobe | |
| Right | 123 (56%) |
| Left | 87 (39%) |
| Isthmus | 11 (5%) |
| Ultrasound diameter (mm), mean ± SD (range) | 17 ± 12 (5–75) |
| Final Diagnosis | |
| Benign | 150 (68%) |
| Malign | 71 (32%) |
| Cytology (N. = 118) | |
| TIR2 | 35 (30%) |
| TIR3a | 24 (20%) |
| TIR3b | 30 (25%) |
| TIR4 | 13 (11%) |
| TIR5 | 16 (14%) |
| Histology (N. = 71) | |
| Anaplastic carcinoma | 3 (4%) |
| Follicular carcinoma | 7 (10%) |
| Papillary carcinoma | 61 (86%) |
| PET/CT Scanner | |
| Scanner 1 (Discovery 690) | 128 (58%) |
| Scanner 2 (Discovery STE) | 93 (42%) |
| Semiquantitative PET/CT parameters | |
| SUVmax, mean ± SD (range) | 7.9 ± 8 (1.3–56.7) |
| SUVmean, mean ± SD (range) | 4.3 ± 4 (1.0–37.1) |
| SUVlbm, mean ± SD (range) | 5.8 ± 6 (1.0–41.3) |
| SUVbsa, mean ± SD (range) | 2.0 ± 2 (0.4–12.6) |
| MTV, mean ± SD (range) | 9.2 ± 18 (0.4–198.0) |
| TLG, mean ± SD (range) | 35.0 ± 75 (1.9–722.4) |
| Parameters | p-Value |
|---|---|
| Clinical | |
| Age | 0.787 |
| Sex | 0.522 |
| Diameters at ultrasound | 0.446 |
| Semiquantitative PET/CT parameters | |
| SUVmax | 0.046 |
| SUVmean | 0.118 |
| SUVlbm | 0.119 |
| SUVbsa | 0.076 |
| MTV | 0.595 |
| TLG | 0.869 |
| Radiomics features | |
| Histo skewness | 0.193 |
| Histo kurtosis | 0.924 |
| Histo excess kurtosis | 0.924 |
| Histo entropy_log10 | 0.023 |
| Histo entropy_log2 | 0.024 |
| Histo energy | 0.017 |
| Shape volume_mL | 0.211 |
| Shape volume_vx | 0.560 |
| Shape sphericity | 0.088 |
| Shape compacity | 0.518 |
| GLCM homogeneity | 0.104 |
| GLCM energy | 0.638 |
| GLCM contrast | 0.132 |
| GLCM correlation | 0.889 |
| GLCM entropy_log10 | 0.319 |
| GLCM entropy_log2 | 0.315 |
| GLCM dissimilarity | 0.145 |
| GLRLM SRE | 0.123 |
| GLRLM LRE | 0.113 |
| GLRLM LGRE | 0.026 |
| GLRLM HGRE | 0.069 |
| GLRLM SRLGE | 0.036 |
| GLRLM SRHGE | 0.069 |
| GLRLM LRLGE | 0.098 |
| GLRLM LRHGE | 0.135 |
| GLRLM GLNU | 0.260 |
| GLRLM RLNU | 0.962 |
| GLRLM RP | 0.126 |
| NGLDM coarseness | 0.471 |
| NGLDM contrast | 0.476 |
| NGLDM busyness | 0.006 |
| GLZLM SZE | 0.017 |
| GLZLM LZE | 0.168 |
| GLZLM LGZE | 0.053 |
| GLZLM HGZE | 0.086 |
| GLZLM SZLGE | 0.069 |
| GLZLM SZHGE | 0.041 |
| GLZLM LZLGE | 0.102 |
| GLZLM LZHGE | 0.561 |
| GLZLM GLNU | 0.366 |
| GLZLM ZLNU | 0.026 |
| GLZLM ZP | 0.093 |
| Mean AUC | Mean p-Value | |||||
|---|---|---|---|---|---|---|
| Parameters | Scanner 1 | Scanner 2 | Scanner 1 + 2 | Scanner 1 | Scanner 2 | Scanner 1 + 2 |
| SUVmax | 0.762 | 0.679 | 0.748 | <0.01 | 0.02 | <0.01 |
| SUVmean | 0.724 | 0.675 | 0.748 | <0.01 | <0.01 | <0.01 |
| SUVlbm | 0.757 | 0.685 | 0.748 | <0.01 | 0.01 | <0.01 |
| SUVbsa | 0.756 | 0.689 | 0.742 | <0.01 | 0.01 | <0.01 |
| Histo entropy_log10 | 0.709 | 0.674 | 0.724 | <0.01 | <0.01 | <0.01 |
| Histo entropy_log2 | 0.705 | 0.674 | 0.724 | <0.01 | <0.01 | <0.01 |
| GLCM entropy_log10 | 0.713 | 0.664 | 0.702 | 0.02 | 0.03 | <0.01 |
| GLCM entropy_log2 | 0.712 | 0.664 | 0.703 | 0.02 | 0.03 | <0.01 |
| GLCM dissimilarity | 0.719 | 0.682 | 0.727 | 0.01 | <0.01 | <0.01 |
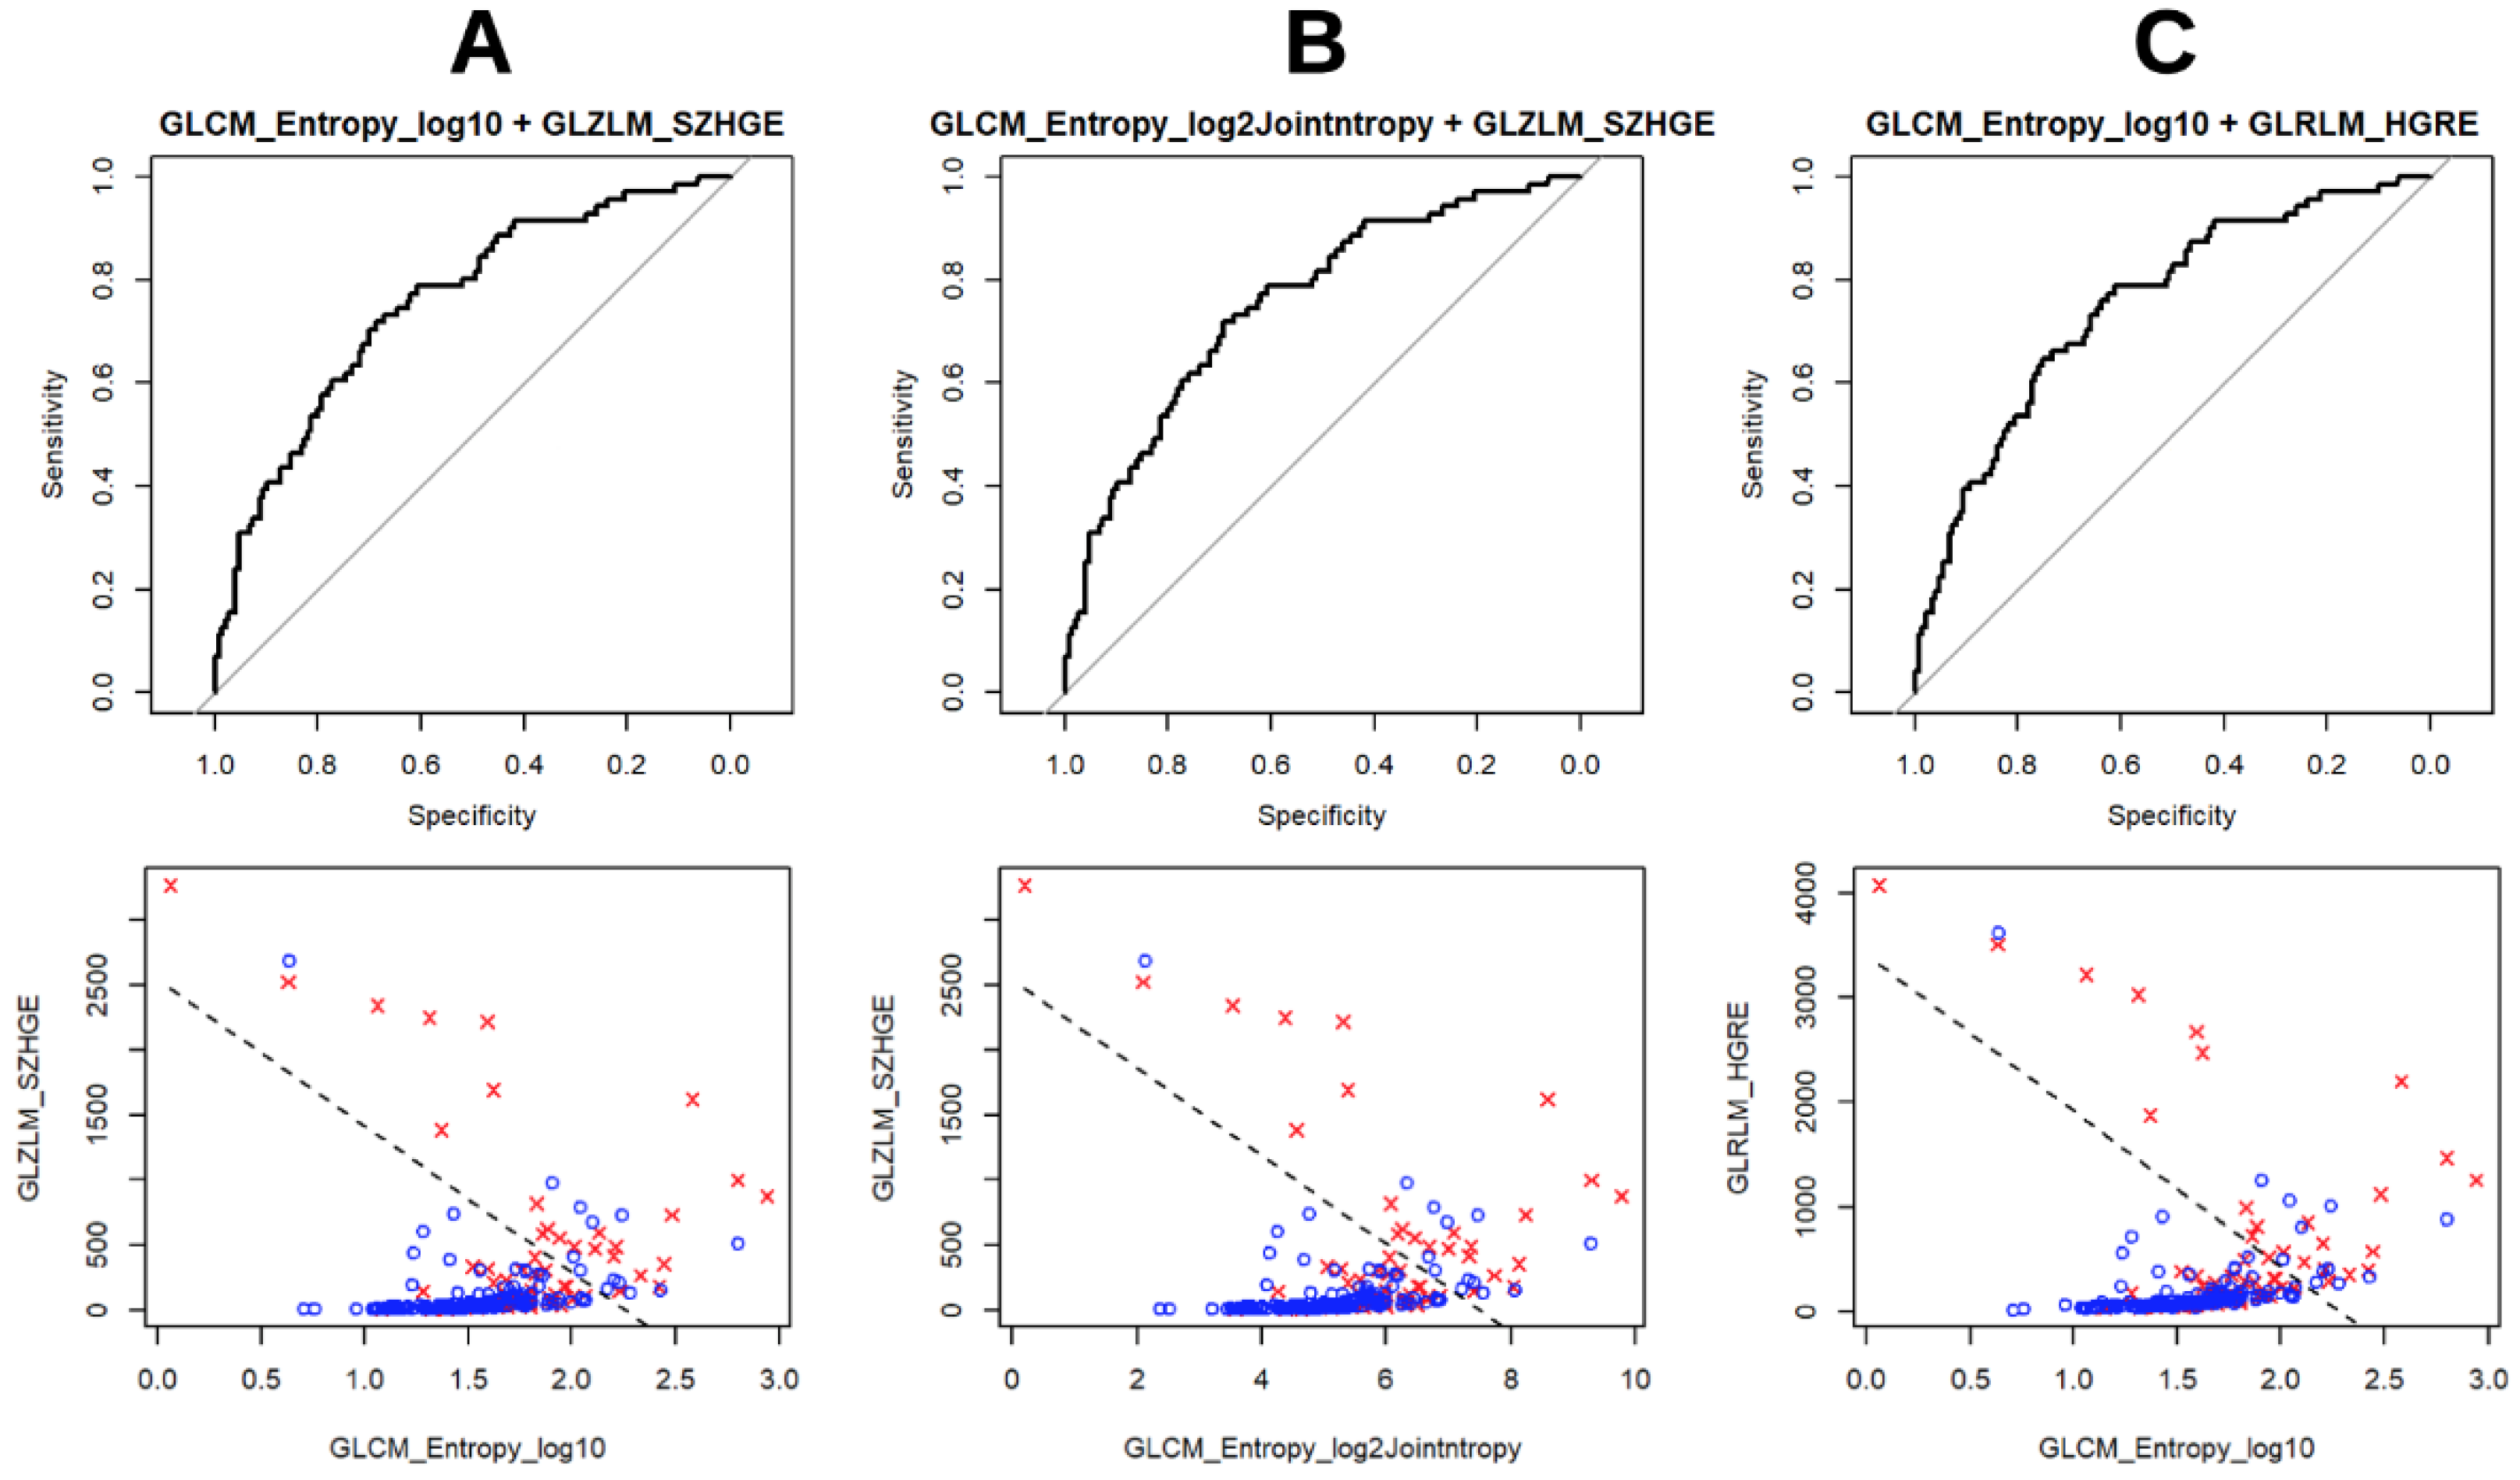
| GLRLM HGRE | 0.731 | 0.693 | 0.741 | 0.03 | 0.03 | <0.01 |
| GLRLM SRHGE | 0.739 | 0.682 | 0.744 | 0.02 | 0.02 | <0.01 |
| GLRLM LRLGE | 0.707 | 0.653 | 0.715 | 0.01 | 0.01 | <0.01 |
| GLZLM SZE | 0.734 | 0.671 | 0.693 | <0.01 | <0.01 | 0.01 |
| GLZLM HGZE | 0.740 | 0.668 | 0.740 | 0.02 | 0.03 | <0.01 |
| GLZLM SZHGE | 0.758 | 0.693 | 0.733 | 0.02 | 0.03 | <0.01 |
| GLZLM ZP | 0.692 | 0.669 | 0.699 | <0.01 | 0.01 | <0.01 |
| Variables with good performances only at Scanner 1 + 2 analysis | ||||||
| GLCM contrast | 0.733 | 0.01 | ||||
| GLZLM ZLNU | 0.729 | 0.04 | ||||
| GLRLM LRLGE | 0.715 | <0.01 | ||||
| GLZLM LGZE | 0.706 | <0.01 | ||||
| GLRLM LGRE | 0.703 | <0.01 | ||||
| GLCM homogeneity | 0.702 | <0.01 | ||||
| GLRLM SRLGE | 0.687 | <0.01 | ||||
| NGLDM busyness | 0.684 | 0.01 | ||||
| GLRLM RP | 0.660 | 0.04 | ||||
| GLZLM SZLGE | 0.651 | <0.01 | ||||
| Covariate 1 | Covariate 2 | Mean p-Value 1 | Mean p-Value 2 | Mean AUC |
|---|---|---|---|---|
| Scanner 1 | ||||
| GLZLM GLNU | MTV | <0.01 | 0.01 | 0.779 |
| GLRLM RLNU | MTV | 0.02 | 0.03 | 0.776 |
| GLCM energy | GLCM entropy_log2 | 0.04 | <0.01 | 0.771 |
| GLCM energy | GLCM entropy_log10 | 0.04 | <0.01 | 0.771 |
| GLCM entropy_log2 | GLRLM HGRE | 0.01 | 0.03 | 0.763 |
| GLCM entropy_log10 | GLZLM HGZE | 0.02 | 0.02 | 0.762 |
| GLCM entropy_log10 | GLRLM HGRE | 0.01 | 0.03 | 0.761 |
| GLCM entropy_log2 | GLZLM HGZE | 0.02 | 0.02 | 0.760 |
| GLCM entropy_log10 | GLZLM SZHGE | 0.01 | 0.02 | 0.760 |
| GLCM entropy_log2 | GLZLM SZHGE | 0.01 | 0.02 | 0.759 |
| GLRLM RP | GLZLM SZHGE | 0.04 | 0.02 | 0.751 |
| GLRLM HGRE | GLRLM RP | 0.02 | 0.03 | 0.745 |
| MTV | TLG | <0.01 | 0.01 | 0.741 |
| GLRLM SRE | GLZLM HGZE | 0.03 | 0.01 | 0.740 |
| NGLDM coarseness | NGLDM busyness | <0.01 | 0.01 | 0.738 |
| Shape volume_mL | GLRLM GLNU | 0.03 | 0.01 | 0.736 |
| GLRLM GLNU | NGLDM coarseness | 0.03 | <0.01 | 0.734 |
| GLRLM SRE | GLZLM SZHGE | 0.03 | 0.02 | 0.732 |
| GLRLM SRE | GLRLM HGRE | 0.03 | 0.02 | 0.730 |
| GLRLM LRLGE | NGLDM coarseness | <0.01 | 0.04 | 0.730 |
| Shape volume_vx | GLRLM GLNU | 0.02 | 0.02 | 0.723 |
| GLCM entropy_log10 | GLZLM SZHGE | 0.04 | <0.01 | 0.713 |
| Shape compacity | GLZLM GLNU | 0.01 | <0.01 | 0.707 |
| Shape volume_mL | MTV | 0.02 | 0.02 | 0.693 |
| Ultrasound dimension | MTV | 0.01 | 0.02 | 0.691 |
| GLCM correlation | NGLDM coarseness | <0.01 | <0.01 | 0.690 |
| Shape compacity | NGLDM coarseness | 0.03 | 0.01 | 0.680 |
| Ultrasound dimension | GLRLM GLNU | 0.01 | 0.01 | 0.677 |
| Scanner 2 | ||||
| GLRLM SRE | SUVmean | 0.04 | 0.01 | 0.712 |
| GLCM entropy_log10 | SUVbsa | 0.05 | 0.01 | 0.697 |
| GLCM entropy_log2 | SUVbsa | 0.05 | 0.02 | 0.696 |
| GLCM entropy_log2 | GLZLM SZHGE | 0.03 | 0.02 | 0.689 |
| GLCM entropy_log10 | GLZLM SZHGE | 0.03 | 0.02 | 0.689 |
| GLRLM RP | SUVmean | 0.05 | 0.02 | 0.686 |
| GLCM entropy_log2 | GLZLM HGZE | 0.05 | 0.02 | 0.682 |
| GLCM entropy_log10 | GLZLM HGZE | 0.05 | 0.02 | 0.680 |
| GLCM entropy_log10 | GLRLM HGRE | 0.04 | 0.02 | 0.679 |
| GLCM energy | GLRLM LRHGE | 0.01 | 0.02 | 0.679 |
| GLCM entropy_log2 | GLRLM HGRE | 0.04 | 0.02 | 0.679 |
| NGLDM coarseness | GLZLM ZP | 0.03 | <0.01 | 0.677 |
| Histo energy | GLRLM HGRE | 0.04 | 0.03 | 0.676 |
| GLCM homogeneity | NGLDM coarseness | <0.01 | 0.06 | 0.675 |
| GLCM contrast | GLCM entropy_log10 | 0.04 | 0.04 | 0.673 |
| GLCM contrast | GLCM entropy_log2 | 0.04 | 0.04 | 0.673 |
| Histo energy | GLZLM SZHGE | 0.04 | 0.03 | 0.669 |
| GLRLM SRE | GLRLM HGRE | 0.04 | 0.03 | 0.669 |
| GLRLM SRE | NGLDM coarseness | 0.01 | 0.05 | 0.668 |
| GLRLM LRE | SUVmean | 0.04 | 0.01 | 0.668 |
| NGLDM coarseness | NGLDM busyness | 0.02 | 0.02 | 0.666 |
| GLZLM GLNU | MTV | 0.02 | 0.02 | 0.663 |
| GLCM energy | GLZLM SZHGE | 0.06 | <0.01 | 0.660 |
| GLCM energy | GLRLM HGRE | 0.06 | <0.01 | 0.659 |
| GLRLM RP | NGLDM coarseness | 0.01 | 0.05 | 0.657 |
| GLRLM RLNU | MTV | 0.01 | 0.01 | 0.650 |
| NGLDM coarseness | MTV | 0.04 | 0.03 | 0.627 |
| Scanner 1 + 2 | ||||
| GLCM entropy_log2 | GLZLM SZHGE | <0.01 | <0.01 | 0.769 |
| GLCM entropy_log10 | GLRLM HGRE | <0.01 | <0.01 | 0.769 |
| GLCM entropy_log10 | GLZLM SZHGE | <0.01 | <0.01 | 0.769 |
| GLCM entropy_log10 | GLZLM HGZE | <0.01 | <0.01 | 0.769 |
| GLCM entropy_log2 | GLRLM HGRE | <0.01 | <0.01 | 0.768 |
| GLCM entropy_log2 | GLZLM HGZE | <0.01 | <0.01 | 0.768 |
| GLRLM SRE | SUVmean | <0.01 | <0.01 | 0.763 |
| GLRLM GLNU | NGLDM Coarseness | <0.01 | <0.01 | 0.756 |
| GLCM homogeneity | GLRLM HGRE | <0.01 | <0.01 | 0.749 |
| GLCM homogeneity | GLZLM HGZE | <0.01 | <0.01 | 0.749 |
| Histo energy | GLRLM HGRE | <0.01 | <0.01 | 0.749 |
| Histo energyUniformity | GLZLM SZHGE | <0.01 | <0.01 | 0.748 |
| GLCM homogeneity | GLZLM SZHGE | <0.01 | <0.01 | 0.748 |
| NGLDM coarseness | NGLDM busyness | <0.01 | <0.01 | 0.746 |
| GLRLM SRE | GLRLM HGRE | <0.01 | <0.01 | 0.742 |
| GLRLM RP | GLZLM HGZE | <0.01 | <0.01 | 0.742 |
| GLRLM SRE | GLZLM HGZE | <0.01 | <0.01 | 0.742 |
| GLRLM HGRE | GLRLM RP | <0.01 | <0.01 | 0.742 |
| NGLDM coarseness | GLZLM ZP | <0.01 | <0.01 | 0.741 |
| GLZLM GLNU | MTV | <0.01 | <0.01 | 0.738 |
| GLRLM SRE | GLZLM SZHGE | <0.01 | <0.01 | 0.738 |
| GLRLM RP | GLZLM SZHGE | <0.01 | <0.01 | 0.737 |
| GLRLM LRE | GLRLM LRHGE | <0.01 | <0.01 | 0.737 |
| GLRLM RLNU | MTV | <0.01 | <0.01 | 0.730 |
| Histo energy | GLCM energy | <0.01 | <0.01 | 0.717 |
| Shape compacity | NGLDM coarseness | <0.01 | <0.01 | 0.681 |
| GLCM correlation | NGLDM coarseness | <0.01 | <0.01 | 0.654 |
| Shape compacity | GLZLM GLNU | <0.01 | <0.01 | 0.640 |
Publisher’s Note: MDPI stays neutral with regard to jurisdictional claims in published maps and institutional affiliations. |
© 2022 by the authors. Licensee MDPI, Basel, Switzerland. This article is an open access article distributed under the terms and conditions of the Creative Commons Attribution (CC BY) license (https://creativecommons.org/licenses/by/4.0/).
Share and Cite
Dondi, F.; Pasinetti, N.; Gatta, R.; Albano, D.; Giubbini, R.; Bertagna, F. Comparison between Two Different Scanners for the Evaluation of the Role of 18F-FDG PET/CT Semiquantitative Parameters and Radiomics Features in the Prediction of Final Diagnosis of Thyroid Incidentalomas. J. Clin. Med. 2022, 11, 615. https://doi.org/10.3390/jcm11030615
Dondi F, Pasinetti N, Gatta R, Albano D, Giubbini R, Bertagna F. Comparison between Two Different Scanners for the Evaluation of the Role of 18F-FDG PET/CT Semiquantitative Parameters and Radiomics Features in the Prediction of Final Diagnosis of Thyroid Incidentalomas. Journal of Clinical Medicine. 2022; 11(3):615. https://doi.org/10.3390/jcm11030615
Chicago/Turabian StyleDondi, Francesco, Nadia Pasinetti, Roberto Gatta, Domenico Albano, Raffaele Giubbini, and Francesco Bertagna. 2022. "Comparison between Two Different Scanners for the Evaluation of the Role of 18F-FDG PET/CT Semiquantitative Parameters and Radiomics Features in the Prediction of Final Diagnosis of Thyroid Incidentalomas" Journal of Clinical Medicine 11, no. 3: 615. https://doi.org/10.3390/jcm11030615