
Bedside Ultrasound for Hemodynamic Monitoring in Cardiac Intensive Care Unit
 , , , and
on behalf of the Working Group of Echocardiography of the Italian Society of Cardiology
, , , and
on behalf of the Working Group of Echocardiography of the Italian Society of Cardiology
Abstract
:1. Background
2. Evaluation of Perfusion
2.1. Pathophysiology in Intensive Care Unit
2.2. Echocardiographic Variables
2.3. Echocardiography: Dynamic Indices
3. Congestion: Diagnosis and Monitoring
3.1. Pathophysiology in Intensive Care Unit
3.2. Echocardiography
3.3. Venous Ultrasound: New Markers of Fluid Status
3.4. Lung Ultrasound
4. Pulmonary Hypertension
4.1. Assessment in Intensive Care Unit
4.2. Possible Impact of Ventilation on the Right Ventricle
Author Contributions
Funding
Institutional Review Board Statement
Informed Consent Statement
Data Availability Statement
Acknowledgments
Conflicts of Interest
References
- Cecconi, M.; De Backer, D.; Antonelli, M.; Beale, R.; Bakker, J.; Hofer, C.; Jaeschke, R.; Mebazaa, A.; Pinsky, M.R.; Teboul, J.L.; et al. Consensus on circulatory shock and hemodynamic monitoring. Task force of the European Society of Intensive Care Medicine. Intensive Care Med. 2014, 40, 1795–1815. [Google Scholar] [CrossRef] [PubMed] [Green Version]
- Soliman-Aboumarie, H.; Pastore, M.C.; Galiatsou, E.; Gargani, L.; Pugliese, N.R.; Mandoli, G.E.; Valenten, S.; Hurtado-Doce, A.; Lees, N.; Cameli, M. Echocardiography in the intensive care unit: An essential tool for diagnosis, monitoring and guiding clinical decision-making. Physiol. Int. 2021, 14, 1–15. [Google Scholar] [CrossRef] [PubMed]
- Chioncel, O.; Parissis, J.; Mebazaa, A.; Thiele, H.; Desch, S.; Bauersachs, J.; Harjola, V.P.; Antohi, E.L.; Arrigo, M.; Ben Gal, T.; et al. Epidemiology, pathophysiology and contemporary management of cardiogenic shock—A position statement from the Heart Failure Association of the European Society of Cardiology. Eur. J. Heart Fail. 2020, 22, 1315–1341, Erratum in Eur. J. Heart Fail. 2021, 23, 345. [Google Scholar] [CrossRef] [PubMed]
- Harjola, V.P.; Mullens, W.; Banaszewski, M.; Bauersachs, J.; Brunner-La Rocca, H.P.; Chioncel, O.; Collins, S.P.; Doehner, W.; Filippatos, G.S.; Flammer, A.J.; et al. Organ dysfunction, injury and failure in acute heart failure: From pathophysiology to diagnosis and management. A review on behalf of the Acute Heart Failure Committee of the Heart Failure Association (HFA) of the European Society of Cardiology (ESC). Eur. J. Heart Fail. 2017, 19, 821–836. [Google Scholar] [CrossRef] [PubMed] [Green Version]
- Harjola, V.P.; Lassus, J.; Sionis, A.; Køber, L.; Tarvasmäki, T.; Spinar, J.; Parissis, J.; Banaszewski, M.; Silva-Cardoso, J.; Carubelli, V.; et al. CardShock Study Investigators; GREAT network. Clinical picture and risk prediction of short-term mortality in cardiogenic shock. Eur. J. Heart Fail. 2015, 17, 501–509, Erratum in Eur. J. Heart Fail. 2015, 17, 984. [Google Scholar] [CrossRef] [PubMed] [Green Version]
- McDonagh, T.A.; Metra, M.; Adamo, M.; Gardner, R.S.; Baumbach, A.; Böhm, M.; Burri, H.; Butler, J.; Čelutkienė, J.; Chioncel, O.; et al. ESC Scientific Document Group. 2021 ESC Guidelines for the diagnosis and treatment of acute and chronic heart failure. Eur. Heart J. 2021, 42, 3599–3726, Erratum in Eur. Heart J. 2021, 42, 4901. [Google Scholar] [CrossRef] [PubMed]
- Chioncel, O.; Mebazaa, A.; Maggioni, A.P.; Harjola, V.P.; Rosano, G.; Laroche, C.; Piepoli, M.F.; Crespo-Leiro, M.G.; Lainscak, M.; Ponikowski, P.; et al. ESC-EORP-HFA Heart Failure Long-Term Registry Investigators. Acute heart failure congestion and perfusion status—Impact of the clinical classification on in-hospital and long-term outcomes: Insights from the ESC-EORP-HFA heart failure long-term registry. Eur. J. Heart Fail. 2019, 21, 13381352. [Google Scholar] [CrossRef]
- Rola, P.; Miralles-Aguiar, F.; Argaiz, E.; Beaubien-Souligny, W.; Haycock, K.; Karimov, T.; Dinh, V.A.; Spiegel, R. Clinical applications of the venous excess ultrasound (VExUS) score: Conceptual review and case series. Ultrasound J. 2021, 13, 32. [Google Scholar] [CrossRef]
- Yastrebov, K.; Manganas, C.; Kapalli, T.; Pava, A. Ejection fraction—A number to be interpreted with caution! Australas. J. Ultrasound Med. 2016, 19, 71–74. [Google Scholar] [CrossRef]
- Michard, F.; Teboul, J.L. Predicting fluid responsiveness in ICU patients: A critical analysis of the evidence. Chest 2002, 121, 2000–2008. [Google Scholar] [CrossRef]
- Lang, R.M.; Badano, L.P.; Mor-Avi, V.; Afilalo, J.; Armstrong, A.; Ernande, L.; Flachskampf, F.A.; Foster, E.; Goldstein, S.A.; Kuznetsova, T.; et al. Recommendations for cardiac chamber quantification by echocardiography in adults: An update from the American Society of Echocardiography and the European Association of Cardiovascular Imaging. J. Am. Soc. Echocardiogr. 2015, 28, 1–39.e14. [Google Scholar] [CrossRef] [PubMed] [Green Version]
- Sugimoto, T.; Dulgheru, R.; Bernard, A.; Ilardi, F.; Contu, L.; Addetia, K.; Caballero, L.; Akhaladze, N.; Athanassopoulos, G.D.; Barone, D.; et al. Echocardiographic reference ranges for normal left ventricular 2D strain: Results from the EACVI NORRE study. Eur. Heart J. Cardiovasc. Imaging 2017, 18, 833–840. [Google Scholar] [CrossRef] [PubMed]
- D’Andrea, A.; Radmilovic, J.; Mele, D.; D’Ascenzi, F.; Agricola, E.; Carbone, A.; Lo Iudice, F.; Novo, G.; Ancona, F.; Righini, F.M.; et al. Working Group on Echocardiography of the Italian Society of Cardiology. Speckle tracking analysis in intensive care unit: A toy or a tool? Echocardiography 2018, 35, 506–519. [Google Scholar] [CrossRef] [PubMed]
- Cho, G.Y.; Marwick, T.H.; Kim, H.S.; Kim, M.K.; Hong, K.S.; Oh, D.J. Global 2-dimensional strain as a new prognosticator in patients with heart failure. J. Am. Coll. Cardiol. 2009, 54, 618–624. [Google Scholar] [CrossRef] [Green Version]
- Caspar, T.; Fichot, M.; Ohana, M.; El Ghannudi, S.; Morel, O.; Ohlmann, P. Late detection of left ventricular dysfunction using two-dimensional and three-dimensional speckle-tracking echocardiography in patients with history of nonsevere acute myocarditis. J. Am. Soc. Echocardiogr. 2017, 30, 756–762. [Google Scholar] [CrossRef] [PubMed]
- Yu, J.; Zheng, R.; Yang, P.; Wang, D. Construction of a predictive model and prognosis of left ventricular systolic dysfunction in patients with sepsis based on the diagnosis using left ventricular global longitudinal strain. J. Intensive Care 2022, 10, 29. [Google Scholar] [CrossRef] [PubMed]
- Favot, M.; Courage, C.; Ehrman, R.; Khait, L.; Levy, P. Strain Echocardiography in Acute Cardiovascular Diseases. West J. Emerg. Med. 2016, 17, 54–60. [Google Scholar] [CrossRef]
- Abbas, A.E.; Fortuin, F.D.; Schiller, N.B.; Appleton, C.P.; Moreno, C.A.; Lester, S.J. A simple method for noninvasive estimation of pulmonary vascular resistance. J. Am. Coll. Cardiol. 2003, 41, 1021–1027. [Google Scholar] [CrossRef] [Green Version]
- Rajagopalan, N.; Simon, M.A.; Suffoletto, M.S.; Shah, H.; Edelman, K.; Mathier, M.A.; López-Candales, A. Noninvasive estimation of pulmonary vascular resistance in pulmonary hypertension. Echocardiography 2009, 26, 489–494. [Google Scholar] [CrossRef]
- Cardim, N.; Pellerin, D.; Valente, F.X. Hypertrophic cardiomyopathy. In The EACVI Textbook of Echocardiography, 2nd ed.; Lancellotti, P., Zamorano, J.L., Habib, G., Badano, L., Eds.; Oxford University Press: Oxford, UK, 2017; pp. 354–363. [Google Scholar]
- Mullens, W.; Damman, K.; Harjola, V.P.; Mebazaa, A.; Brunner-La Rocca, H.P.; Martens, P.; Testani, J.M.; Tang, W.H.W.; Orso, F.; Rossignol, P.; et al. The use of diuretics in heart failure with congestion—A position statement from the Heart Failure Association of the European Society of Cardiology. Eur. J. Heart Fail. 2019, 21, 137–155. [Google Scholar] [CrossRef]
- Fallick, C.; Sobotka, P.A.; Dunlap, M.E. Sympathetically mediated changes in capacitance: Redistribution of the venous reservoir as a cause of decompensation. Circ. Heart Fail. 2011, 4, 669–675. [Google Scholar] [CrossRef] [PubMed] [Green Version]
- Verbrugge, F.H.; Dupont, M.; Steels, P.; Grieten, L.; Malbrain, M.; Tang, W.H.; Mullens, W. Abdominal contributions to cardiorenal dysfunction in congestive heart failure. J. Am. Coll. Cardiol. 2013, 62, 485–495. [Google Scholar] [CrossRef] [PubMed]
- Parrinello, G.; Greene, S.J.; Torres, D.; Alderman, M.; Bonventre, J.V.; Di Pasquale, P.; Gargani, L.; Nohria, A.; Fonarow, G.C.; Vaduganathan, M.; et al. Water and sodium in heart failure: A spotlight on congestion. Heart Fail. Rev. 2015, 20, 13–24. [Google Scholar] [CrossRef] [PubMed] [Green Version]
- Girerd, N.; Seronde, M.F.; Coiro, S.; Chouihed, T.; Bilbault, P.; Braun, F.; Kenizou, D.; Maillier, B.; Nazeyrollas, P.; Roul, G.; et al. INI-CRCT, Great Network, and the EF-HF Group. Integrative Assessment of Congestion in Heart Failure Throughout the Patient Journey. JACC Heart Fail. 2018, 6, 273–285. [Google Scholar] [CrossRef]
- Mourad, M.; Chow-Chine, L.; Faucher, M.; Sannini, A.; Brun, J.P.; de Guibert, J.M.; Fouche, L.; Lambert, J.; Blache, J.L.; Mokart, D. Early diastolic dysfunction is associated with intensive care unit mortality in cancer patients presenting with septic shock. Br. J. Anaesth. 2014, 112, 102–109. [Google Scholar] [CrossRef] [Green Version]
- Gonzalez, C.; Begot, E.; Dalmay, F.; Pichon, N.; François, B.; Fedou, A.L.; Chapellas, C.; Galy, A.; Mancia, C.; Daix, T.; et al. Prognostic impact of left ventricular diastolic function in patients with septic shock. Ann. Intensive Care 2016, 6, 36. [Google Scholar] [CrossRef] [Green Version]
- Nagueh, S.F.; Middleton, K.J.; Kopelen, H.A.; Zoghbi, W.A.; Quinones, M.A. Doppler tissue imaging: A noninvasive technique for evaluation of left ventricular relaxation and estimation of filling pressures. J. Am. Coll. Cardiol. 1997, 30, 1527–1533. [Google Scholar] [CrossRef]
- Mullens, W.; Borowski, A.G.; Curtin, R.J.; Thomas, J.D.; Tang, W.H. Tissue Doppler imaging in the estimation of intracardiac filling pressure in decompensated patients with advanced systolic heart failure. Circulation 2009, 119, 62–70. [Google Scholar] [CrossRef]
- Feissel, M.; Michard, F.; Mangin, I.; Ruyer, O.; Faller, J.P.; Teboul, J.L. Respiratory changes in aortic blood velocity as an indicator of fluid responsiveness in ventilated patients with septic shock. Chest 2001, 119, 867–873. [Google Scholar] [CrossRef]
- Wang, Y.C.; Huang, C.H.; Tu, Y.K. Pulmonary Hypertension and Pulmonary Artery Acceleration Time: A Systematic Review and Meta-Analysis. J. Am. Soc. Echocardiogr. 2018, 31, 201–210.e3. [Google Scholar] [CrossRef]
- Dammassa, V.; Corradi, F.; Colombo, C.N.J.; Mojoli, F.; Price, S.; Tavazzi, G. Pulmonary artery acceleration time accuracy for systolic pulmonary artery pressure estimation in critically ill patients. Ultrasound J. 2022, 14, 26. [Google Scholar] [CrossRef] [PubMed]
- Pastore, M.C.; Mandoli, G.E.; Stefanini, A.; Ghionzoli, N.; Carrucola, C.; De Carli, G.; Lisi, M.; Cavigli, L.; D’Ascenzi, F.; Focardi, M.; et al. Prediction of congestive state in acute and chronic heart failure: The association between NT-proBNP and left atrial strain and its prognostic value. Int. J. Cardiol. 2022, 371, 266–272. [Google Scholar] [CrossRef] [PubMed]
- Nicolosi, G.L.; Casolo, G. L’intelligenza artificiale in cardiologia. Giornale Italiano di Cardiologia 2022, 23, 761–770. [Google Scholar] [CrossRef] [PubMed]
- Davis, A.; Billick, K.; Horton, K.; Jankowski, M.; Knoll, P.; Marshall, J.E.; Paloma, A.; Palma, R.; Adams, D.B. Artificial Intelligence and Echocardiography: A Primer for Cardiac Sonographers. J. Am. Soc. Echocardiogr. 2020, 33, 1061–1066. [Google Scholar] [CrossRef]
- Chen, X.; Owen, C.A.; Huang, E.C.; Maggard, B.D.; Latif, R.K.; Clifford, S.P.; Li, J.; Huang, J. Artificial Intelligence in Echocardiography for Anesthesiologists. J. Cardiothorac. Vasc. Anesth. 2021, 35, 251–261. [Google Scholar] [CrossRef]
- Dey, D.; Slomka, P.J.; Leeson, P.; Comaniciu, D.; Shrestha, S.; Sengupta, P.P.; Marwick, T.H. Artificial Intelligence in Cardiovascular Imaging: JACC State-of-the-Art Review. J. Am. Coll. Cardiol. 2019, 73, 1317–1335. [Google Scholar] [CrossRef]
- Srinivasan, S.; Cornell, T.T. Bedside ultrasound in pediatric critical care: A review. Pediatr. Crit. Care Med. 2011, 12, 667–674. [Google Scholar] [CrossRef] [Green Version]
- Beaubien-Souligny, W.; Rola, P.; Haycock, K.; Bouchard, J.; Lamarche, Y.; Spiegel, R.; Denault, A.Y. Quantifying systemic congestion with Point-Of-Care ultrasound: Development of the venous excess ultrasound grading system. Ultrasound J. 2020, 12, 16. [Google Scholar] [CrossRef] [Green Version]
- Gargani, L.; Volpicelli, G. How I do it: Lung ultrasound. Cardiovasc. Ultrasound 2014, 12, 25. [Google Scholar] [CrossRef] [Green Version]
- Volpicelli, G.; Elbarbary, M.; Blaivas, M.; Lichtenstein, D.A.; Mathis, G.; Kirkpatrick, A.W.; Melniker, L.; Gargani, L.; Noble, V.E.; Via, G.; et al. International Liaison Committee on Lung Ultrasound (ILC-LUS) for International Consensus Conference on Lung Ultrasound (ICC-LUS). International evidence-based recommendations for point-of-care lung ultrasound. Intensive Care Med. 2012, 38, 577–591. [Google Scholar] [CrossRef]
- D’Andrea, A.; Mele, D.; Palermi, S.; Lombardi, A.; Di Giannuario, G.; Rizzo, M.; Campana, M.; Marrazzo, G.; Scarafile, R.; Gimelli, A.; et al. Ecografia del polmone: Quello che il cardiologo dovrebbe conoscere. G. Ital. Cardiol. 2021, 22, 638–647. [Google Scholar] [CrossRef]
- Bouhemad, B.; Zhang, M.; Lu, Q.; Rouby, J.J. Clinical review: Bedside lung ultrasound in critical care practice. Crit. Care. 2007, 11, 205. [Google Scholar] [CrossRef]
- Liccardo, B.; Martone, F.; Trambaiolo, P.; Severino, S.; Cibinel, G.A.; D’Andrea, A. Incremental value of thoracic ultrasound in intensive care units: Indications, uses, and applications. World J. Radiol. 2016, 8, 460–471. [Google Scholar] [CrossRef] [PubMed]
- Chiles, C.; Ravin, C.E. Radiographic recognition of pneumothorax in the intensive care unit. Crit. Care Med. 1986, 14, 677–680. [Google Scholar] [CrossRef] [PubMed]
- Soldati, G.; Demi, M. The use of lung ultrasound images for the differential diagnosis of pulmonary and cardiac interstitial pathology. J. Ultrasound 2017, 20, 91–96. [Google Scholar] [CrossRef]
- Stamm, J.A.; McVerry, B.J.; Mathier, M.A.; Donahoe, M.P.; Saul, M.I.; Gladwin, M.T. Doppler-defined pulmonary hypertension in medical intensive care unit patients: Retrospective investigation of risk factors and impact on mortality. Pulm. Circ. 2011, 1, 95–102. [Google Scholar] [CrossRef] [Green Version]
- Haddad, F.; Peterson, T.; Fuh, E.; Kudelko, K.T.; Perez, V.D.J.; Skhiri, M.; Vagelos, R.; Schnittger, I.; Denault, A.Y.; Rosenthal, D.N.; et al. Characteristics and outcome after hospitalization for acute right heart failure in patients with pulmonary arterial hypertension. Circ. Heart Fail. 2011, 4, 692–699. [Google Scholar] [CrossRef] [Green Version]
- Sztrymf, B.; Souza, R.; Bertoletti, L.; Jais, X.; Sitbon, O.; Price, L.C.; Simonneau, G.; Humbert, M. Prognostic factors of acute heart failure in patients with pulmonary arterial hypertension. Eur. Respir. J. 2010, 35, 1286–1293. [Google Scholar] [CrossRef] [Green Version]
- Humbert, M.; Kovacs, G.; Hoeper, M.M.; Badagliacca, R.; Berger, R.M.F.; Brida, M.; Carlsen, J.; Coats, A.J.S.; Escribano-Subias, P.; Ferrari, P.; et al. ESC/ERS Scientific Document Group. 2022 ESC/ERS Guidelines for the diagnosis and treatment of pulmonary hypertension. Eur. Heart J. 2022, 43, 3618–3731. [Google Scholar] [CrossRef]
- Bossone, E.; Duong-Wagner, T.H.; Paciocco, G.; Oral, H.; Ricciardi, M.; Bach, D.S.; Rubenfire, M.; Armstrong, W.F. Echocardiographic features of primary pulmonary hypertension. J. Am. Soc. Echocardiogr. 1999, 12, 655–662. [Google Scholar] [CrossRef]
- Bossone, E.; D’Andrea, A.; D’Alto, M.; Citro, R.; Argiento, P.; Ferrara, F.; Cittadini, A.; Rubenfire, M.; Naeije, R. Echocardiography in pulmonary arterial hypertension: From diagnosis to prognosis. J. Am. Soc. Echocardiogr. 2013, 26, 1–14. [Google Scholar] [CrossRef] [PubMed]
- François, C.J.; Schiebler, M.L. Imaging of Pulmonary Hypertension. Radiol. Clin. N. Am. 2016, 54, 1133–1149. [Google Scholar] [CrossRef] [PubMed]
- Sitbon, O.; Humbert, M.; Nunes, H.; Parent, F.; Garcia, G.; Hervé, P.; Rainisio, M.; Simonneau, G. Long-term intravenous epoprostenol infusion in primary pulmonary hypertension: Prognostic factors and survival. J. Am. Coll. Cardiol. 2002, 40, 780–788. [Google Scholar] [CrossRef] [PubMed] [Green Version]
- Benza, R.L.; Miller, D.P.; Gomberg-Maitland, M.; Frantz, R.P.; Foreman, A.J.; Coffey, C.S.; Frost, A.; Barst, R.J.; Badesch, D.B.; Elliott, C.G.; et al. Predicting survival in pulmonary arterial hypertension: Insights from the Registry to Evaluate Early and Long-Term Pulmonary Arterial Hypertension Disease Management (REVEAL). Circulation 2010, 122, 164–172. [Google Scholar] [CrossRef] [PubMed] [Green Version]
- Vahanian, A.; Beyersdorf, F.; Praz, F.; Milojevic, M.; Baldus, S.; Bauersachs, J.; Capodanno, D.; Conradi, L.; De Bonis, M.; De Paulis, R.; et al. ESC/EACTS Scientific Document Group. 2021 ESC/EACTS Guidelines for the management of valvular heart disease. Eur. Heart J. 2022, 43, 561–632, Erratum in Eur. Heart J. 2022, 43, 2022. [Google Scholar] [CrossRef] [PubMed]
- Arkles, J.S.; Opotowsky, A.R.; Ojeda, J.; Rogers, F.; Liu, T.; Prassana, V.; Marzec, L.; Palevsky, H.I.; Ferrari, V.A.; Forfia, P.R. Shape of the right ventricular Doppler envelope predicts hemodynamics and right heart function in pulmonary hypertension. Am. J. Respir. Crit. Care Med. 2011, 183, 268–276. [Google Scholar] [CrossRef]
- Tello, K.; Wan, J.; Dalmer, A.; Vanderpool, R.; Ghofrani, H.A.; Naeije, R.; Roller, F.; Mohajerani, E.; Seeger, W.; Herberg, U.; et al. Validation of the Tricuspid Annular Plane Systolic Excursion/Systolic Pulmonary Artery Pressure Ratio for the Assessment of Right Ventricular-Arterial Coupling in Severe Pulmonary Hypertension. Circ. Cardiovasc. Imaging 2019, 12, e009047. [Google Scholar] [CrossRef]
- Rudski, L.G.; Lai, W.W.; Afilalo, J.; Hua, L.; Handschumacher, M.D.; Chandrasekaran, K.; Solomon, S.D.; Louie, E.K.; Schiller, N.B. Guidelines for the echocardiographic assessment of the right heart in adults: A report from the American Society of Echocardiography endorsed by the European Association of Echocardiography, a registered branch of the European Society of Cardiology, and the Canadian Society of Echocardiography. J. Am. Soc. Echocardiogr. 2010, 23, 685–713. [Google Scholar] [CrossRef]
- Buonauro, A.; Santoro, C.; Galderisi, M.; Canora, A.; Sorrentino, R.; Esposito, R.; Lembo, M.; Canonico, M.E.; Ilardi, F.; Fazio, V.; et al. Impaired Right and Left Ventricular Longitudinal Function in Patients with Fibrotic Interstitial Lung Diseases. J. Clin. Med. 2020, 9, 587. [Google Scholar] [CrossRef] [Green Version]
- Puwanant, S.; Park, M.; Popović, Z.B.; Tang, W.H.; Farha, S.; George, D.; Sharp, J.; Puntawangkoon, J.; Loyd, J.E.; Erzurum, S.C.; et al. Ventricular geometry, strain, and rotational mechanics in pulmonary hypertension. Circulation 2010, 121, 259–266. [Google Scholar] [CrossRef]
- Sachdev, A.; Villarraga, H.R.; Frantz, R.P.; McGoon, M.D.; Hsiao, J.F.; Maalouf, J.F.; Ammash, N.M.; McCully, R.B.; Miller, F.A.; Pellikka, P.A.; et al. Right ventricular strain for prediction of survival in patients with pulmonary arterial hypertension. Chest 2011, 139, 1299–1309. [Google Scholar] [CrossRef] [PubMed] [Green Version]
- Haeck, M.L.; Scherptong, R.W.; Marsan, N.A.; Holman, E.R.; Schalij, M.J.; Bax, J.J.; Vliegen, H.W.; Delgado, V. Prognostic value of right ventricular longitudinal peak systolic strain in patients with pulmonary hypertension. Circ. Cardiovasc. Imaging 2012, 5, 628–636. [Google Scholar] [CrossRef] [PubMed] [Green Version]
- Morikawa, T.; Murata, M.; Okuda, S.; Tsuruta, H.; Iwanaga, S.; Murata, M.; Satoh, T.; Ogawa, S.; Fukuda, K. Quantitative analysis of right ventricular function in patients with pulmonary hypertension using three-dimensional echocardiography and a two-dimensional summation method compared to magnetic resonance imaging. Am. J. Cardiol. 2011, 107, 484–489. [Google Scholar] [CrossRef]
- Amaki, M.; Nakatani, S.; Kanzaki, H.; Kyotani, S.; Nakanishi, N.; Shigemasa, C.; Hisatome, I.; Kitakaze, M. Usefulness of three-dimensional echocardiography in assessing right ventricular function in patients with primary pulmonary hypertension. Hypertens Res. 2009, 32, 419–422. [Google Scholar] [CrossRef]
- Grapsa, J.; Gibbs, J.S.; Dawson, D.; Watson, G.; Patni, R.; Athanasiou, T.; Punjabi, P.P.; Howard, L.S.; Nihoyannopoulos, P. Morphologic and functional remodeling of the right ventricle in pulmonary hypertension by real time three dimensional echocardiography. Am. J. Cardiol. 2012, 109, 906–913. [Google Scholar] [CrossRef] [PubMed]
- Scalia, G.M.; Scalia, I.G.; Kierle, R.; Beaumont, R.; Cross, D.B.; Feenstra, J.; Burstow, D.J.; Fitzgerald, B.T.; Platts, D.G. ePLAR—The echocardiographic Pulmonary to Left Atrial Ratio—A novel non-invasive parameter to differentiate pre-capillary and post-capillary pulmonary hypertension. Int. J. Cardiol. 2016, 212, 379–386. [Google Scholar] [CrossRef] [Green Version]
- Roule, V.; Labombarda, F.; Pellissier, A.; Sabatier, R.; Lognoné, T.; Gomes, S.; Bergot, E.; Milliez, P.; Grollier, G.; Saloux, E. Echocardiographic assessment of pulmonary vascular resistance in pulmonary arterial hypertension. Cardiovasc. Ultrasound 2010, 8, 21. [Google Scholar] [CrossRef] [Green Version]
- Xie, Y.; Burke, B.M.; Kopelnik, A.; Auger, W.; Daniels, L.B.; Madani, M.M.; Poch, D.S.; Kim, N.H.; Blanchard, D.G. Echocardiographic estimation of pulmonary vascular resistance in chronic thromboembolic pulmonary hypertension: Utility of right heart Doppler measurements. Echocardiography 2014, 31, 29–33. [Google Scholar] [CrossRef]
- Soni, N.; Williams, P. Positive pressure ventilation: What is the real cost? Br. J. Anaesth. 2008, 101, 446–457. [Google Scholar] [CrossRef] [Green Version]
- Chin, K.M.; Kim, N.H.; Rubin, L.J. The right ventricle in pulmonary hypertension. Coron. Artery Dis. 2005, 16, 13–18. [Google Scholar] [CrossRef]
- Forrest, P. Anaesthesia and right ventricular failure. Anaesth. Intensive Care 2009, 37, 370–385. [Google Scholar] [CrossRef] [PubMed]
- Magunia, H.; Jordanow, A.; Keller, M.; Rosenberger, P.; Nowak-Machen, M. The effects of anesthesia induction and positive pressure ventilation on right-ventricular function: An echocardiography-based prospective observational study. BMC Anesthesiol. 2019, 19, 199. [Google Scholar] [CrossRef] [PubMed] [Green Version]
- Ciozda, W.; Kedan, I.; Kehl, D.W.; Zimmer, R.; Khandwalla, R.; Kimchi, A. The efficacy of sonographic measurement of inferior vena cava diameter as an estimate of central venous pressure. Cardiovasc. Ultrasound 2016, 14, 33. [Google Scholar] [CrossRef] [PubMed] [Green Version]
- Fisher, M.R.; Forfia, P.R.; Chamera, E.; Housten-Harris, T.; Champion, H.C.; Girgis, R.E.; Corretti, M.C.; Hassoun, P.M. Accuracy of Doppler echocardiography in the hemodynamic assessment of pulmonary hypertension. Am. J. Respir. Crit. Care. Med. 2009, 179, 615–621. [Google Scholar] [CrossRef] [Green Version]
- Vieillard-Baron, A.; Evrard, B.; Repessé, X.; Maizel, J.; Jacob, C.; Goudelin, M.; Charron, C.; Prat, G.; Slama, M.; Geri, G.; et al. Limited value of end-expiratory inferior vena cava diameter to predict fluid responsiveness impact of intra-abdominal pressure. Intensive Care Med. 2018, 44, 197–203. [Google Scholar] [CrossRef]
- Mercado, P.; Maizel, J.; Beyls, C.; Kontar, L.; Orde, S.; Huang, S.; McLean, A.; Tribouilloy, C.; Slama, M. Reassessment of the Accuracy of Cardiac Doppler Pulmonary Artery Pressure Measurements in Ventilated ICU Patients: A Simultaneous Doppler-Catheterization Study. Crit. Care Med. 2019, 47, 41–48. [Google Scholar] [CrossRef]
- Rush, B.; Biagioni, B.J.; Berger, L.; McDermid, R. Mechanical Ventilation Outcomes in Patients with Pulmonary Hypertension in the United States: A National Retrospective Cohort Analysis. J. Intensive Care Med. 2017, 32, 588–592. [Google Scholar] [CrossRef]


| Utility | Normal Values or Ranges | ||
|---|---|---|---|
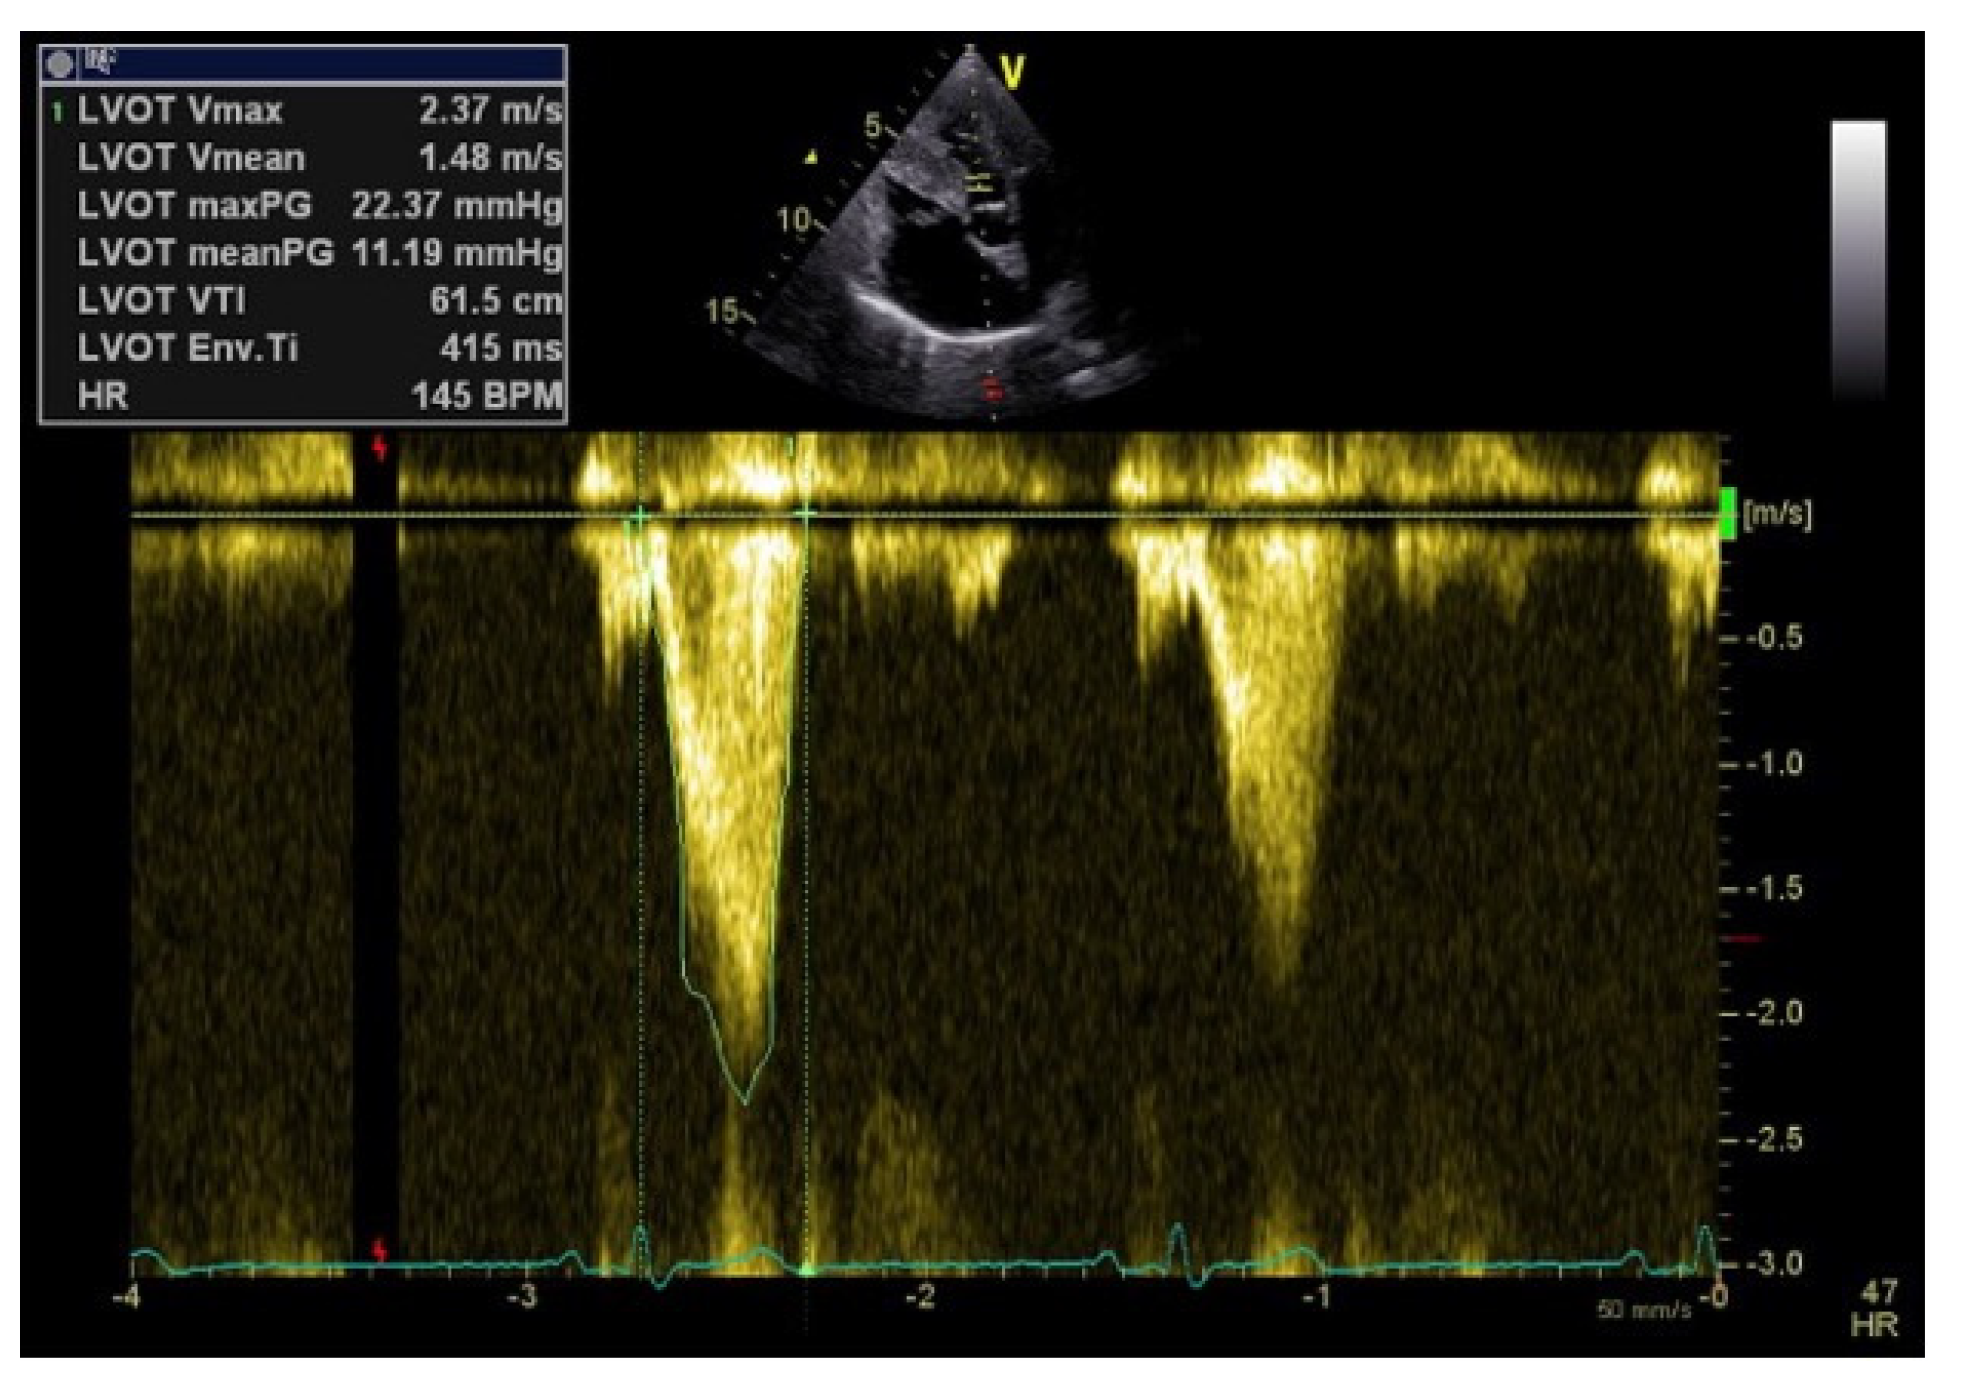
| Perfusion parameters | LVOT VTI and CI | A reliable quantitative parameter that truly reflects circulatory status and global end organ perfusion | LVOT VTI ≥ 18 cm CI ≥ 2.5 L/min/m2 |
| LV GLS | A valuable and sensitive tool for follow-up examinations | LV GLS < −20% | |
| RVOT VTI | Gives information about the right ventricle function and pulmonary vascular resistance | RVOT VTI ≥ 12 cm | |
| RV 2D FAC | Provides an estimate of global RV systolic function | RV FAC ≥ 35% | |
| TAPSE | Represents a measure of RV longitudinal function | TAPSE ≥ 17 mm | |
| TDI S’ | Correlates well with other measures of global RV systolic function | S’ ≥ 9.5 cm/s | |
| Global longitudinal RV free wall strain | Useful for estimating RV global and regional systolic function | RV free wall strain < −20% | |
| LVOTO | Its diagnosis leads to drastic changes in the clinical management | LVOTO < 30 mmHg | |
| Congestion parameters | IVC diameter | Used to estimate RA pressures | IVC < 21 mm that collapses > 50% |
| TDI e’ | Associated with increase mortality in the critically ill patients | Avg e’ ≥ 10 cm/s lateral e’ < 8 cm/s | |
| E/e’ | A load-independent marker of LV filling pressure | E/e’ < 15 | |
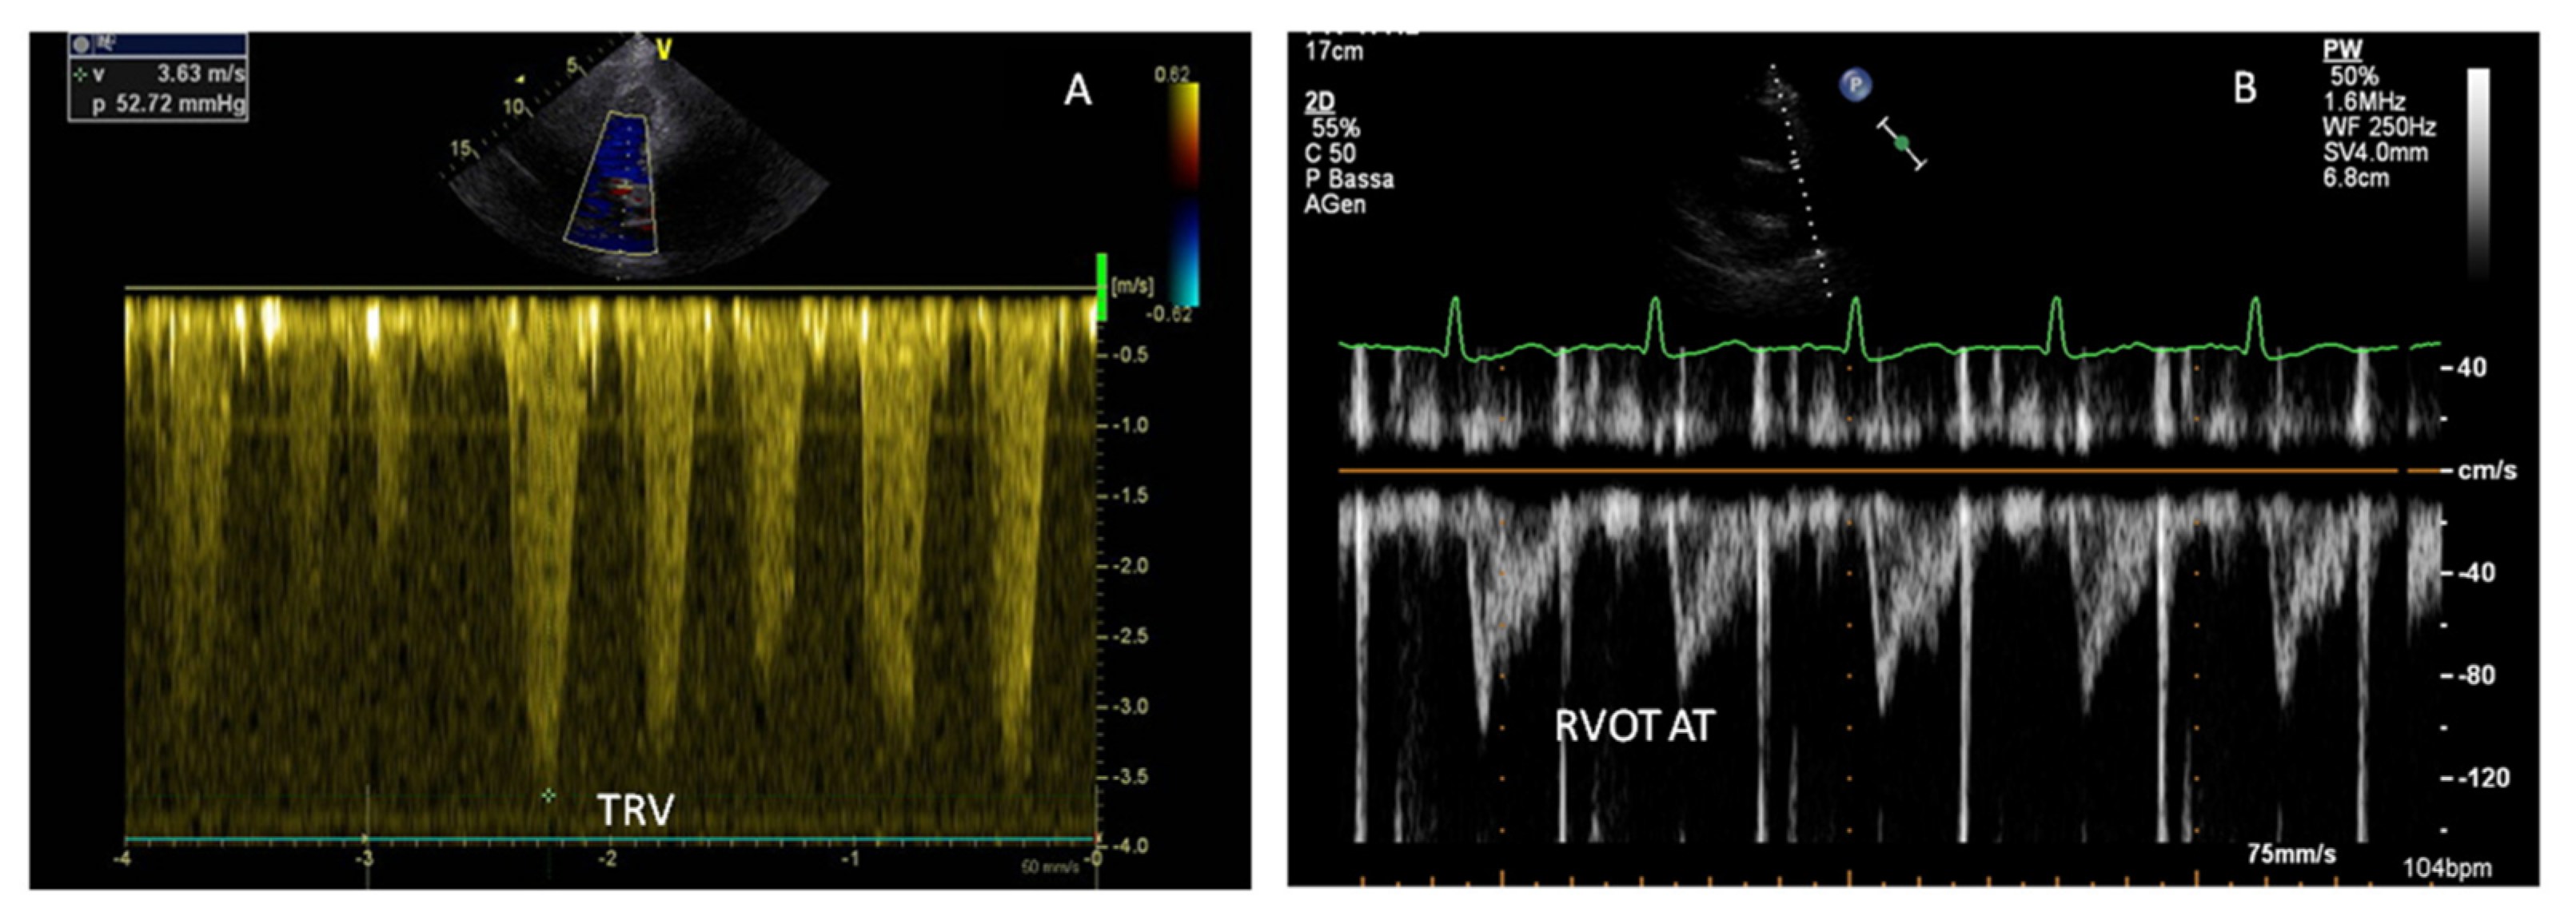
| PASP | The most used non-invasive tool for estimating PAP | PASP > 35 mmHg | |
| PAAT | Represents pulmonary flow acceleration, which increases as the vascular resistance is augmented | PAAT 136–153 ms | |
| PALS | An additional index of congestion to optimize therapeutic management | PALS ≥ 15% | |
| VExUS Score | |
|---|---|
| Grade 0 | IVC < 20 mm |
| Grade 1 | IVC ≥ 21 mm |
| Normal patterns or mild findings | |
| Grade 2 | IVC ≥ 21 mm |
| Severe finding in only one organ | |
| Grade 3 | IVC ≥ 21 mm |
| Severe findings in multiple organs | |
Publisher’s Note: MDPI stays neutral with regard to jurisdictional claims in published maps and institutional affiliations. |
© 2022 by the authors. Licensee MDPI, Basel, Switzerland. This article is an open access article distributed under the terms and conditions of the Creative Commons Attribution (CC BY) license (https://creativecommons.org/licenses/by/4.0/).
Share and Cite
Pastore, M.C.; Ilardi, F.; Stefanini, A.; Mandoli, G.E.; Palermi, S.; Bandera, F.; Benfari, G.; Esposito, R.; Lisi, M.; Pasquini, A.; et al. Bedside Ultrasound for Hemodynamic Monitoring in Cardiac Intensive Care Unit. J. Clin. Med. 2022, 11, 7538. https://doi.org/10.3390/jcm11247538
Pastore MC, Ilardi F, Stefanini A, Mandoli GE, Palermi S, Bandera F, Benfari G, Esposito R, Lisi M, Pasquini A, et al. Bedside Ultrasound for Hemodynamic Monitoring in Cardiac Intensive Care Unit. Journal of Clinical Medicine. 2022; 11(24):7538. https://doi.org/10.3390/jcm11247538
Chicago/Turabian StylePastore, Maria Concetta, Federica Ilardi, Andrea Stefanini, Giulia Elena Mandoli, Stefano Palermi, Francesco Bandera, Giovanni Benfari, Roberta Esposito, Matteo Lisi, Annalisa Pasquini, and et al. 2022. "Bedside Ultrasound for Hemodynamic Monitoring in Cardiac Intensive Care Unit" Journal of Clinical Medicine 11, no. 24: 7538. https://doi.org/10.3390/jcm11247538