
Nonlinear Relationship between Temporomandibular Joint Disc Displacement Distance and Disc Length: A Magnetic Resonance Imaging Analysis

 ,
,  and
and 
Abstract
:1. Introduction
2. Materials and Methods
2.1. Study Population
2.2. MRI Protocol
2.3. Image Analysis
2.3.1. Determination of Disc Displacement
2.3.2. Quantitative Measurements of Disc Morphology
2.3.3. Classification of Disc Morphology
2.4. Statistical Analysis
3. Results
3.1. Demographic Characteristics
3.2. MRI Evaluations
3.3. Association of Disc Displacement and Morphology
4. Discussion
5. Conclusions
Author Contributions
Funding
Institutional Review Board Statement
Informed Consent Statement
Data Availability Statement
Conflicts of Interest
References
- Leeuw, R.; Klasser, G.D. Orofacial Pain: Guidelines for Assessment, Diagnosis, and Management, 6th ed.; Quintessence: Chicago, IL, USA, 2018. [Google Scholar]
- Talaat, W.M.; Adel, O.I.; Al Bayatti, S. Prevalence of temporomandibular disorders discovered incidentally during routine dental examination using the Research Diagnostic Criteria for Temporomandibular Disorders. Oral Surg. Oral Med. Oral Pathol. Oral Radiol. 2018, 125, 250–259. [Google Scholar] [CrossRef] [PubMed]
- Rasmussen, O.C. Description of population and progress of symptoms in a longitudinal study of temporomandibular arthropathy. Scand. J. Dent. Res. 1981, 89, 196–203. [Google Scholar] [CrossRef] [PubMed]
- Chantaracherd, P.; John, M.T.; Hodges, J.S.; Schiffman, E.L. Temporomandibular joint disorders’ impact on pain, function, and disability. J. Dent. Res. 2015, 94, 79s–86s. [Google Scholar] [CrossRef] [PubMed]
- Dahlström, L.; Carlsson, G.E. Temporomandibular disorders and oral health-related quality of life. A systematic review. Acta Odontol. Scand. 2010, 68, 80–85. [Google Scholar] [CrossRef]
- Hu, Y.K.; Yang, C.; Xie, Q.Y. Changes in disc status in the reducing and nonreducing anterior disc displacement of temporomandibular joint: A longitudinal retrospective study. Sci. Rep. 2016, 6, 34253. [Google Scholar] [CrossRef] [Green Version]
- Dias, I.M.; Cordeiro, P.C.; Devito, K.L.; Tavares, M.L.; Leite, I.C.; Tesch Rde, S. Evaluation of temporomandibular joint disc displacement as a risk factor for osteoarthrosis. Int. J. Oral Maxillofac. Surg. 2016, 45, 313–317. [Google Scholar] [CrossRef]
- Okeson, J.P. Joint intracapsular disorders: Diagnostic and nonsurgical management considerations. Dent. Clin. N. Am. 2007, 51, 85–103. [Google Scholar] [CrossRef]
- Durham, J.; Aggarwal, V.; Davies, S.J.; Harrison, S.D.; Jagger, R.G.; Leeson, R.; Lloyd, R.; Thayer, T.; Underhill, H.; Wassell, R.W.; et al. Temporomandibular Disorders (TMDs): An Update and Management Guidance for Primary care from the UK Specialist Interest Group in Orofacial Pain and TMDs (USOT); Clinical Standard Series; Royal College of Surgeons of England: London, UK, 2013; pp. 1–22. [Google Scholar]
- Afroz, S.; Naritani, M.; Hosoki, H.; Takechi, K.; Okayama, Y.; Matsuka, Y. Prevalence of Posterior Disc Displacement of the Temporomandibular Joint in Patients with Temporomandibular Disorders: Systematic Review and Meta-Analyses. J. Oral Facial Pain Headache 2018, 32, 277–286. [Google Scholar] [CrossRef]
- Shaista Afroz BDS, M.D.S.; Naritani, M.; Hidehiko Hosoki, D.D.S.; Yoshizo Matsuka, D.D.S. Posterior disc displacement of the temporomandibular joint: A rare case report. Cranio J. Craniomandib. Pract. 2020, 38, 273–278. [Google Scholar]
- Haketa, T.; Kino, K.; Sugisaki, M.; Takaoka, M.; Ohta, T. Randomized clinical trial of treatment for TMJ disc displacement. J. Dent. Res. 2010, 89, 1259–1263. [Google Scholar] [CrossRef]
- Schiffman, E.; Look, J.; Hodges, J.; Swift, J.; Decker, K.; Hathaway, K.; Templeton, R.; Fricton, J. Randomized effectiveness study of four therapeutic strategies for TMJ closed lock. J. Dent. Res. 2007, 86, 58–63. [Google Scholar] [CrossRef] [PubMed]
- Zhang, S.-Y.; Liu, X.-M.; Yang, C.; Cai, X.-Y.; Chen, M.-J.; Haddad, M.S.; Yun, B.; Chen, Z.-Z. New arthroscopic disc repositioning and suturing technique for treating internal derangement of the temporomandibular joint: Part II--magnetic resonance imaging evaluation. J. Oral Maxillofac. Surg. 2010, 68, 1813–1817. [Google Scholar] [CrossRef] [PubMed]
- Taşkaya-Yilmaz, N.; Oğütcen-Toller, M. Magnetic resonance imaging evaluation of temporomandibular joint disc deformities in relation to type of disc displacement. J. Oral Maxillofac. Surg. 2001, 59, 860–865; discussion 865–866. [Google Scholar] [CrossRef] [PubMed]
- Matsubara, R.; Yanagi, Y.; Oki, K.; Hisatomi, M.; Santos, K.C.; Bamgbose, B.O.; Fujita, M.; Okada, S.; Minagi, S.; Asaumi, J. Assessment of MRI findings and clinical symptoms in patients with temporomandibular joint disorders. Dento Maxillo Facial Radiol. 2018, 47, 20170412. [Google Scholar] [CrossRef]
- Ottl, P.; Hohmann, A.; Piwowarczyk, A.; Hardenacke, F.; Lauer, H.C.; Zanella, F. Retrospective study on the evaluation of the TMJ by MRI using a newly developed standardized evaluation form. Cranio J. Craniomandib. Pract. 2008, 26, 33–43. [Google Scholar] [CrossRef]
- Zhang, Q.; Xiong, X.; Gong, Y.; Liu, F.; Liu, Y. Introducing a novice-friendly classification system for magnetic resonance imaging of the temporomandibular joint disc morphology. Oral Radiol. 2022. [Google Scholar] [CrossRef]
- Arayasantiparb, R.; Tsuchimochi, M. Quantification of disc displacement in internal derangement of the temporomandibular joint using magnetic resonance imaging. Odontology 2010, 98, 73–81. [Google Scholar] [CrossRef]
- Yang, Z.; Wang, M.; Ma, Y.; Lai, Q.; Tong, D.; Zhang, F.; Dong, L. Magnetic Resonance Imaging (MRI) Evaluation for Anterior Disc Displacement of the Temporomandibular Joint. Med. Sci. Monit. Int. Med. J. Exp. Clin. Res. 2017, 23, 712–718. [Google Scholar] [CrossRef] [Green Version]
- Yılmaz, D.; Kamburoğlu, K. Comparison of the effectiveness of high resolution ultrasound with MRI in patients with temporomandibular joint dısorders. Dento Maxillo Facial Radiol. 2019, 48, 20180349. [Google Scholar] [CrossRef]
- Schiffman, E.; Ohrbach, R.; Truelove, E.; Look, J.; Anderson, G.; Goulet, J.-P.; List, T.; Svensson, P.; Gonzalez, Y.; Lobbezoo, F.; et al. Diagnostic Criteria for Temporomandibular Disorders (DC/TMD) for Clinical and Research Applications: Recommendations of the International RDC/TMD Consortium Network* and Orofacial Pain Special Interest Group†. J. Oral Facial Pain Headache 2014, 28, 6–27. [Google Scholar] [CrossRef]
- Kumar, R.; Pallagatti, S.; Sheikh, S.; Mittal, A.; Gupta, D.; Gupta, S. Correlation Between Clinical Findings of Temporomandibular Disorders and MRI Characteristics of Disc Displacement. Open Dent. J. 2015, 9, 273–281. [Google Scholar] [CrossRef]
- Vogl, T.J.; Lauer, H.-C.; Lehnert, T.; Naguib, N.N.; Ottl, P.; Filmann, N.; Soekamto, H.; Nour-Eldin, N.-E.A. The value of MRI in patients with temporomandibular joint dysfunction: Correlation of MRI and clinical findings. Eur. J. Radiol. 2016, 85, 714–719. [Google Scholar] [CrossRef]
- Nebbe, B.; Major, P.W.; Prasad, N.G.; Hatcher, D. Quantitative assessment of temporomandibular joint disk status. Oral Surg. Oral Med. Oral Pathol. Oral Radiol. Endod. 1998, 85, 598–607. [Google Scholar] [CrossRef]
- Xie, Q.; Yang, C.; He, D.; Cai, X.; Ma, Z.; Shen, Y.; Abdelrehem, A. Will unilateral temporomandibular joint anterior disc displacement in teenagers lead to asymmetry of condyle and mandible? A longitudinal study. J. Cranio-Maxillo-Facial Surg. Off. Publ. Eur. Assoc. Cranio-Maxillo-Facial Surg. 2016, 44, 590–596. [Google Scholar] [CrossRef]
- de Farias, J.F.; Melo, S.L.; Bento, P.M.; Oliveira, L.S.; Campos, P.S.; de Melo, D.P. Correlation between temporomandibular joint morphology and disc displacement by MRI. Dento Maxillo Facial Radiol. 2015, 44, 20150023. [Google Scholar] [CrossRef] [Green Version]
- Isberg, A.; Hägglund, M.; Paesani, D. The effect of age and gender on the onset of symptomatic temporomandibular joint disk displacement. Oral Surg. Oral Med. Oral Pathol. Oral Radiol. Endod. 1998, 85, 252–257. [Google Scholar] [CrossRef]
- Park, Y.; Chen, S.; Ahmad, N.; Hayami, T.; Kapila, S. Estrogen Selectively Enhances TMJ Disc but Not Knee Meniscus Matrix Loss. J. Dent. Res. 2019, 98, 1532–1538. [Google Scholar] [CrossRef]
- Campos, M.I.; Campos, P.S.; Cangussu, M.C.; Guimarães, R.C.; Line, S.R. Analysis of magnetic resonance imaging characteristics and pain in temporomandibular joints with and without degenerative changes of the condyle. Int. J. Oral Maxillofac. Surg. 2008, 37, 529–534. [Google Scholar] [CrossRef] [PubMed]
- McCarroll, R.S.; Hesse, J.R.; Naeije, M.; Yoon, C.K.; Hansson, T.L. Mandibular border positions and their relationships with peripheral joint mobility. J. Oral Rehabil. 1987, 14, 125–131. [Google Scholar] [CrossRef] [PubMed]
- Takano, Y.; Moriwake, Y.; Tohmo, Y.; Minami, T.; Tohno, S.; Utsumi, M.; Yamada, M.-O.; Okazaki, Y.; Yamamoto, K. Age-related changes of elements in the human articular disk of the temporomandibular joint. Biol. Trace Elem. Res. 1999, 67, 269–276. [Google Scholar] [CrossRef]
- Almăşan, O.C.; Hedeşiu, M.; Băciuţ, G.; Leucuţa, D.C.; Băciuţ, M. Disk and joint morphology variations on coronal and sagittal MRI in temporomandibular joint disorders. Clin. Oral Investig. 2013, 17, 1243–1250. [Google Scholar] [CrossRef]
- Serindere, G.; Aktuna Belgin, C. MRI investigation of TMJ disc and articular eminence morphology in patients with disc displacement. J. Stomatol. Oral Maxillofac. Surg. 2021, 122, 3–6. [Google Scholar] [CrossRef]
- Wang, M.; Cao, H.; Ge, Y.; Widmalm, S.E. Magnetic resonance imaging on TMJ disc thickness in TMD patients: A pilot study. J. Prosthet. Dent. 2009, 102, 89–93. [Google Scholar] [CrossRef]
- Peroz, I.; Seidel, A.; Griethe, M.; Lemke, A.J. MRI of the TMJ: Morphometric comparison of asymptomatic volunteers and symptomatic patients. Quintessence Int. (Berl. Ger. 1985) 2011, 42, 659–667. [Google Scholar]
- Guarda Nardini, L.; Meneghini, M.; Guido, M.; Baciorri, F.; Manfredini, D. Histopathology of the temporomandibular joint disc: Findings in 30 samples from joints with degenerative disease. J. Oral Rehabil. 2021, 48, 1025–1034. [Google Scholar] [CrossRef]
- Ohnuki, T.; Fukuda, M.; Iino, M.; Takahashi, T. Magnetic resonance evaluation of the disk before and after arthroscopic surgery for temporomandibular joint disorders. Oral Surg. Oral Med. Oral Pathol. Oral Radiol. Endod. 2003, 96, 141–148. [Google Scholar] [CrossRef]
- Sato, S.; Sakamoto, M.; Kawamura, H.; Motegi, K. Long-term changes in clinical signs and symptoms and disc position and morphology in patients with nonreducing disc displacement in the temporomandibular joint. J. Oral Maxillofac. Surg. Off. J. Am. Assoc. Oral Maxillofac. Surg. 1999, 57, 23–29; discussion 29–30. [Google Scholar] [CrossRef]
- Leibur, E.; Jagur, O.; Müürsepp, P.; Veede, L.; Voog-Oras, U. Long-term evaluation of arthroscopic surgery with lysis and lavage of temporomandibular joint disorders. J. Cranio-Maxillo-Facial Surg. Off. Publ. Eur. Assoc. Cranio-Maxillo-Facial Surg. 2010, 38, 615–620. [Google Scholar] [CrossRef]
- Zhuo, Z.; Cai, X.; Xie, Q. Is anterior disc displacement without reduction associated with temporomandibular joint condylar height in juvenile patients younger than 20 years? J. Oral Maxillofac. Surg. Off. J. Am. Assoc. Oral Maxillofac. Surg. 2015, 73, 843–849. [Google Scholar] [CrossRef]
- Hall, H.D. Intra-articular disc displacement Part II: Its significant role in temporomandibular joint pathology. J. Oral Maxillofac. Surg. Off. J. Am. Assoc. Oral Maxillofac. Surg. 1995, 53, 1073–1079. [Google Scholar] [CrossRef]
- Sato, S.; Goto, S.; Nasu, F.; Motegi, K. Natural course of disc displacement with reduction of the temporomandibular joint: Changes in clinical signs and symptoms. J. Oral Maxillofac. Surg. Off. J. Am. Assoc. Oral Maxillofac. Surg. 2003, 61, 32–34. [Google Scholar] [CrossRef] [Green Version]
- Mazza, D.; Stasolla, A.; Kharrub, Z.; Maccioni, F.; Marini, M. MRI evaluation of morpho-structural alterations of the retrodiscal tissue in condylo-meniscal incoordination of the TMJ: Usefulness of individualised T2-weighted TSE sequences. La Radiol. Med. 2004, 107, 261–268. [Google Scholar]
- Lei, J.; Yap, A.U.; Li, Y.; Liu, M.Q.; Fu, K.Y. Clinical protocol for managing acute disc displacement without reduction: A magnetic resonance imaging evaluation. Int. J. Oral Maxillofac. Surg. 2020, 49, 361–368. [Google Scholar] [CrossRef]
- Lalue-Sanches, M.; Gonzaga, A.; Guimarães, A.; Ribeiro, E. Disc displacement with reduction of the temporomandibular joint: The real need for treatment. J. Pain Relief. 2015, 4, 2–5. [Google Scholar]
- Lei, J.; Yap, A.U.; Liu, M.Q.; Fu, K.Y. Condylar repair and regeneration in adolescents/young adults with early-stage degenerative temporomandibular joint disease: A randomised controlled study. J. Oral Rehabil. 2019, 46, 704–714. [Google Scholar] [CrossRef]
- Fan, P.; Xiong, X.; Cheng, Q.; Xiang, J.; Zhou, X.; Yi, Y.; Wang, J. Risk estimation of degenerative joint disease in temporomandibular disorder patients with different types of sagittal and coronal disc displacements: MRI and CBCT analysis. J. Oral Rehabil. 2022. [Google Scholar] [CrossRef]
- Young, A.L. Internal derangements of the temporomandibular joint: A review of the anatomy, diagnosis, and management. J. Indian Prosthodont. Soc. 2015, 15, 2–7. [Google Scholar] [CrossRef]


| Normal Position (n= 143) | ADDWR (n = 218) | ADDWoR (n = 328) | PDD (n = 28) | |
|---|---|---|---|---|
| Gender | ||||
| Female (n, %) | 115 (80.42) | 188 (86.24) | 282 (85.98) | 19 (67.86) |
| Male (n, %) | 28 (19.58) | 30 (13.76) | 46 (14.02) | 9 (32.14) |
| Morphology classification | ||||
| Class 1 (n, %) | 109 (76.22) | 67 (30.73) | 6 (1.83) | 22 (78.57) |
| Class 2 (n, %) | 34 (23.78) | 144 (66.06) | 96 (29.27) | 6 (21.43) |
| Class 3 (n, %) | 0 (0.0) | 7 (3.21) | 226 (68.90) | 0 (0.0) |
| Normal (n = 143) | ADDWR (n = 218) | ADDWoR (n = 328) | PDD (n = 28) | Class 1 (n = 204) | Class 2 (n = 280) | Class 3 (n = 233) | |
|---|---|---|---|---|---|---|---|
| Mean ± SD | 26.36 ± 10.18 | 28.96 ± 10.20 | 33.85 ± 12.37 | 26.28 ± 11.21 | 26.38 ± 10.60 | 28.28 ± 9.75 | 32.78 ± 12.45 |
| Median | 24 | 27 | 31 | 23 | 24 | 26 | 30 |
| Interquartile range | 19, 30 | 23, 32 | 23, 45 | 19, 30 | 19, 30 | 22, 32 | 23, 43 |
| Class 1 (n = 204) | Class 2 (n = 280) | Class 3 (n = 233) | p-Value | Multiple Comparison | |
|---|---|---|---|---|---|
| Distance | −1.04 ± 2.18 | 1.71 ± 2.22 | 5.13 ± 2.00 | <0.001 | 1 < 2 < 3 |
| Length | 11.13 ± 1.27 | 10.65 ± 1.55 | 8.28 ± 2.18 | <0.001 | 3 < 2 < 1 |
| Width | 0.89 ± 0.18 | 1.29 ± 0.37 | 1.56 ± 0.65 | <0.001 | 1 < 2 < 3 |
| L/W | 12.96 ± 2.78 | 8.14 ± 2.20 | 6.23 ± 2.99 | <0.001 | 3 < 2 < 1 |
| Normal (n = 143) | ADDWR (n = 218) | ADDWoR (n = 328) | PDD (N = 28) | p-Value | Multiple Comparison | |
|---|---|---|---|---|---|---|
| Distance | −1.67 ± 0.88 | 1.63 ± 0.89 | 4.67 ± 2.03 | −3.79 ± 0.66 | <0.001 | PDD < Normal < ADDWR < ADDWoR |
| Length | 11.05 ± 1.34 | 10.87 ± 1.27 | 8.83 ± 2.22 | 12.05 ± 1.35 | <0.001 | ADDWoR < ADDWR < PDD Normal < PDD |
| Width | 1.01 ± 0.31 | 1.19 ± 0.37 | 1.53 ± 0.60 | 1.07 ± 0.58 | <0.001 | Normal < ADDWR < ADDWoR PDD < ADDWoR |
| L/W | 11.85 ± 3.43 | 9.94 ± 3.03 | 6.63 ± 2.92 | 12.03 ± 0.14 | <0.001 | ADDWoR < ADDWR < Normal ADDWoR < ADDWR < PDD |
| (a) | |||||
| Class 1 (n = 204) | Class 2 (n = 280) | Class 3 (n = 233) | p-Value | ||
| Distance | −0.96 (−1.26, 10.67) | 1.68 (1.43,1.93) | 5.09 (4.82, 5.37) | <0.001 | |
| Length | 11.14 (10.91, 11.38) | 10.67 (10.47, 10.87) | 8.26 (8.04, 8.48) | <0.001 | |
| Width | 0.87 (0.81, 0.93) | 1.39 (1.34, 1.44) | 1.58 (1.52, 1.63) | <0.001 | |
| L/W | 13.04 (12.67, 13.40) | 8.14 (7.83, 8.45) | 6.15 (5.18, 6.49) | <0.001 | |
| (b) | |||||
| Normal (n = 143) | ADDWR (n = 218) | ADDWoR (n = 328) | PDD (n = 28) | p-Value | |
| Distance | −1.70 (−1.96, −1.45) | 1.63 (1.43, 1.84) | 4.68 (4.51, 4.85) | −3.82 (−4.38, −3.25) | <0.001 |
| Length | 11.10 (10.81, 11,40) | 10.87 (10.64, 11.11) | 8.81 (8.61, 9.00) | 12.02 (11.36, 12.68) | <0.001 |
| Width | 0.98 (0.90, 1.06) | 1.19 (1.13, 1.25) | 1.54 (1.49, 1.59) | 1.05 (0.88, 1.23) | <0.001 |
| L/W | 11.94 (11.43, 12.45) | 9.96 (9.55, 10.37) | 6.58 (6.25, 6.92) | 12.01 (10.87, 13.15) | <0.001 |
| Adjusted * β (95% CI) | p-Value | Difference † in Adjusted * β (95% CI) | p-Value | |
|---|---|---|---|---|
| All subjects | ||||
| Distance ≤ −1.8 mm | −0.6 (−0.9, −0.3) | <0.001 | Effect 2-1: 0.6 (0.4, 0.8) Effect 3-2: −0.7 (−0.8, −0.6) | <0.001 <0.001 |
| −1.8 mm < Distance ≤ 1.7 mm | 0.0 (−0.1, 0.0) | 0.027 | ||
| 1.7 mm < Distance | −0.7 (−0.8, −0.7) | <0.001 | ||
| ADD subjects | ||||
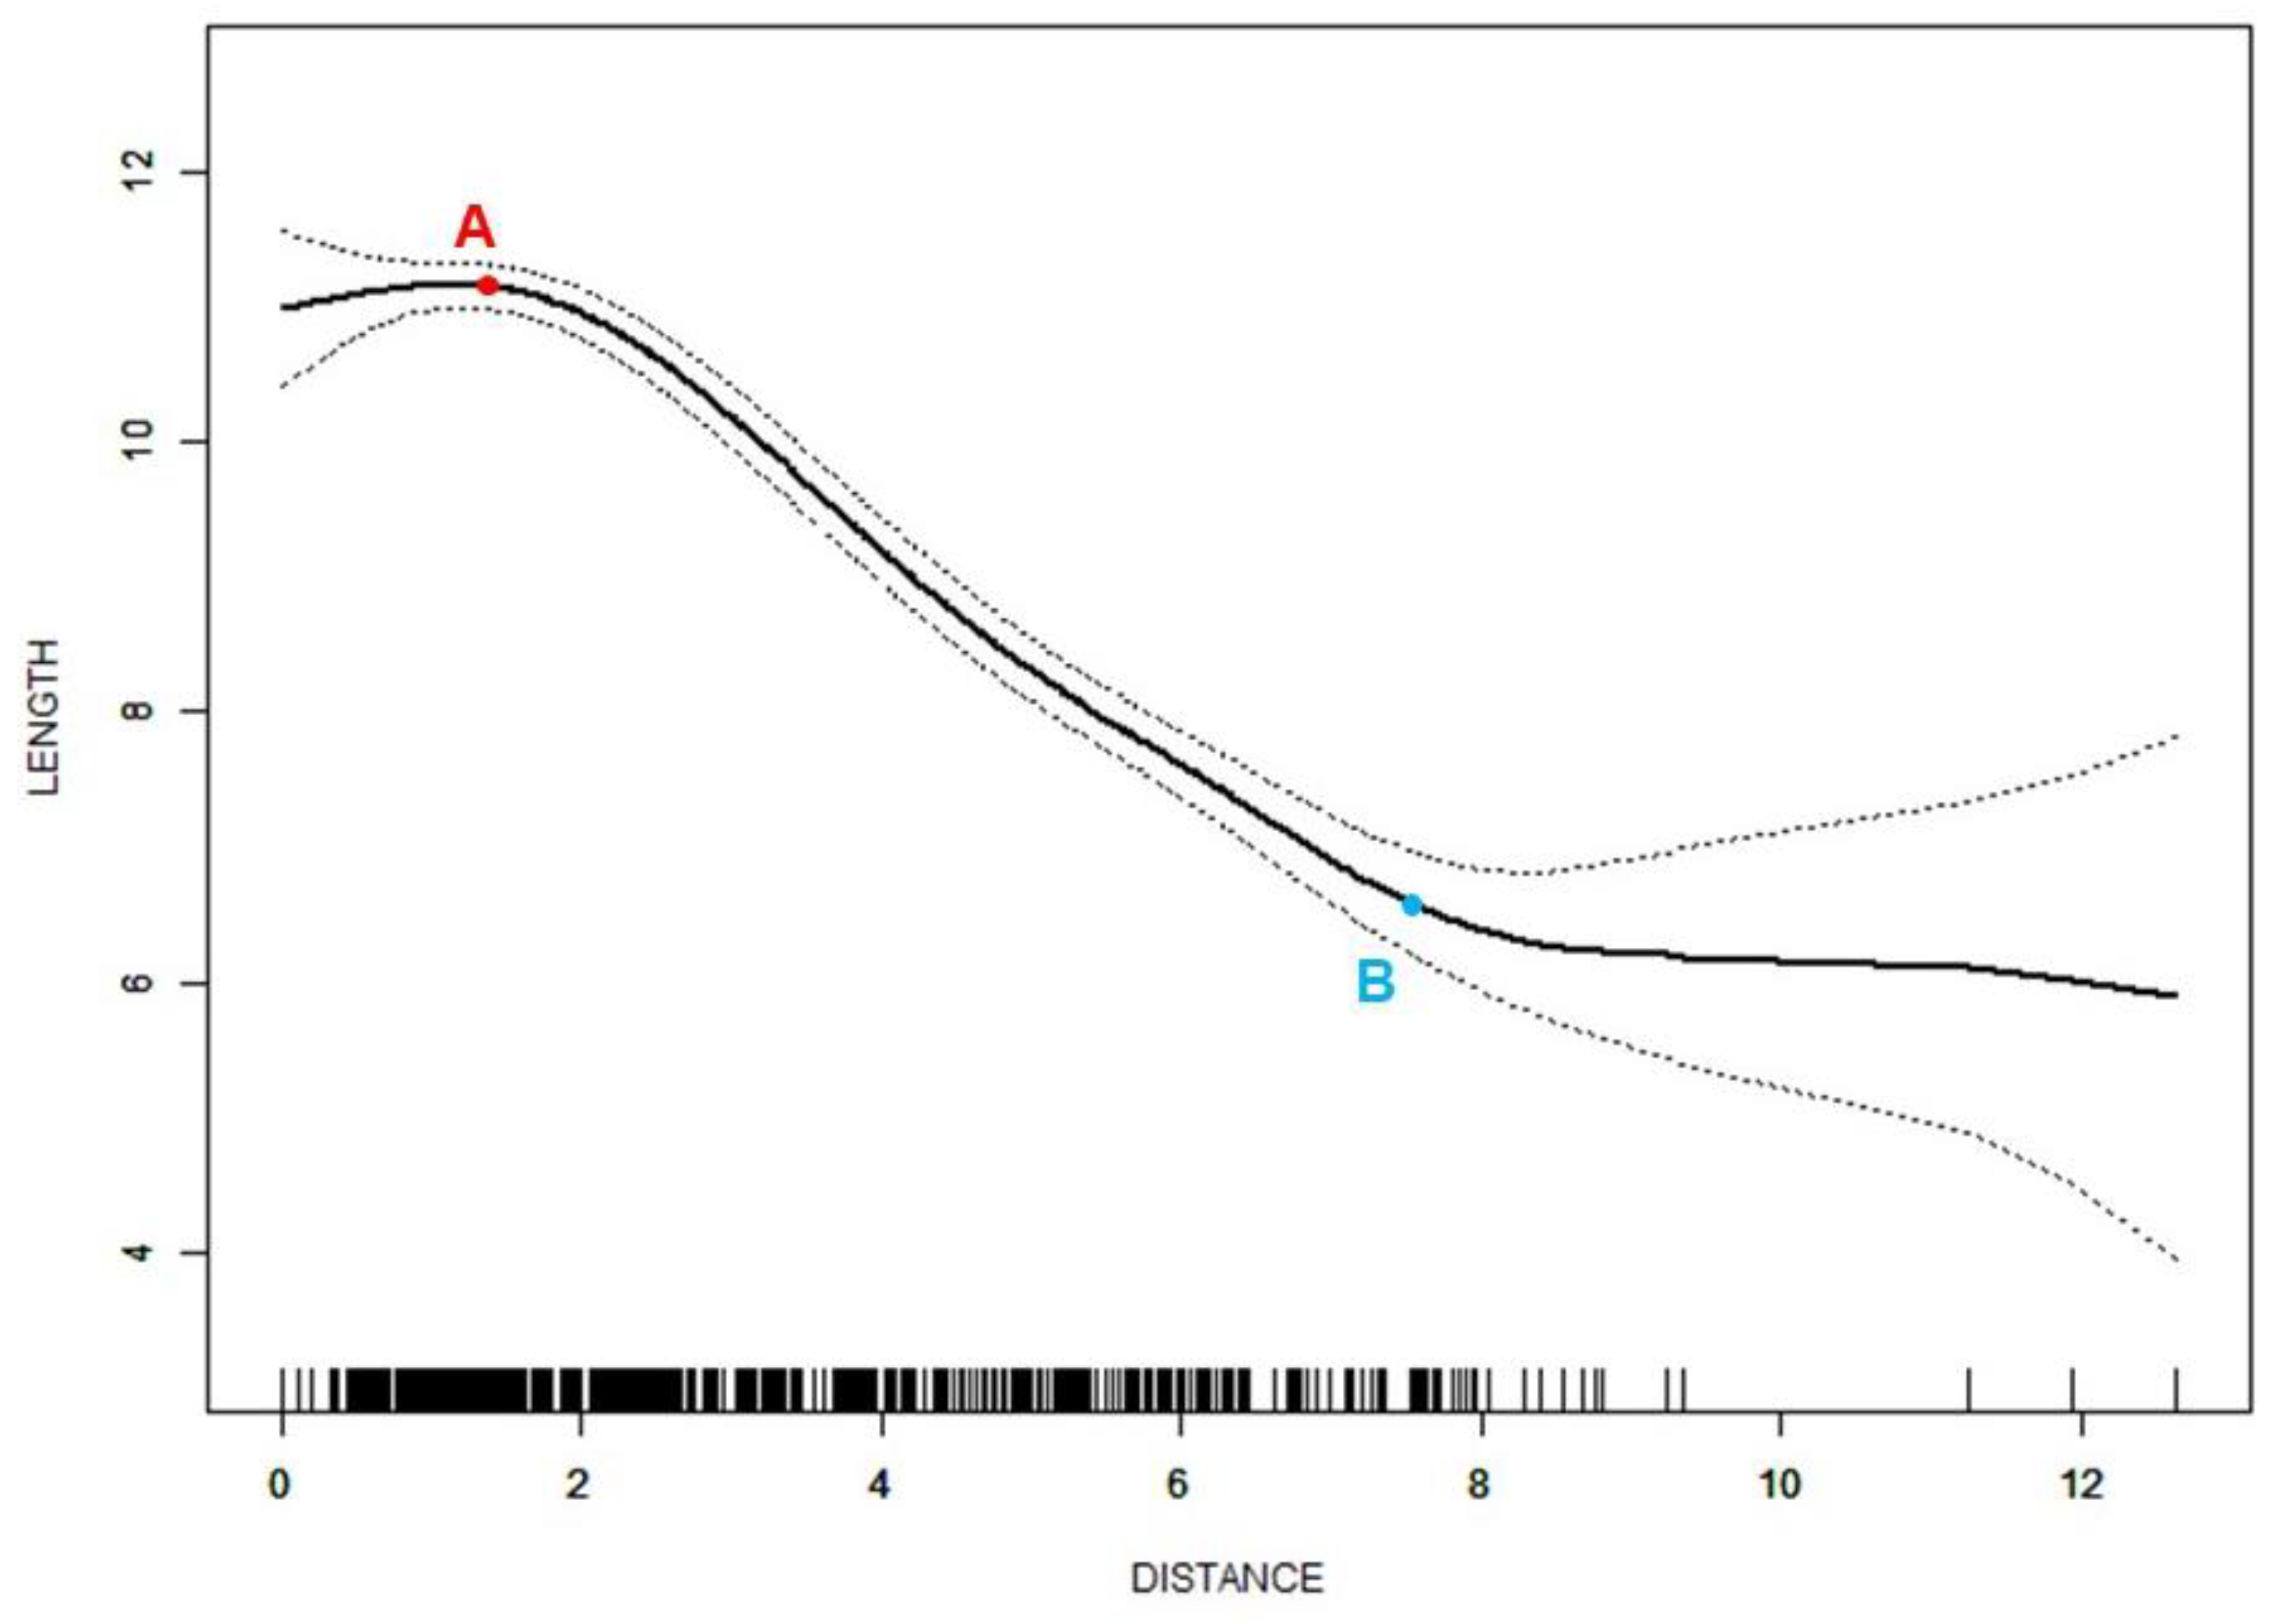
| Distance ≤ 1.4 mm | 0.4 (−0.1, 0.9) | 0.166 | Effect 2-1: −1.2 (−1.7, −0.7) Effect 3-2: 0.8 (0.4, 1.2) | <0.001 <0.001 |
| 1.4 mm < Distance ≤ 7.5 mm | −0.8 (−0.9, −0.8) | <0.001 | ||
| 7.5 mm < Distance | −0.0 (−0.4, 0.3) | 0.939 | ||
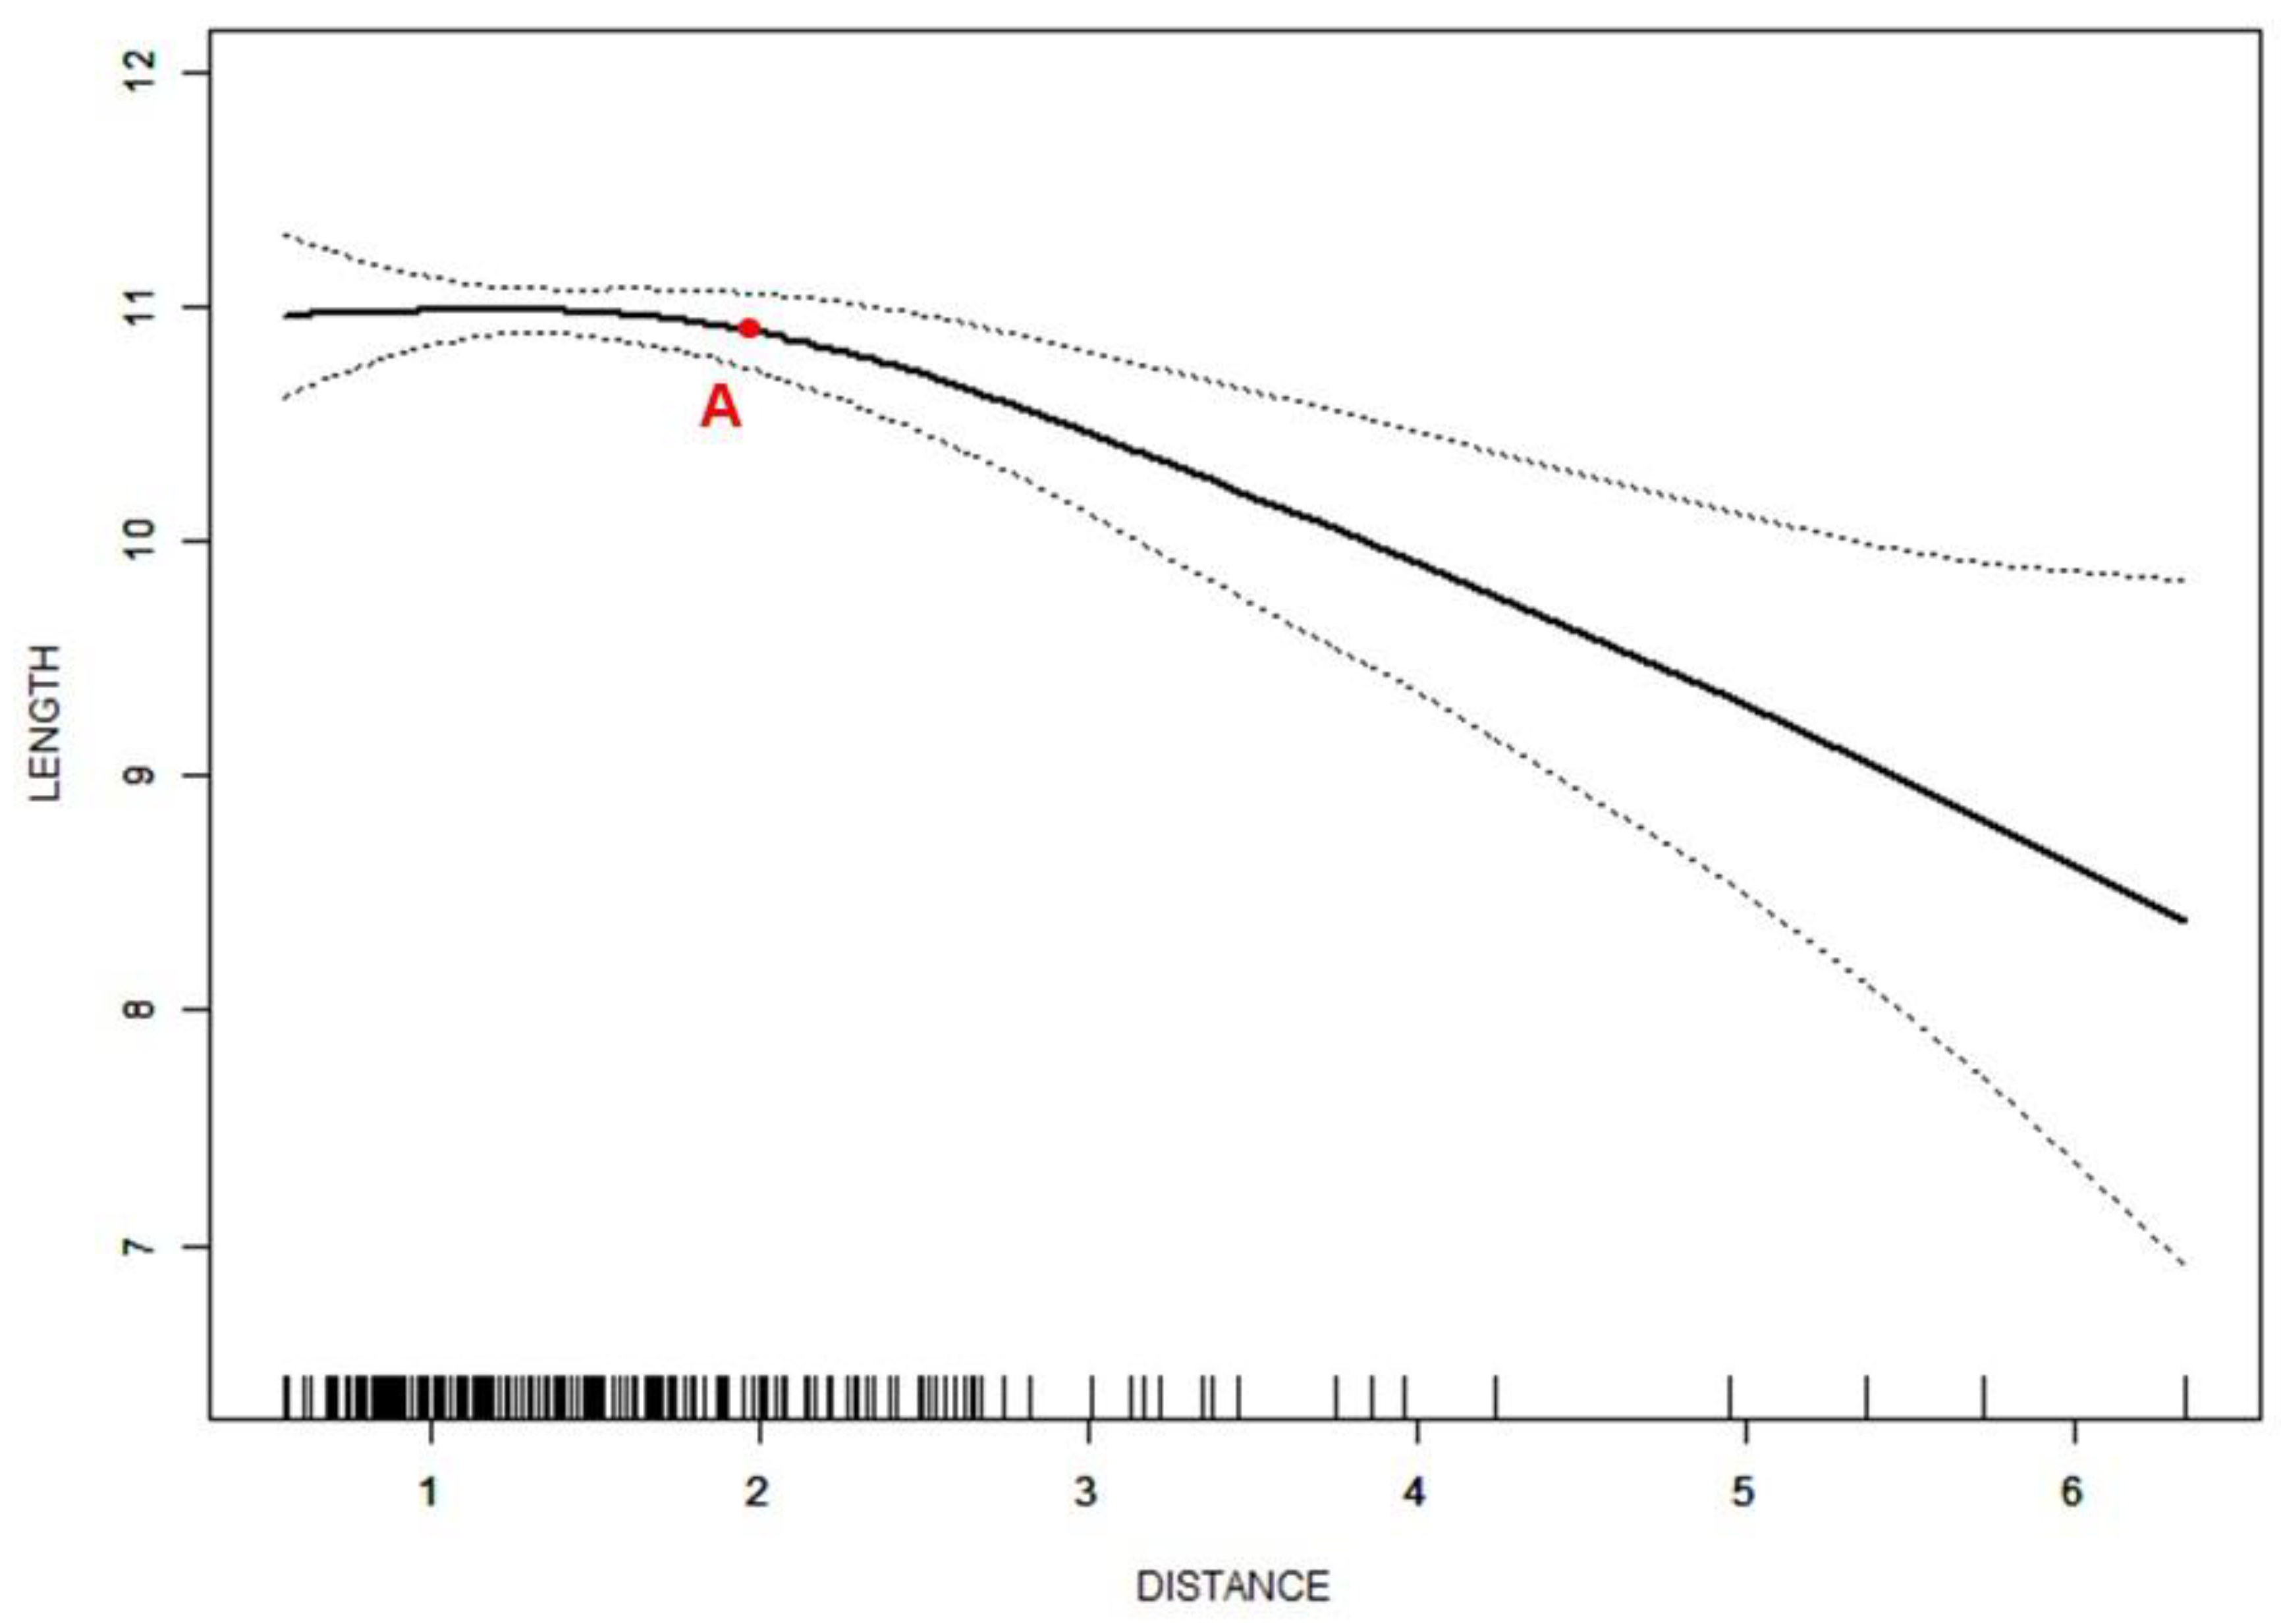
| ADDWR subjects | ||||
| Distance ≤ 2.0 mm | 0.1 (−0.3, 0.5) | 0.512 | Effect 2-1: −0.8 (−1.4, −0.2) | 0.009 |
| 2.0 mm < Distance | −0.7 (−1.0, −0.4) | <0.001 | ||
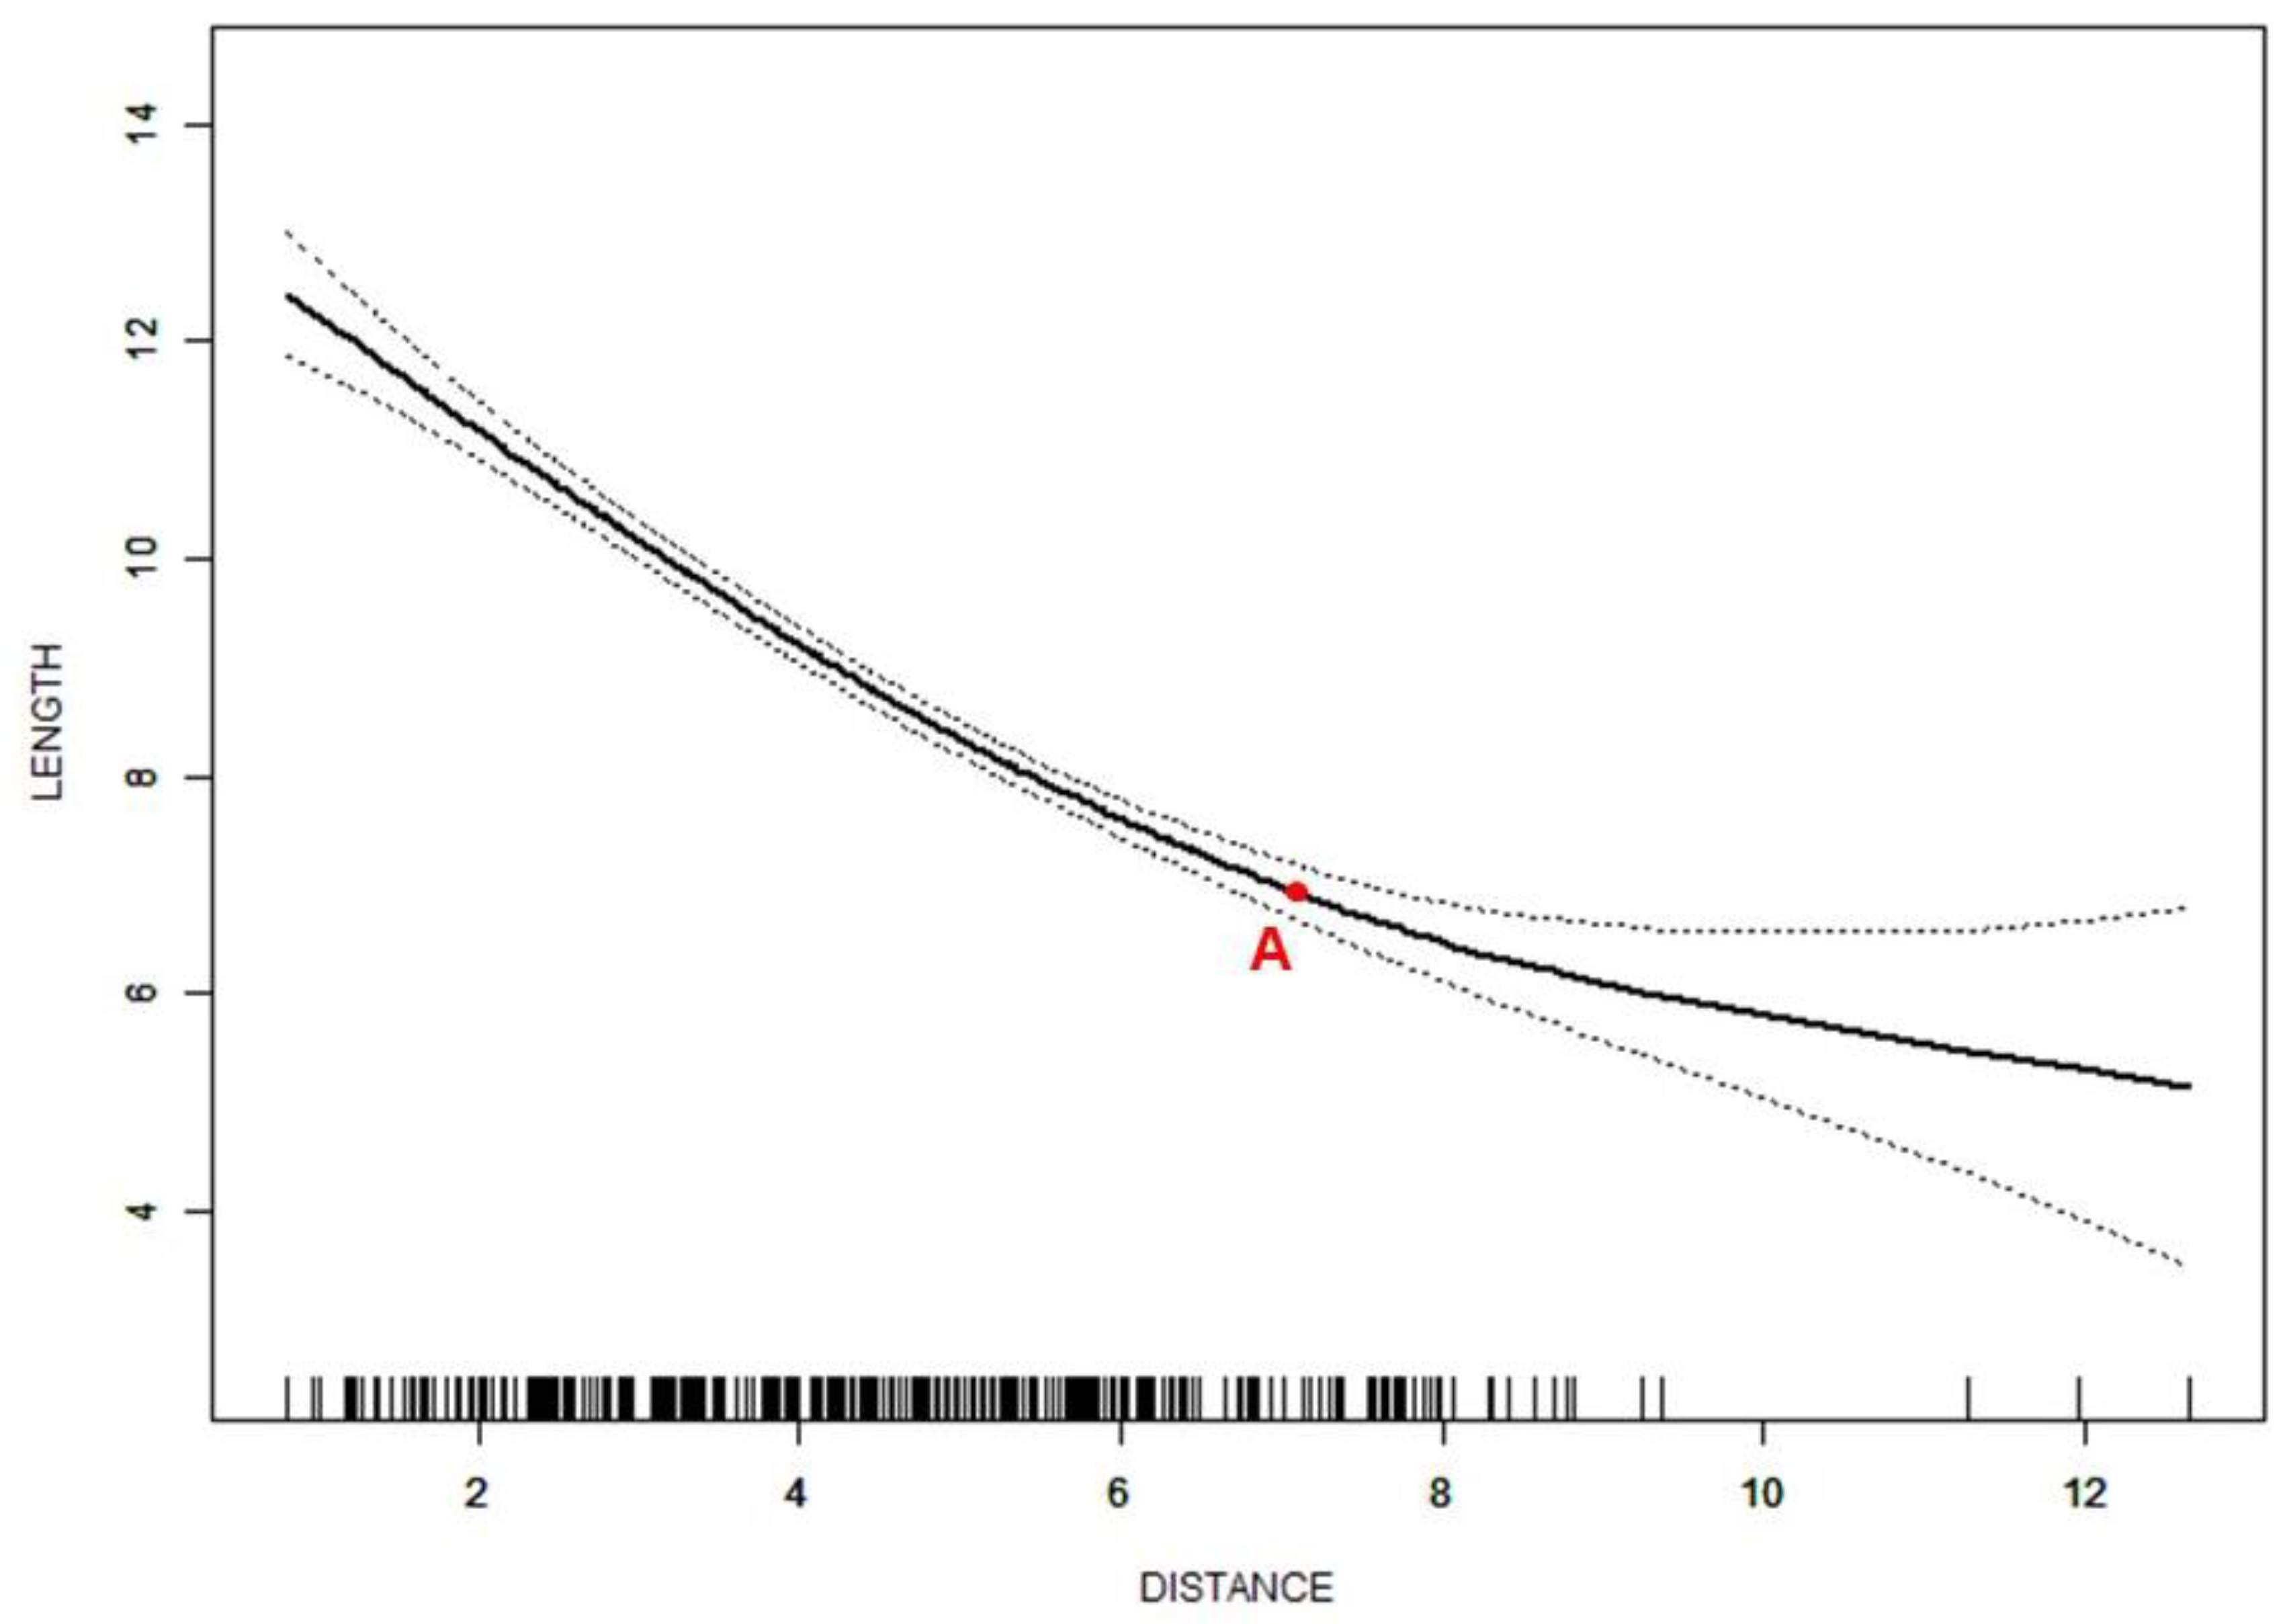
| ADDWoR subjects | ||||
| Distance ≤ 7.1 mm | −0.9 (−1.0, −0.8) | <0.001 | Effect 2-1: 0.8 (0.4, 1.2) | <0.001 |
| 7.1 mm < Distance | −0.1 (−0.4, 0.2) | 0.538 |
Publisher’s Note: MDPI stays neutral with regard to jurisdictional claims in published maps and institutional affiliations. |
© 2022 by the authors. Licensee MDPI, Basel, Switzerland. This article is an open access article distributed under the terms and conditions of the Creative Commons Attribution (CC BY) license (https://creativecommons.org/licenses/by/4.0/).
Share and Cite
Zhang, Q.; Ye, Z.; Wu, Y.; Zhu, Y.; Liu, J.; Yang, W.; Ye, C.; Lau Rui Han, S.; Wang, J.; Xiong, X. Nonlinear Relationship between Temporomandibular Joint Disc Displacement Distance and Disc Length: A Magnetic Resonance Imaging Analysis. J. Clin. Med. 2022, 11, 7160. https://doi.org/10.3390/jcm11237160
Zhang Q, Ye Z, Wu Y, Zhu Y, Liu J, Yang W, Ye C, Lau Rui Han S, Wang J, Xiong X. Nonlinear Relationship between Temporomandibular Joint Disc Displacement Distance and Disc Length: A Magnetic Resonance Imaging Analysis. Journal of Clinical Medicine. 2022; 11(23):7160. https://doi.org/10.3390/jcm11237160
Chicago/Turabian StyleZhang, Qinlanhui, Zheng Ye, Yange Wu, Yufan Zhu, Jiaqi Liu, Wenke Yang, Chengxinyue Ye, Sophie Lau Rui Han, Jun Wang, and Xin Xiong. 2022. "Nonlinear Relationship between Temporomandibular Joint Disc Displacement Distance and Disc Length: A Magnetic Resonance Imaging Analysis" Journal of Clinical Medicine 11, no. 23: 7160. https://doi.org/10.3390/jcm11237160