
Structural Equation Modeling of a Global Stress Index in Healthy Soldiers

 , ,
, ,
Abstract
:1. Introduction
2. Materials and Methods
2.1. Study Design and Recruitment
2.2. Participants and Missing Values
2.3. Measures
2.4. Data Analysis
3. Results
3.1. Descriptive and Initial Data Analyses
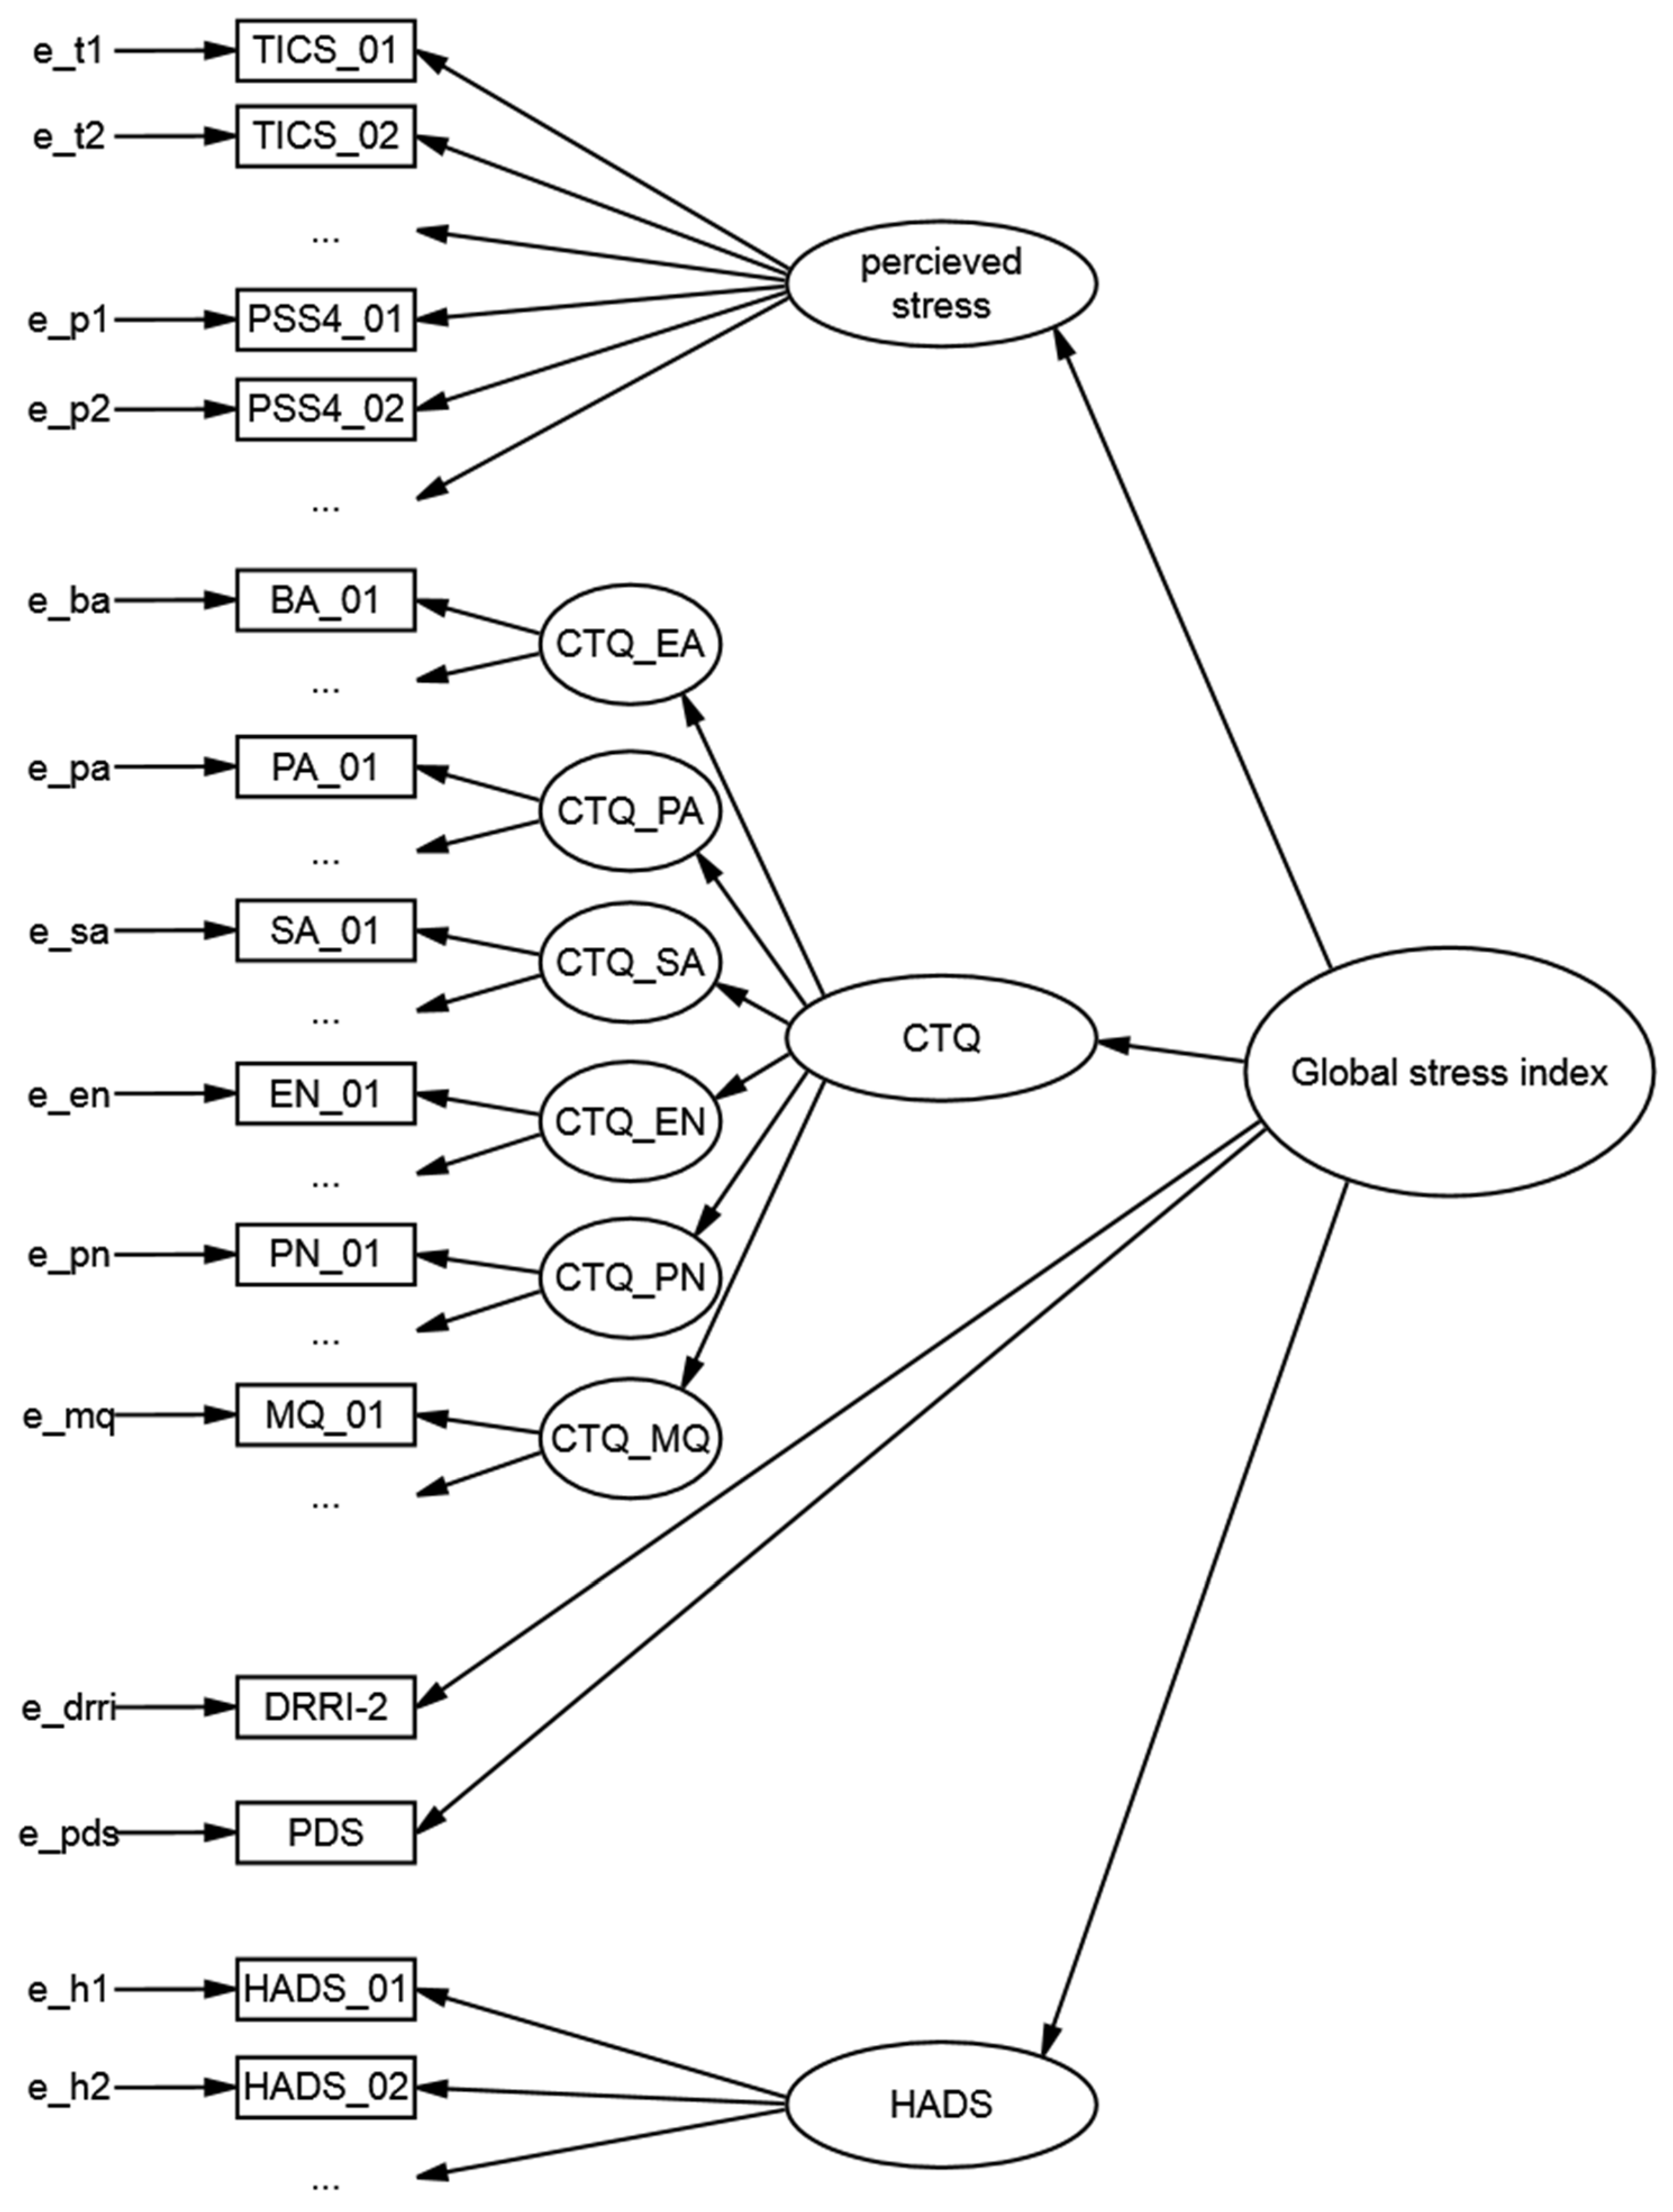
3.2. Structural Equation Model (SEM)
4. Discussion
4.1. Structural Equation Modeling
4.2. GSI and Cardiovascular Risk
4.3. Limitations of the Study
5. Conclusions
Author Contributions
Funding
Institutional Review Board Statement
Informed Consent Statement
Data Availability Statement
Acknowledgments
Conflicts of Interest
Appendix A

| Item | n | MIN | MAX | M | SD | Shapiro–Wilk |
|---|---|---|---|---|---|---|
| TICS_01 | 192 | 0 | 4 | 2.16 | 1.12 | W = 0.91 *** |
| TICS_02 | 191 | 0 | 4 | 1.78 | 0.97 | W = 0.87 *** |
| TICS_03 | 192 | 0 | 3 | 0.85 | 0.67 | W = 0.77 *** |
| TICS_04 | 191 | 0 | 4 | 1.53 | 0.98 | W = 0.90 *** |
| TICS_05 | 192 | 0 | 4 | 2.11 | 0.99 | W = 0.91 *** |
| TICS_06 | 192 | 0 | 4 | 1.56 | 0.77 | W = 0.85 *** |
| TICS_07 | 192 | 0 | 4 | 2.54 | 1.14 | W = 0.89 *** |
| TICS_08 | 192 | 0 | 4 | 1.87 | 0.94 | W = 0.90 *** |
| TICS_09 | 192 | 0 | 4 | 1.57 | 0.98 | W = 0.88 *** |
| TICS_10 | 192 | 0 | 4 | 1.51 | 1.09 | W = 0.89 *** |
| TICS_11 | 192 | 0 | 4 | 1.15 | 1.03 | W = 0.84 *** |
| TICS_12 | 192 | 0 | 4 | 1.68 | 1.01 | W = 0.90 *** |
| TICS_13 | 192 | 0 | 4 | 1.90 | 0.87 | W = 0.87 *** |
| TICS_14 | 192 | 0 | 4 | 2.09 | 0.97 | W = 0.90 *** |
| TICS_15 | 192 | 0 | 4 | 1.11 | 0.91 | W = 0.85 *** |
| TICS_16 | 192 | 0 | 4 | 1.35 | 1.05 | W = 0.88 *** |
| TICS_17 | 192 | 0 | 4 | 1.56 | 1.08 | W = 0.91 *** |
| TICS_18 | 163 | 0 | 4 | 1.28 | 1.09 | W = 0.88 *** |
| TICS_19 | 192 | 0 | 4 | 1.61 | 1.03 | W = 0.90 *** |
| TICS_20 | 192 | 0 | 4 | 0.81 | 0.80 | W = 0.77 *** |
| TICS_21 | 192 | 0 | 4 | 1.47 | 1.04 | W = 0.90 *** |
| TICS_22 | 192 | 0 | 4 | 2.37 | 1.03 | W = 0.90 *** |
| TICS_23 | 192 | 0 | 4 | 2.36 | 1.02 | W = 0.88 *** |
| TICS_24 | 190 | 0 | 3 | 0.63 | 0.68 | W = 0.76 *** |
| TICS_25 | 192 | 0 | 4 | 1.11 | 1.01 | W = 0.86 *** |
| TICS_26 | 192 | 0 | 4 | 1.06 | 0.94 | W = 0.84 *** |
| TICS_27 | 192 | 0 | 4 | 2.26 | 1.09 | W = 0.90 *** |
| TICS_28 | 192 | 0 | 4 | 1.58 | 1.05 | W = 0.90 *** |
| TICS_29 | 192 | 0 | 4 | 1.34 | 0.99 | W = 0.89 *** |
| TICS_30 | 192 | 0 | 4 | 1.72 | 0.98 | W = 0.90 *** |
| TICS_31 | 192 | 0 | 4 | 1.29 | 1.09 | W = 0.89 *** |
| TICS_32 | 191 | 0 | 4 | 2.47 | 0.89 | W = 0.88 *** |
| TICS_33 | 192 | 0 | 4 | 1.01 | 0.98 | W = 0.82 *** |
| TICS_34 | 191 | 0 | 4 | 0.90 | 0.96 | W = 0.83 *** |
| TICS_35 | 191 | 0 | 4 | 1.00 | 0.81 | W = 0.80 *** |
| TICS_36 | 192 | 0 | 4 | 1.25 | 1.08 | W = 0.86 *** |
| TICS_37 | 192 | 0 | 4 | 1.24 | 1.00 | W = 0.88 *** |
| TICS_38 | 192 | 0 | 4 | 1.57 | 1.01 | W = 0.90 *** |
| TICS_39 | 192 | 0 | 4 | 1.80 | 1.26 | W = 0.91 *** |
| TICS_40 | 192 | 0 | 4 | 1.38 | 1.05 | W = 0.89 *** |
| TICS_41 | 191 | 0 | 4 | 1.46 | 1.02 | W = 0.89 *** |
| TICS_42 | 191 | 0 | 4 | 1.14 | 0.97 | W = 0.85 *** |
| TICS_43 | 191 | 0 | 4 | 2.57 | 0.92 | W = 0.89 *** |
| TICS_44 | 191 | 0 | 4 | 1.26 | 0.98 | W = 0.86 *** |
| TICS_45 | 191 | 0 | 4 | 0.76 | 0.87 | W = 0.78 *** |
| TICS_46 | 190 | 0 | 4 | 1.37 | 1.11 | W = 0.88 *** |
| TICS_47 | 191 | 0 | 4 | 1.21 | 0.97 | W = 0.87 *** |
| TICS_48 | 191 | 0 | 4 | 1.63 | 1.00 | W = 0.89 *** |
| TICS_49 | 190 | 0 | 4 | 2.07 | 1.19 | W = 0.91 *** |
| TICS_50 | 191 | 0 | 4 | 1.49 | 1.03 | W = 0.89 *** |
| TICS_51 | 191 | 0 | 4 | 1.15 | 0.96 | W = 0.86 *** |
| TICS_52 | 191 | 0 | 4 | 0.86 | 0.85 | W = 0.81 *** |
| TICS_53 | 191 | 0 | 4 | 1.63 | 0.93 | W = 0.90 *** |
| TICS_54 | 191 | 0 | 4 | 1.09 | 1.02 | W = 0.84 *** |
| TICS_55 | 191 | 0 | 4 | 0.74 | 0.78 | W = 0.79 *** |
| TICS_56 | 191 | 0 | 4 | 1.38 | 1.11 | W = 0.90 *** |
| TICS_57 | 191 | 0 | 4 | 0.97 | 0.93 | W = 0.83 *** |
| PSS4_01 | 191 | 0 | 4 | 1.63 | 1.03 | W = 0.91 *** |
| PSS4_02 | 190 | 0 | 4 | 2.87 | 0.84 | W = 0.81 *** |
| PSS4_03 | 191 | 0 | 4 | 2.56 | 0.91 | W = 0.87 *** |
| PSS4_04 | 191 | 0 | 4 | 1.23 | 1.05 | W = 0.84 *** |
| CTQ_01 | 192 | 1 | 5 | 1.18 | 0.69 | W = 0.33 *** |
| CTQ_02 | 192 | 1 | 5 | 1.63 | 1.02 | W = 0.66 *** |
| CTQ_03 | 191 | 1 | 5 | 1.53 | 0.92 | W = 0.57 *** |
| CTQ_04 | 192 | 1 | 5 | 1.17 | 0.64 | W = 0.29 *** |
| CTQ_05 | 191 | 1 | 5 | 1.79 | 1.19 | W = 0.68 *** |
| CTQ_06 | 192 | 1 | 5 | 1.09 | 0.43 | W = 0.20 *** |
| CTQ_07 | 192 | 1 | 5 | 1.76 | 1.10 | W = 0.71 *** |
| CTQ_08 | 192 | 1 | 5 | 1.29 | 0.84 | W = 0.39 *** |
| CTQ_09 | 192 | 1 | 5 | 1.22 | 0.74 | W = 0.38 *** |
| CTQ_10 | 192 | 1 | 5 | 3.22 | 1.34 | W = 0.89 *** |
| CTQ_11 | 192 | 1 | 5 | 1.32 | 0.82 | W = 0.45 *** |
| CTQ_12 | 192 | 1 | 5 | 1.44 | 0.94 | W = 0.54 *** |
| CTQ_13 | 191 | 1 | 5 | 2.04 | 1.10 | W = 0.83 *** |
| CTQ_14 | 192 | 1 | 5 | 1.77 | 1.06 | W = 0.70 *** |
| CTQ_15 | 192 | 1 | 5 | 1.19 | 0.73 | W = 0.26 *** |
| CTQ_16 | 190 | 1 | 5 | 3.38 | 1.19 | W = 0.89 *** |
| CTQ_17 | 191 | 1 | 5 | 1.13 | 0.61 | W = 0.23 *** |
| CTQ_18 | 191 | 1 | 5 | 1.32 | 0.90 | W = 0.39 *** |
| CTQ_19 | 189 | 1 | 5 | 2.20 | 1.13 | W = 0.86 *** |
| CTQ_20 | 191 | 1 | 5 | 1.16 | 0.70 | W = 0.17 *** |
| CTQ_21 | 191 | 1 | 5 | 1.05 | 0.39 | W = 0.11 *** |
| CTQ_22 | 191 | 1 | 5 | 3.50 | 1.25 | W = 0.87 *** |
| CTQ_23 | 191 | 1 | 5 | 1.14 | 0.66 | W = 0.18 *** |
| CTQ_24 | 191 | 1 | 5 | 1.13 | 0.64 | W = 0.18 *** |
| CTQ_25 | 190 | 1 | 5 | 1.21 | 0.70 | W = 0.34 *** |
| CTQ_26 | 191 | 1 | 5 | 1.40 | 0.93 | W = 0.51 *** |
| CTQ_27 | 191 | 1 | 5 | 1.11 | 0.57 | W = 0.15 *** |
| CTQ_28 | 190 | 1 | 5 | 2.22 | 1.17 | W = 0.84 *** |
| HADS_01 | 192 | 0 | 3 | 0.86 | 0.71 | W = 0.80 *** |
| HADS_02 | 192 | 0 | 3 | 0.81 | 0.88 | W = 0.80 *** |
| HADS_03 | 192 | 0 | 3 | 0.74 | 0.88 | W = 0.78 *** |
| HADS_04 | 191 | 0 | 3 | 0.41 | 0.63 | W = 0.68 *** |
| HADS_05 | 192 | 0 | 3 | 0.70 | 0.76 | W = 0.78 *** |
| HADS_06 | 192 | 0 | 3 | 0.45 | 0.71 | W = 0.65 *** |
| HADS_07 | 192 | 0 | 3 | 0.85 | 0.79 | W = 0.82 *** |
| HADS_08 | 192 | 0 | 3 | 0.88 | 0.68 | W = 0.76 *** |
| HADS_09 | 192 | 0 | 3 | 0.52 | 0.58 | W = 0.69 *** |
| HADS_10 | 191 | 0 | 3 | 0.43 | 0.71 | W = 0.67 *** |
| HADS_11 | 192 | 0 | 3 | 0.98 | 0.79 | W = 0.83 *** |
| HADS_12 | 192 | 0 | 3 | 0.54 | 0.72 | W = 0.74 *** |
| HADS_13 | 192 | 0 | 2 | 0.31 | 0.56 | W = 0.58 *** |
| HADS_14 | 192 | 0 | 3 | 0.40 | 0.72 | W = 0.59 *** |
| DRRI_2 | 178 | 0 | 9 | 2.04 | 2.10 | W = 0.83 *** |
| PDS | 163 | 0 | 5 | 1.80 | 1.45 | W = 0.92 *** |
Appendix B
| Items/Factors | Loading/Covariance/Intercept | SE Loading | p | Variance | SE Variance | p | |
|---|---|---|---|---|---|---|---|
| GSI ~ | 0.31 | 0.05 | <0.001 | ||||
| 1 | 2.10 | 0.09 | <0.001 | ||||
| perceived stress | 1.00 | 0.24 | 0.05 | <0.001 | |||
| HADS | 0.40 | 0.03 | <0.001 | 0.17 | 0.03 | <0.001 | |
| CTQ | 0.71 | 0.04 | <0.001 | 0.15 | 0.03 | <0.001 | |
| PDS | 0.85 | 0.06 | <0.001 | 1.98 | 0.23 | <0.001 | |
| DRRI_2 | 1.02 | 0.08 | <0.001 | 3.73 | 0.41 | <0.001 | |
| perceived stress~ | |||||||
| TICS_01 | 1.00 | 0.94 | 0.10 | <0.001 | |||
| TICS_02 | 0.84 | 0.04 | <0.001 | 0.59 | 0.06 | <0.001 | |
| TICS_03 | 0.41 | 0.02 | <0.001 | 0.33 | 0.03 | <0.001 | |
| TICS_04 | 0.74 | 0.03 | <0.001 | 0.60 | 0.06 | <0.001 | |
| TICS_05 | 0.95 | 0.04 | <0.001 | 0.92 | 0.10 | <0.001 | |
| TICS_06 | 0.72 | 0.03 | <0.001 | 0.42 | 0.04 | <0.001 | |
| TICS_07 | 1.12 | 0.05 | <0.001 | 1.26 | 0.12 | <0.001 | |
| TICS_08 | 0.85 | 0.04 | <0.001 | 0.81 | 0.09 | <0.001 | |
| TICS_09 | 0.76 | 0.03 | <0.001 | 0.59 | 0.06 | <0.001 | |
| TICS_10 | 0.67 | 0.04 | <0.001 | 0.89 | 0.08 | <0.001 | |
| TICS_11 | 0.55 | 0.04 | <0.001 | 0.89 | 0.09 | <0.001 | |
| TICS_12 | 0.79 | 0.04 | <0.001 | 0.74 | 0.08 | <0.001 | |
| TICS_13 | 0.88 | 0.04 | <0.001 | 0.55 | 0.06 | <0.001 | |
| TICS_14 | 0.95 | 0.04 | <0.001 | 0.82 | 0.09 | <0.001 | |
| TICS_15 | 0.54 | 0.03 | <0.001 | 0.61 | 0.06 | <0.001 | |
| TICS_16 | 0.54 | 0.03 | <0.001 | 0.74 | 0.08 | <0.001 | |
| TICS_17 | 0.76 | 0.04 | <0.001 | 0.75 | 0.08 | <0.001 | |
| TICS_18 | 0.63 | 0.04 | <0.001 | 0.84 | 0.09 | <0.001 | |
| TICS_19 | 0.78 | 0.04 | <0.001 | 0.60 | 0.06 | <0.001 | |
| TICS_20 | 0.41 | 0.03 | <0.001 | 0.47 | 0.05 | <0.001 | |
| TICS_21 | 0.67 | 0.04 | <0.001 | 1.04 | 0.11 | <0.001 | |
| TICS_22 | 1.06 | 0.05 | <0.001 | 1.06 | 0.11 | <0.001 | |
| TICS_23 | 1.06 | 0.05 | <0.001 | 1.01 | 0.11 | <0.001 | |
| TICS_24 | 0.33 | 0.02 | <0.001 | 0.32 | 0.03 | <0.001 | |
| TICS_25 | 0.57 | 0.03 | <0.001 | 0.61 | 0.06 | <0.001 | |
| TICS_26 | 0.52 | 0.03 | <0.001 | 0.65 | 0.07 | <0.001 | |
| TICS_27 | 1.05 | 0.05 | <0.001 | 0.87 | 0.09 | <0.001 | |
| TICS_28 | 0.77 | 0.04 | <0.001 | 0.64 | 0.07 | <0.001 | |
| TICS_29 | 0.65 | 0.03 | <0.001 | 0.71 | 0.07 | <0.001 | |
| TICS_30 | 0.78 | 0.04 | <0.001 | 0.94 | 0.01 | <0.001 | |
| TICS_31 | 0.64 | 0.04 | <0.001 | 0.81 | 0.08 | <0.001 | |
| TICS_32 | 1.10 | 0.05 | <0.001 | 0.89 | 0.10 | <0.001 | |
| TICS_33 | 0.50 | 0.03 | <0.001 | 0.71 | 0.07 | <0.001 | |
| TICS_34 | 0.46 | 0.03 | <0.001 | 0.70 | 0.07 | <0.001 | |
| TICS_35 | 0.49 | 0.03 | <0.001 | 0.48 | 0.05 | <0.001 | |
| TICS_36 | 0.63 | 0.04 | <0.001 | 0.78 | 0.08 | <0.001 | |
| TICS_37 | 0.61 | 0.03 | <0.001 | 0.68 | 0.07 | <0.001 | |
| TICS_38 | 0.78 | 0.03 | <0.001 | 0.46 | 0.05 | <0.001 | |
| TICS_39 | 0.86 | 0.05 | <0.001 | 1.20 | 0.12 | <0.001 | |
| TICS_40 | 0.67 | 0.04 | <0.001 | 0.74 | 0.08 | <0.001 | |
| TICS_41 | 0.62 | 0.04 | <0.001 | 1.25 | 0.13 | <0.001 | |
| TICS_42 | 0.55 | 0.03 | <0.001 | 0.77 | 0.08 | <0.001 | |
| TICS_43 | 1.15 | 0.05 | <0.001 | 0.84 | 0.09 | <0.001 | |
| TICS_44 | 0.64 | 0.03 | <0.001 | 0.49 | 0.05 | <0.001 | |
| TICS_45 | 0.41 | 0.03 | <0.001 | 0.53 | 0.05 | <0.001 | |
| TICS_46 | 0.68 | 0.04 | <0.001 | 0.81 | 0.08 | <0.001 | |
| TICS_47 | 0.60 | 0.03 | <0.001 | 0.62 | 0.07 | <0.001 | |
| TICS_48 | 0.74 | 0.04 | <0.001 | 0.94 | 0.10 | <0.001 | |
| TICS_49 | 0.94 | 0.05 | <0.001 | 1.26 | 0.13 | <0.001 | |
| TICS_50 | 0.73 | 0.03 | <0.001 | 0.62 | 0.07 | <0.001 | |
| TICS_51 | 0.56 | 0.03 | <0.001 | 0.67 | 0.07 | <0.001 | |
| TICS_52 | 0.43 | 0.03 | <0.001 | 0.52 | 0.05 | <0.001 | |
| TICS_53 | 0.74 | 0.04 | <0.001 | 0.78 | 0.08 | <0.001 | |
| TICS_54 | 0.57 | 0.03 | <0.001 | 0.62 | 0.07 | <0.001 | |
| TICS_55 | 0.38 | 0.02 | <0.001 | 0.41 | 0.04 | <0.001 | |
| TICS_56 | 0.66 | 0.04 | <0.001 | 0.98 | 0.10 | <0.001 | |
| TICS_57 | 0.50 | 0.03 | <0.001 | 0.56 | 0.06 | <0.001 | |
| PSS4_01 | 0.79 | 0.04 | <0.001 | 0.65 | 0.07 | <0.001 | |
| PSS4_02 | −0.42 | 0.08 | <0.001 | 0.60 | 0.06 | <0.001 | |
| PSS4_03 | −0.45 | 0.09 | <0.001 | 0.71 | 0.07 | <0.001 | |
| PSS4_04 | 0.61 | 0.03 | <0.001 | 0.74 | 0.08 | <0.001 | |
| HADS~ | |||||||
| HADS_01 | 1.00 | 0.30 | 0.04 | <0.001 | |||
| HADS_02 | 1.01 | 0.07 | <0.001 | 0.47 | 0.05 | <0.001 | |
| HADS_03 | 0.96 | 0.07 | <0.001 | 0.46 | 0.05 | <0.001 | |
| HADS_04 | 0.59 | 0.05 | <0.001 | 0.24 | 0.03 | <0.001 | |
| HADS_05 | 0.89 | 0.06 | <0.001 | 0.31 | 0.04 | <0.001 | |
| HADS_06 | 0.63 | 0.05 | <0.001 | 0.33 | 0.04 | <0.001 | |
| HADS_07 | 1.02 | 0.06 | <0.001 | 0.39 | 0.04 | <0.001 | |
| HADS_08 | 0.95 | 0.06 | <0.001 | 0.38 | 0.04 | <0.001 | |
| HADS_09 | 0.61 | 0.05 | <0.001 | 0.25 | 0.03 | <0.001 | |
| HADS_10 | 0.56 | 0.05 | <0.001 | 0.40 | 0.04 | <0.001 | |
| HADS_11 | 1.03 | 0.07 | <0.001 | 0.59 | 0.06 | <0.001 | |
| HADS_12 | 0.73 | 0.05 | <0.001 | 0.32 | 0.03 | <0.001 | |
| HADS_13 | 0.44 | 0.04 | <0.001 | 0.23 | 0.02 | <0.001 | |
| HADS_14 | 0.56 | 0.05 | <0.001 | 0.38 | 0.04 | <0.001 | |
| CTQ~ | |||||||
| CTQ_EA | 1.00 | 0.14 | 0.03 | <0.001 | |||
| CTQ_SA | 0.77 | 0.04 | <0.001 | 0.28 | 0.03 | <0.001 | |
| CTQ_PA | 0.81 | 0.04 | <0.001 | 0.12 | 0.02 | <0.001 | |
| CTQ_EN | 1.19 | 0.07 | <0.001 | 0.26 | 0.04 | <0.001 | |
| CTQ_PN | 0.76 | 0.04 | <0.001 | 0.04 | 0.01 | <0.001 | |
| CTQ_MQ | −1.20 | 0.11 | <0.001 | 0.59 | 0.09 | <0.001 | |
| CTQ_EA~ | |||||||
| CTQ_03 | 1.00 | 0.56 | 0.06 | <0.001 | |||
| CTQ_08 | 0.89 | 0.04 | <0.001 | 0.29 | 0.04 | <0.001 | |
| CTQ_14 | 1.19 | 0.05 | <0.001 | 0.52 | 0.07 | <0.001 | |
| CTQ_18 | 0.94 | 0.04 | <0.001 | 0.24 | 0.03 | <0.001 | |
| CTQ_25 | 0.34 | 0.05 | <0.001 | 0.22 | 0.02 | <0.001 | |
| CTQ_SA~ | |||||||
| CTQ_20 | 1.00 | 0.08 | 0.01 | <0.001 | |||
| CTQ_23 | 0.97 | 0.02 | <0.001 | 0.08 | 0.01 | <0.001 | |
| CTQ_24 | 0.96 | 0.02 | <0.001 | 0.06 | 0.01 | <0.001 | |
| CTQ_27 | 0.94 | 0.02 | <0.001 | 0.00 | 0.00 | 0.427 | |
| CTQ_PA~ | |||||||
| CTQ_09 | 1.00 | 0.27 | 0.03 | <0.001 | |||
| CTQ_11 | 1.11 | 0.04 | <0.001 | 0.20 | 0.03 | <0.001 | |
| CTQ_12 | 1.18 | 0.05 | <0.001 | 0.51 | 0.06 | <0.001 | |
| CTQ_15 | 0.99 | 0.04 | <0.001 | 0.21 | 0.03 | <0.001 | |
| CTQ_17 | 0.93 | 0.03 | <0.001 | 0.10 | 0.02 | <0.001 | |
| CTQ_EN~ | |||||||
| CTQ_05 | 1.00 | 0.81 | 0.09 | <0.001 | |||
| CTQ_07 | 1.01 | 0.04 | <0.001 | 0.43 | 0.05 | <0.001 | |
| CTQ_13 | 1.14 | 0.05 | <0.001 | 0.45 | 0.05 | <0.001 | |
| CTQ_19 | 1.24 | 0.05 | <0.001 | 0.36 | 0.05 | <0.001 | |
| CTQ_28 | 1.26 | 0.05 | <0.001 | 0.26 | 0.04 | <0.001 | |
| CTQ_PN~ | |||||||
| CTQ_01 | 1.00 | 0.40 | 0.05 | <0.001 | |||
| CTQ_02 | 1.46 | 0.07 | <0.001 | 0.57 | 0.07 | <0.001 | |
| CTQ_04 | 1.02 | 0.05 | <0.001 | 0.26 | 0.03 | <0.001 | |
| CTQ_06 | 0.93 | 0.04 | <0.001 | 0.11 | 0.02 | <0.001 | |
| CTQ_26 | 1.25 | 0.07 | <0.001 | 0.53 | 0.06 | <0.001 | |
| CTQ_MQ~ | |||||||
| 1 | 4.98 | 0.18 | <0.001 | ||||
| CTQ_10 | 1.00 | 0.95 | 0.11 | <0.001 | |||
| CTQ_16 | 1.06 | 0.03 | <0.001 | 0.35 | 0.05 | <0.001 | |
| CTQ_22 | 1.10 | 0.03 | <0.001 | 0.26 | 0.04 | <0.001 | |
| PSS4_02 | 1 | 3.50 | 0.19 | <0.001 | |||
| PSS4_03 | 1 | 3.76 | 0.17 | <0.001 | |||
| CTQ_SA~ | CTQ_25 | 0.57 | 0.06 | <0.001 | |||
| CTQ_EN~~ | CTQ_MQ | −0.33 | 0.05 | <0.001 | |||
| CTQ_23~~ | CTQ_24 | 0.05 | 0.01 | <0.001 | |||
| TICS_10~~ | |||||||
| TICS_21 | 0.27 | 0.08 | 0.001 | ||||
| TICS_41 | 0.48 | 0.09 | <0.001 | ||||
| TICS_53 | 0.24 | 0.06 | <0.001 | ||||
| TICS_07~~ | |||||||
| TICS_22 | 0.53 | 0.09 | <0.001 | ||||
| TICS_43 | 0.53 | 0.09 | <0.001 | ||||
| TICS_49 | 0.43 | 0.10 | <0.001 | ||||
| TICS_42~~ | TICS_51 | 0.47 | 0.06 | <0.001 | |||
| TICS_22~~ | TICS_43 | 0.58 | 0.08 | <0.001 | |||
| TICS_25~~ | TICS_36 | 0.42 | 0.06 | <0.001 | |||
References
- Selye, H. Stress without Distress. In Psychopathology of Human Adaptation; Metzler, J.B., Ed.; Springer: Boston, MA, USA, 1976; pp. 137–146. [Google Scholar] [CrossRef]
- Lazarus, R.S.; Launier, R. Stress-related Transactions Between Person and Environment. In Perspectives in Interactional Psychology; Pervin, L.A., Lewis, M., Eds.; Plenum: New York, NY, USA, 1978; pp. 287–327. [Google Scholar]
- Jones, F.; Bright, J.; Clow, A. Stress: Myth, Theory and Research; Pearson Education: Harlow, UK, 2001. [Google Scholar]
- Koolhaas, J.; Bartolomucci, A.; Buwalda, B.; de Boer, S.; Flügge, G.; Korte, S.; Meerlo, P.; Murison, R.; Olivier, B.; Palanza, P.; et al. Stress revisited: A critical evaluation of the stress concept. Neurosci. Biobehav. Rev. 2011, 35, 1291–1301. [Google Scholar] [CrossRef]
- Lagraauw, H.M.; Kuiper, J.; Bot, I. Acute and chronic psychological stress as risk factors for cardiovascular disease: Insights gained from epidemiological, clinical and experimental studies. Brain Behav. Immun. 2015, 50, 18–30. [Google Scholar] [CrossRef]
- Steptoe, A.; Kivimäki, M. Stress and Cardiovascular Disease. Nat. Rev. Cardiol. 2012, 9, 360. [Google Scholar] [CrossRef] [PubMed]
- Ferrie, J.E.; Kivimäki, M.; Shipley, M.J.; Davey Smith, G.; Virtanen, M. Job insecurity and incident coronary heart disease: The Whitehall II prospective cohort study. Atherosclerosis 2013, 227, 178–181. [Google Scholar] [CrossRef] [Green Version]
- Yusuf, S.; Hawken, S.; Ôunpuu, S.; Dans, T.; Avezum, A.; Lanas, F.; McQueen, M.; Budaj, A.; Pais, P.; Varigos, J.; et al. Effect of potentially modifiable risk factors associated with myocardial infarction in 52 countries (the INTERHEART study): Case-control study. Lancet 2004, 364, 937–952. [Google Scholar] [CrossRef]
- Compas, B.E. Stress and life events during childhood and adolescence. Clin. Psychol. Rev. 1987, 7, 275–302. [Google Scholar] [CrossRef]
- Hammen, C. Stress and Depression. Annu. Rev. Clin. Psychol. 2005, 1, 293–319. [Google Scholar] [CrossRef] [Green Version]
- Motowidlo, S.J.; Packard, J.S.; Manning, M.R. Occupational Stress: Its Causes and Consequences for Job Performance. J. Appl. Psychol. 1986, 71, 618. [Google Scholar] [CrossRef] [PubMed]
- Checkley, S. The neuroendocrinology of depression and chronic stress. Br. Med Bull. 1996, 52, 597–617. [Google Scholar] [CrossRef] [PubMed] [Green Version]
- Seldenrijk, A.; Vogelzangs, N.; Batelaan, N.M.; Wieman, I.; van Schaik, D.J.; Penninx, B.J. Depression, anxiety and 6-year risk of cardiovascular disease. J. Psychosom. Res. 2015, 78, 123–129. [Google Scholar] [CrossRef] [PubMed]
- Holt, R.I.; Phillips, D.I.; Jameson, K.A.; Cooper, C.; Dennison, E.M.; Peveler, R.C. The relationship between depression, anxiety and cardiovascular disease: Findings from the Hertfordshire Cohort Study. J. Affect. Disord. 2013, 150, 84–90. [Google Scholar] [CrossRef] [PubMed] [Green Version]
- Davey, C.G.; López-Solà, C.; Bui, M.; Hopper, J.L.; Pantelis, C.; Fontenelle, L.F.; Harrison, B.J. The effects of stress–tension on depression and anxiety symptoms: Evidence from a novel twin modelling analysis. Psychol. Med. 2016, 46, 3213–3218. [Google Scholar] [CrossRef] [Green Version]
- Kendler, K.S.; Gardner, C.O. Depressive vulnerability, stressful life events and episode onset of major depression: A longitudinal model. Psychol. Med. 2016, 46, 1865–1874. [Google Scholar] [CrossRef] [Green Version]
- Melchior, M.; Caspi, A.; Milne, B.J.; Danese, A.; Poulton, R.; Moffitt, T.E. Work stress precipitates depression and anxiety in young, working women and men. Psychol. Med. 2007, 37, 1119–1129. [Google Scholar] [CrossRef] [Green Version]
- Wang, J. Work stress as a risk factor for major depressive episode(s). Psychol. Med. 2004, 35, 865–871. [Google Scholar] [CrossRef] [PubMed]
- Kang, M.G.; Koh, S.B.; Cha, B.S.; Park, J.K.; Baik, S.K.; Chang, S.J. Job stress and cardiovascular risk factors in male workers. Prev. Med. 2005, 40, 583–588. [Google Scholar] [CrossRef]
- Pillow, D.R.; Zautra, A.J.; Sandler, I. Major life events and minor stressors: Identifying mediational links in the stress process. J. Pers. Soc. Psychol. 1996, 70, 381–394. [Google Scholar] [CrossRef] [PubMed]
- Kornerup, H.; Osler, M.; Boysen, G.; Barefoot, J.; Schnohr, P.; Prescott, E. Major life events increase the risk of stroke but not of myocardial infarction: Results from the Copenhagen City Heart Study. Eur. J. Cardiovasc. Prev. Rehab. 2010, 17, 113–118. [Google Scholar] [CrossRef]
- Wagner, B.M.; Compas, B.E.; Howell, D.C. Daily and major life events: A test of an integrative model of psychosocial stress. Am. J. Commun. Psychol. 1988, 16, 189–205. [Google Scholar] [CrossRef] [PubMed]
- Aneshensel, C.S. Social Stress: Theory and Research. Annu. Rev. Sociol. 1992, 18, 15–38. [Google Scholar] [CrossRef]
- Ohlin, B.; Nilsson, P.M.; Nilsson, J.-A.; Berglund, G. Chronic psychosocial stress predicts long-term cardiovascular morbidity and mortality in middle-aged men. Eur. Heart J. 2004, 25, 867–873. [Google Scholar] [CrossRef] [PubMed] [Green Version]
- Harkness, K.L.; Stewart, J.G.; Wynne-Edwards, K.E. Cortisol reactivity to social stress in adolescents: Role of depression severity and child maltreatment. Psychoneuroendocrinology 2011, 36, 173–181. [Google Scholar] [CrossRef] [PubMed]
- Heim, C.; Newport, D.J.; Mletzko, T.; Miller, A.H.; Nemeroff, C.B. The link between childhood trauma and depression: Insights from HPA axis studies in humans. Psychoneuroendocrinology 2008, 33, 693–710. [Google Scholar] [CrossRef]
- Vranceanu, A.-M.; Hobfoll, S.E.; Johnson, R.J. Child multi-type maltreatment and associated depression and PTSD symptoms: The role of social support and stress. Child Abus. Negl. 2007, 31, 71–84. [Google Scholar] [CrossRef] [Green Version]
- Felitti, V.J.; Anda, R.F.; Nordenberg, D.; Williamson, D.F.; Spitz, A.M.; Edwards, V.; Koss, M.P.; Marks, J.S. Relationship of Childhood Abuse and Household Dysfunction to Many of the Leading Causes of Death in Adults. Am. J. Prev. Med. 1998, 14, 245–258. [Google Scholar] [CrossRef]
- Basu, A.; McLaughlin, K.A.; Misra, S.; Koenen, K.C. Childhood Maltreatment and Health Impact: The Examples of Cardiovascular Disease and Type 2 Diabetes Mellitus in Adults. Clin. Psychol. Sci. Pract. 2017, 24, 125–139. [Google Scholar] [CrossRef] [PubMed]
- Pflanz, S.; Sonnek, C.S. Work Stress in the Military: Prevalence, Causes, and Relationship to Emotional Health. Mil. Med. 2002, 167, 6. [Google Scholar] [CrossRef] [Green Version]
- Granado, N.S.; Smith, T.C.; Swanson, G.M.; Harris, R.B.; Shahar, E.; Smith, B.; Boyko, E.J.; Wells, T.S.; Ryan, M.A. Newly Reported Hypertension After Military Combat Deployment in a Large Population-Based Study. Hypertension 2009, 54, 966–973. [Google Scholar] [CrossRef] [PubMed] [Green Version]
- Tien, H.C.; Acharya, S.; Redelmeier, D.A. Preventing Deaths in the Canadian Military. Am. J. Prev. Med. 2010, 38, 331–339. [Google Scholar] [CrossRef]
- Assmann, G.; Schulte, H. The Prospective Cardiovascular Münster (PROCAM) study: Prevalence of hyperlipidemia in persons with hypertension and/or diabetes mellitus and the relationship to coronary heart disease. Am. Heart J. 1988, 116, 1713–1724. [Google Scholar] [CrossRef]
- Wilson, P.W.F.; D’Agostino, R.B.; Levy, D.; Belanger, A.M.; Silbershatz, H.; Kannel, W.B. Prediction of Coronary Heart Disease Using Risk Factor Categories. Circulation 1998, 97, 1837–1847. [Google Scholar] [CrossRef] [PubMed] [Green Version]
- Goff, D.C.; Lloyd-Jones, D.M.; Benett, G.; O’Donnell, C.J.; Coady, S.; Robinson, J.; D’Agostino, R.B.; Schwarz, S.; Gibbons, R.; Shero, S.T.; et al. 2013 ACC/AHA Guideline on the Assessment of Cardiovascular Risk. J. Am. Coll. Cardiol. 2014, 63, 2935–2959. [Google Scholar] [CrossRef] [Green Version]
- Assmann, G.; Cullen, P.; Schulte, H. Simple Scoring Scheme for Calculating the Risk of Acute Coronary Events Based on the 10-Year Follow-Up of the Prospective Cardiovascular Münster (PROCAM) Study. Circulation 2002, 105, 310–315. [Google Scholar] [CrossRef] [PubMed] [Green Version]
- Iso, H.; Date, C.; Yamamoto, A.; Toyoshima, H.; Tanabe, N.; Kikuchi, S.; Kondo, T.; Watanabe, Y.; Wada, Y.; Ishibashi, T.; et al. Perceived Mental Stress and Mortality from Cardiovascular Disease Among Japanese Men and Women: The Japan Collaborative Cohort Study for Evaluation of Cancer Risk Sponsored by Monbusho (JACC Study). Circulation 2002, 106, 1229–1236. [Google Scholar] [CrossRef] [Green Version]
- Rosengren, A.; Tibblin, G.; Wilhelmsen, L. Self-perceived psychological stress and incidence of coronary artery disease in middle-aged men. Am. J. Cardiol. 1991, 68, 1171–1175. [Google Scholar] [CrossRef]
- Arnold, S.V.; Smolderen, K.G.; Buchanan, D.M.; Li, Y.; Spertus, J.A. Perceived Stress in Myocardial Infarction: Long-Term Mortality and Health Status Outcomes. J. Am. Coll. Cardiol. 2012, 60, 1756–1763. [Google Scholar] [CrossRef] [Green Version]
- von Dawans, B.; Kirschbaum, C.; Heinrichs, M. The Trier Social Stress Test for Groups (TSST-G): A new research tool for controlled simultaneous social stress exposure in a group format. Psychoneuroendocrinology 2011, 36, 514–522. [Google Scholar] [CrossRef]
- Schulz, P.; Schlotz, W.; Becker, P. Trierer Inventar Zum Chronischen Stress: TICS; Hogrefe: Göttingen, Germany, 2004. [Google Scholar]
- Cohen, S.; Kamarck, T.; Mermelstein, R. A global measure of perceived stress. J. Health Soc. Behav. 1983, 24, 385–396. [Google Scholar] [CrossRef]
- Ehlers, A.; Steil, R.; Winter, H.; Foa, E.B. Deutsche Übersetzung Der Posttraumatic Stress Diagnostic Scale (PDS); Unpublished Manuscript; Warneford Hospital; Department of Psychiatry, University of Oxford: Oxford, UK, 1996. [Google Scholar]
- Bader, K.; Hänny, C.; Schäfer, V.; Neuckel, A.; Kuhl, C. Childhood Trauma Questionnaire—Psychometrische Eigenschaften einer deutschsprachigen Version. Z. Klin. Psychol. Psychother. 2009, 38, 223–230. [Google Scholar] [CrossRef]
- Vogt, D.; Smith, B.N.; King, L.A.; King, D.W.; Knight, J.; Vasterling, J.J. Deployment Risk and Resilience Inventory-2 (DRRI-2): An Updated Tool for Assessing Psychosocial Risk and Resilience Factors Among Service Members and Veterans. J. Trauma. Stress 2013, 26, 710–717. [Google Scholar] [CrossRef] [PubMed]
- Herrmann, C.; Buss, U.; Snaith, R.P. HADS-D Hospital Anxiety and Depression Scale—Deutsche Version; Huber: Bern, Germany, 1995. [Google Scholar]
- R Core Team. R: A Language and Environment for Statistical Computing; R Foundation for Statistical Computing: Vienna, Austria, 2017; Available online: https://www.R-Project.Org/ (accessed on 3 September 2020).
- R Core Team. Foreign: Read Data Stored by “Minitab”, “S”, “SAS”, “SPSS”, “Stata”, “Systat”, “Weka”, “DBase”; R Package Version 0.8-71; 2018. Available online: https://cran.r-project.org/web/packages/foreign/index.html (accessed on 3 September 2020).
- Revelle, W. Psych: Procedures for Personality and Psychological Research, Northwestern University, Evanston, IL, USA, 2018. Available online: https://cran.r-project.org/web/packages/psych/index.html (accessed on 3 September 2020).
- Rosseel, Y. Lavaan: An R Package for Structural Equation Modeling. J. Stat. Softw. 2012, 48, 1–36. Available online: http://www.Jstatsoft.Org/V48/I02/ (accessed on 3 September 2020). [CrossRef] [Green Version]
- Jarek, S. Mvnormtest: Normality Test for Multivariate Variables. R Package Version 0.1-9. 2012. Available online: https://cran.r-project.org/web/packages/mvnormtest/index.html (accessed on 3 September 2020).
- Arbuckle, J.L. AMOS (Version 25.0); IBM SPSS: Chicago, IL, USA, 2014. [Google Scholar]
- Akaike, H. A new look at the statistical model identification. IEEE Trans. Autom. Control. 1974, 19, 716–723. [Google Scholar] [CrossRef]
- Schwarz, G. Estimating the Dimension of a Model. Ann. Stat. 1978, 6, 461–464. [Google Scholar] [CrossRef]
- Browne, M.W.; Cudeck, R. Alternative Ways of Assessing Model Fit. In Testing Structural Equation Models; SAGE: Newbury Park, CA, USA, 1993; pp. 136–162. ISBN 978-08-0394-507-4. [Google Scholar]
- MacCallum, R.C.; Browne, M.W.; Sugawara, H.M. Power Analysis and Determination of Sample Size for Covariance Structure Modeling. Psychol. Methods 1996, 1, 130. [Google Scholar] [CrossRef]
- Byrne, B.M. Structural Equation Modelling with AMOS: Basic Concepts, Application and Programming, 2nd ed.; Taylor & Francis Group: New York, NY, USA, 2010. [Google Scholar]
- Warttig, S.L.; Forshaw, M.J.; South, J.; White, A.K. New, normative, English-sample data for the Short Form Perceived Stress Scale (PSS-4). J. Health Psychol. 2012, 18, 1617–1628. [Google Scholar] [CrossRef] [PubMed]
- Gallo, L.C.; Roesch, S.C.; Fortmann, A.L.; Carnethon, M.R.; Penedo, F.J.; Perreira, K.; Birnbaum-Weitzman, O.; Wassertheil-Smoller, S.; Castañeda, S.F.; Talavera, G.A.; et al. Associations of Chronic Stress Burden, Perceived Stress, and Traumatic Stress with Cardiovascular Disease Prevalence and Risk Factors in the Hispanic Community Health Study/Study of Latinos Sociocultural Ancillary Study. Psychosom. Med. 2014, 76, 468–475. [Google Scholar] [CrossRef] [Green Version]
- Miller Smedema, S.; Catalano, D.; Ebener, D.J. The Relationship of Coping, Self-Worth, and Subjective Well-Being: A Structural Equation Model. Rehabil. Couns. Bull. 2010, 53, 131–142. [Google Scholar] [CrossRef]
- White, K.S.; Farrell, A.D. Anxiety and Psychosocial Stress as Predictors of Headache and Abdominal Pain in Urban Early Adolescents. J. Pediatr. Psychol. 2005, 31, 582–596. [Google Scholar] [CrossRef] [Green Version]
- Ostovar, S.; Allahyar, N.; Aminpoor, H.; Moafian, F.; Nor, M.B.M.; Griffiths, M.D. Internet Addiction and its Psychosocial Risks (Depression, Anxiety, Stress and Loneliness) among Iranian Adolescents and Young Adults: A Structural Equation Model in a Cross-Sectional Study. Int. J. Mental Health Addict. 2016, 14, 257–267. [Google Scholar] [CrossRef] [Green Version]
- Woods-Giscombé, C.L.; Lobel, M. Race and gender matter: A multidimensional approach to conceptualizing and measuring stress in African American women. Cult. Divers. Ethn. Minor. Psychol. 2008, 14, 173–182. [Google Scholar] [CrossRef] [PubMed]
- Vale, S. Psychosocial stress and cardiovascular diseases. Postgrad. Med. J. 2005, 81, 429–435. [Google Scholar] [CrossRef] [PubMed] [Green Version]
- Alexopoulos, E. Introduction to Multivariate Regression Analysis. Hippokratia 2010, 14, 23–28. [Google Scholar] [PubMed]
- Bortz, J. Statistik: Für Sozialwissenschaftler; Springer: Berlin/Heidelberg, Germany, 2013. [Google Scholar]
- Raykov, T.; Marcoulides, G.A. A First Course in Structural Equation Modeling, 2nd ed.; Lawrence Erlbaum Associates, Inc: Mahwah, NJ, USA, 2012; ISBN 978-0-203-93068-7. [Google Scholar]
- Byrne, B.M. Structural Equation Modeling: Perspectives on the Present and the Future. Int. J. Test. 2001, 1, 327–334. [Google Scholar] [CrossRef]
- Stalnikowicz, R.; Tsafrir, A. Acute psychosocial stress and cardiovascular events. Am. J. Emerg. Med. 2002, 20, 488–491. [Google Scholar] [CrossRef]
- Waller, C.; Rhee, D.-S.; Gröger, M.; Rappel, M.; Maier, T.; Müller, M.; Rottler, E.; Nerz, K.; Nerz, C.; Brill, S.; et al. Social Stress-Induced Oxidative DNA Damage is Related to Prospective Cardiovascular Risk. J. Clin. Med. 2020, 9, 3783. [Google Scholar] [CrossRef] [PubMed]
- Dimsdale, J.E. Psychological Stress and Cardiovascular Disease. J. Am. Coll. Cardiol. 2008, 51, 1237–1246. [Google Scholar] [CrossRef] [Green Version]
- Vogelzangs, N.; Seldenrijk, A.; Beekman, A.T.; van Hout, H.P.; de Jonge, P.; Penninx, B.W. Cardiovascular disease in persons with depressive and anxiety disorders. J. Affect. Disord. 2010, 125, 241–248. [Google Scholar] [CrossRef] [PubMed] [Green Version]
- Olafiranye, O.; Jean-Louis, G.; Zizi, F.; Nunes, J.; Vincent, M. Anxiety and cardiovascular risk: Review of Epidemiological and Clinical Evidence. Mind Brain 2011, 2, 32–37. [Google Scholar]
- Jönsson, P. Respiratory sinus arrhythmia as a function of state anxiety in healthy individuals. Int. J. Psychophysiol. 2007, 63, 48–54. [Google Scholar] [CrossRef]
- Thayer, J.F.; Friedman, B.H.; Borkovec, T.D. Autonomic characteristics of generalized anxiety disorder and worry. Biol. Psychiatry 1996, 39, 255–266. [Google Scholar] [CrossRef]
- Watkins, L.L.; Blumenthal, J.A.; Davidson, J.R.T.; Babyak, M.A.; McCants, C.B.; Sketch, M.H. Phobic Anxiety, Depression, and Risk of Ventricular Arrhythmias in Patients with Coronary Heart Disease. Psychosom. Med. 2006, 68, 651–656. [Google Scholar] [CrossRef]
- Cohen, B.E.; Edmondson, D.; Kronish, I.M. State of the Art Review: Depression, Stress, Anxiety, and Cardiovascular Disease. Am. J. Hypertens. 2015, 28, 1295–1302. [Google Scholar] [CrossRef] [Green Version]
- Sheps, S. Depression, Anxiety, and the Cardiovascular System: The Cardiologist’s Perspective. J Clin Psychiatry 5 2001, 62. [Google Scholar]
- Gupta, S.; Gupta, M.M. Takotsubo syndrome. Indian Heart J. 2018, 70, 165–174. [Google Scholar] [CrossRef]
- Moscatelli, S.; Montecucco, F.; Carbone, F.; Valbusa, A.; Massobrio, L.; Porto, I.; Brunelli, C.; Rosa, G.M. An Emerging Cardiovascular Disease: Takotsubo Syndrome. BioMed Res. Int. 2019, 2019, 1–9. [Google Scholar] [CrossRef] [PubMed] [Green Version]
- Oliveri, F.; Goud, H.K.; Mohammed, L.; Mehkari, Z.; Javed, M.; Althwanay, A.; Ahsan, F.; Rutkofsky, I.H. Role of Depression and Anxiety Disorders in Takotsubo Syndrome: The Psychiatric Side of Broken Heart. Cureus 2020, 12. [Google Scholar] [CrossRef] [PubMed]
- Ghadri, J.R.; Kato, K.; Cammann, V.L.; Gili, S.; Jurisic, S.; Di Vece, D.; Candreva, A.; Ding, K.J.; Micek, J.; Szawan, K.A.; et al. Long-Term Prognosis of Patients with Takotsubo Syndrome. J. Am. Coll. Cardiol. 2018, 72, 874–882. [Google Scholar] [CrossRef]
- Norris, F.H. Screening for Traumatic Stress: A Scale for Use in the General Population1. J. Appl. Soc. Psychol. 1990, 20, 1704–1715. [Google Scholar] [CrossRef]
- Rosengren, A.; Hawken, S.; Ôunpuu, S.; Sliwa, K.; Zubaid, M.; A Almahmeed, W.; Blackett, K.N.; Sitthi-Amorn, C.; Sato, H.; Yusuf, S. Association of psychosocial risk factors with risk of acute myocardial infarction in 11 119 cases and 13 648 controls from 52 countries (the INTERHEART study): Case-control study. Lancet 2004, 364, 953–962. [Google Scholar] [CrossRef]
- Deutscher Bundestag. Unterrichtung Durch Den Wehrbeauftragten: Jahresbericht 2019. Drucksache 2019, 61, 67. [Google Scholar]
- Kenny, D.A.; Kaniskan, B.; McCoach, D.B. The Performance of RMSEA in Models with Small Degrees of Freedom. Sociol. Methods Res. 2014, 44, 486–507. [Google Scholar] [CrossRef]
- Lei, M.; Lomax, R.G. The Effect of Varying Degrees of Nonnormality in Structural Equation Modeling. Struct. Equ. Model. A Multidiscip. J. 2005, 12, 1–27. [Google Scholar] [CrossRef]
- Olsson, U.H.; Foss, T.; Troye, S.V.; Howell, R.D. The Performance of ML, GLS, and WLS Estimation in Structural Equation Modeling Under Conditions of Misspecification and Nonnormality. Struct. Equ. Model. 2000, 7, 557–595. [Google Scholar] [CrossRef]
- Raykov, T.; Widaman, K.F. Issues in applied structural equation modeling research. Struct. Equ. Model. 1995, 2, 289–318. [Google Scholar] [CrossRef]
- Enders, C.K.; Bandalos, D.L. The Relative Performance of Full Information Maximum Likelihood Estimation for Missing Data in Structural Equation Models. Struct. Equ. Model. 2001, 8, 430–457. [Google Scholar] [CrossRef]

| Model | Specification | df | Χ² | RMSEA | AIC | BIC | Χ² Test * |
|---|---|---|---|---|---|---|---|
| Model 1 | G-factor | 5460 | 17,615.05 *** | 0.108 *** (0.106; 0.109) | 51,043.96 | 51,728.03 | |
| Model 2 | One factor for each questionnaire | No result | |||||
| Model2a | TICS and PSS4 factor with a factor of higher order | Model not identified | |||||
| Model 3 | TICS and PSS4 items with perceived stress factor | 5457 | 16,008.86 *** | 0.100 *** (0.099; 0.102) | 49,443.77 | 50,137.61 | |
| Model 4 | HADS divided in its subscales | 5456 | 16,012.89 *** | 0.100 *** (0.099; 0.102) | 49,449.80 | 50,146.90 | |
| Model 4a | HADSA and D with a factor of higher order | Model not identified | |||||
| Model 5 | Model 3 and CTQ subscales | 5452 | 14,203.58 *** | 0.091 *** (0.090; 0.093) | 47,648.49 | 48,358.63 | |
| Model 6 | Model 5 and CTQ factor | 5451 | 14,164.89 *** | 0.091 *** (0.089; 0.093) | 47,611.80 | 48,325.19 | |
| Model 7 | Exclude CTQ_21 | 5347 | 13,776.91 *** | 0.091 *** (0.089; 0.092) | 47,459.57 | 48,166.44 | |
| Model 8 | Intercept: GSI | 5346 | 13,294.53 *** | 0.088 *** (0.086; 0.090) | 46,979.18 | 47,689.31 | Χ²(1) = 482.39 *** |
| Model 9 | Intercept: CTQ_MQ, PSS4_02, PSS4_03 | 5343 | 12,560.59 *** | 0.084 *** (0.082; 0.086) | 46,251.24 | 46,971.15 | Χ²(3) = 733.94 *** |
| Model 10 | CTQ_EN~~CTQ_MQ | 5342 | 12,460.37 *** | 0.083 *** (0.081; 0.085) | 46,153.02 | 46,876.18 | Χ²(1) = 100.22 *** |
| Model 11 | TICS_10 ~~ TICS_21 TICS_10 ~~ TICS_41 TICS_10 ~~ TICS_53 | 5339 | 12,311.28 *** | 0.082 *** (0.081; 0.084) | 46,009.93 | 46,742.87 | Χ²(3) = 149.09 *** |
| Model 12 | TICS_07 ~~ TICS_22 TICS_07 ~~ TICS_43 TICS_07 ~~ TICS_49 | 5336 | 12,182.09 *** | 0.082 *** (0.080; 0.084) | 45,886.74 | 46,629.45 | Χ²(3) = 129.19 *** |
| Model 13 | CTQ_23 ~~ CTQ_24 | 5335 | 12,107.42 *** | 0.081 *** (0.079; 0.083) | 45,814.08 | 46,560.04 | Χ²(1) = 74.67 *** |
| Model 14 | TICS_42 ~~ TICS_51 | 5334 | 12,003.64 *** | 0.081 *** (0.079; 0.083) | 45,712.29 | 46,461.52 | Χ²(1) = 103.78 *** |
| Model 15 | TICS_22 ~~ TICS_43 | 5333 | 11,916.08 *** | 0.080 *** (0.078; 0.082) | 45,626.73 | 46,379.21 | Χ²(1) = 87.56 *** |
| Model 16 | TICS_25 ~~ TICS_36 | 5332 | 11,829.89 *** | 0.080 *** (0.078; 0.082) | 45,542.55 | 46,298.29 | Χ²(1) = 86.18 *** |
| Model 17 | CTQ_SA =~ CTQ_25 | 5331 | 11,757.61 *** | 0.079 *** (0.077; 0.081) | 45,472.26 | 46,231.26 | Χ²(1) = 158.47 *** |
Publisher’s Note: MDPI stays neutral with regard to jurisdictional claims in published maps and institutional affiliations. |
© 2021 by the authors. Licensee MDPI, Basel, Switzerland. This article is an open access article distributed under the terms and conditions of the Creative Commons Attribution (CC BY) license (https://creativecommons.org/licenses/by/4.0/).
Share and Cite
Maier, T.; Kugelmann, M.; Rhee, D.-S.; Brill, S.; Gündel, H.; Friemert, B.; Becker, H.-P.; Waller, C.; Rappel, M. Structural Equation Modeling of a Global Stress Index in Healthy Soldiers. J. Clin. Med. 2021, 10, 1799. https://doi.org/10.3390/jcm10081799
Maier T, Kugelmann M, Rhee D-S, Brill S, Gündel H, Friemert B, Becker H-P, Waller C, Rappel M. Structural Equation Modeling of a Global Stress Index in Healthy Soldiers. Journal of Clinical Medicine. 2021; 10(8):1799. https://doi.org/10.3390/jcm10081799
Chicago/Turabian StyleMaier, Tanja, Melanie Kugelmann, Dae-Sup Rhee, Sebastian Brill, Harald Gündel, Benedikt Friemert, Horst-Peter Becker, Christiane Waller, and Manuela Rappel. 2021. "Structural Equation Modeling of a Global Stress Index in Healthy Soldiers" Journal of Clinical Medicine 10, no. 8: 1799. https://doi.org/10.3390/jcm10081799