
Differences in Adiposity Profile and Body Fat Distribution between Forwards and Backs in Sub-Elite Spanish Female Rugby Union Players

 , and
, and
Abstract
:1. Introduction
2. Methods
2.1. Design
2.2. Participants
2.3. Anthropometry and Instruments
2.4. Statistical Analyses
2.5. Ethical Approval
2.6. Data Availability
3. Results
4. Discussion
5. Conclusions
Author Contributions
Funding
Institutional Review Board Statement
Informed Consent Statement
Data Availability Statement
Conflicts of Interest
References
- Duthie, G.; Pyne, D.; Hooper, S. Applied physiology and game analysis of rugby union. Sports Med. 2003, 33, 973–991. [Google Scholar] [CrossRef] [PubMed]
- Gabbett, T.J.; Seibold, A.J. Relationship between tests of physical qualities, team selection, and physical match performance in semiprofessional rugby league players. J. Strength Cond. Res. 2013, 27, 3259–3265. [Google Scholar] [CrossRef] [Green Version]
- King, D.; Hume, P.; Cummins, C.; Pearce, A.; Clark, T.; Foskett, A.; Barnes, M. Match and training injuries in women’s rugby union: A systematic review of published studies. Sports Med. 2019, 49, 1559–1574. [Google Scholar] [CrossRef] [PubMed]
- Suarez-Arrones, L.; Portillo, J.; Pareja-Blanco, F.; Sáez der Villareal, E.; Sánchez-Medina, L.; Mungía-Izquierdo, D. Match-play activity profile in elite women’s rugby union players. J. Strength Cond. Res. 2014, 28, 452–458. [Google Scholar] [CrossRef] [PubMed]
- Gabbett, T.; Kelly, J.; Pezet, T. Relationship between physical fitness and playing ability in rugby league players. J. Strength Cond. Res. 2007, 21, 1126–1133. [Google Scholar]
- Zemski, A.J.; Slater, G.J.; Broad, E.M. Body composition characteristics of elite Australian rugby union athletes according to playing position and ethnicity. J. Sports Sci. 2015, 33, 970–978. [Google Scholar] [CrossRef] [PubMed]
- Posthumus, L.; Macgregor, C.; Winwood, P.; Tout, J.; Morton, L.; Driller, M.; Gill, N. The Physical Characteristics of Elite Female Rugby Union Players. Int. J. Environ. Res. Public Health 2020, 17, 6457. [Google Scholar] [CrossRef] [PubMed]
- Smart, D.; Hopkins, W.G.; Quarrie, K.L.; Gill, N. The relationship between physical fitness and game behaviours in rugby union players. Eur. J. Sport. Sci. 2014, 14, S8–S17. [Google Scholar] [CrossRef] [PubMed]
- Duthie, G.M.; Pyne, D.B.; Hopkins, W.G.; Livingstone, S.; Hooper, S.L. Anthropometry profiles of elite rugby players: Quantifying changes in lean mass. Br. J. Sports Med. 2006, 40, 202–207. [Google Scholar] [CrossRef] [PubMed] [Green Version]
- Cheng, H.L.; O’Connor, H.; Kay, S.; Cook, R.; Parker, H.; Orr, R. Anthropometric characteristics of Australian junior representative rugby league players. J. Sci. Med. Sport 2014, 17, 546–551. [Google Scholar] [CrossRef] [PubMed]
- Lees, M.J.; Oldroyd, B.; Jones, B.; Brightmore, A.; O’Hara, J.; Barlow, M.J.; Till, K.; Hind, K. Three-Compartment Body Composition Changes in Professional Rugby Union Players Over One Competitive Season: A Team and Individualized Approach. J. Clin. Densitom. 2017, 20, 50–57. [Google Scholar] [CrossRef] [PubMed]
- Zemski, A.J.; Keating, S.E.; Broad, E.M.; Marsh, D.J.; Hind, K.; Slater, G.J. Preseason body composition adaptations in elite white and polynesian rugby union athletes. Int. J. Sport Nutr. Exerc. Metab. 2019, 29, 9–17. [Google Scholar] [CrossRef]
- Posthumus, L.; Macgregor, C.; Winwood, P.; Darry, K.; Driller, M.; Gill, N. Physical and Fitness Characteristics of Elite Professional Rugby Union Players. Sports 2020, 8, 85. [Google Scholar] [CrossRef]
- Kirby, W.J.; Reilly, T. Anthropometric and fitness profiles of elite female rugby union players. In Science and Football; Reilly, T., Ed.; E & FN Spon: London, UK, 1993; pp. 62–72. [Google Scholar]
- Jones, B.; Emmonds, S.; Hind, K.; Nicholson, G.; Rutherford, Z.; Till, K. Physical Qualities of International Female Rugby League Players by Playing Position. J. Strength Cond. Res. 2016, 30, 1333–1340. [Google Scholar] [CrossRef]
- Hene, N.M.; Bassett, S.H.; Andrews, B.S. Physical fitness profiles of elite women’s rugby union players. Afr. J. Phys. Health Edu. Recreat. Dance 2011, 17, 1–8. [Google Scholar]
- Nyberg, C.C.; Penpraze, V. Determination of Anthropometric and Physiological Performance Measures in Elite Scottish Female Rugby Union Players. Int. J. Res. Ex. Phys. 2016, 12, 10–16. [Google Scholar]
- Gabbett, T.J. Physiological and anthropometric characteristics of elite women rugby league players. J. Strength Cond. Res. 2007, 21, 875–881. [Google Scholar]
- Till, K.; Cobley, S.; O’Hara, J.; Brightmore, A.; Cooke, C.; Chapman, C. Using anthropometric and performance characteristics to predict selection in junior UK Rugby League players. J. Sci. Med. Sport 2011, 14, 264–269. [Google Scholar] [CrossRef]
- Morehen, J.C.; Routledge, H.E.; Twist, C.; Morton, J.P.; Close, G.L. Position specific differences in the anthropometric characteristics of elite European Super League rugby players. Eur. J. Sport Sci. 2015, 15, 523–529. [Google Scholar] [CrossRef] [PubMed]
- Reilly, T.; George, K.; Marfell-Jones, M.; Scott, M.; Sutton, L.; Wallace, J.A. How well do skinfold equations predict percent body fat in elite soccer players? Int. J. Sports Med. 2009, 30, 607–613. [Google Scholar] [CrossRef] [PubMed]
- Roberts, S.P.; Trewartha, G.; Higgitt, R.J.; El-Abd, J.; Stokes, K.A. The physical demands of elite English rugby union. J. Sports Sci. 2008, 26, 825–833. [Google Scholar] [CrossRef] [Green Version]
- Leão, C.; Camões, M.; Clemente, F.M.; Nikolaidis, P.T.; Lima, R.; Bezerra, P.; Rosemann, T.; Knechtle, B. Anthropometric Profile of Soccer Players as a Determinant of Position Specificity and Methodological Issues of Body Composition Estimation. Int. J. Environ. Res. Public Health 2019, 16, 2386. [Google Scholar] [CrossRef] [PubMed] [Green Version]
- Marfell-Jones, M.; Stewart, A.; Olds, T. Kinanthropometry IX; International Society for the Advancement of Kinanthropometry (ISAK): Potchefstroom, South Africa, 2006; pp. 61–75. [Google Scholar]
- Carter, J.E.L.; Yuhasz, M.S. Skinfolds and body composition of olympic athletes. In Physical Structure of Olympic Athletes; Part II, Kinanthropometry of olympic athletes; Carter, J.E.L., Ed.; Karger: Basilea, Switzerland, 1984. [Google Scholar]
- Slaughter, M.H.; Lohman, T.G.; Boileau, R.A.; Horswill, C.A.; Sillman, R.J.; Van Loan, M.D.; Bemben, D.A. Skinfold equations for estimation of body fatness in children and youth. Hum. Biol. 1988, 60, 709–723. [Google Scholar]
- Carter, J.E.L.; Heath, B. Somatotyping Development and Applications; Cambridge University Press: Cambridge, UK, 1990. [Google Scholar]
- Smalheiser, N.R. Nonparametric Test. In Data Literacy. How to Make your Experiments Robust and Reproducible; Academic Press: New York, NY, USA, 2017; pp. 157–167. [Google Scholar]
- Hene, N.M.; Bassett, S. Changes in the physical fitness of elite women’s rugby union players over a competition season. S. Afr. J. Sports Med. 2013, 25, 47–50. [Google Scholar] [CrossRef] [Green Version]
- Harty, P.S.; Zabridskie, H.A.; Stecker, R.A.; Currier, B.S.; Moon, J.M.; Richmond, S.R.; Jagim, A.R.; Kerksick, C.M. Position-Specific Body Composition Values in Female Collegiate Rugby Union Athletes. J. Strength Cond. Res. 2021, 35, 3158–3163. [Google Scholar] [CrossRef]
- Bentzur, K.; Kravitz, L.; Lockner, D.W. Evaluation of the BOD POD for Estimating Percent Body Fat in Collegiate Track and Field Female Athletes: A Comparison of Four Methods. J. Strength Cond. Res. 2008, 22, 1985–1991. [Google Scholar] [CrossRef] [Green Version]
- Smart, D.J.; Hopkins, W.G.; Gill, N.D. Differences and changes in the physical characteristics of professional and amateur rugby union players. J. Strength Cond. Res. 2013, 27, 3033–3044. [Google Scholar] [CrossRef] [PubMed]
- Sedeaud, A.; Marc, A.; Schipman, J.; Tafflet, M.; Hager, J.P.; Toussaint, J.F. How they won Rugby World Cup through height, mass and collective experience. Br. J. Sports Med. 2012, 46, 580–584. [Google Scholar] [CrossRef]
- Barr, M.J.; Newton, R.U.; Sheppard, J.M. Were height and mass related to performance at the 2007 and 2011 Rugby World Cups? Int. J. Sports Sci. Coach. 2014, 9, 671–680. [Google Scholar] [CrossRef]
- Zemski, A.J.; Broad, E.M.; Slater, G.J. Skinfold Prediction Equations Fail to Provide an Accurate Estimate of Body Composition in Elite Rugby Union Athletes of Caucasian and Polynesian Ethnicity. Int. J. Sport Nutr. Exerc. Metab. 2018, 28, 90–99. [Google Scholar] [CrossRef]
- Thomas, D.T.; Erdman, K.A.; Burke, L.M. American College of Sports Medicine Joint Position Statement. Nutrition and Athletic Performance. Med. Sci. Sports Exerc. 2016, 48, 543–568. [Google Scholar] [PubMed]
- Till, K.; Cobley, S.; O’Hara, J.; Morley, D.; Chapman, C.; Cooke, C. Retrospective analysis of anthropometric and fitness characteristics associated with long-term career progression in Rugby League. Sci. Med. Sport 2015, 18, 310–314. [Google Scholar] [CrossRef]
- Farley, J.B.; Stein, J.; Keogh, J.; Woods, C.T.; Milne, N. The Relationship Between Physical Fitness Qualities and Sport-Specific Technical Skills in Female, Team-Based Ball Players: A Systematic Review. Sports Med. Open 2020, 6, 18. [Google Scholar] [CrossRef] [PubMed] [Green Version]
- Sánchez-Díaz, S.; Yanci, J.; Castillo, D.; Scanlan, A.T.; Raya-González, J. Effects of Nutrition Education Interventions in Team Sport Players. A Systematic Review. Nutrients 2020, 12, 3664. [Google Scholar] [CrossRef] [PubMed]


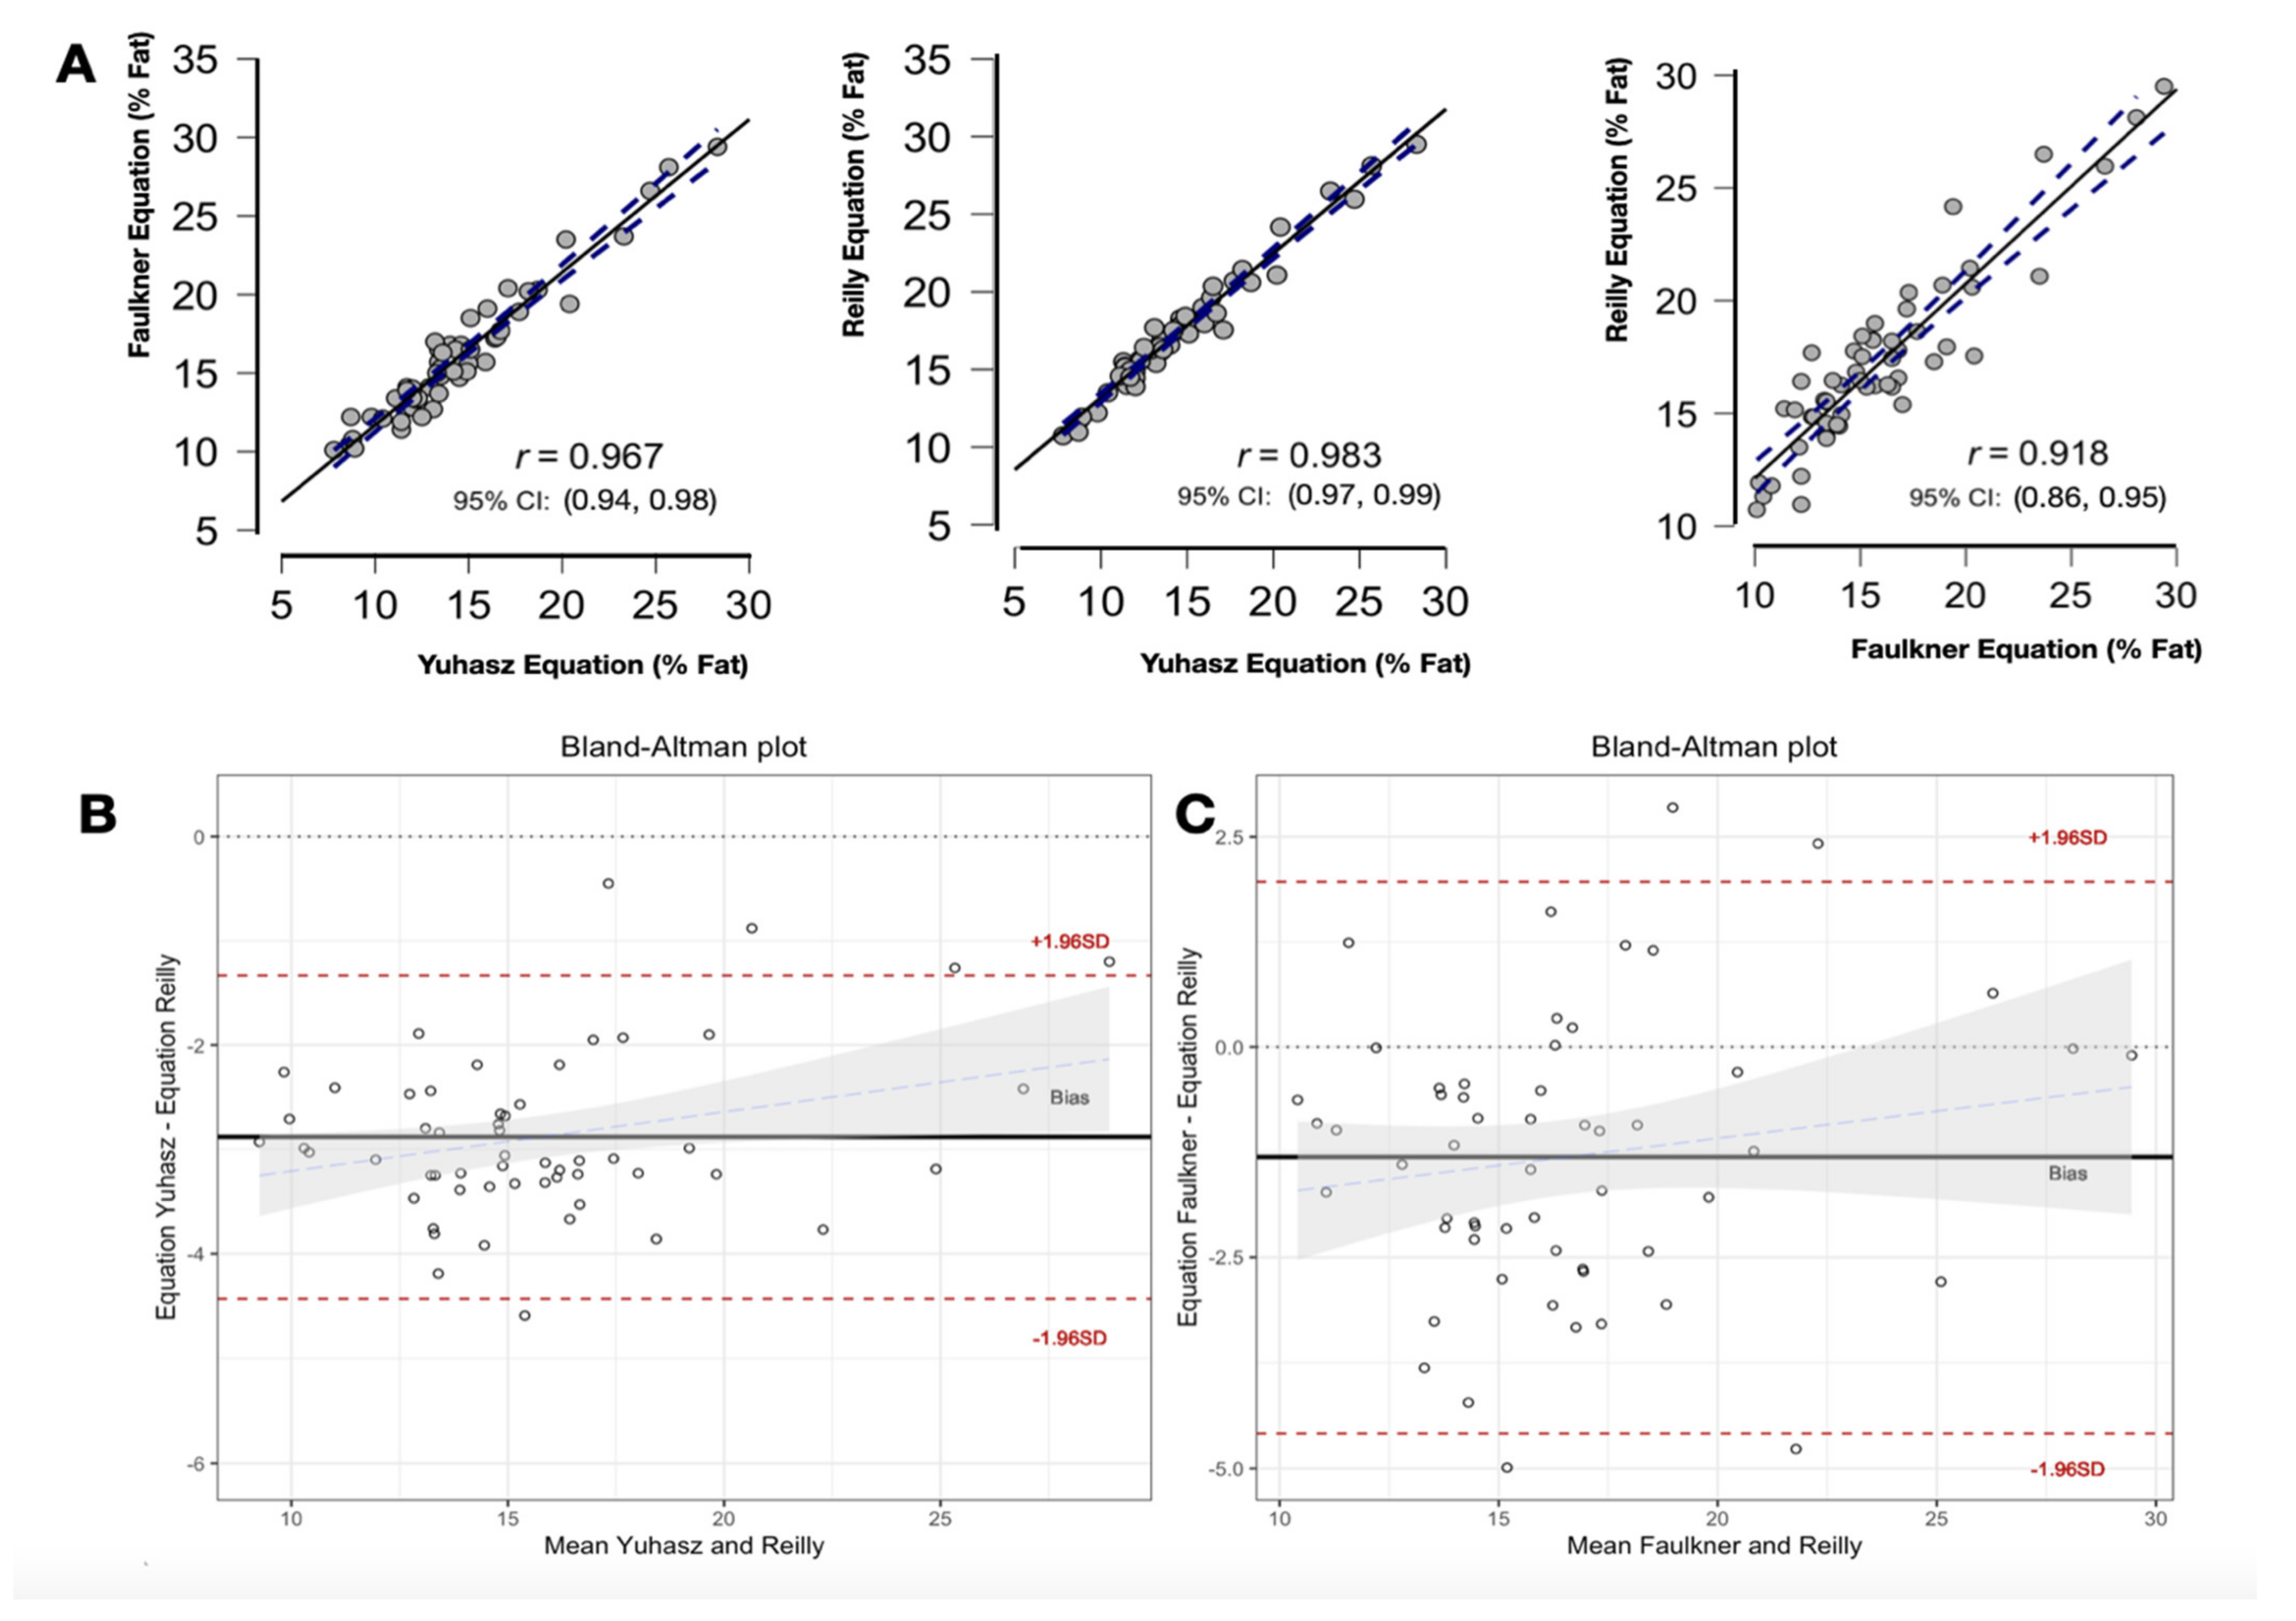
| Author | Equation | Ref. |
|---|---|---|
| Reilly | % BF = 5.174 + (0.124 × thigh) + (0.147 × abdominal) + (0.196 × triceps) + (0.130 × calf) | [21] |
| Faulkner (Slaughter’s modification) | (Triceps + subscapular < 35 mm) %BF = 1.33 (triceps + subscapular) – 0.013 (triceps + subscapular)2 – 2.5 (Triceps + subscapular > 35 mm) %BF = 0.546 (triceps + subscapular) + 9.7 | [26] |
| Yuhasz | %BF = 0.1548 (triceps + subscapular + suprailiac + abdominal + thigh + calf) + 3.580 | [27] |
| Whole Equoationsample | Forwards (n = 26) | Backs (n = 30) | p-Value § | g Hedges (CI95%) | |
|---|---|---|---|---|---|
| Age (years) | 23.7 ± 6.4 | 24.8 ± 7.2 | 22.7 ± 5.5 | 0.230 | 0.32 (−0.21 to 0.85) |
| General anthropometric data | |||||
| Stature (cm) | 163.5 ± 7.1 | 164.0 ± 9.3 | 163.0 ± 4.6 | 0.603 | 0.14 (−0.39 to 0.66) |
| Weight (kg) | 65.7 ± 10.0 | 71.5 ± 10.2 | 60.6 ± 6.5 | 0.001 ** | 1.28 (0.70 to 1.85) |
| BMI | 24.7 ± 4.4 | 26.8 ± 5.3 | 22.8 ± 4.4 | 0.001 ** | 1.03 (0.46 to 1.58) |
| Body surface (m2) | 1.91 ± 0.15 | 1.99 ± 0.15 | 1.84 ± 0.11 | 0.001 ** | 0.98 (0.42 to 1.54) |
| Skinfolds | |||||
| Triceps (mm) | 16.8 ± 6.3 | 19.5 ± 7.1 | 14.4 ± 4.3 | 0.002 ** | 0.87 (0.32 to 1.42) |
| Biceps (mm) | 8.6 ± 5.1 | 10.6 ± 6.3 | 6.8 ± 2.8 | 0.002 ** | 0.78 (0.23 to 1.33) |
| Subscapular (mm) | 14.3 ± 7.3 | 18.1 ± 8.2 | 10.9 ± 4.1 | 0.001 ** | 1.10 (0.53 to 1.66) |
| Abdominal (mm) | 20.3 ± 8.9 | 24.9 ± 9.1 | 16.2 ± 6.4 | 0.001 ** | 1.10 (0.52 to 1.65) |
| Suprailiac (mm) | 14.8 ± 7.9 | 18.3 ± 9.4 | 11.7 ± 4.4 | 0.001 ** | 0.90 (0.35 to 1.45) |
| Thigh (mm) | 27.5 ± 8.8 | 29.6 ± 9.8 | 25.7 ± 7.6 | 0.101 | 0.44 (−0.09 to 0.97) |
| Leg (mm) | 18.1 ± 7.2 | 21.9 ± 7.6 | 14.8 ± 4.9 | 0.000 ** | 1.11 (0.54 to 1.67) |
| Fat Mass | |||||
| Total Fat Mass (kg) | 10.7 ± 4.6 | 13.3 ± 5.3 | 8.5 ± 2.2 | 0.001 ** | 1.18 (0.60 to 1.74) |
| FMI | 4.1 ± 1.9 | 5.1 ± 2.3 | 3.2 ± 0.8 | 0.001 ** | 1.10 (0.53 to 1.66) |
| %BF—Yuhasz | 14.3 ± 4.2 | 16.5 ± 4.7 | 12.4 ± 2.5 | 0.001 ** | 1.08 (0.51 to 1.64) |
| %BF—Faulkner | 15.9 ± 4.2 | 18.2 ± 4.8 | 13.9 ± 2.4 | 0.001 ** | 1.13 (0.56 to 1.69) |
| %BF—Reilly | 17.2 ± 3.9 | 19.1 ±4.3 | 15.5 ± 2.6 | 0.001 ** | 1.03 (0.46 to 1.58) |
| Fat-Free Mass | |||||
| Fat-Free Mass (FFM) | 58.9 ± 7.5 | 63.3 ± 7.4 | 55.3 ± 5.2 | 0.001 ** | 1.24 (0.67 to 1.82) |
| Body composition | |||||
| Endomorphy | 4.68 ± 1.74 | 5.56 ± 1.97 | 3.92 ± 1.05 | 0.001 ** | 1.04 (0.48 to 1.60) |
| Mesomorphy | 2.74 ± 1.43 | 3.13 ± 1.79 | 2.39 ± 0.91 | 0.054 | 0.52 (−0.02 to 1.05) |
| Ectomorphy | 1.71 ± 1.08 | 1.22 ± 1.23 | 2.12 ± 0.72 | 0.001 ** | −0.89 (−1.42 to −0.33) |
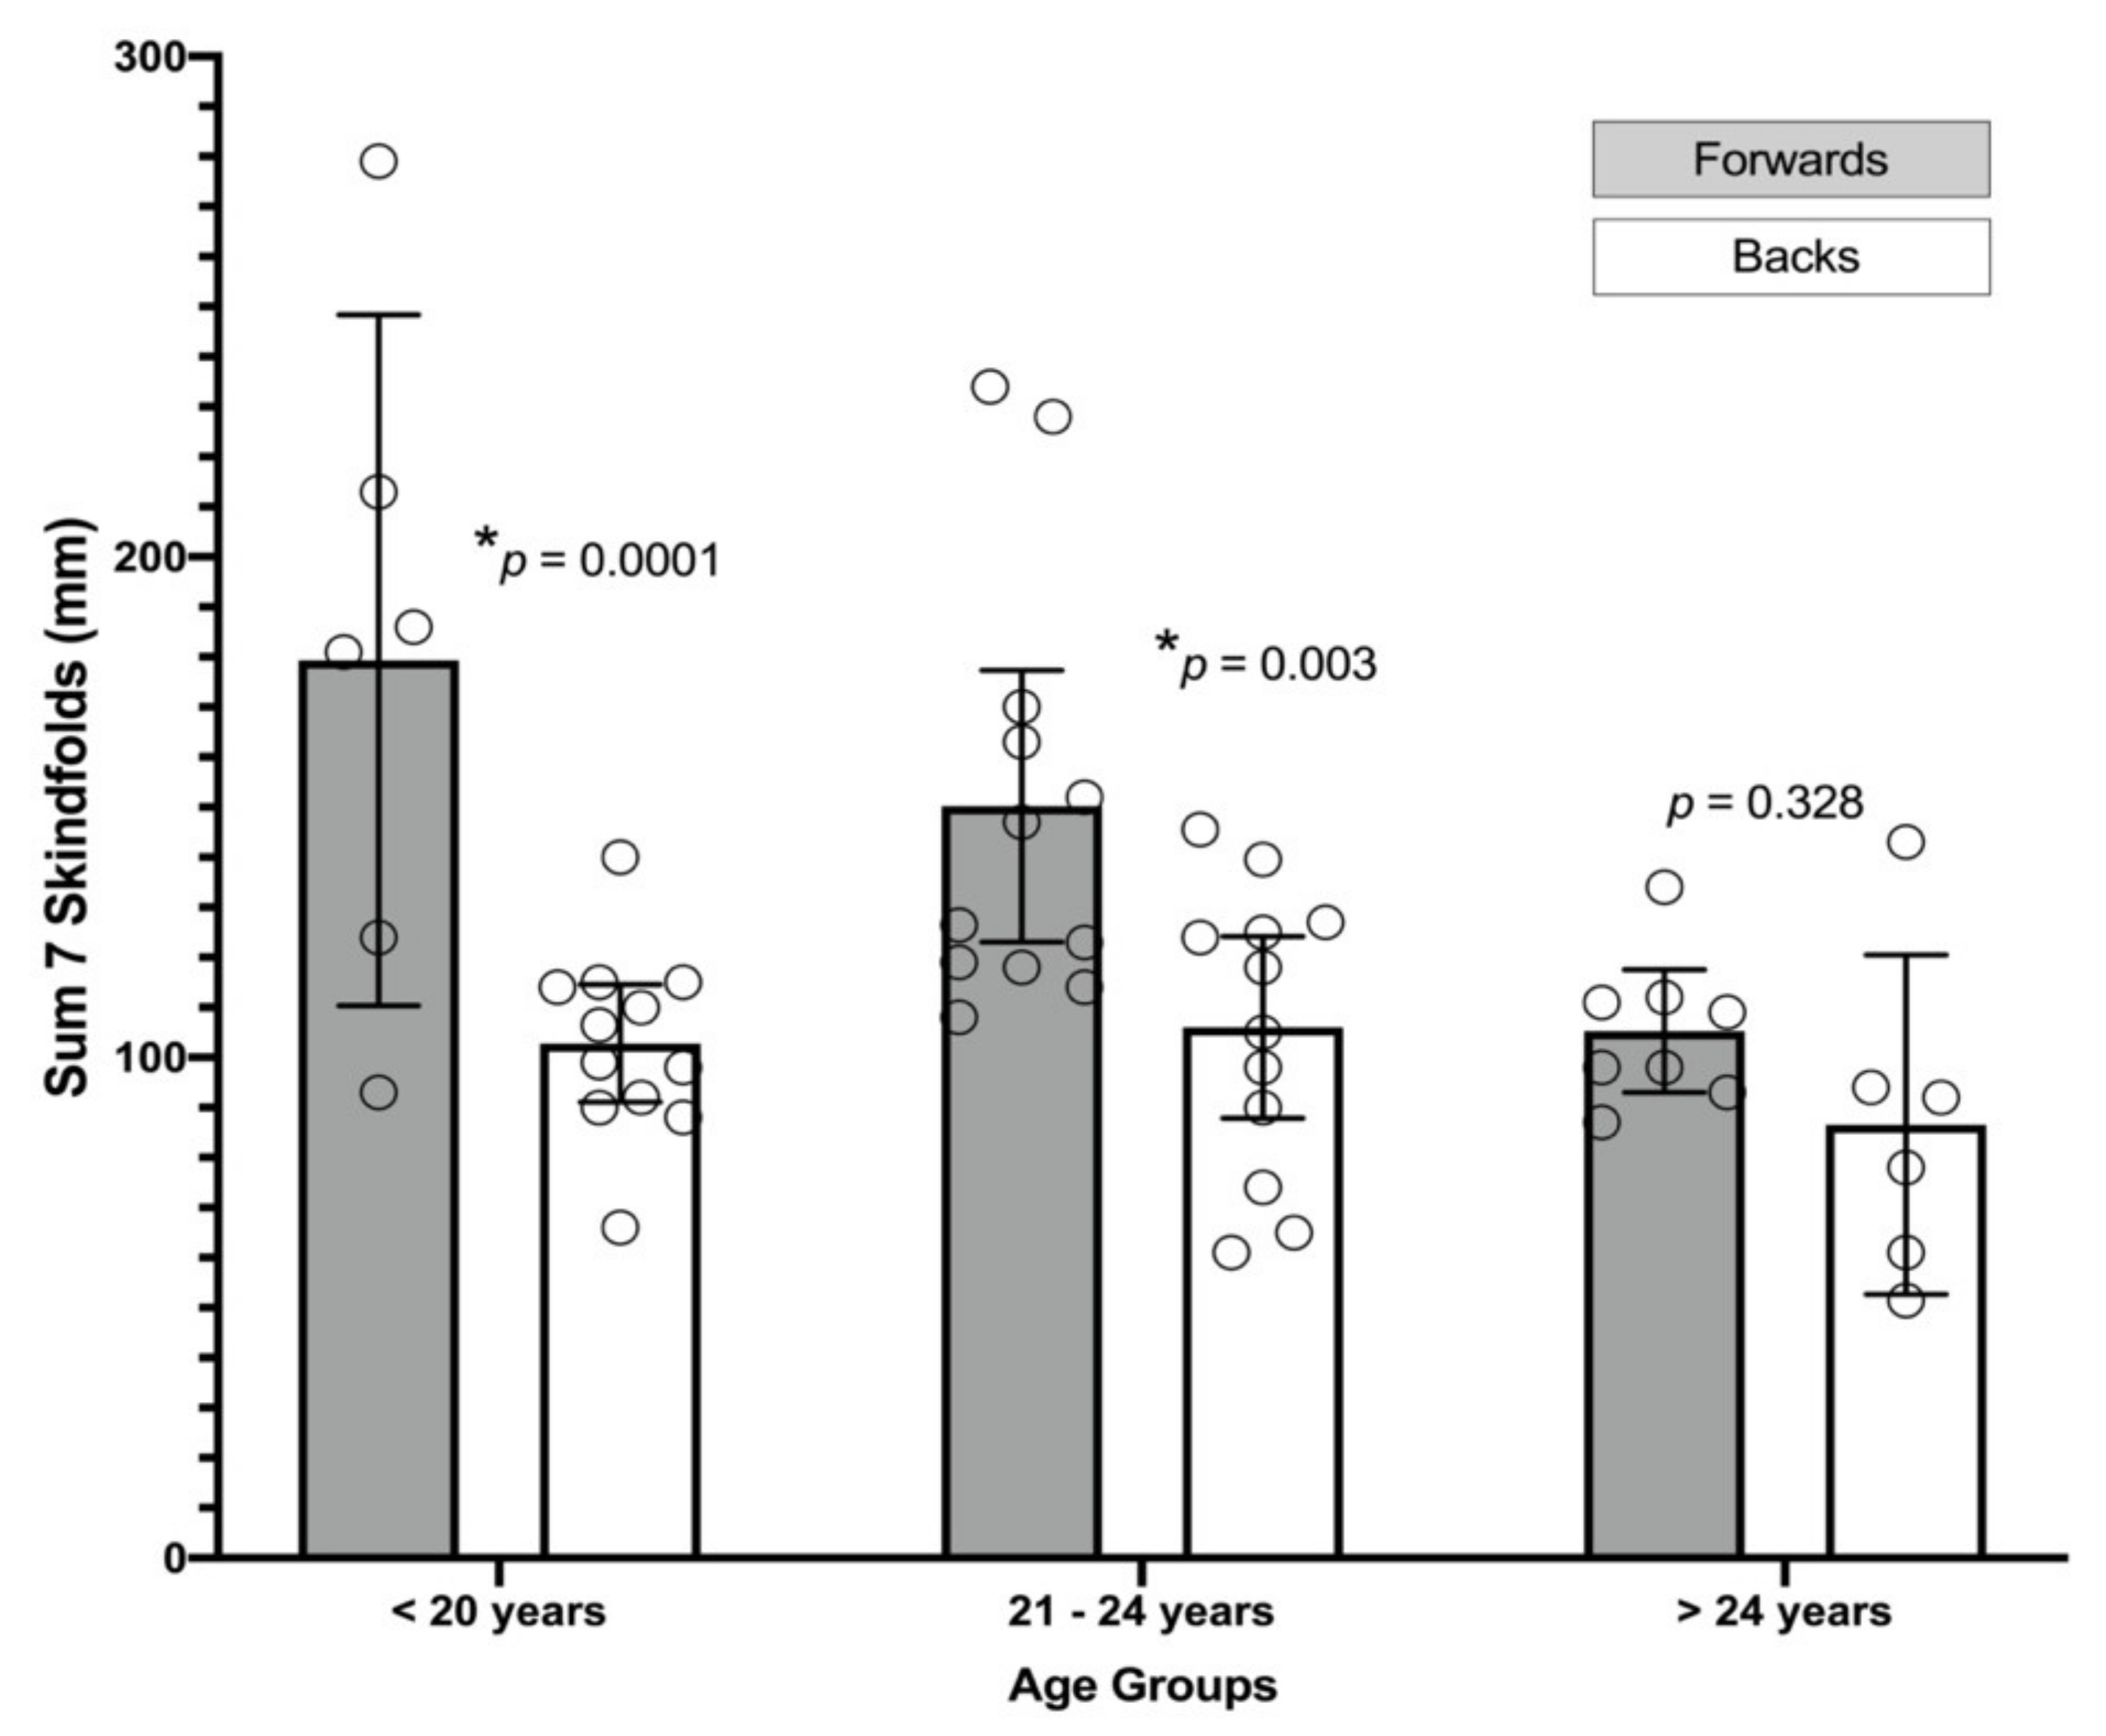
| Under 21 Years | From 21 to 25 Years | More than 25 Years | |||||||
|---|---|---|---|---|---|---|---|---|---|
| Forwards (n = 6) | Backs (n = 12) | p-Value § (g Hedges) | Forwards (n = 12) | Backs (n = 12) | p-Value § (g Hedges) | Forwards (n = 8) | Backs (n = 6) | p-Value § (g Hedges) | |
| General anthropometry | |||||||||
| Body mass (kg) | 74.2 ± 11.7 | 58.9 ± 5.8 | 0.011 * (1.78) | 73.4 ± 11.4 | 63.4 ± 7.2 | 0.035 * (1.02) | 66.8 ± 5.7 | 58.5 ± 5.2 | 0.014 * (1.40) |
| BMI | 31.4 ± 8.1 | 22.6 ± 1.9 | 0.031 * (1.75) | 26.7 ± 3.9 | 23.2 ± 2.2 | 0.026 * (1.08) | 23.7 ± 2.1 | 22.3 ± 1.8 | 0.302 (0.66) |
| Fat-Free Mass (kg) | 65.0 ± 7.8 | 53.8 ± 4.8 | 0.009 ** (1.81) | 64.3 ± 8.4 | 57.5 ± 5.7 | 0.038 * (0.53) | 60.5 ± 56.3 | 53.7 ± 4.7 | 0.033 * (1.43) |
| Adiposity parameters | |||||||||
| Abdominal Fat (mm) | 50.3 ± 22.9 | 28.7 ± 9.9 | 0.049 * (1.34) | 46.4 ± 16.6 | 27.9 ± 11.1 | 0.006 * (1.23) | 33.2 ± 11.6 | 26.5 ± 9.9 | 0.219 (0.57) |
| Lower Extremity Fat (mm) | 65.7 ± 20.5 | 41.5 ± 9.9 | 0.015 * (1.63) | 52.0 ± 13.6 | 43.1 ± 11.2 | 0.183 (0.68) | 40.3 ± 7.8 | 33.3 ± 14.2 | 0.272 (0.60) |
| Total Fat mass (kg) | 15.9 ± 6.9 | 8.3 ± 1.8 | 0.031 * (1.76) | 14.4 ± 5.4 | 9.2 ± 2.6 | 0.005 ** (1.18) | 9.8 ± 1.4 | 7.8 ± 2.0 | 0.039 * (1.09) |
| FMI | 6.7 ± 3.0 | 3.2 ± 0.7 | 0.025 * (1.93) | 5.2 ± 1.9 | 3.4 ± 0.9 | 0.004 ** (1.18) | 3.5 ± 0.6 | 3.0 ± 0.8 | 0.156 (0.65) |
| %BF—Yuhasz | 19.7 ± 6.0 | 12.5 ± 1.8 | 0.011 * (1.87) | 17.2 ± 4.1 | 13.0 ± 2.8 | 0.018 * (1.16) | 12.9 ± 1.5 | 11.2 ± 3.1 | 0.121 (0.69) |
| %BF—Slaugther | 20.7 ± 6.1 | 13.9 ± 2.0 | 0.035 * (1.72) | 17.2 ± 4.1 | 14.3 ± 2.7 | 0.005 ** (1.30) | 12.9 ± 1.5 | 13.2 ± 2.5 | 0.121 (0.60) |
| %BF—Reilly | 22.4 ± 5.4 | 15.7 ± 19 | 0.015 * (1.86) | 19.7 ± 3.9 | 16.2 ± 2.9 | 0.033 * (1.00) | 15.9 ± 1.2 | 13.7 ± 2.9 | 0.053 (1.01) |
Publisher’s Note: MDPI stays neutral with regard to jurisdictional claims in published maps and institutional affiliations. |
© 2021 by the authors. Licensee MDPI, Basel, Switzerland. This article is an open access article distributed under the terms and conditions of the Creative Commons Attribution (CC BY) license (https://creativecommons.org/licenses/by/4.0/).
Share and Cite
Escrivá, D.; Caplliure-Llopis, J.; Benet, I.; Mariscal, G.; Mampel, J.V.; Barrios, C. Differences in Adiposity Profile and Body Fat Distribution between Forwards and Backs in Sub-Elite Spanish Female Rugby Union Players. J. Clin. Med. 2021, 10, 5713. https://doi.org/10.3390/jcm10235713
Escrivá D, Caplliure-Llopis J, Benet I, Mariscal G, Mampel JV, Barrios C. Differences in Adiposity Profile and Body Fat Distribution between Forwards and Backs in Sub-Elite Spanish Female Rugby Union Players. Journal of Clinical Medicine. 2021; 10(23):5713. https://doi.org/10.3390/jcm10235713
Chicago/Turabian StyleEscrivá, Dolores, Jordi Caplliure-Llopis, Inmaculada Benet, Gonzalo Mariscal, Juan Vicente Mampel, and Carlos Barrios. 2021. "Differences in Adiposity Profile and Body Fat Distribution between Forwards and Backs in Sub-Elite Spanish Female Rugby Union Players" Journal of Clinical Medicine 10, no. 23: 5713. https://doi.org/10.3390/jcm10235713