
Simplified Decision-Tree Algorithm to Predict Falls for Community-Dwelling Older Adults

 , , ,
, , ,
Abstract
:1. Introduction
2. Materials and Methods
2.1. Design
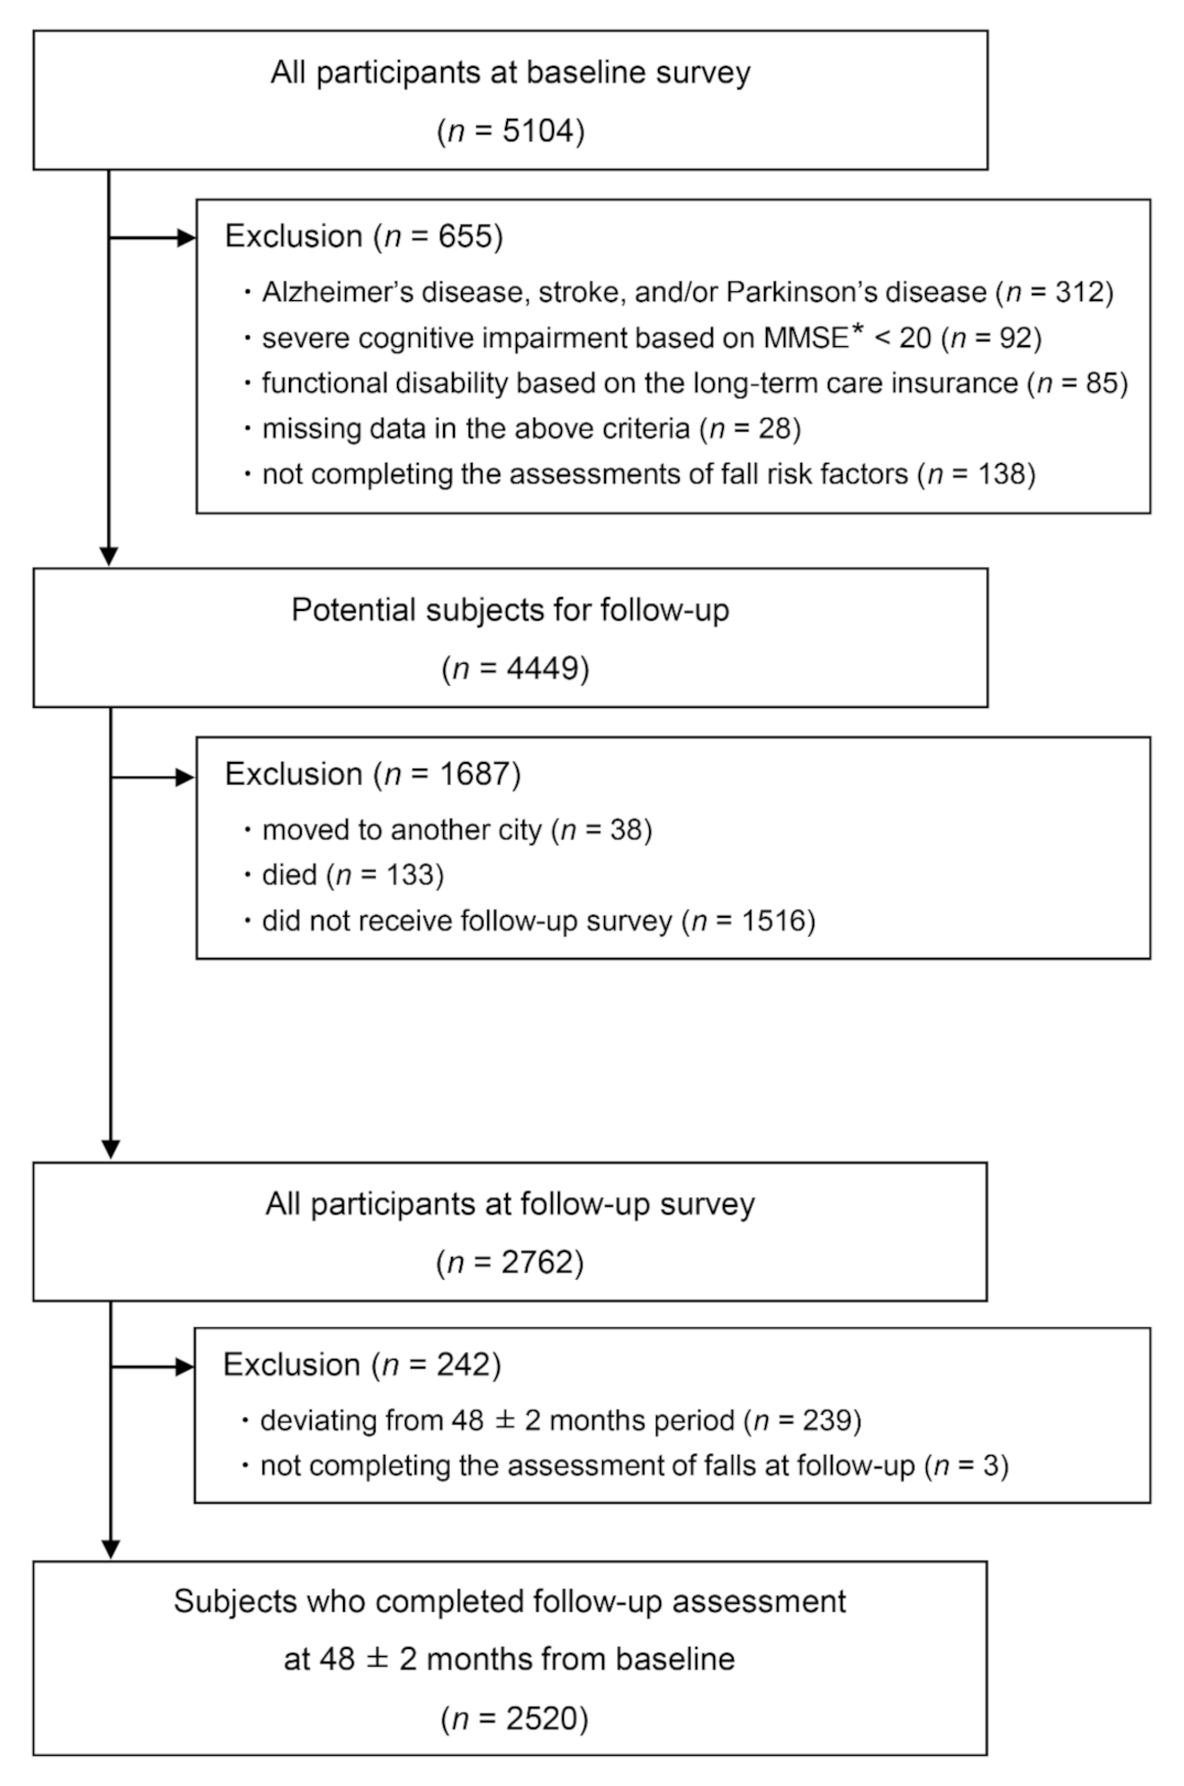
2.2. Participants
2.3. Assessment of Falls
2.4. Assessment of Fall Predictors
2.5. Statistical Analysis
3. Results
3.1. Flow of Participants and Their Characteristics
3.2. Prospective Association between Potential Predictors and Future Falls
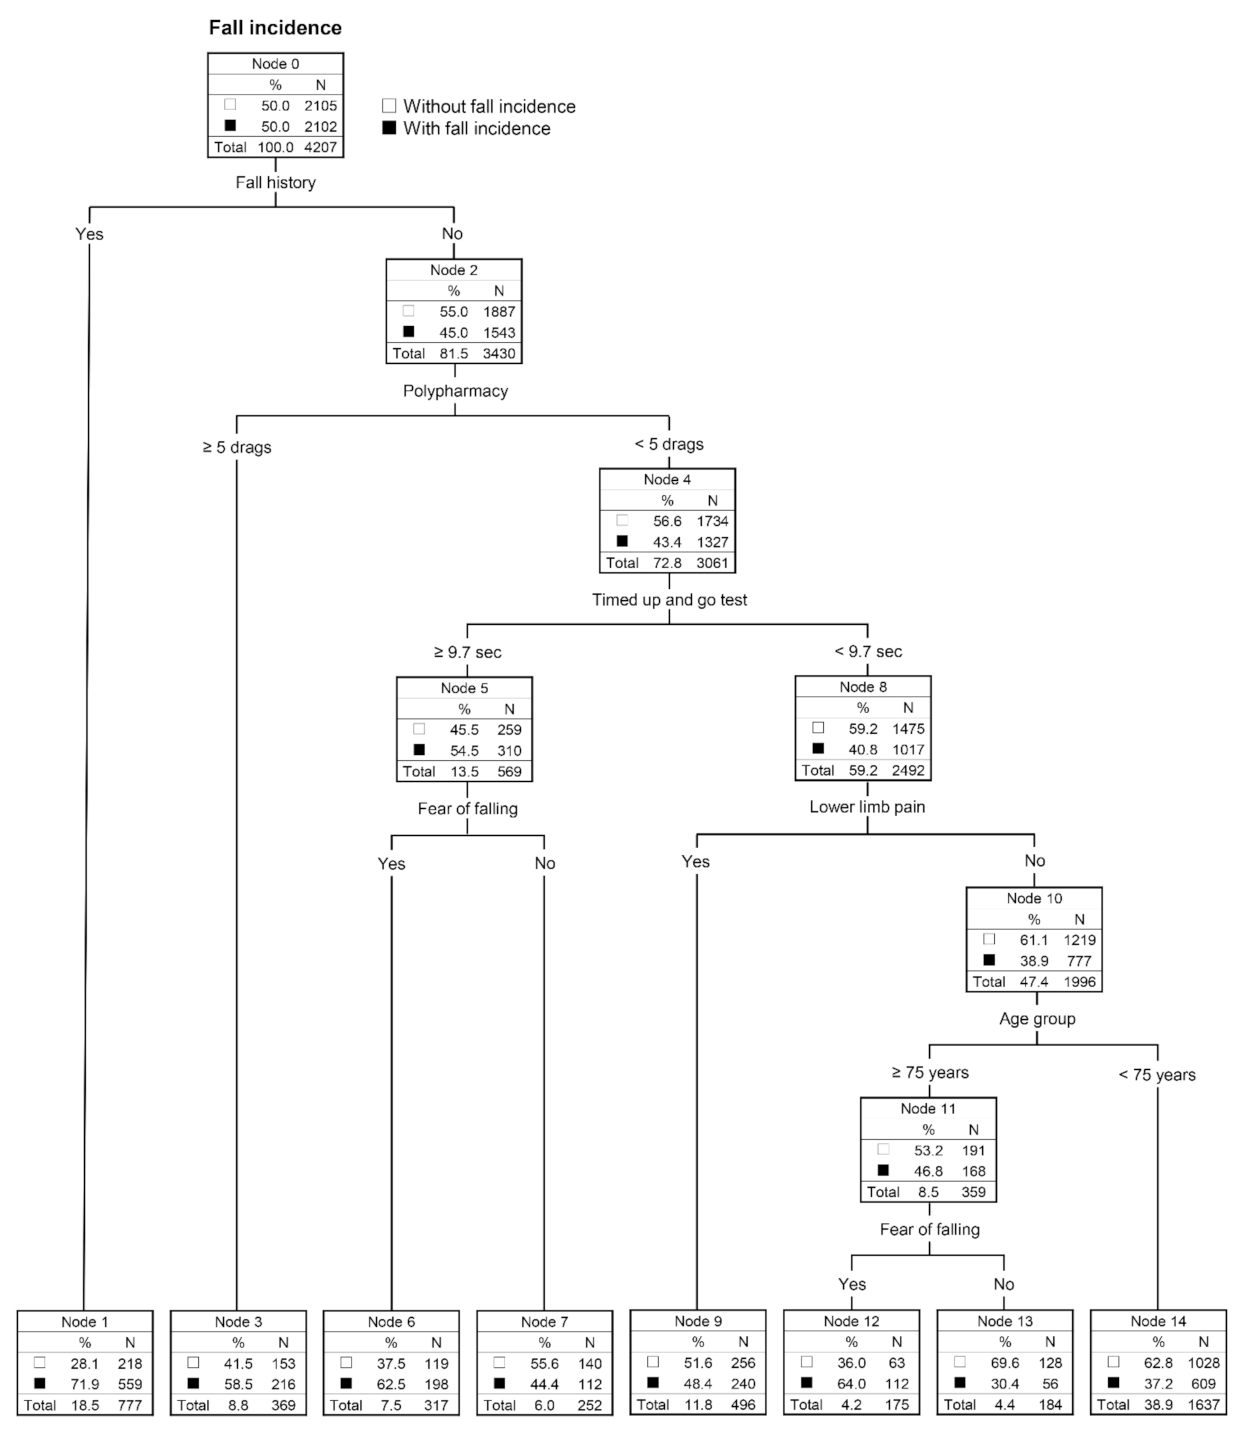
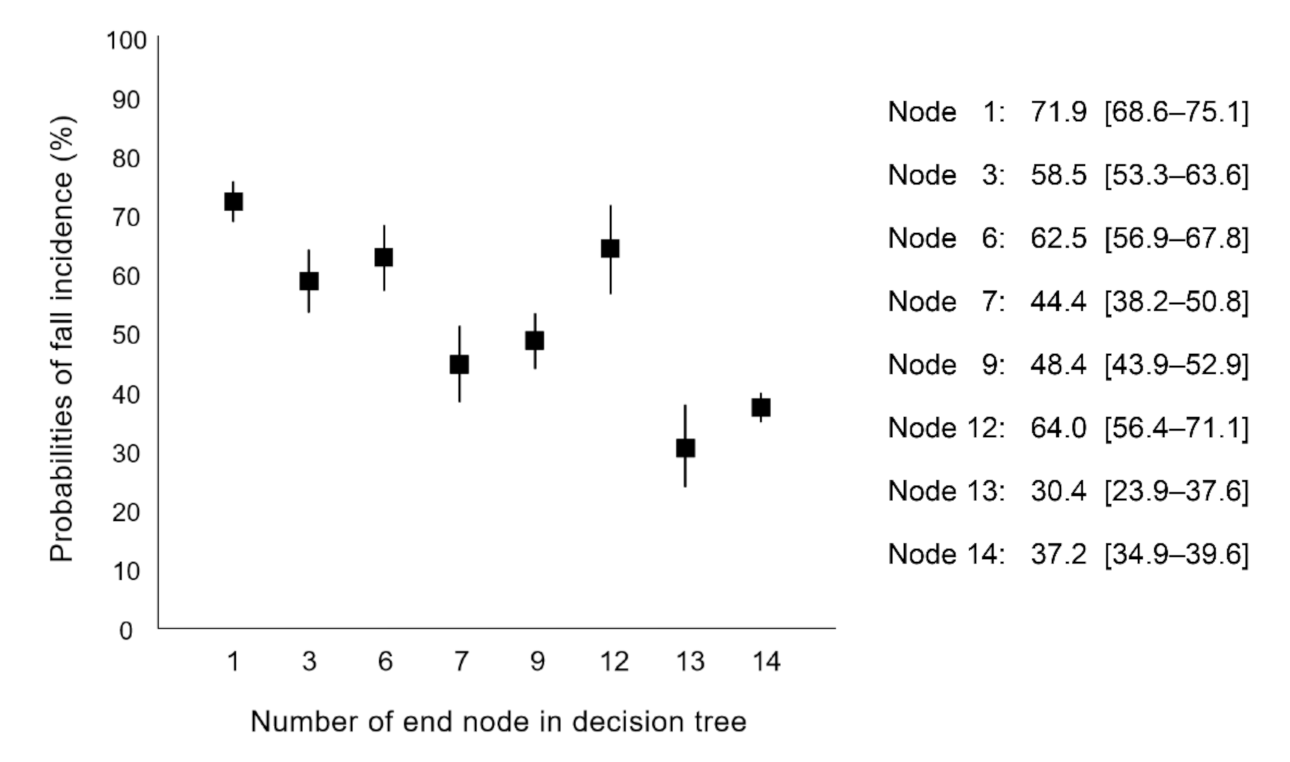
3.3. Fall-Prediction Models Using Decision-Tree and Logistic Regression
3.4. Comparison of Model Performance
4. Discussion
5. Conclusions
Author Contributions
Funding
Institutional Review Board Statement
Informed Consent Statement
Data Availability Statement
Acknowledgments
Conflicts of Interest
References
- World Health Organization. WHO Global Report on Falls Prevention in Older Age. Available online: https://www.who.int/publications/i/item/9789241563536 (accessed on 26 September 2021).
- Gill, T.M.; Murphy, T.E.; Gahbauer, E.A.; Allore, H.G. Association of injurious falls with disability outcomes and nursing home admissions in community-living older persons. Am. J. Epidemiol. 2013, 178, 418–425. [Google Scholar] [CrossRef] [Green Version]
- Spaniolas, K.; Cheng, J.D.; Gestring, M.L.; Sangosanya, A.; Stassen, N.A.; Bankey, P.E. Ground level falls are associated with significant mortality in elderly patients. J. Trauma. 2010, 69, 821–825. [Google Scholar] [CrossRef] [PubMed]
- Tinetti, M.E.; Kumar, C. The patient who falls: “It’s always a trade-off”. JAMA. 2010, 303, 258–266. [Google Scholar] [CrossRef]
- Ganz, D.A.; Latham, N.K. Prevention of falls in community-dwelling older adults. N. Engl. J. Med. 2020, 382, 734–743. [Google Scholar] [CrossRef] [PubMed]
- Saum, K.U.; Schöttker, B.; Meid, A.D.; Holleczek, B.; Haefeli, W.E.; Hauer, K.; Brenner, H. Is polypharmacy associated with frailty in older people? Results from the ESTHER Cohort Study. J. Am. Geriatr. Soc. 2017, 65, e27–e32. [Google Scholar] [CrossRef] [PubMed] [Green Version]
- Friedman, S.M.; Munoz, B.; West, S.K.; Rubin, G.S.; Fried, L.P. Falls and fear of falling: Which comes first? A longitudinal prediction model suggests strategies for primary and secondary prevention. J. Am. Geriatr. Soc. 2002, 50, 1329–1335. [Google Scholar] [CrossRef]
- National Institute for Health and Care Excellence. Falls in Older People: Assessing Risk and Prevention. Available online: https://www.nice.org.uk/guidance/cg161 (accessed on 26 September 2021).
- Panel on Prevention of Falls in Older Persons, American Geriatrics Society and British Geriatrics Society. Summary of the Updated American Geriatrics Society/British Geriatrics Society clinical practice guideline for prevention of falls in older persons. J. Am. Geriatr. Soc. 2011, 59, 148–157. [Google Scholar] [CrossRef] [Green Version]
- Zhang, L.; Wang, Y.; Niu, M.; Wang, C.; Wang, Z. Machine learning for characterizing risk of type 2 diabetes mellitus in a rural Chinese population: The Henan Rural Cohort Study. Sci. Rep. 2020, 10, 4406. [Google Scholar] [CrossRef]
- Kattan, M.W. Classification and regression trees versus nomograms: A bone scan positivity example. Eur. Urol. 2010, 57, 559–560. [Google Scholar] [CrossRef] [PubMed]
- Krzywinski, M.; Altman, N. Classification and regression trees. Nat. Method 2017, 14, 757–758. [Google Scholar] [CrossRef]
- Stel, V.S.; Pluijm, S.M.; Deeg, D.J.; Smit, J.H.; Bouter, L.M.; Lips, P. A classification tree for predicting recurrent falling in community-dwelling older persons. J. Am. Geriatr. Soc. 2003, 51, 1356–1364. [Google Scholar] [CrossRef]
- Gomez, F.; Wu, Y.Y.; Auais, M.; Vafaei, A.; Zunzunegui, M.V. A simple algorithm to predict falls in primary care patients aged 65 to 74 years: The international mobility in aging study. J. Am. Med. Dir. Assoc. 2017, 18, 774–779. [Google Scholar] [CrossRef] [PubMed]
- Lam, F.M.H.; Leung, J.C.S.; Kwok, T.C.Y. The clinical potential of frailty indicators on identifying recurrent fallers in the community: The Mr. Os and Ms. OS cohort study in Hong Kong. J. Am. Med. Dir. Assoc. 2019, 20, 1605–1610. [Google Scholar] [CrossRef] [PubMed]
- Speiser, J.L.; Cllahan, K.E.; Houston, D.K.; Fanning, J.; M Gill, T.; Guralnik, J.M.; Newman, A.B.; Pahor, M.; Rejeski, W.J.; Miller, M.E. Machine learning in aging: An example of developing prediction models for serious fall injury in older adults. J. Gerontol. A Biol. Sci. Med. Sci. 2021, 76, 647–654. [Google Scholar] [CrossRef] [PubMed]
- Ye, C.; Li, J.; Hao, S.; Liu, M.; Jin, H.; Zheng, L.; Xia, M.; Jin, B.; Zhu, C.; Alfreds, S.T.; et al. Identification of elders at higher risk for fall with statewide electronic health records and a machine learning algorithm. Int. J. Med. Inform. 2020, 137, 104105. [Google Scholar] [CrossRef]
- Folstein, M.F.; Robins, L.N.; Helzer, J.E. The Mini-Mental State Examination. Arch. Gen. Psychiatry. 1983, 40, 812. [Google Scholar] [CrossRef]
- Lamb, S.E.; Jørstad-Stein, E.C.; Hauer, K.; Becker, C.; Prevention of Falls Network Europe and Outcomes Consensus Group. Development of a common outcome data set for fall injury prevention trials: The Prevention of Falls Network Europe consensus. J. Am. Geriatr. Soc. 2005, 53, 1618–1622. [Google Scholar] [CrossRef] [PubMed]
- Makizako, H.; Shimada, H.; Doi, T.; Yoshida, D.; Tsutsumimoto, K.; Uemura, K.; Anan, Y.; Park, H.; Lee, S.; Ito, T.; et al. The combined status of physical performance and depressive symptoms is strongly associated with a history of falling in community-dwelling elderly: Cross-sectional findings from the Obu Study of Health Promotion for the Elderly (OSHPE). Arch. Gerontol. Geriatr. 2014, 58, 327–331. [Google Scholar] [CrossRef]
- Bootsma-van der Wiel, A.; Gussekloo, J.; de Craen, A.J.; Van Exel, E.; Bloem, B.R.; Westendorp, R.G.J. Walking and talking as predictors of falls in the general population: The Leiden 85-Plus Study. J. Am. Geriatr. Soc. 2003, 51, 1466–1471. [Google Scholar] [CrossRef]
- Makino, K.; Lee, S.; Bae, S.; Chiba, I.; Harada, K.; Katayama, O.; Shinkai, Y.; Makizako, H.; Shimada, H. Prospective associations of physical frailty with future falls and fear of falling: A 48-month cohort study. Phys. Ther. 2021, 101, pzab059. [Google Scholar] [CrossRef]
- Rochat, S.; Büla, C.J.; Martin, E.; Seematter-Bagnoud, L.; Karmaniola, A.; Aminian, K.; Piot-Ziegler, C.; Santos-Eggimann, B. What is the relationship between fear of falling and gait in well-functioning older persons aged 65 to 70 years? Arch. Phys. Med. Rehabil. 2010, 91, 879–884. [Google Scholar] [CrossRef]
- Uemura, K.; Shimada, H.; Makizako, H.; Doi, T.; Tsutsumimoto, K.; Lee, S.; Umegaki, H.; Kuzuya, M.; Suzuki, T. Effects of mild cognitive impairment on the development of fear of falling in older adults: A prospective cohort study. J. Am. Med. Dir. Assoc. 2015, 16, 1104.E9–1104.E13. [Google Scholar] [CrossRef]
- Shimada, H.; Makizako, H.; Doi, T.; Tsutsumimoto, K.; Suzuki, T. Incidence of disability in frail older persons with or without slow walking speed. J. Am. Med. Dir. Assoc. 2015, 16, 690–696. [Google Scholar] [CrossRef]
- Shimada, H.; Tsutsumimoto, K.; Doi, T.; Lee, S.; Bae, S.; Nakakubo, S.; Makino, K.; Arai, H. Effect of sarcopenia status on disability incidence among Japanese older adults. J. Am. Med. Dir. Assoc. 2020, 22, 846–852. [Google Scholar] [CrossRef] [PubMed]
- Podsiadlo, D.; Richardson, S. The timed “Up and Go”: A test of basic functional mobility for frail elderly persons. J. Am. Geriatr. Soc. 1991, 39, 142–148. [Google Scholar] [CrossRef]
- Shumway-Cook, A.; Brauer, S.; Woollacott. M. Predicting the probability for falls in community-dwelling older adults using the Timed Up and Go Test. Phys. Ther. 2000, 80, 896–903. [Google Scholar] [CrossRef] [Green Version]
- Estabrooks, A.; Jo, T.; Japkowicz, N. A multiple resampling method for learning from imbalanced data sets. Comp. Intell. 2004, 20, 18–36. [Google Scholar] [CrossRef] [Green Version]
- Peng, J.; Chen, C.; Zhou, M.; Xie, X.; Zhou, Y.; Luo, C.H. A machine-learning approach to forecast aggravation risk in patients with acute exacerbation of chronic obstructive pulmonary disease with clinical indicators. Sci. Rep. 2020, 10, 3118. [Google Scholar] [CrossRef] [PubMed] [Green Version]
- Goodman, L.A. Simple Models for the Analysis of Association in Cross-Classifications having Ordered Categories. J. Am. Stat. Assoc. 1979, 74, 537–552. [Google Scholar] [CrossRef]
- Schoene, D.; Wu, S.M.; Mikolaizak, A.S.; Menant, J.C.; Smith, S.T.; Delbaere, K.; Lord, S.R. Discriminative ability and predictive validity of the timed up and go test in identifying older people who fall: Systematic review and meta-analysis. J. Am. Geriatr. Soc. 2013, 61, 202–208. [Google Scholar] [CrossRef] [PubMed]


| Characteristics | Overall n = 2520 | Non-Fallers n = 2105 | Fallers n = 415 | p-Value * | |
|---|---|---|---|---|---|
| Age | (years) | 71.1 ± 4.7 | 70.9 ± 4.6 | 71.8 ± 5.1 | 0.001 |
| Female | (n, %) | 1303 (51.7) | 1072 (50.9) | 231 (55.7) | 0.078 |
| Fall history | (n, %) | 329 (13.1) | 218 (10.4) | 111 (26.7) | <0.001 |
| Fear of falling | (n, %) | 1051 (41.7) | 838 (39.8) | 213 (51.3) | <0.001 |
| Prescribed medications | (drugs) | 1.8 ± 1.9 | 1.8 ± 1.9 | 2.1 ± 2.2 | 0.002 |
| Knee osteoarthritis | (n, %) | 346 (13.7) | 271 (12.9) | 75 (18.1) | 0.005 |
| Lower limb pain | (n, %) | 531 (21.1) | 425 (20.2) | 106 (25.5) | 0.015 |
| Gait speed | (m/s) | 1.31 ± 0.20 | 1.32 ± 0.19 | 1.28 ± 0.21 | <0.001 |
| Timed up and go test | (s) | 8.3 ± 1.5 | 8.3 ± 1.5 | 8.5 ± 1.7 | 0.007 |
| All Potential Predictors | Crude Model * | ||
|---|---|---|---|
| OR | 95% CI | ||
| Age group | |||
| <75 years | reference | ||
| ≥75 years | 1.59 | 1.26−2.01 | |
| Sex | |||
| Male | reference | ||
| Female | 1.21 | 0.98−1.50 | |
| Fall history | |||
| No | reference | ||
| Yes | 3.16 | 2.44−4.09 | |
| Fear of falling | |||
| No | reference | ||
| Yes | 1.59 | 1.29−1.97 | |
| Polypharmacy (≥ 5 drugs) | |||
| No | reference | ||
| Yes | 1.88 | 1.37−2.57 | |
| Knee osteoarthritis | |||
| No | reference | ||
| Yes | 1.49 | 1.13−1.98 | |
| Lower limb pain | |||
| No | reference | ||
| Yes | 1.36 | 1.06−1.73 | |
| Gait speed | (m/s) | 0.31 | 0.18−0.53 |
| Timed up and go test | (s) | 1.10 | 1.03−1.18 |
| Selected Predictors | Multivariable Model * | ||
|---|---|---|---|
| OR | 95% CI | ||
| Age group | |||
| <75 years | reference | ||
| ≥75 years | 1.28 | 1.10−1.50 | |
| Fall history | |||
| No | reference | ||
| Yes | 2.92 | 2.46−3.47 | |
| Fear of falling | |||
| No | reference | ||
| Yes | 1.37 | 1.21−1.56 | |
| Polypharmacy (≥5 drugs) | |||
| No | reference | ||
| Yes | 1.64 | 1.34−2.01 | |
| Knee osteoarthritis | |||
| No | reference | ||
| Yes | 1.26 | 1.05−1.50 | |
| Gait speed | (m/s) | 0.55 | 0.39−0.76 |
| Models | AUC | Accuracy | Sensitivity | Specificity | PPV | NPV |
|---|---|---|---|---|---|---|
| Logistic regression (Stepwise) | 0.64 (0.63−0.66) | 0.62 (0.60−0.63) | 0.50 (0.48−0.52) | 0.73 (0.71−0.75) | 0.65 (0.63−0.68) | 0.59 (0.58−0.61) |
| Decision tree (C5.0) | 0.70 (0.68−0.72) | 0.65 (0.64−0.67) | 0.62 (0.60−0.64) | 0.69 (0.67−0.71) | 0.66 (0.64−0.69) | 0.64 (0.62−0.66) |
Publisher’s Note: MDPI stays neutral with regard to jurisdictional claims in published maps and institutional affiliations. |
© 2021 by the authors. Licensee MDPI, Basel, Switzerland. This article is an open access article distributed under the terms and conditions of the Creative Commons Attribution (CC BY) license (https://creativecommons.org/licenses/by/4.0/).
Share and Cite
Makino, K.; Lee, S.; Bae, S.; Chiba, I.; Harada, K.; Katayama, O.; Tomida, K.; Morikawa, M.; Shimada, H. Simplified Decision-Tree Algorithm to Predict Falls for Community-Dwelling Older Adults. J. Clin. Med. 2021, 10, 5184. https://doi.org/10.3390/jcm10215184
Makino K, Lee S, Bae S, Chiba I, Harada K, Katayama O, Tomida K, Morikawa M, Shimada H. Simplified Decision-Tree Algorithm to Predict Falls for Community-Dwelling Older Adults. Journal of Clinical Medicine. 2021; 10(21):5184. https://doi.org/10.3390/jcm10215184
Chicago/Turabian StyleMakino, Keitaro, Sangyoon Lee, Seongryu Bae, Ippei Chiba, Kenji Harada, Osamu Katayama, Kouki Tomida, Masanori Morikawa, and Hiroyuki Shimada. 2021. "Simplified Decision-Tree Algorithm to Predict Falls for Community-Dwelling Older Adults" Journal of Clinical Medicine 10, no. 21: 5184. https://doi.org/10.3390/jcm10215184