
One Year after Mild COVID-19: The Majority of Patients Maintain Specific Immunity, But One in Four Still Suffer from Long-Term Symptoms

 , ,
, ,
Abstract
:1. Introduction
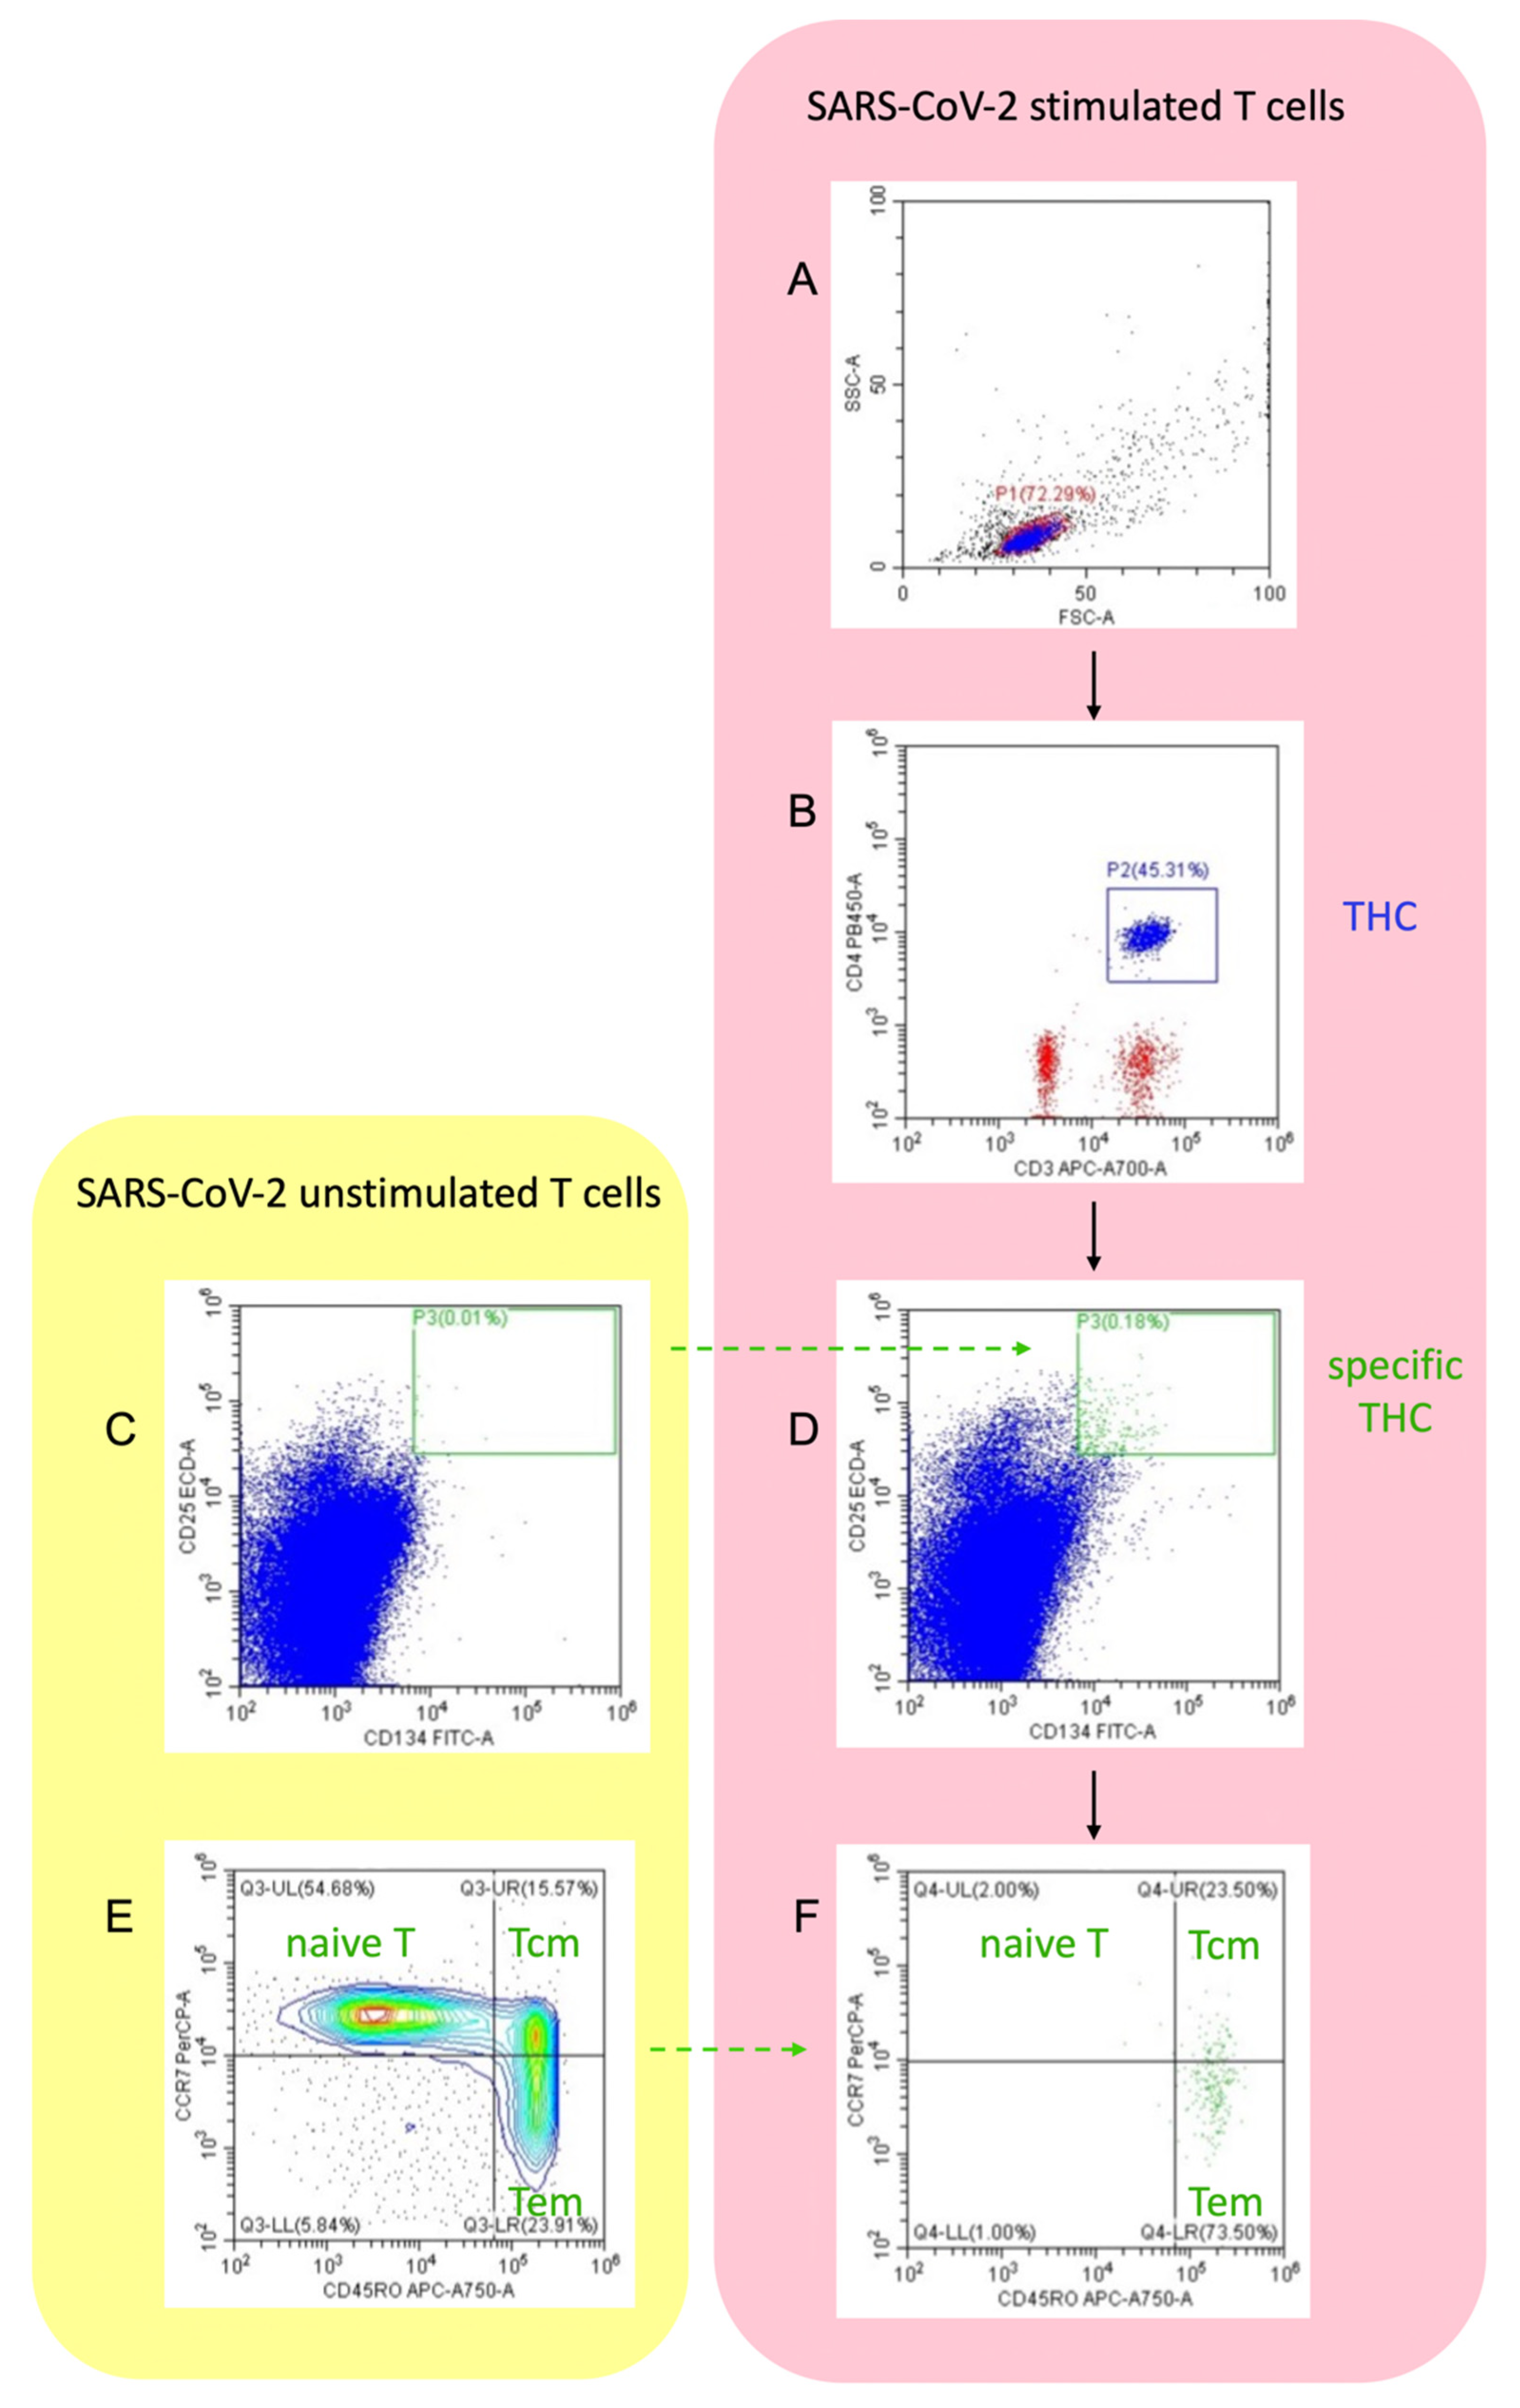
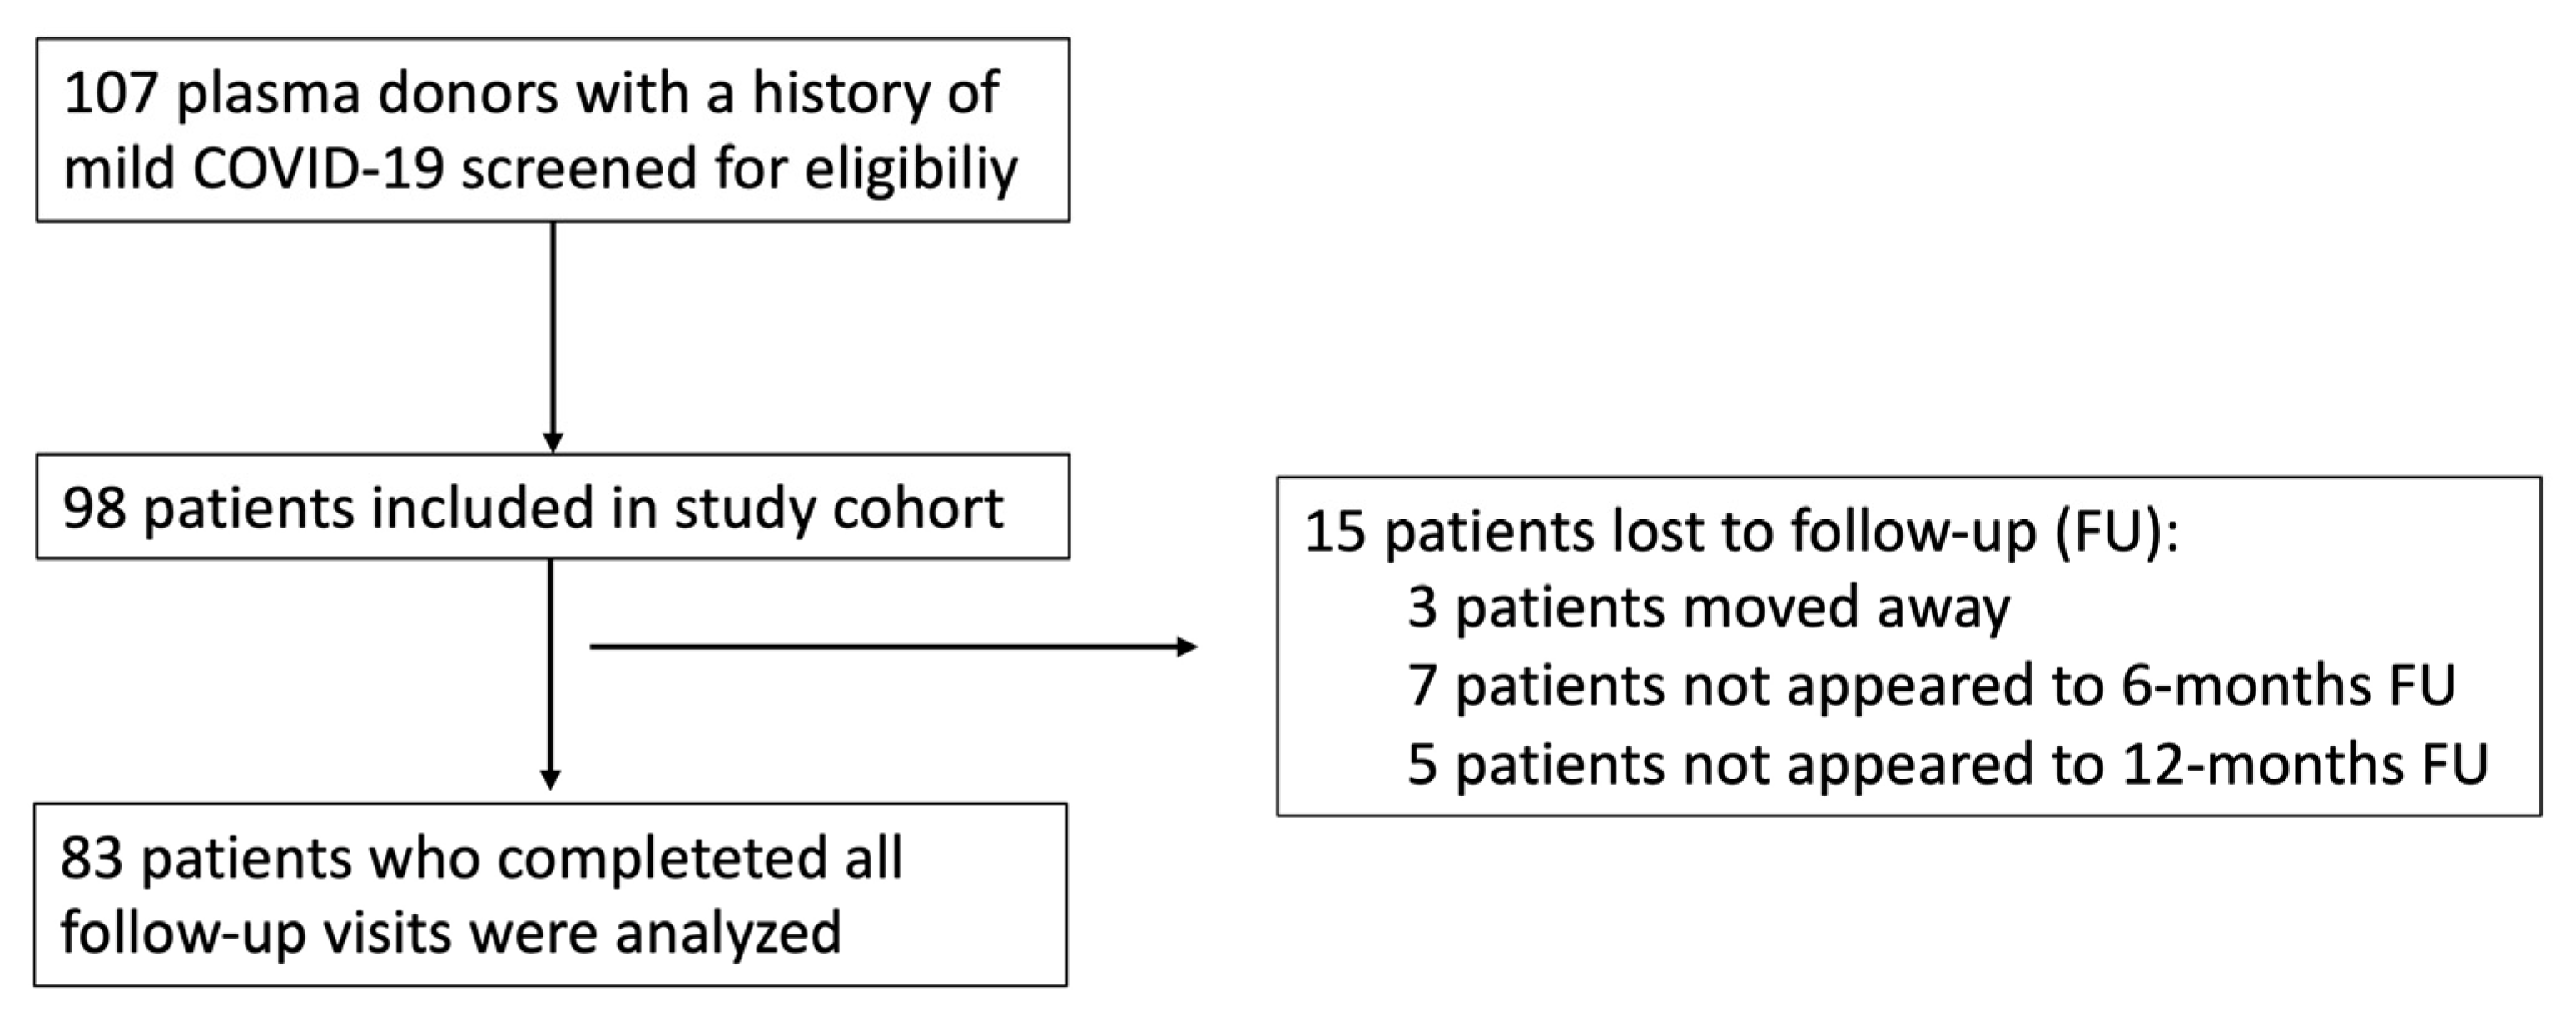
2. Materials and Methods
Statistics
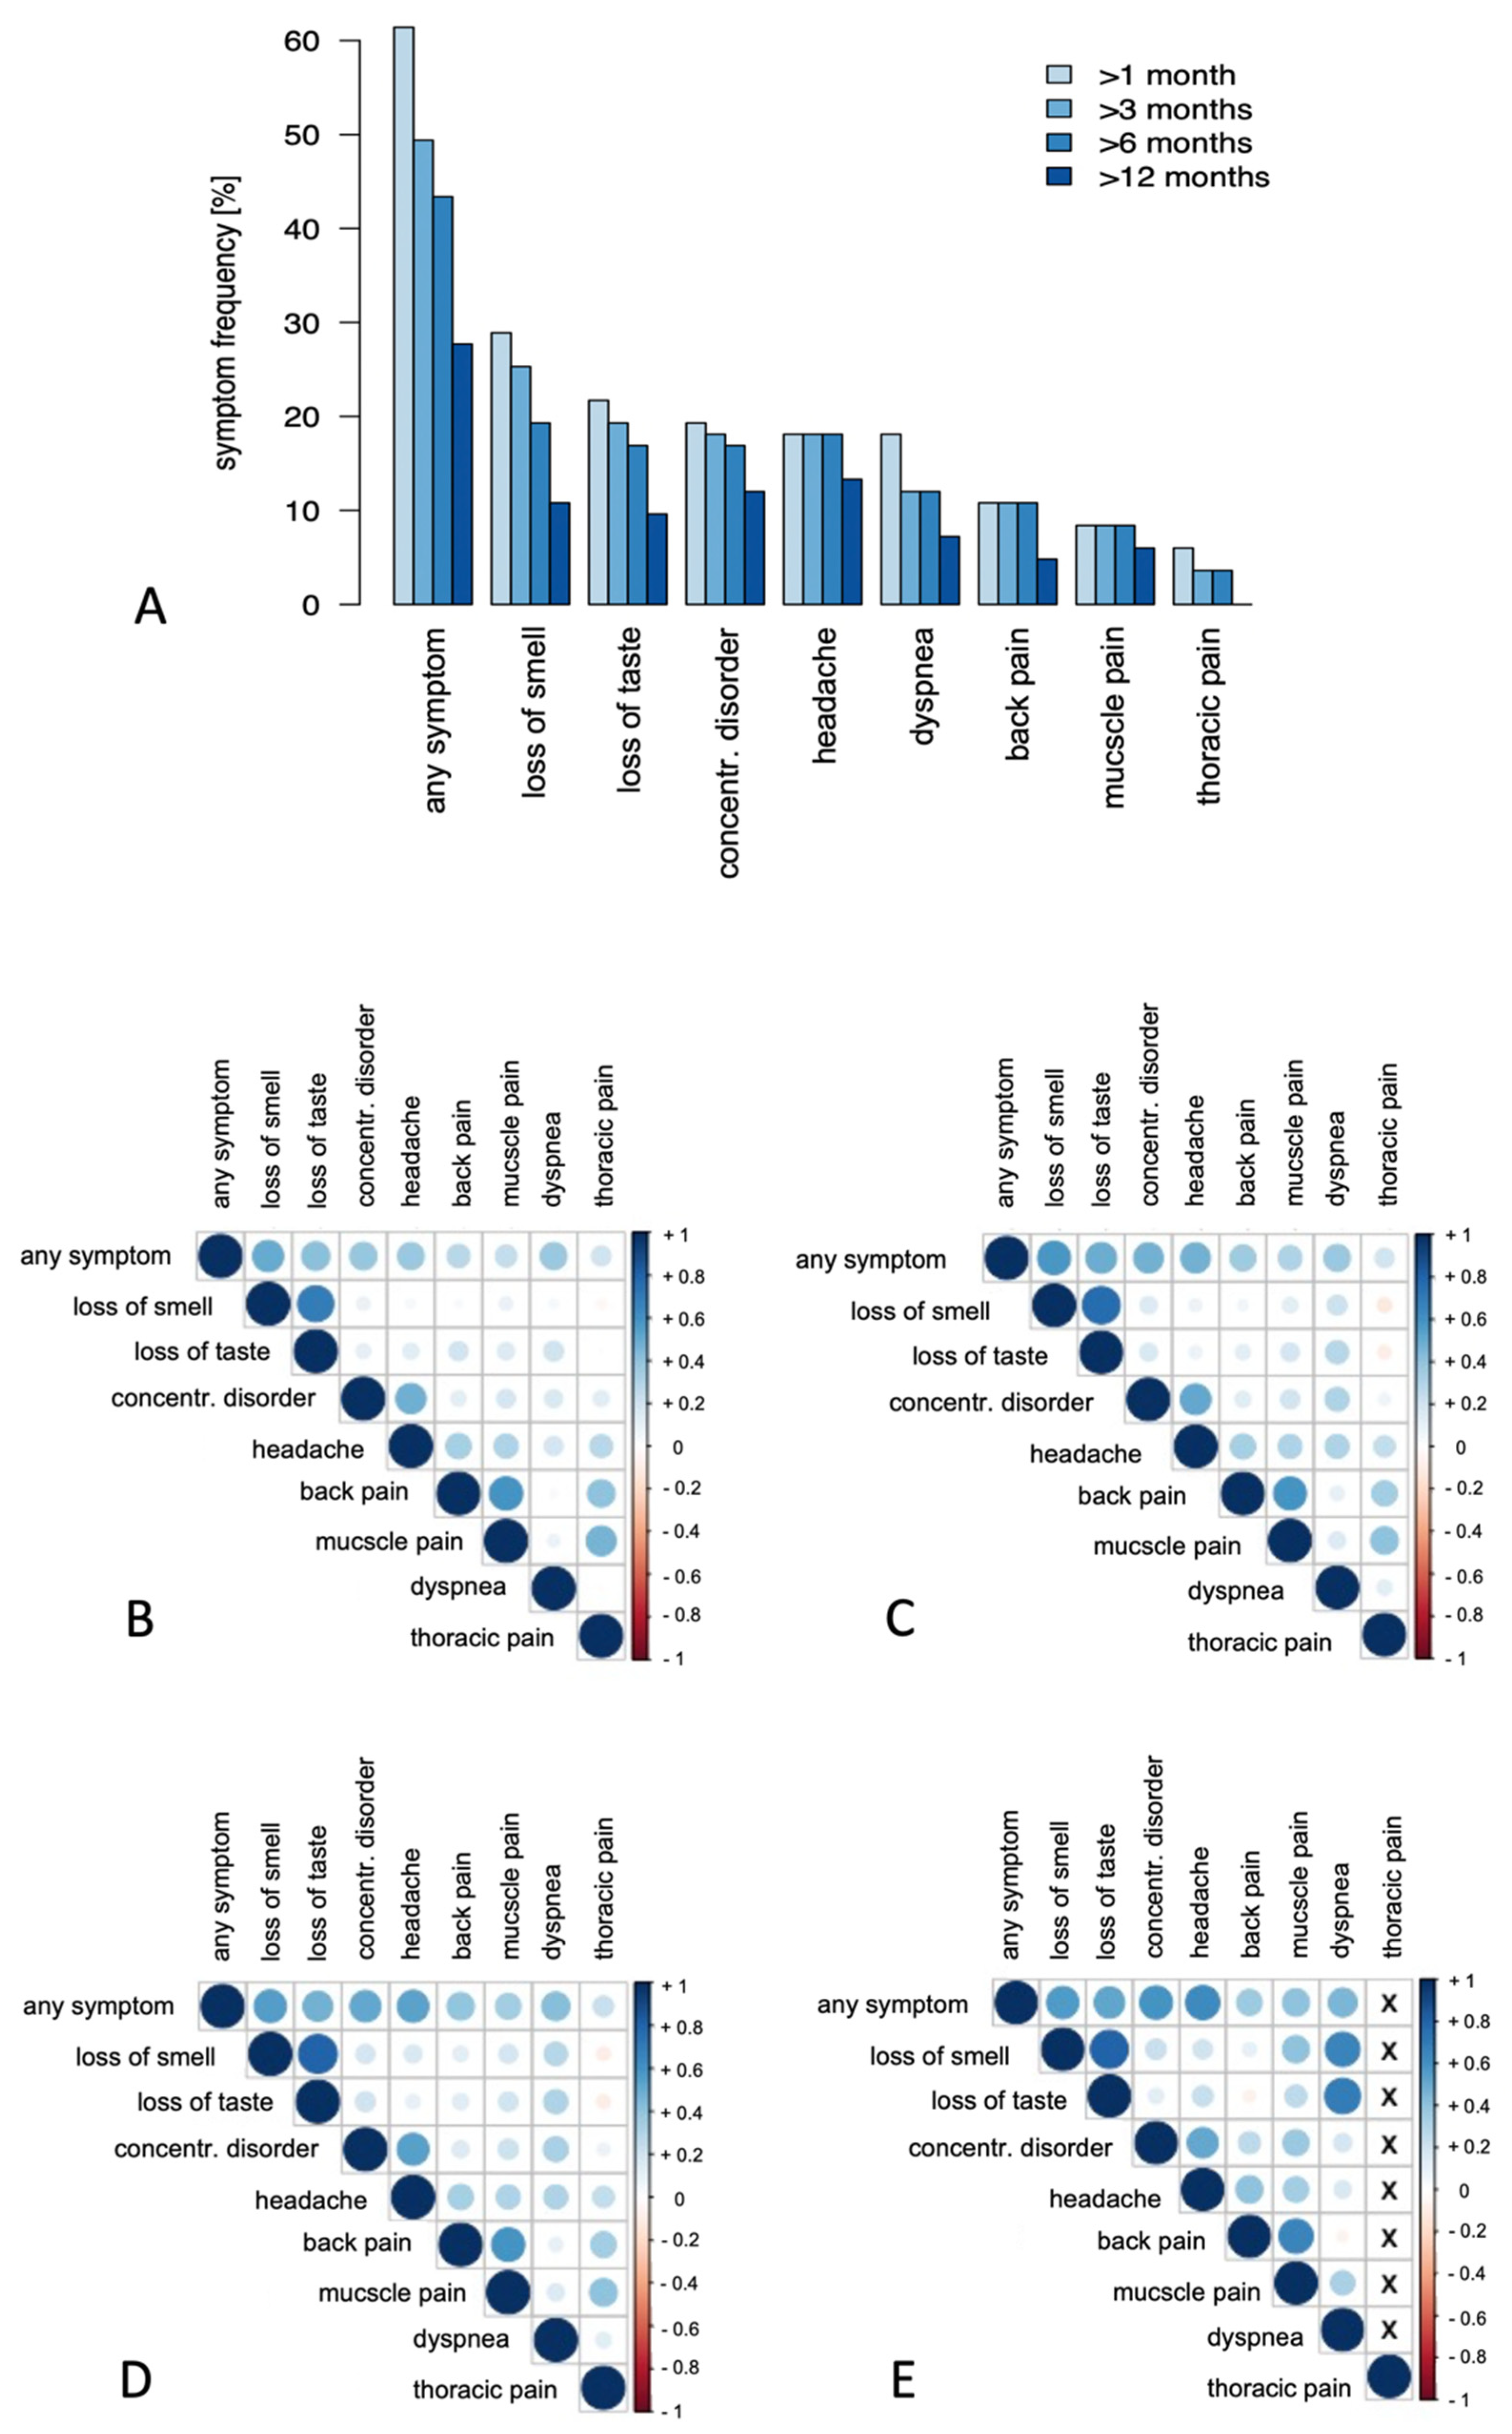
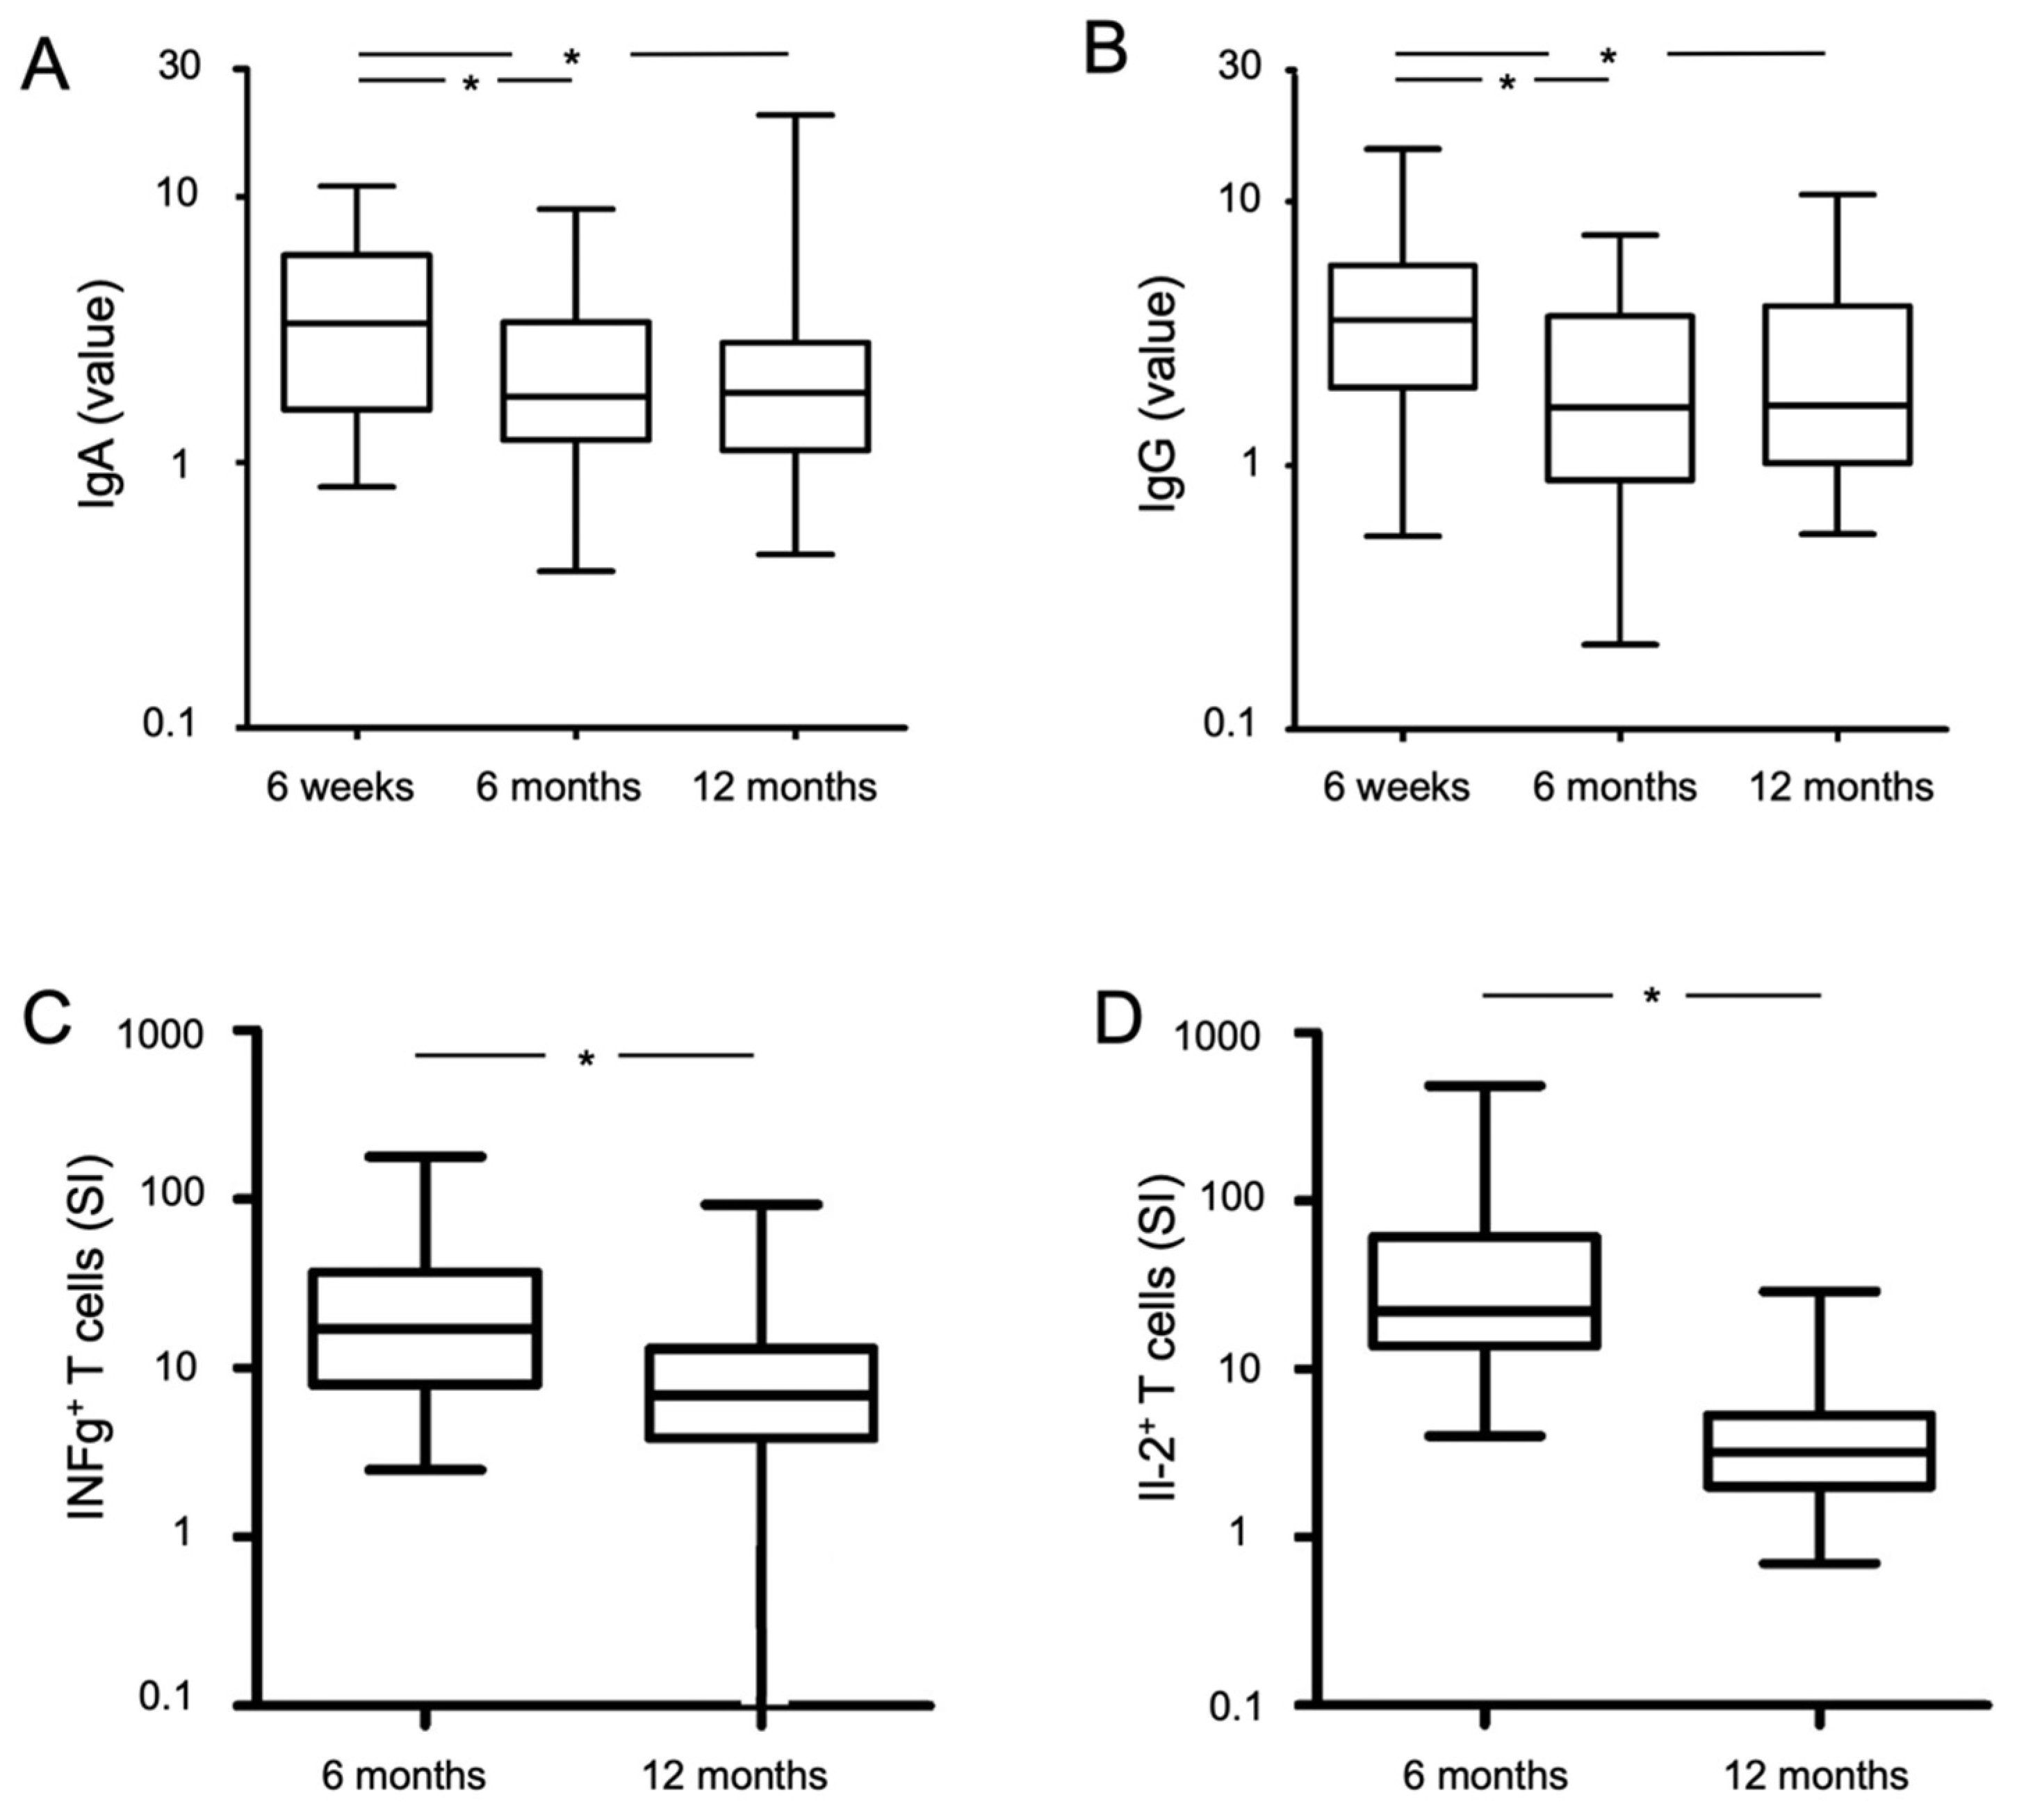
3. Results
3.1. Clinical Follow-Up
3.2. Humoral Immunity
3.3. Cellular Immunity
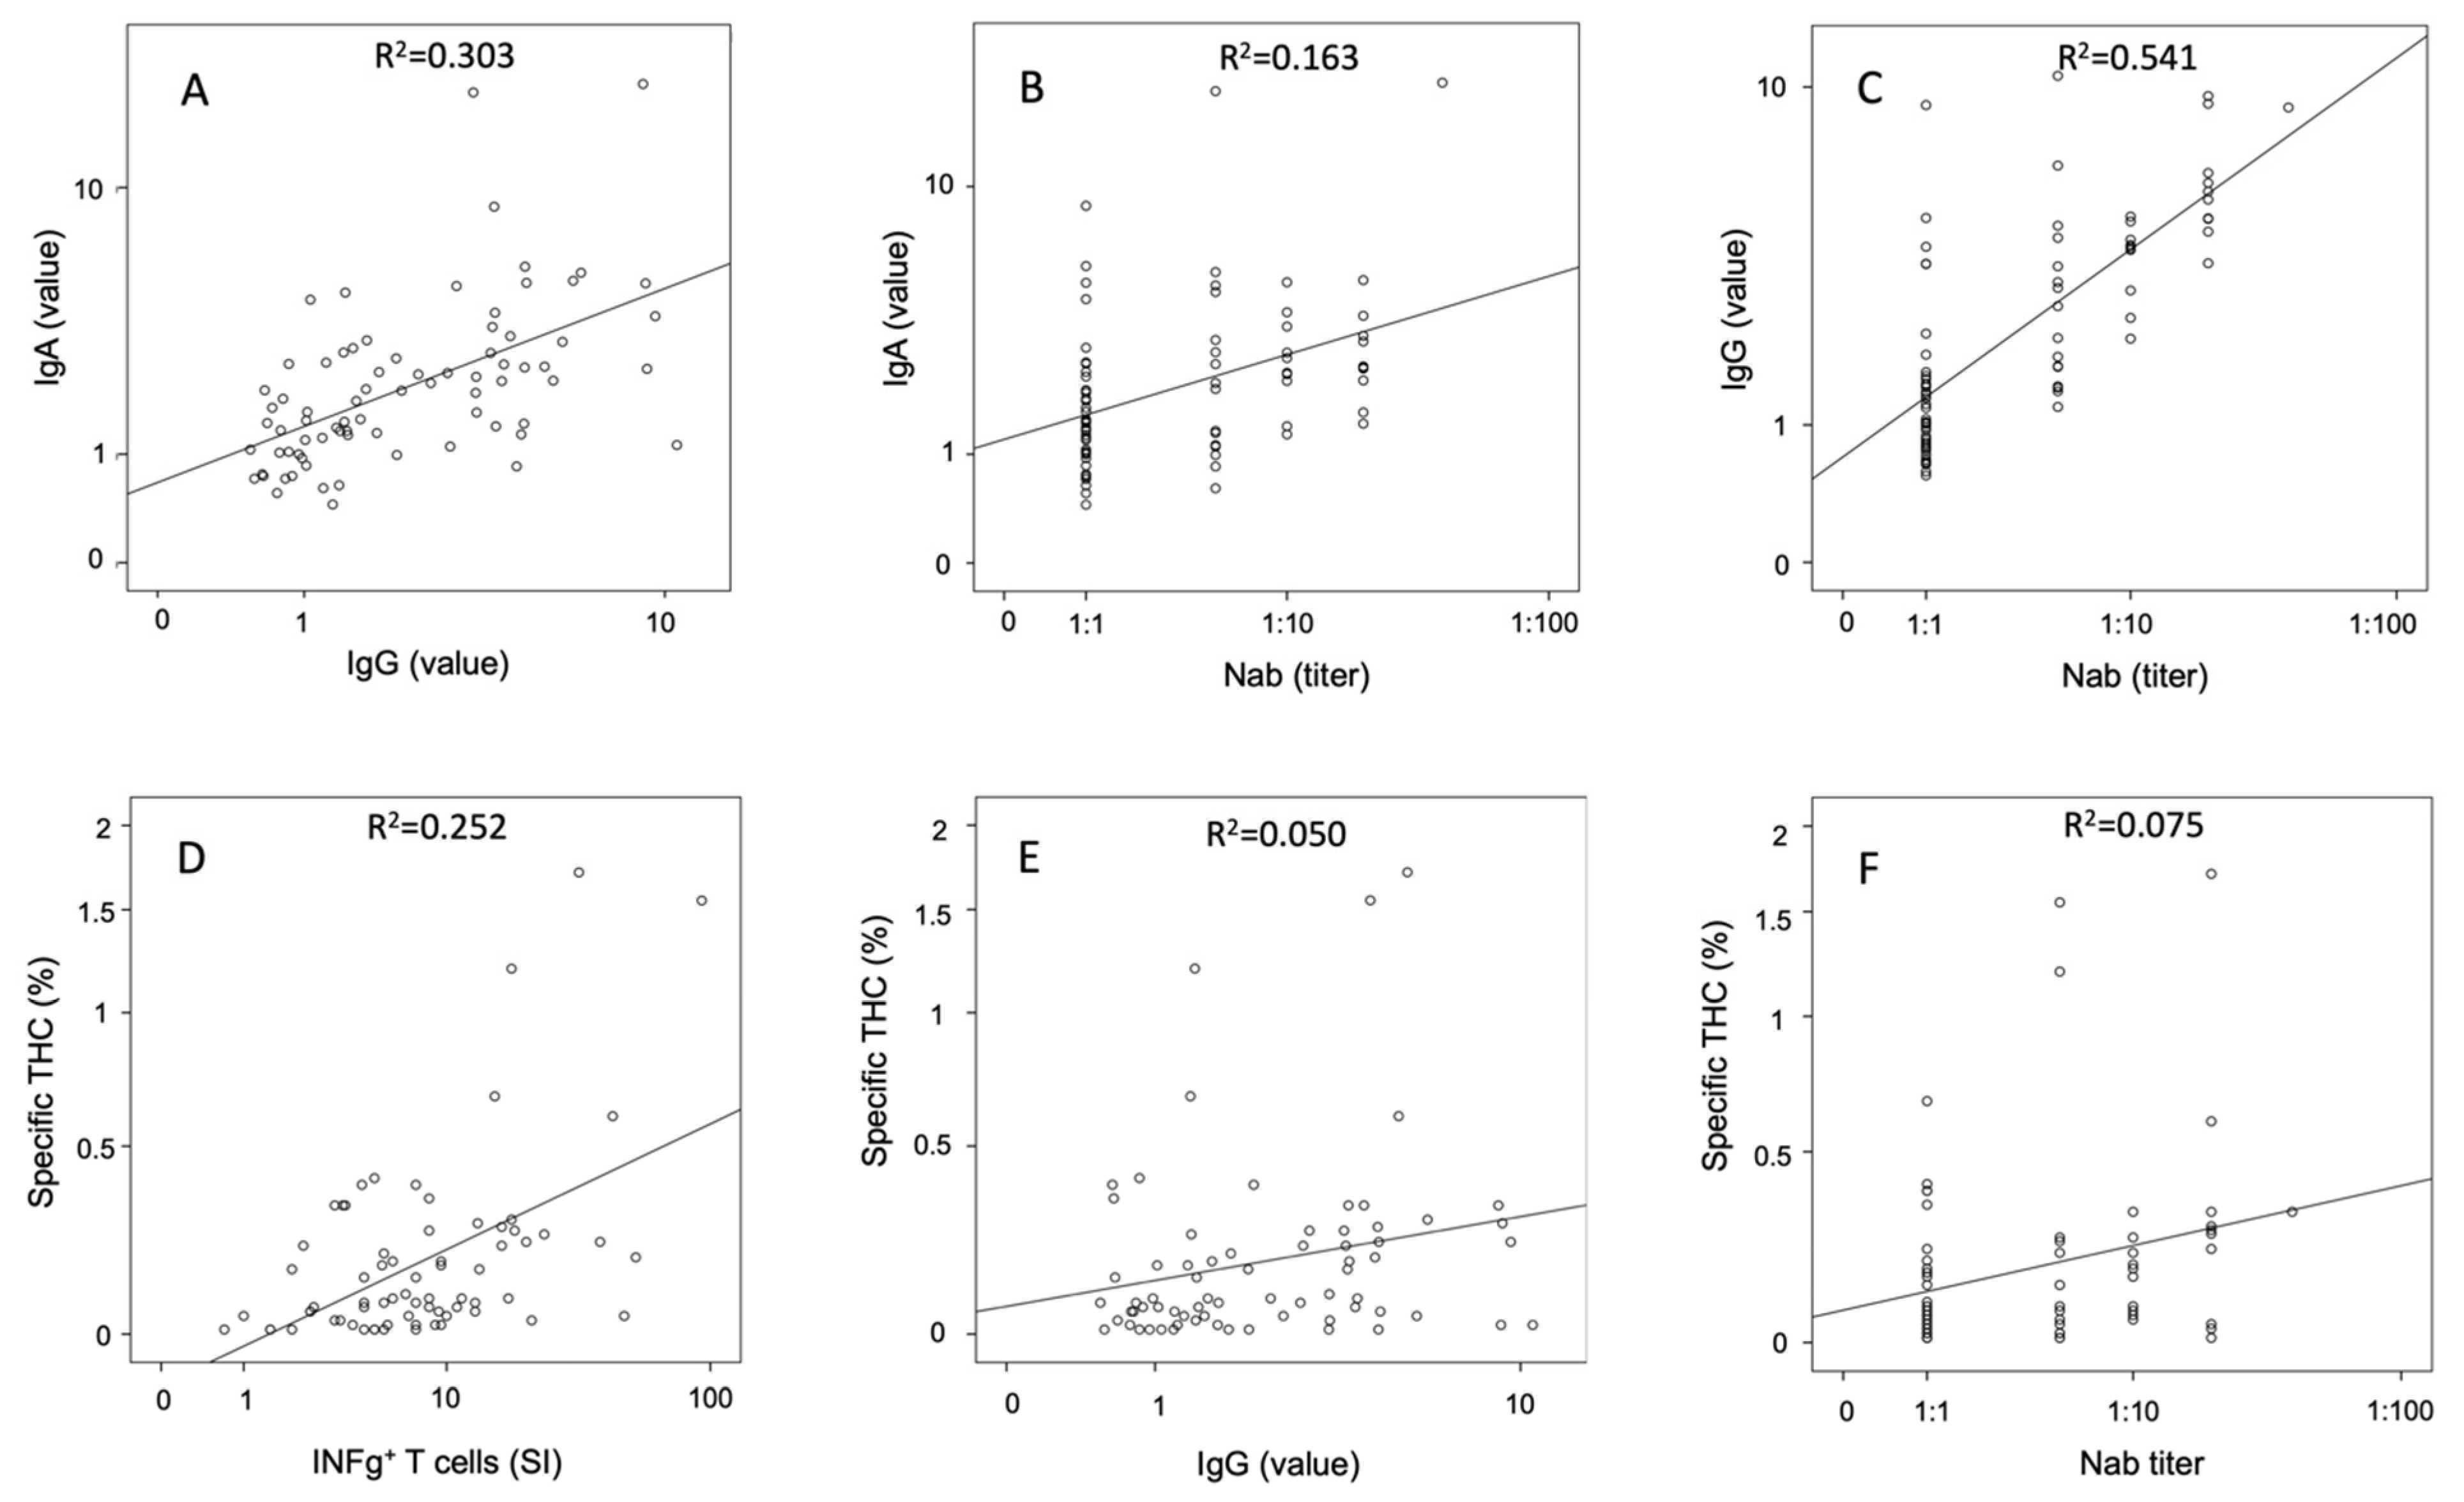
3.4. Correlative Analyses
4. Discussion
5. Conclusions
Supplementary Materials
Author Contributions
Funding
Institutional Review Board Statement
Informed Consent Statement
Data Availability Statement
Conflicts of Interest
References
- Zhu, N.; Zhang, D.; Wang, W.; Li, X.; Yang, B.; Song, J.; Zhao, X.; Huang, B.; Shi, W.; Lu, R.; et al. A Novel Coronavirus from Patients with Pneumonia in China, 2019. N. Engl. J. Med. 2020, 382, 727–733. [Google Scholar] [CrossRef]
- Zhou, F.; Yu, T.; Du, R.; Fan, G.; Liu, Y.; Liu, Z.; Xiang, J.; Wang, Y.; Song, B.; Gu, X.; et al. Clinical course and risk factors for mortality of adult inpatients with COVID-19 in Wuhan, China: A retrospective cohort study. Lancet 2020, 395, 1054–1062. [Google Scholar] [CrossRef]
- Schaller, T.; Hirschbühl, K.; Burkhardt, K.; Braun, G.; Trepel, M.; Märkl, B.; Claus, R. Postmortem Examination of Patients With COVID-19. JAMA 2020, 323, 2518–2520. [Google Scholar] [CrossRef] [PubMed]
- Carfì, A.; Bernabei, R.; Landi, F. Gemelli Against COVID-19 Post-Acute Care Study Group Persistent Symptoms in Patients After Acute COVID-19. JAMA 2020, 324, 603–605. [Google Scholar] [CrossRef] [PubMed]
- Del Rio, C.; Collins, L.F.; Malani, P. Long-term Health Consequences of COVID-19. JAMA 2020, 324, 1723. [Google Scholar] [CrossRef]
- Perlis, R.H.; Green, J.; Santillana, M.H.; Lazer, D.; Ognyanova, K.; Simonson, M.; Baum, M.; Quintana, A.; Chwe, H.; Druckman, J.; et al. Persistence of symptoms up to 10 months following acute COVID-19 illness. MedRxiv 2021. [Google Scholar] [CrossRef]
- Gousseff, M.; Penot, P.; Gallay, L.; Batisse, D.; Benech, N.; Bouiller, K.; Collarino, R.; Conrad, A.; Slama, D.; Joseph, C.; et al. Clinical recurrences of COVID-19 symptoms after recovery: Viral relapse, reinfection or inflammatory rebound? J. Infect. 2020, 81, 816–846. [Google Scholar] [CrossRef]
- Cromer, D.; Juno, J.A.; Khoury, D.; Reynaldi, A.; Wheatley, A.K.; Kent, S.J.; Davenport, M.P. Prospects for durable immune control of SARS-CoV-2 and prevention of reinfection. Nat. Rev. Immunol. 2021, 21, 395–404. [Google Scholar] [CrossRef] [PubMed]
- Centers for Disease Control and Prevention. Interim Clinical Guidance for Management of Patients with Confirmed Coronavirus Disease (COVID-19) U.S. Centers for Disease Control and Prevention (CDC). Available online: https://www.dcd.gov (accessed on 12 February 2021).
- WHO Clinical Management of Severe Acute Respiratory Infection (SARI) When COVID-19 Disease Is Suspected: Interim Guidance. Available online: https://apps.who.int/iris/handle/10665/331446 (accessed on 13 March 2020).
- Haselmann, V.; Özçürümez, M.K.; Klawonn, F.; Ast, V.; Gerhards, C.; Eichner, R.; Costina, V.; Dobler, G.; Geilenkeuser, W.-J.; Wölfel, R.; et al. Results of the first pilot external quality assessment (EQA) scheme for anti-SARS-CoV2-antibody testing. Clin. Chem. Lab. Med. 2020, 58, 2121–2130. [Google Scholar] [CrossRef]
- Reiss, S.; Baxter, A.E.; Cirelli, K.M.; Dan, J.M.; Morou, A.; Daigneault, A.; Brassard, N.; Silvestri, G.; Routy, J.-P.; Havenar-Daughton, C.; et al. Comparative analysis of activation induced marker (AIM) assays for sensitive identification of antigen-specific CD4 T cells. PLoS ONE 2017, 12, e0186998. [Google Scholar] [CrossRef] [Green Version]
- Braun, J.; Loyal, L.; Frentsch, M.; Wendisch, D.; Georg, P.; Kurth, F.; Hippenstiel, S.; Dingeldey, M.; Kruse, B.; Fauchere, F.; et al. SARS-CoV-2-reactive T cells in healthy donors and patients with COVID-19. Nature 2020, 587, 270–274. [Google Scholar] [CrossRef]
- Sekine, T.; Perez-Potti, A.; Rivera-Ballesteros, O.; Strålin, K.; Gorin, J.-B.; Olsson, A.; Llewellyn-Lacey, S.; Kamal, H.; Bogdanovic, G.; Muschiol, S.; et al. Robust T Cell Immunity in Convalescent Individuals with Asymptomatic or Mild COVID-19. Cell 2020, 183, 158–168. [Google Scholar] [CrossRef]
- Lopez-Leon, S.; Wegman-Ostrosky, T.; Perelman, C.; Sepulveda, R.; Rebolledo, P.A.; Cuapio, A.; Villapol, S. More Than 50 Long-Term Effects of COVID-19: A Systematic Review and Meta-Analysis. Res. Sq. 2021. [Google Scholar] [CrossRef]
- Riestra-Ayora, J.; Yanes-Diaz, J.; Esteban-Sanchez, J.; Vaduva, C.; Molina-Quiros, C.; Larran-Jimenez, A.; Martin-Sanz, E. Long-term follow-up of olfactory and gustatory dysfunction in COVID-19: 6 months case–control study of health workers. Eur. Arch. Oto-Rhino-Laryngol. 2021, 1–7. [Google Scholar] [CrossRef]
- Jacobson, K.B.; Rao, M.; Bonilla, H.; Subramanian, A.; Hack, I.; Madrigal, M.; Singh, U.; Jagannathan, P.; Grant, P. Patients with Uncomplicated Coronavirus Disease 2019 (COVID-19) Have Long-Term Persistent Symptoms and Functional Impairment Similar to Patients with Severe COVID-19: A Cautionary Tale During a Global Pandemic. Clin. Infect. Dis. 2021. [Google Scholar] [CrossRef]
- Wang, F.; Nie, J.; Wang, H.; Zhao, Q.; Xiong, Y.; Deng, L.; Song, S.; Ma, Z.; Mo, P.; Zhang, Y. Characteristics of Peripheral Lymphocyte Subset Alteration in COVID-19 Pneumonia. J. Infect. Dis. 2020, 221, 1762–1769. [Google Scholar] [CrossRef] [Green Version]
- Li, T.; Qiu, Z.; Zhang, L.; Han, Y.; He, W.; Liu, Z.; Ma, X.; Fan, H.; Lu, W.; Xie, J.; et al. Significant Changes of Peripheral T Lymphocyte Subsets in Patients with Severe Acute Respiratory Syndrome. J. Infect. Dis. 2004, 189, 648–651. [Google Scholar] [CrossRef] [PubMed] [Green Version]
- Zitzow, L.A.; Rowe, T.; Morken, T.; Shieh, W.-J.; Zaki, S.; Katz, J.M. Pathogenesis of Avian Influenza A (H5N1) Viruses in Ferrets. J. Virol. 2002, 76, 4420–4429. [Google Scholar] [CrossRef] [Green Version]
- Griffin, D.E. Measles virus-induced suppression of immune responses. Immunol. Rev. 2010, 236, 176–189. [Google Scholar] [CrossRef] [PubMed] [Green Version]
- Rank, A.; Löhr, P.; Hoffmann, R.; Ebigbo, A.; Grützner, S.; Schmid, C.; Claus, R. Sustained cellular immunity in adults recovered from mild COVID-19. Cytom. Part A 2021, 99, 429–434. [Google Scholar] [CrossRef] [PubMed]
- Beaudoin-Bussières, G.; Laumaea, A.; Anand, S.P.; Prévost, J.; Gasser, R.; Goyette, G.; Medjahed, H.; Perreault, J.; Tremblay, T.; Lewin, A.; et al. Decline of Humoral Responses against SARS-CoV-2 Spike in Convalescent Individuals. mBio 2020, 11. [Google Scholar] [CrossRef] [PubMed]
- Cohen, K.W.; Linderman, S.L.; Moodie, Z.; Czartoski, J.; Lai, L.; Mantus, G.; Norwood, C.; Nyhoff, L.E.; Edara, V.V.; Floyd, K.; et al. Longitudinal analysis shows durable and broad immune memory after SARS-CoV-2 infection with persisting antibody responses and memory B and T cells. MedRxiv 2021. [Google Scholar] [CrossRef]
- Turner, J.S.; Kim, W.; Kalaidina, E.; Goss, C.W.; Rauseo, A.M.; Schmitz, A.J.; Hansen, L.; Haile, A.; Klebert, M.K.; Pusic, I.; et al. SARS-CoV-2 infection induces long-lived bone marrow plasma cells in humans. Nature 2021, 595, 421–425. [Google Scholar] [CrossRef]
- Dan, J.M.; Mateus, J.; Kato, Y.; Hastie, K.M.; Yu, E.D.; Faliti, C.E.; Grifoni, A.; Ramirez, S.I.; Haupt, S.; Frazier, A.; et al. Immunological memory to SARS-CoV-2 assessed for up to 8 months after infection. Science 2021, 371, eabf4063. [Google Scholar] [CrossRef]
- Glück, V.; Grobecker, S.; Tydykov, L.; Salzberger, B.; Glück, T.; Weidlich, T.; Bertok, M.; Gottwald, C.; Wenzel, J.J.; Gessner, A.; et al. SARS-CoV-2-directed antibodies persist for more than six months in a cohort with mild to moderate COVID-19. Infection 2021, 10, 1–8. [Google Scholar] [CrossRef]
- Wheatley, A.K.; Juno, J.A.; Wang, J.J.; Selva, K.J.; Reynaldi, A.; Tan, H.-X.; Lee, W.S.; Wragg, K.M.; Kelly, H.G.; Esterbauer, R.; et al. Evolution of immune responses to SARS-CoV-2 in mild-moderate COVID-19. Nat. Commun. 2021, 12, 1162. [Google Scholar] [CrossRef]
- Plotkin, S.A. Correlates of Protection Induced by Vaccination. Clin. Vaccine Immunol. 2010, 17, 1055–1065. [Google Scholar] [CrossRef] [Green Version]
- Marot, S.; Malet, I.; Leducq, V.; Zafilaza, K.; Sterlin, D.; Planas, D.; Gothland, A.; Jary, A.; Dorgham, K.; Bruel, T.; et al. Rapid decline of neutralizing antibodies against SARS-CoV-2 among infected healthcare workers. Nat. Commun. 2021, 12, 844. [Google Scholar] [CrossRef]
- Moderbacher, C.R.; Ramirez, S.I.; Dan, J.M.; Grifoni, A.; Hastie, K.M.; Weiskopf, D.; Belanger, S.; Abbott, R.K.; Kim, C.; Choi, J.; et al. Antigen-Specific Adaptive Immunity to SARS-CoV-2 in Acute COVID-19 and Associations with Age and Disease Severity. Cell 2020, 183, 996–1012. [Google Scholar] [CrossRef]
- Li, Z.; Liu, J.; Deng, H.; Yang, X.; Wang, H.; Feng, X.; Zelinskyy, G.; Trilling, M.; Sutter, K.; Lu, M.; et al. SARS-CoV-2-specific T cell memory is long-lasting in the majority of convalsecent COVID-19 individuals. bioRxiv 2020. [Google Scholar] [CrossRef]
- Nelde, A.; Bilich, T.; Heitmann, J.S.; Maringer, Y.; Salih, H.R.; Roerden, M.; Lübke, M.; Bauer, J.; Rieth, J.; Wacker, M.; et al. SARS-CoV-2-derived peptides define heterologous and COVID-19-induced T cell recognition. Nat. Immunol. 2021, 22, 74–85. [Google Scholar] [CrossRef] [PubMed]
- Nalbandian, A.; Sehgal, K.; Gupta, A.; Madhavan, M.V.; McGroder, C.; Stevens, J.S.; Cook, J.R.; Nordvig, A.S.; Shalev, D.; Sehrawat, T.S.; et al. Post-acute COVID-19 syndrome. Nat. Med. 2021, 27, 601–615. [Google Scholar] [CrossRef] [PubMed]
- Thoms, M.; Buschauer, R.; Ameismeier, M.; Koepke, L.; Denk, T.; Hirschenberger, M.; Kratzat, H.; Hayn, M.; Mackens-Kiani, T.; Cheng, J.; et al. Structural basis for translational shutdown and immune evasion by the Nsp1 protein of SARS-CoV-2. Science 2020, 369, 1249–1255. [Google Scholar] [CrossRef] [PubMed]


| Demographics and Characteristics | COVID-19 Patients |
|---|---|
| Age in years; median(range) | 42 (19–62) * |
| Gender | |
| male; n | 63 (76%) |
| female; n | 20 (24%) |
| Symptoms during acute COVID-19 | |
| fever (>38 °C); n | 49 (59%) |
| cough; n | 32 (39%) |
| loss of smell; n | 25 (30%) |
| loss of taste; n | 18 (22%) |
| headache; n | 15 (18%) |
| dyspnoe; n | 15 (18%) |
| myalgia; n | 15 (18%) |
| sore throat; n | 11 (13%) |
| pain of the joints; n | 10 (12%) |
| rhinits; n | 8 (9%) |
| diarrhoe; n | 6 (7%) |
| nausea; n | 1 (1%) |
| Duration of symptoms (days); median (range) | 11 (1–35) |
| Patient’s care during acute COVID-19 | |
| non-hospitalization; n | 80 (96%) |
| hospitalization; n | 3 (4%) |
| Time period (days in median (range)) from | |
| onset of COVID-19 to 6-week visit | 37 (26–99) |
| onset of COVID-19 to 6-month visit | 204 (184–280) |
| onset of COVID-19 to 1-year visit | 372 (348–407) |
| Pre-existing co-morbidities | |
| hypothyroidism | 4 (5%) |
| asthma | 2 (2%) |
| hay fever | 4 (5%) |
| Assay | 6-Week Visit (n = 83) | 6-Month Visit (n = 83) | p1 Value | 12-Month Visit (Non-Vaccinated, n = 77) | 12-Month Visit (Vaccinated *, n = 5) | p2 Value |
|---|---|---|---|---|---|---|
| IgA value | 3.38 (0.8–11.0) | 1.80 (0.4–9.0) | <0.001 | 1.9 (0.5–20.3) | 22.3 (10.3–22.3) | <0.001 |
| IgG value | 3.65 (0.5–15.8) | 1.80 (0.2–7.5) | <0.001 | 1.7 (0.6–10.6) | 35.0 (13.1–40.8) | <0.001 |
| Nab titer | 1:5 (1:1–1:640) | not done | 1:1 (1:1–1:40) | 1:320 (1:160–1:320) | <0.001 |
| Assay | 6-Month Visit | 12-Month Visit (Non-Vaccinated) | p1 Value | 12-Month Visit (Vaccinated *) | p2 Value | ||||
|---|---|---|---|---|---|---|---|---|---|
| Elispot | INFg SI value | n = 51 | 19.0 (2.5–179) | n = 76 | 6.9 (0.0–93) | <0.001 | n = 5 | 22.5 (5.0–74) | 0.032 |
| Il-2 SI value | n = 32 | 22.0 (4.0–485) | n = 70 | 3.2 (0.7–29) | <0.001 | n = 5 | 4.5 (2.2–19) | 0.206 | |
| Double positive SI | n = 32 | 6.8 (0.0–74) | n = 70 | 3.3 (0.0–29) | 0.001 | n = 5 | 2.5 (1.0–17) | 0.781 | |
| AIM | Specific THC (%) | n = 70 | 0.08 (0.01–1.71) | n = 5 | 0.1 (0.02–0.93) | 0.845 | |||
| THC SI value | n = 70 | 5.1 (1.0–53) | n = 5 | 10.0 (2.0–16) | 0.462 | ||||
| specific Tcm (%) # | n = 56 | 39 (8–64) | n = 5 | 53 (23–100) | 0.080 | ||||
| specific Tem (%) # | n = 56 | 58 (20–84) | n = 5 | 44 (1–67) | 0.039 | ||||
| ratio Tem / Tcm # | n = 56 | 1.5 (0.3–10.5) | n = 5 | 0.8 (0.01–2.9) | 0.059 | ||||
Publisher’s Note: MDPI stays neutral with regard to jurisdictional claims in published maps and institutional affiliations. |
© 2021 by the authors. Licensee MDPI, Basel, Switzerland. This article is an open access article distributed under the terms and conditions of the Creative Commons Attribution (CC BY) license (https://creativecommons.org/licenses/by/4.0/).
Share and Cite
Rank, A.; Tzortzini, A.; Kling, E.; Schmid, C.; Claus, R.; Löll, E.; Burger, R.; Römmele, C.; Dhillon, C.; Müller, K.; et al. One Year after Mild COVID-19: The Majority of Patients Maintain Specific Immunity, But One in Four Still Suffer from Long-Term Symptoms. J. Clin. Med. 2021, 10, 3305. https://doi.org/10.3390/jcm10153305
Rank A, Tzortzini A, Kling E, Schmid C, Claus R, Löll E, Burger R, Römmele C, Dhillon C, Müller K, et al. One Year after Mild COVID-19: The Majority of Patients Maintain Specific Immunity, But One in Four Still Suffer from Long-Term Symptoms. Journal of Clinical Medicine. 2021; 10(15):3305. https://doi.org/10.3390/jcm10153305
Chicago/Turabian StyleRank, Andreas, Athanasia Tzortzini, Elisabeth Kling, Christoph Schmid, Rainer Claus, Eva Löll, Roswitha Burger, Christoph Römmele, Christine Dhillon, Katharina Müller, and et al. 2021. "One Year after Mild COVID-19: The Majority of Patients Maintain Specific Immunity, But One in Four Still Suffer from Long-Term Symptoms" Journal of Clinical Medicine 10, no. 15: 3305. https://doi.org/10.3390/jcm10153305