Tangential Flow Filtration for the Concentration of Oncolytic Measles Virus: The Influence of Filter Properties and the Cell Culture Medium

 , and
, and 
Abstract
: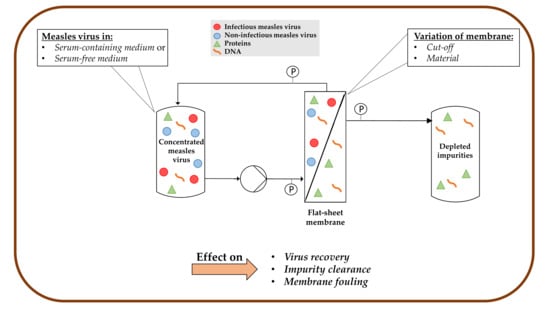
1. Introduction
2. Materials and Methods
2.1. Membranes
2.2. Cell Culture and MV Propagation
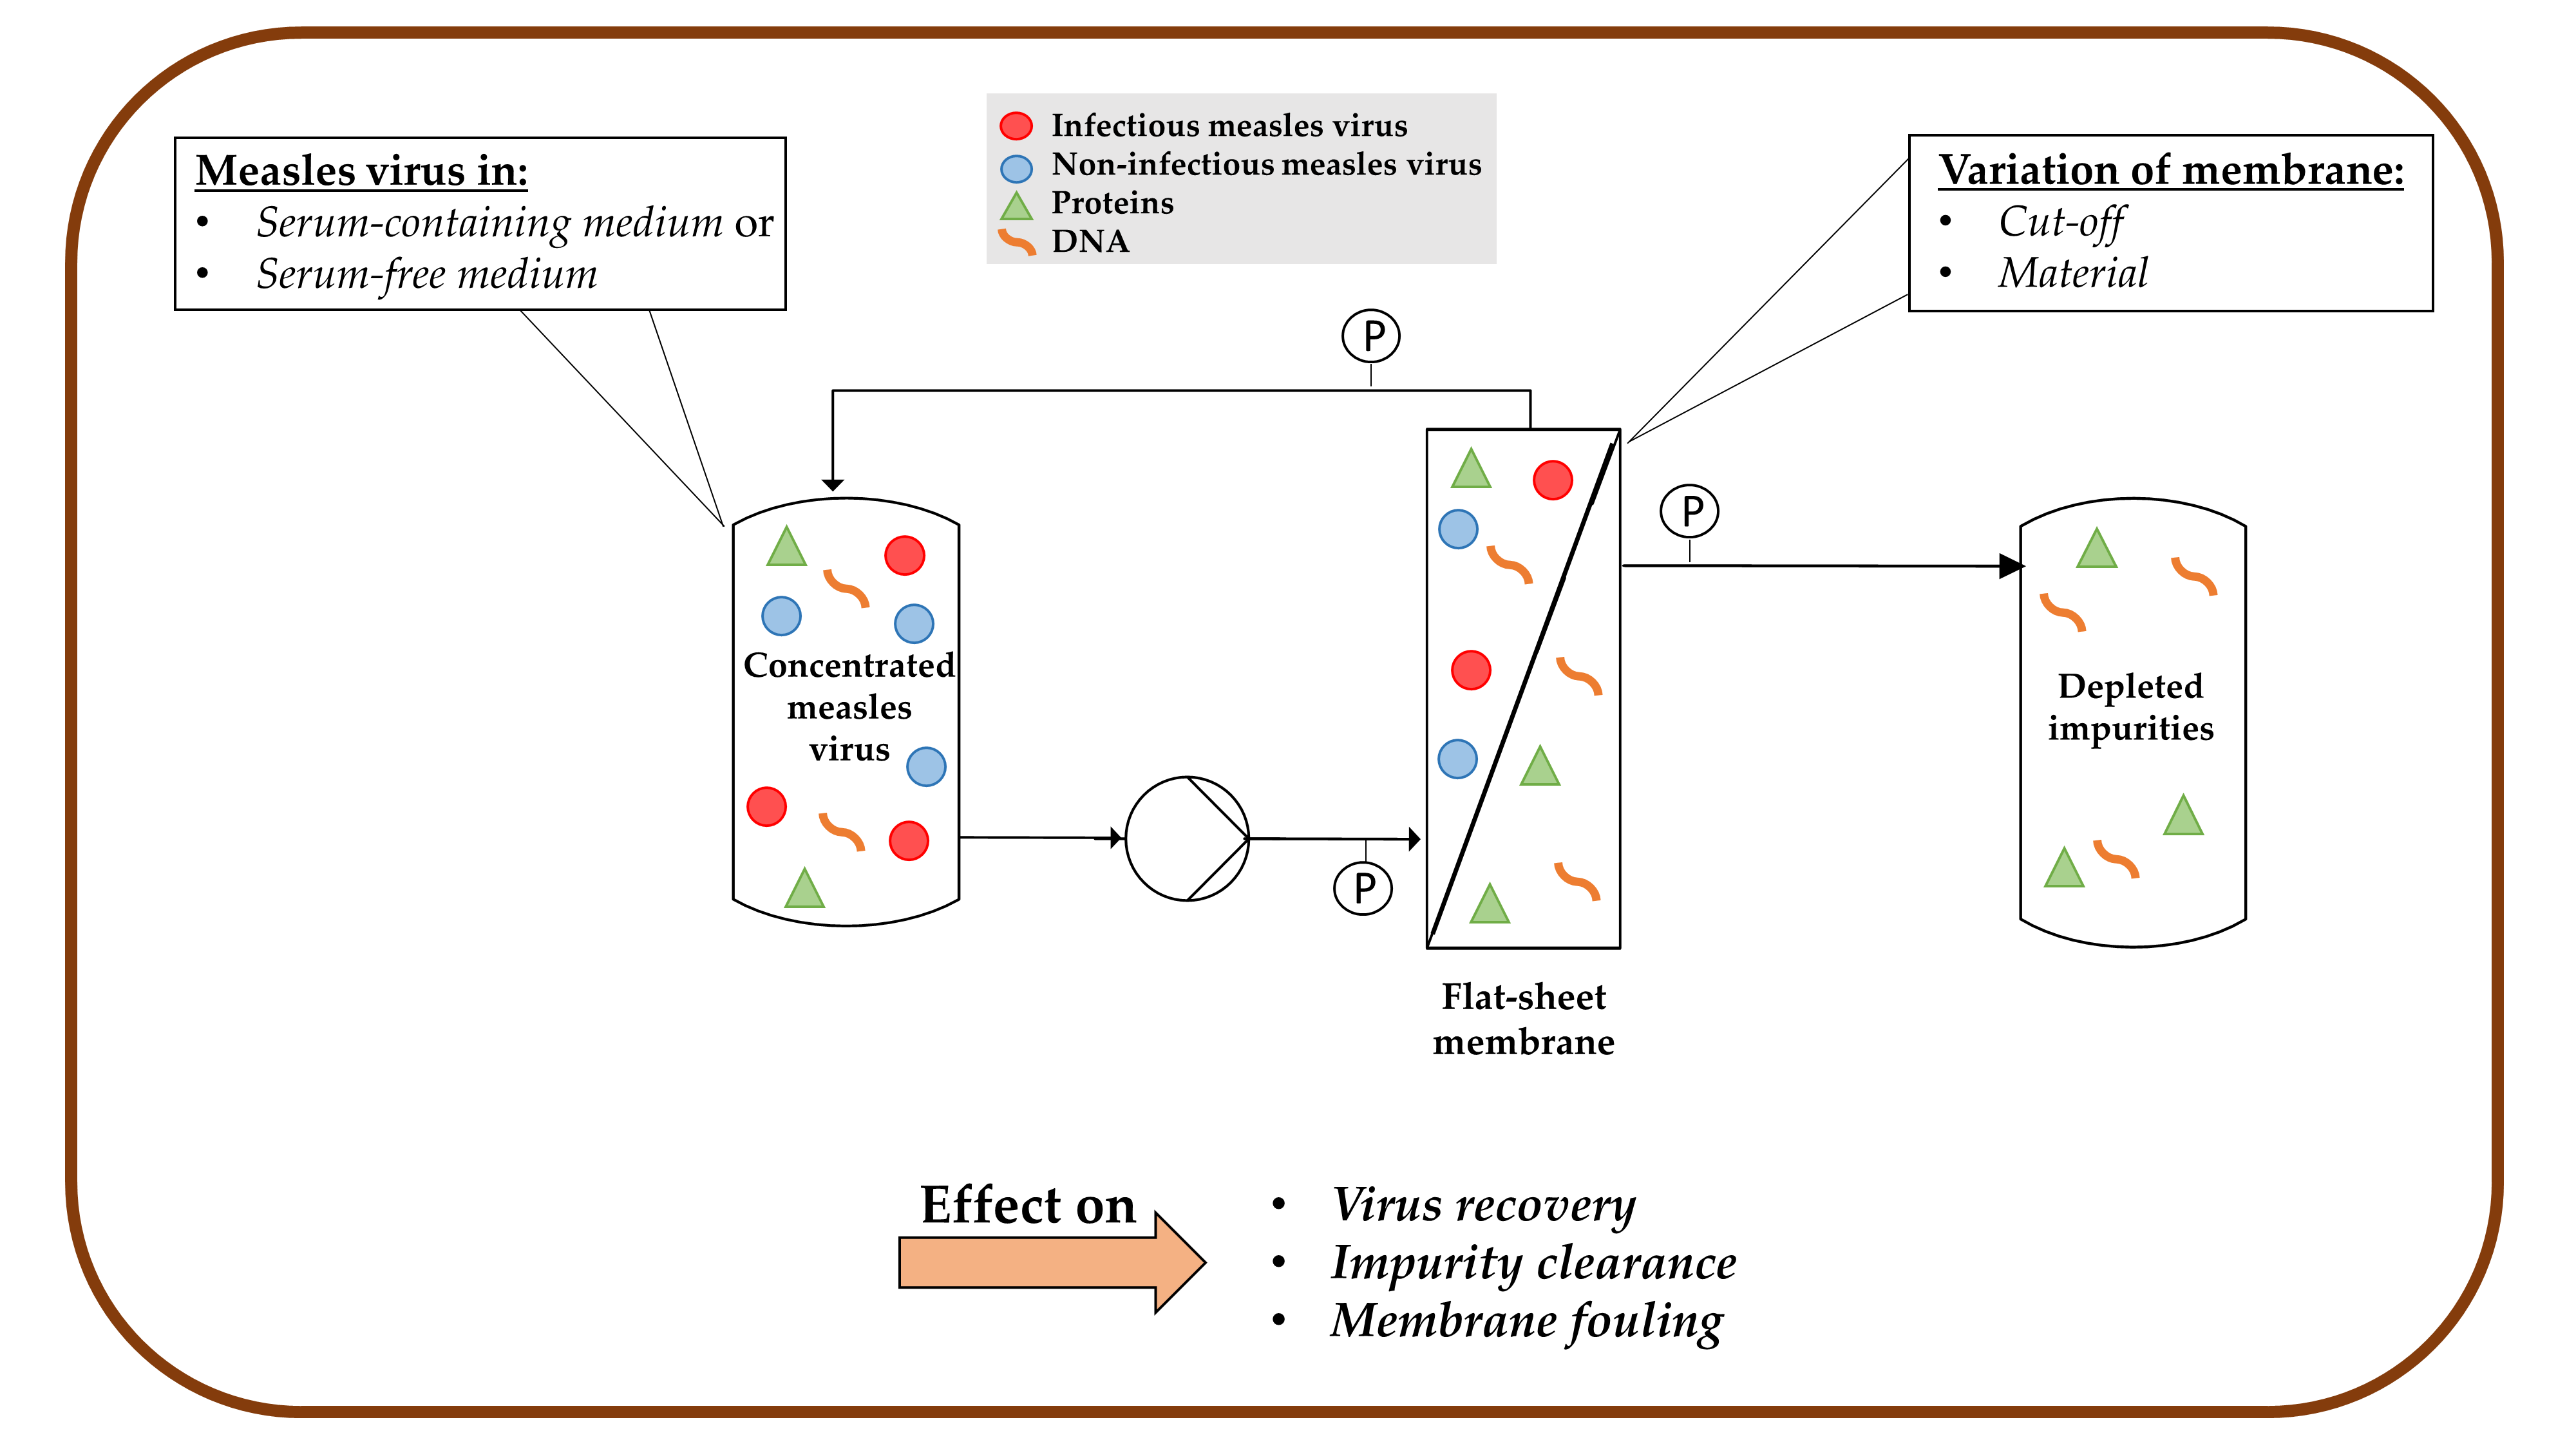
2.3. Pretreatment of MV Suspensions Prior to TFF
2.4. Ultrafiltration in TFF Mode (UF-TFF)
2.4.1. Pure Water Flux Determination
2.4.2. TFF in Concentration Mode
2.5. Determination of Fluid Viscosity
2.6. Assays
2.6.1. MV Infectivity Assay
2.6.2. Determination of Total Virus RNA Levels
2.6.3. Determination of the Total Protein Content
2.6.4. Determination of the Host Cell DNA Content
2.7. Calculations
2.7.1. Hydraulic Permeability and Permeability of the Suspension Components
2.7.2. Productivity of a Filtration Run
2.7.3. Flux Recovery
2.7.4. Product Recovery and Impurity Clearance
2.7.5. Rating of Experimental Data Fitting to Fouling Models
2.8. Statistical Analysis
3. Results
3.1. Characterization of the Membrane and the Feed Solution
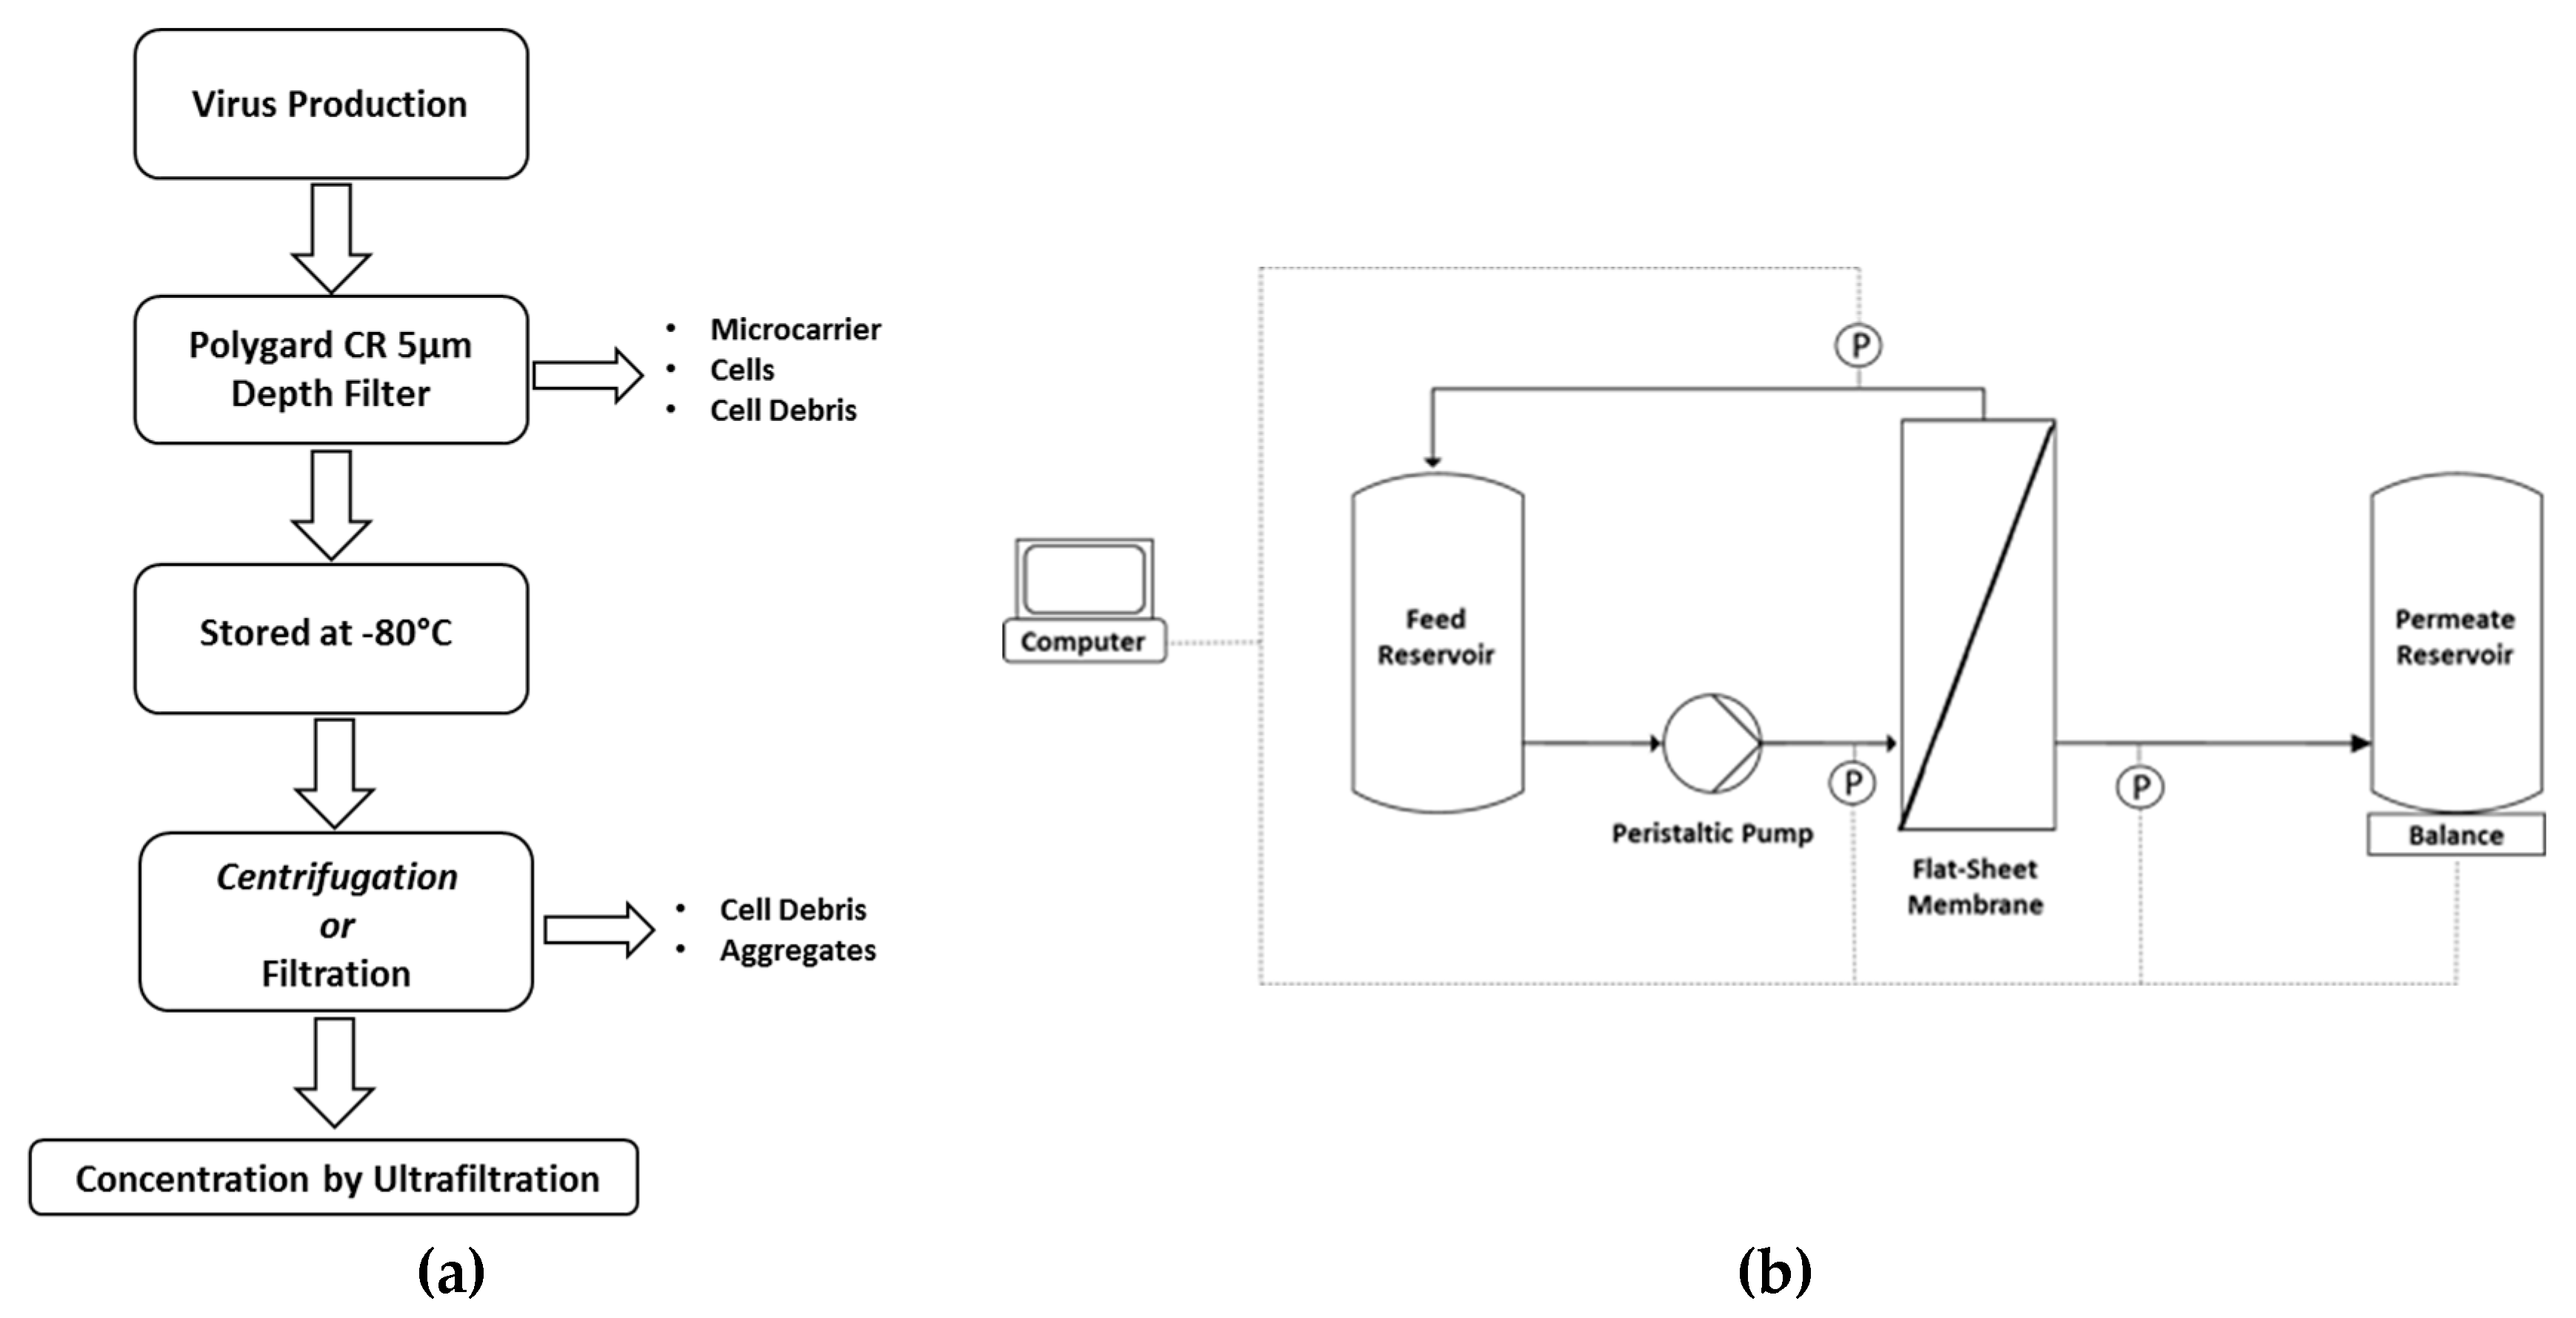
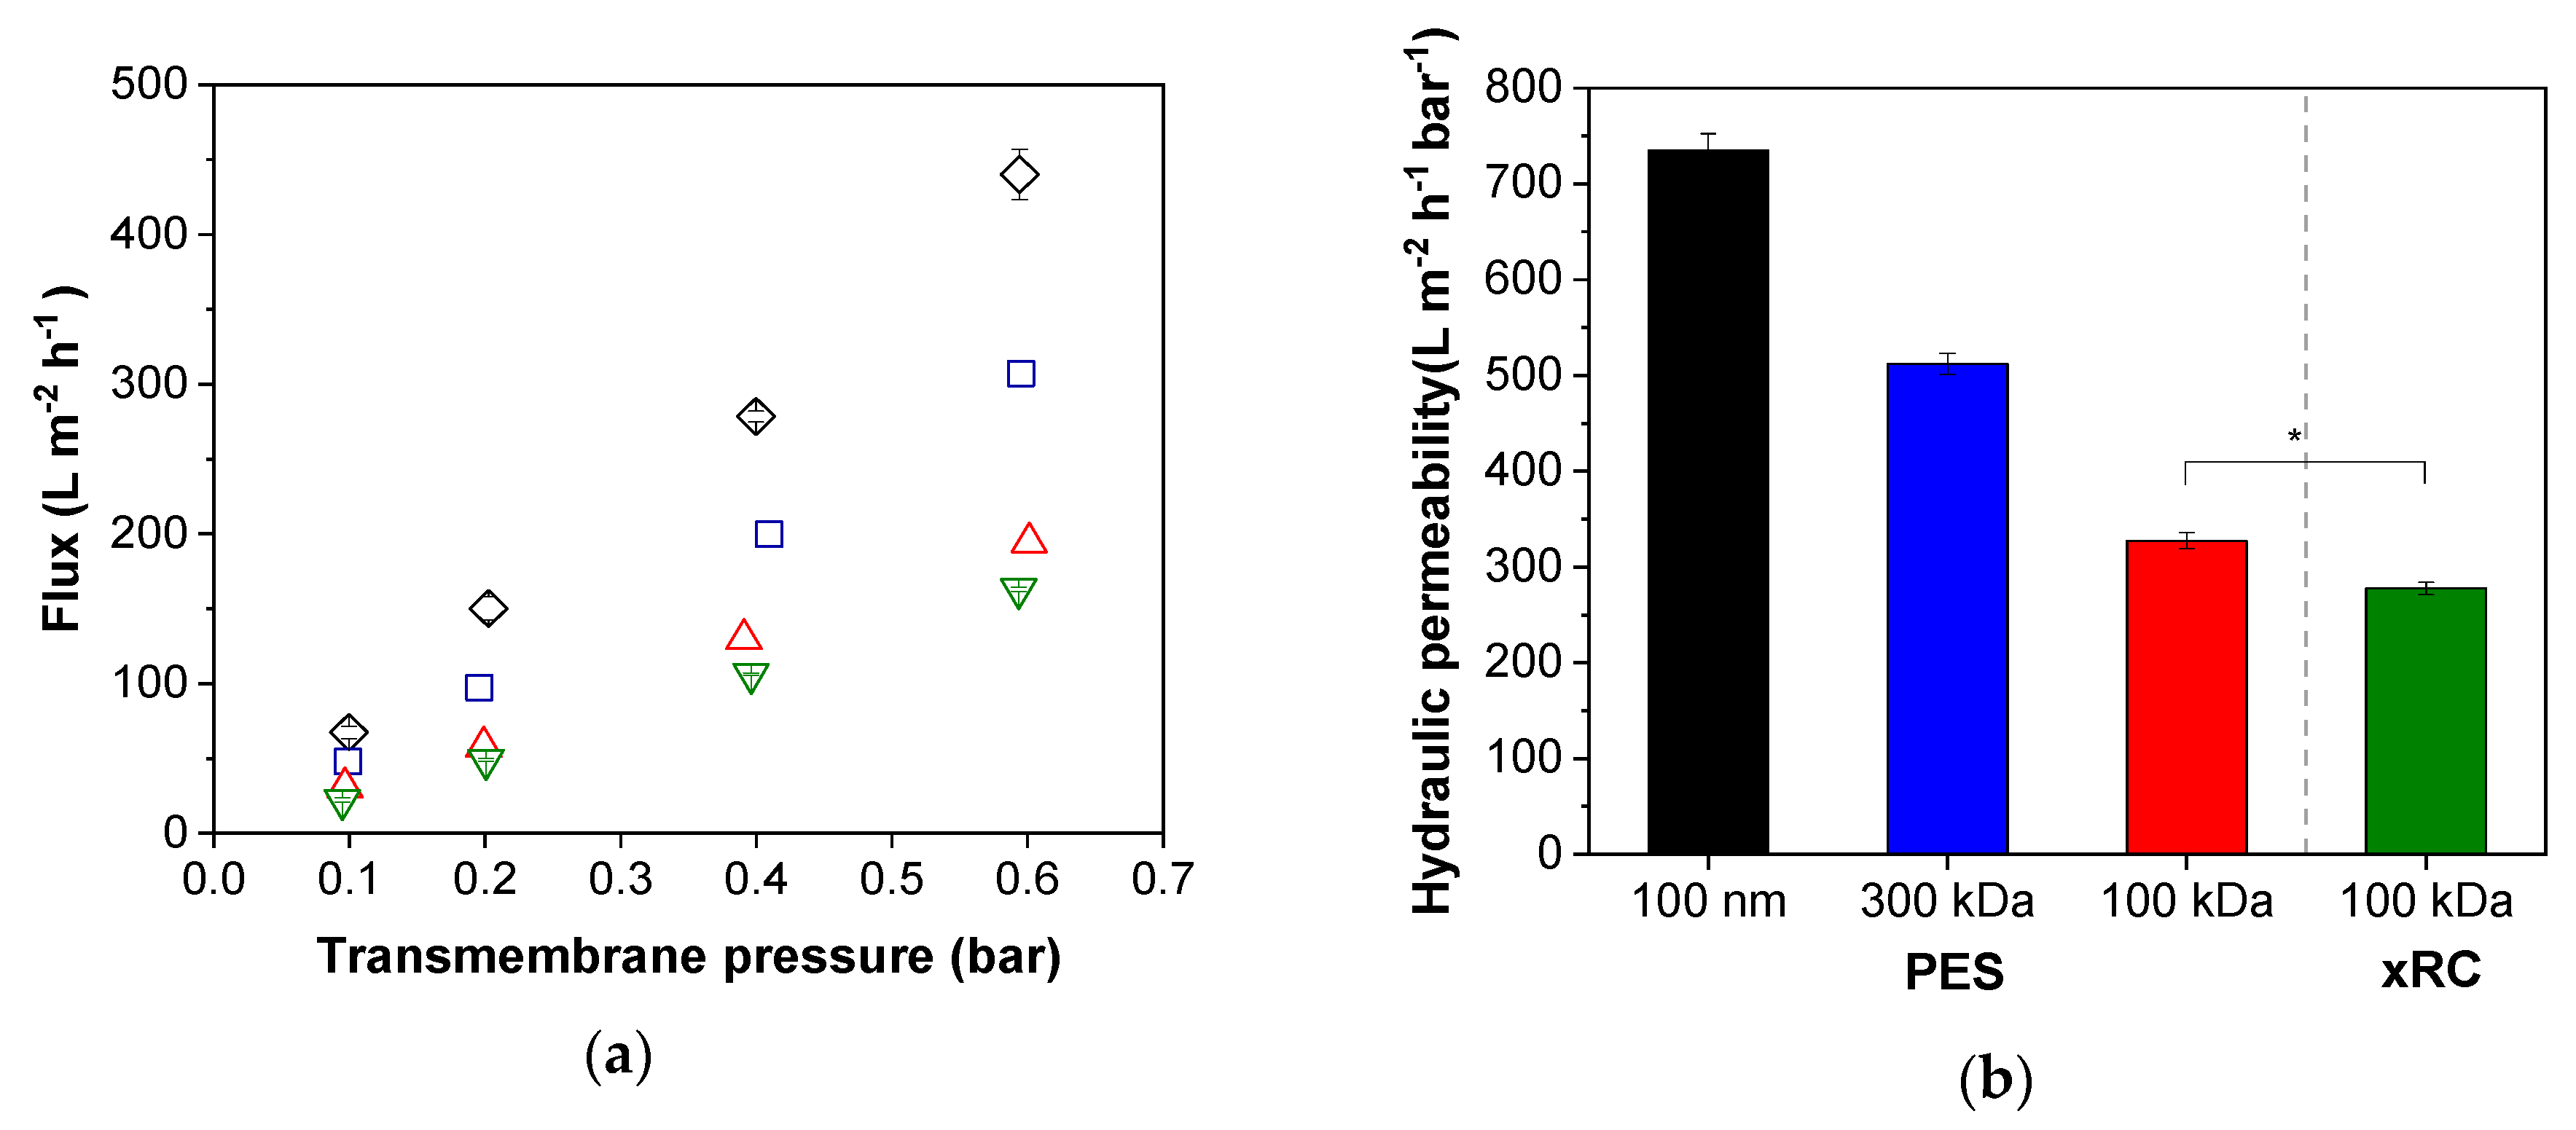
3.1.1. Characterization of the Membrane Flux
3.1.2. Characterization of the Feed
3.2. Concentration of MV
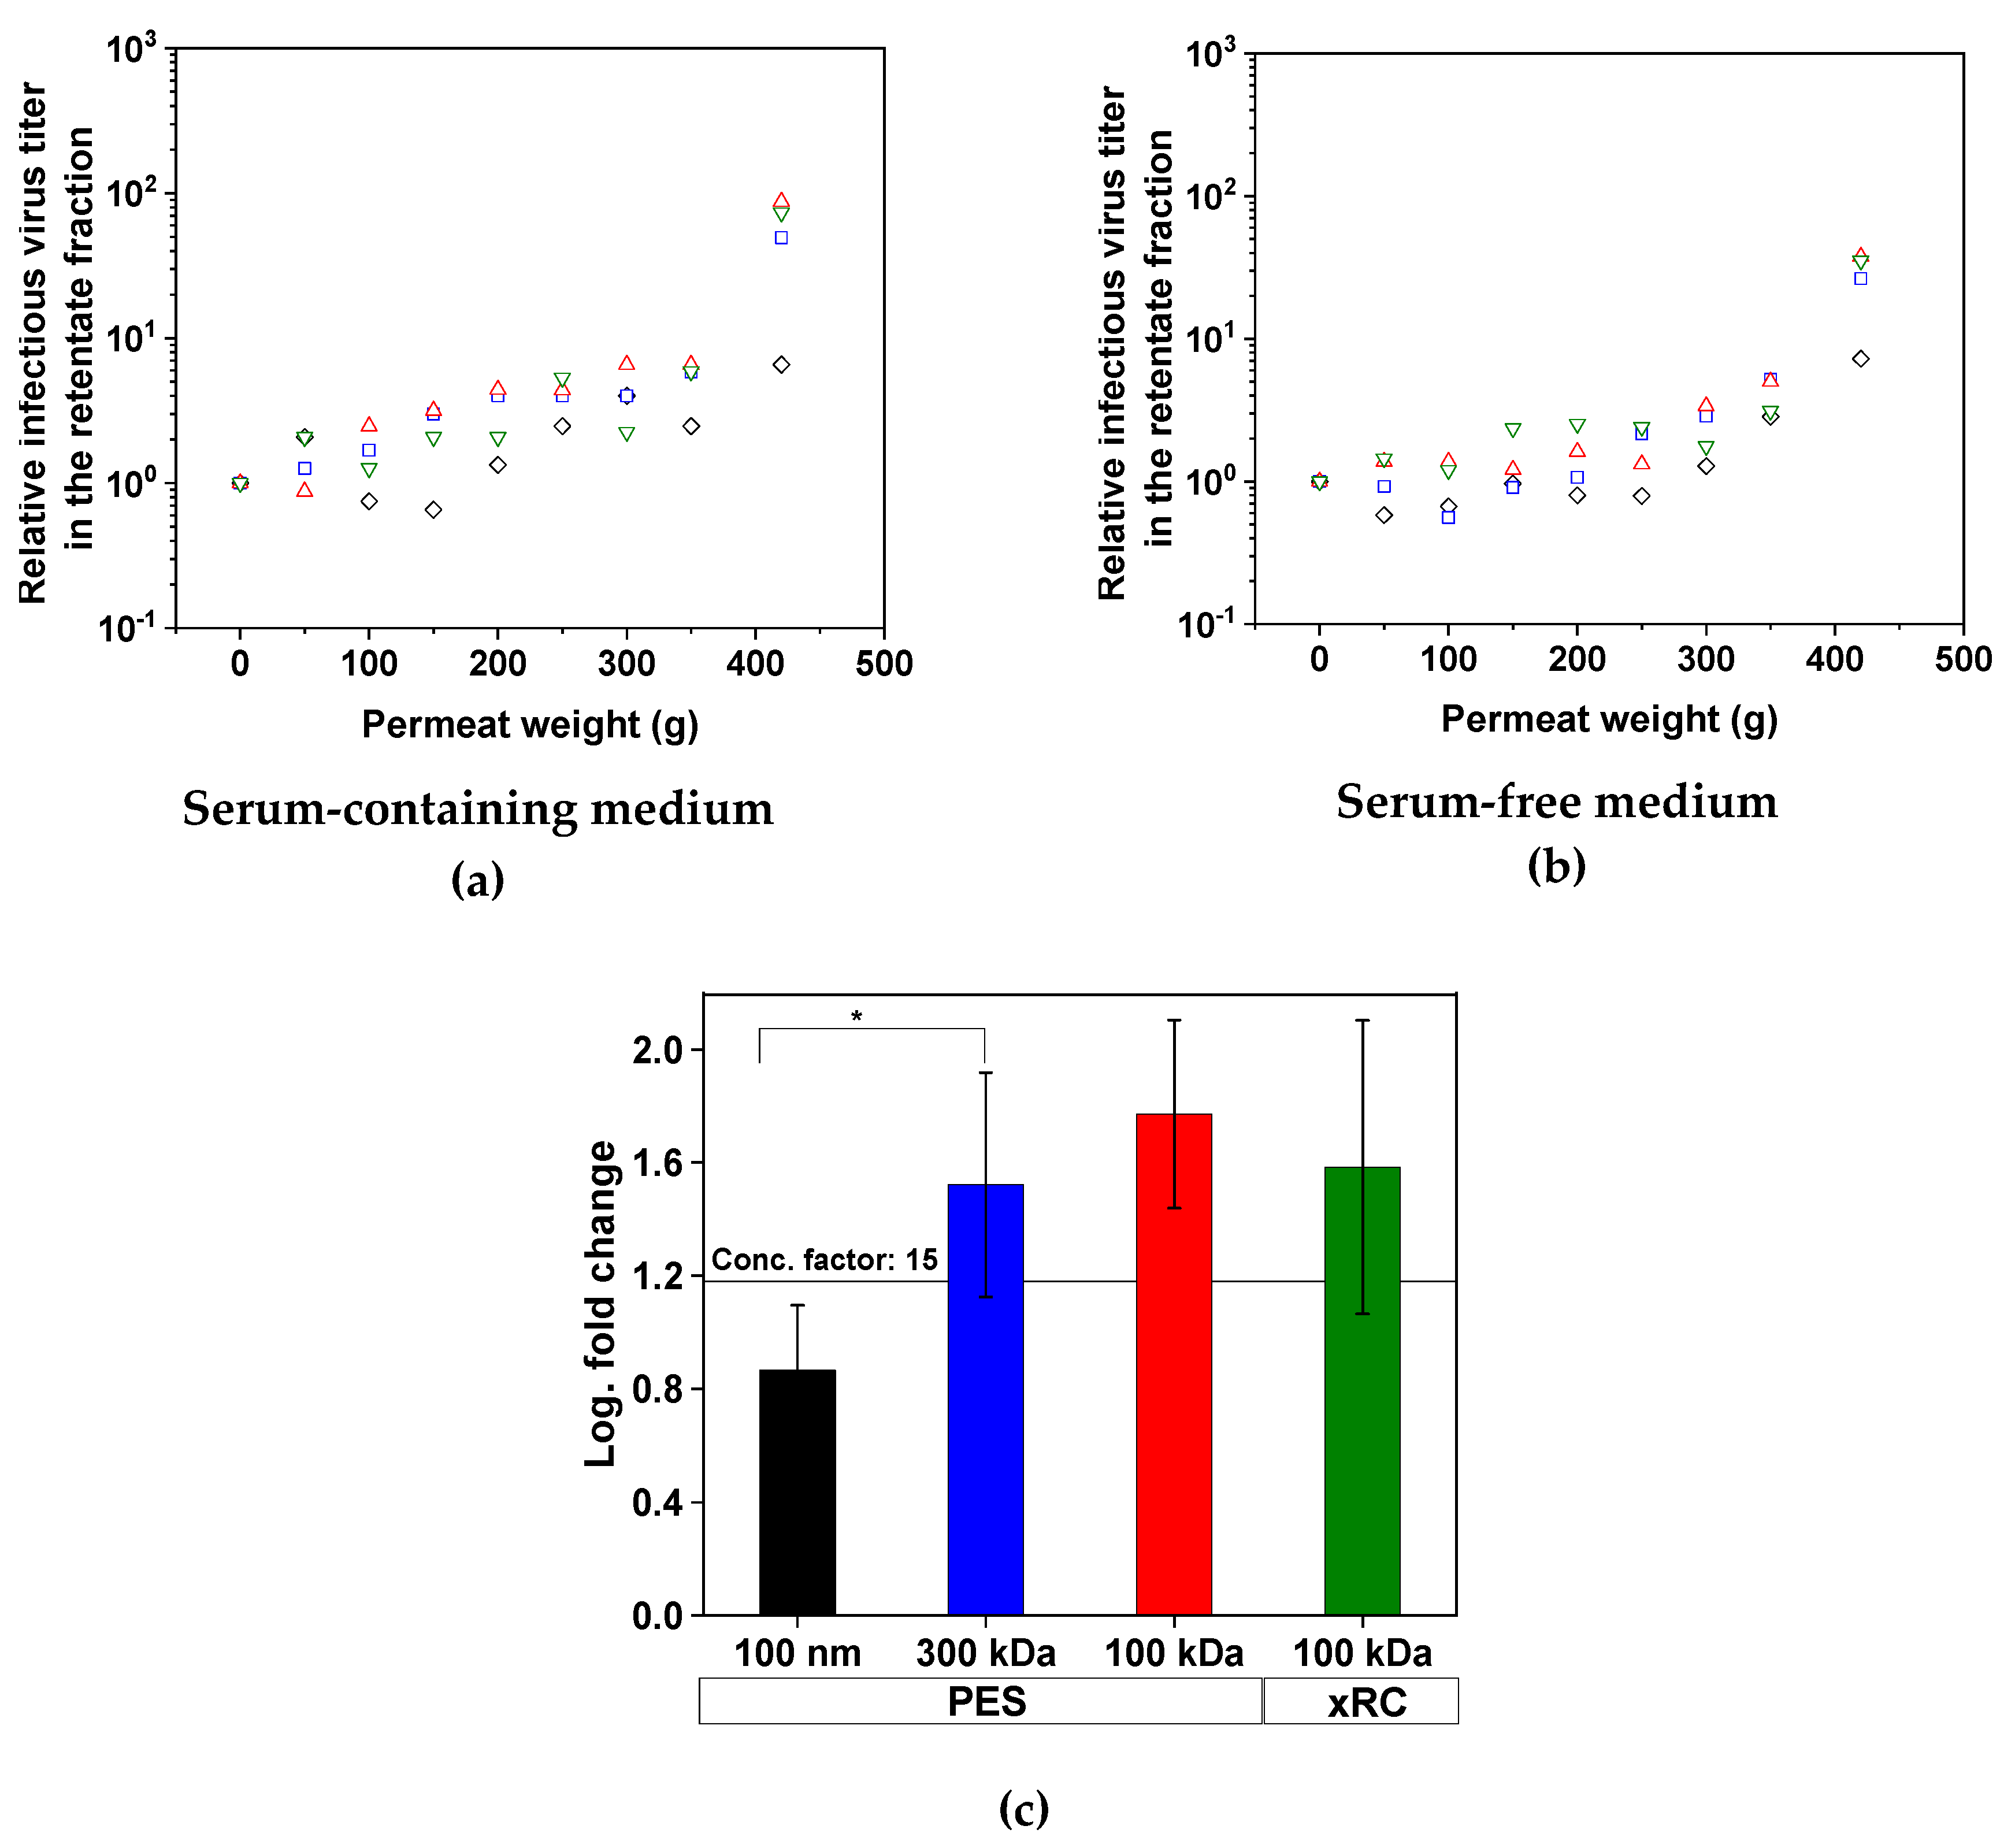
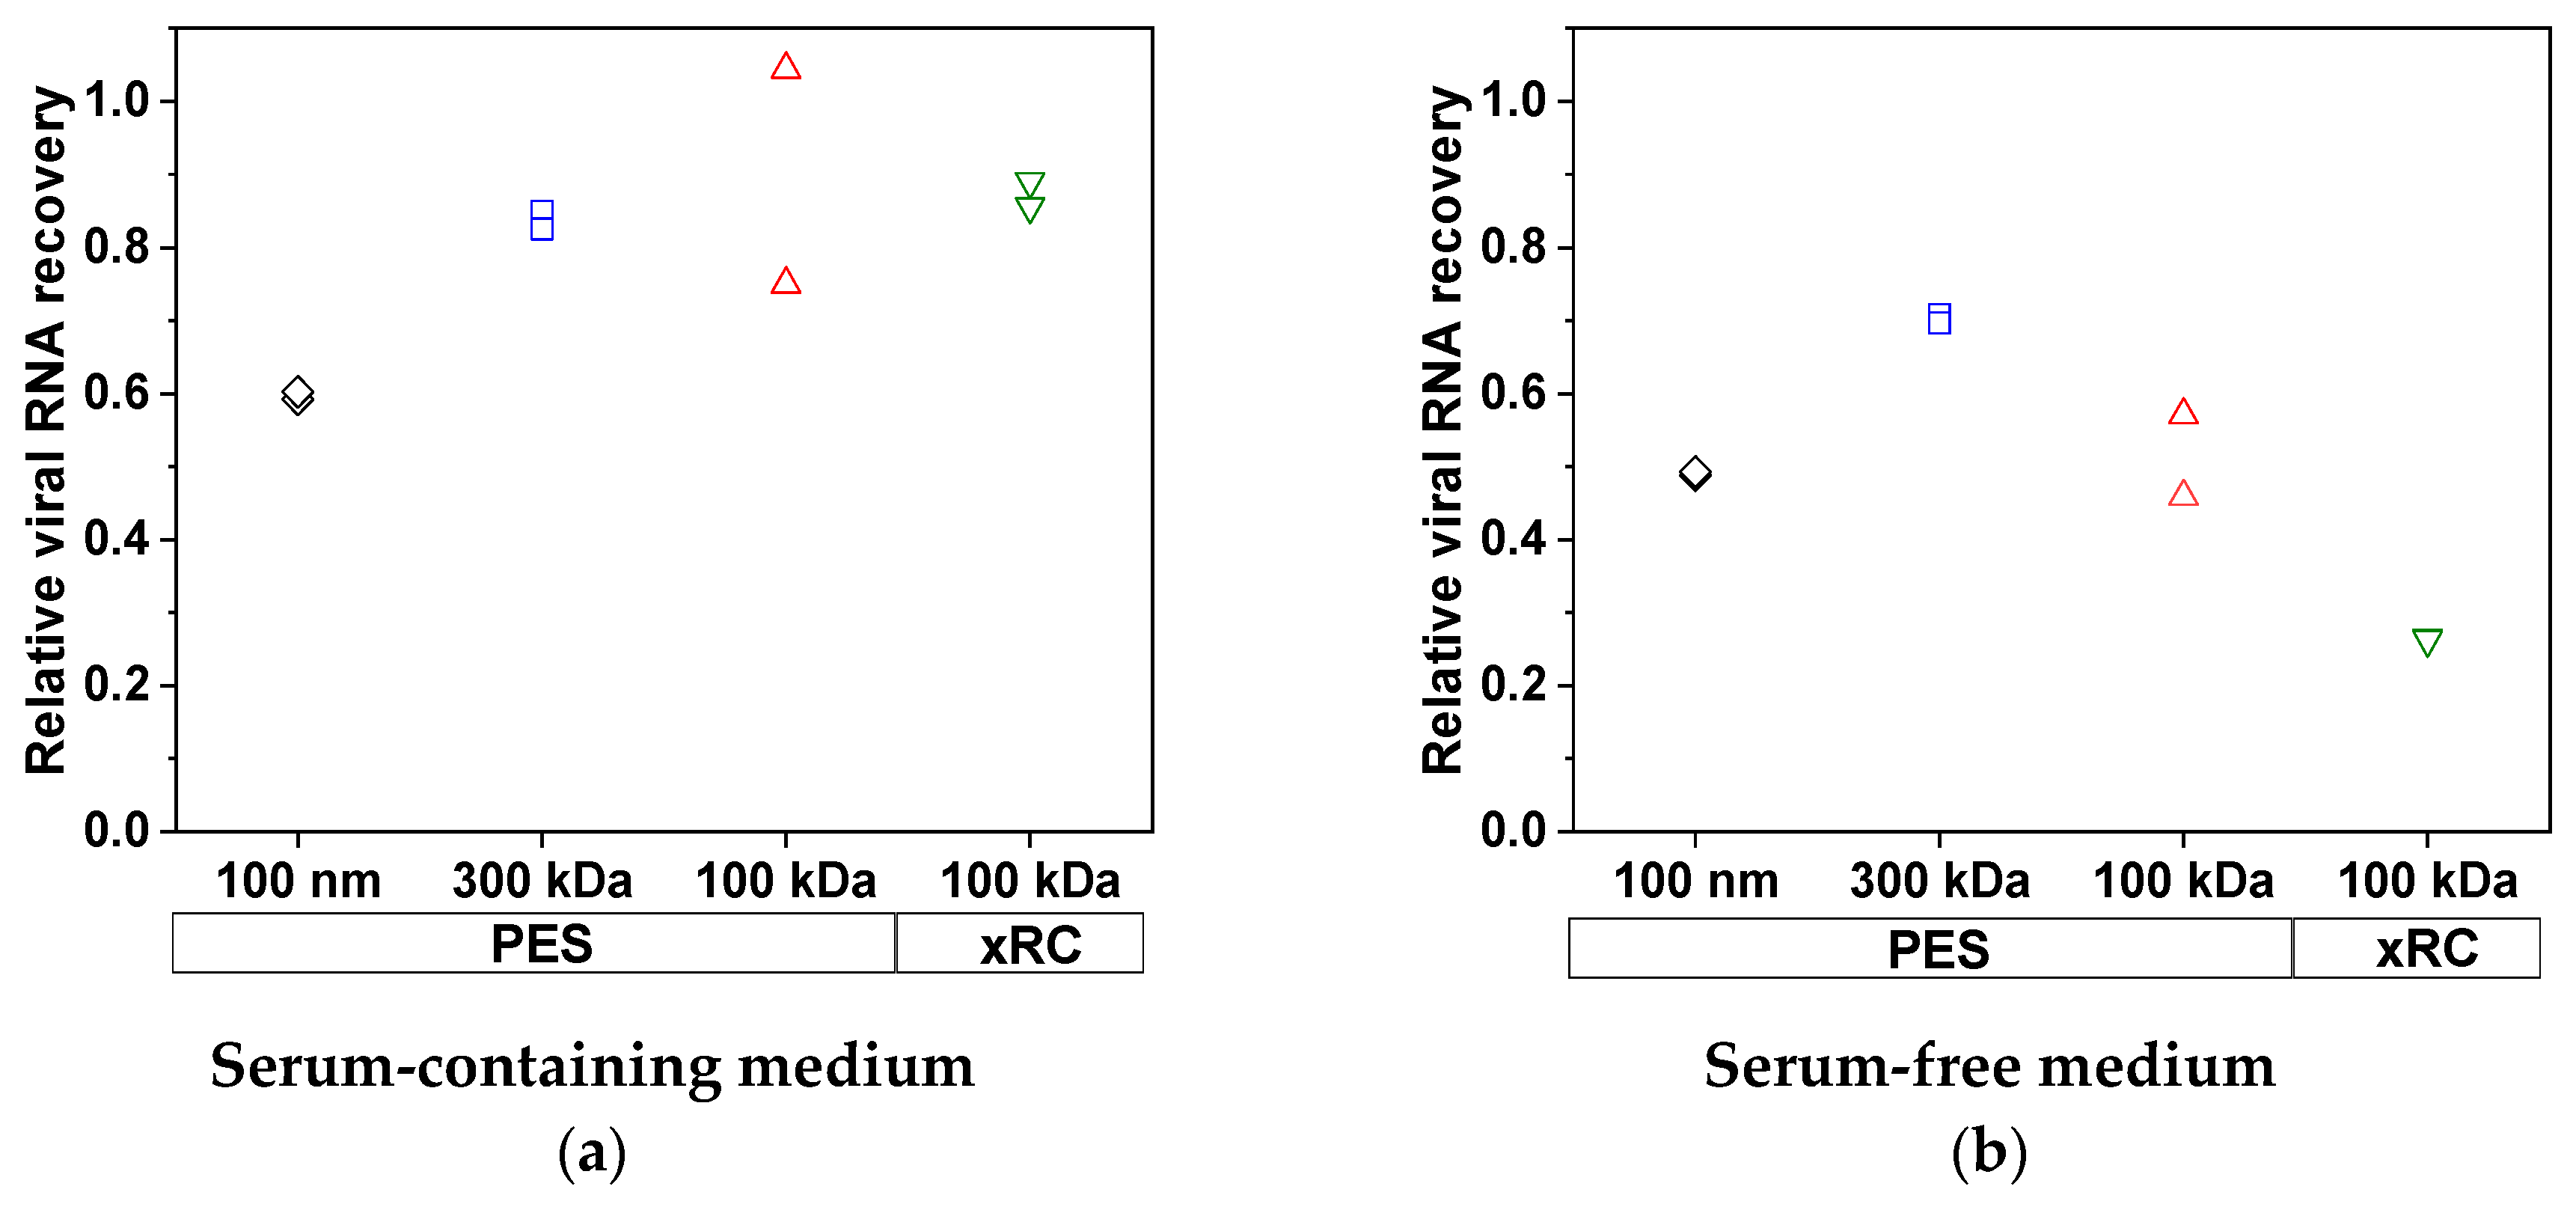
3.2.1. Virus Recovery during TFF
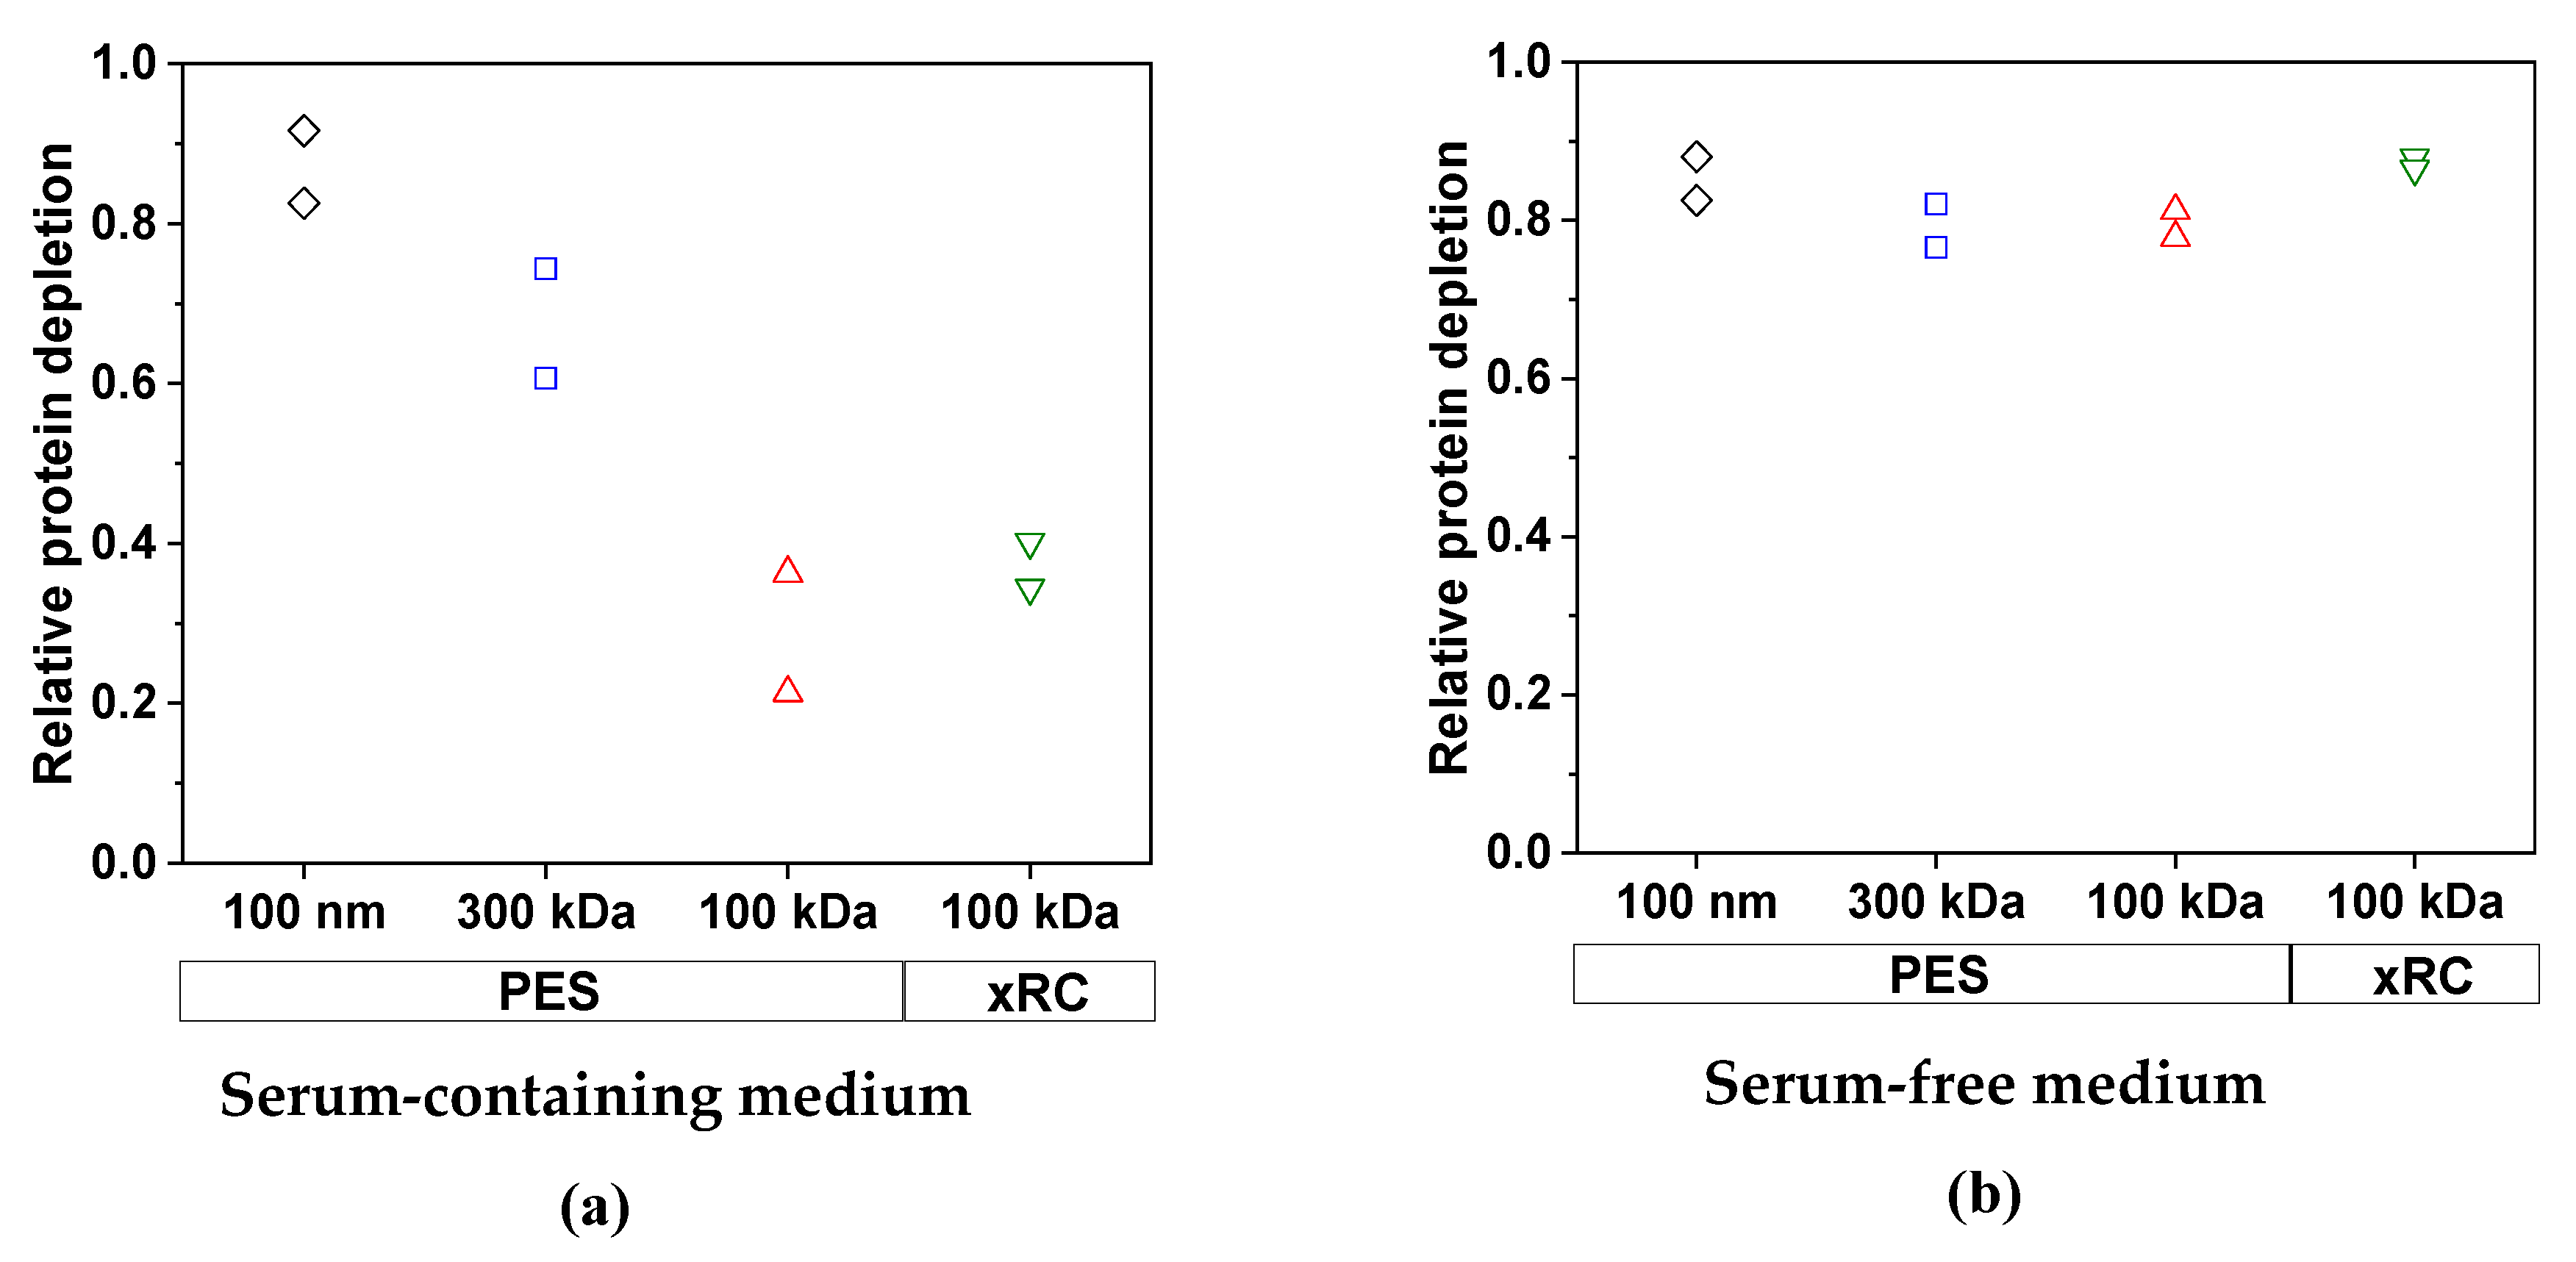
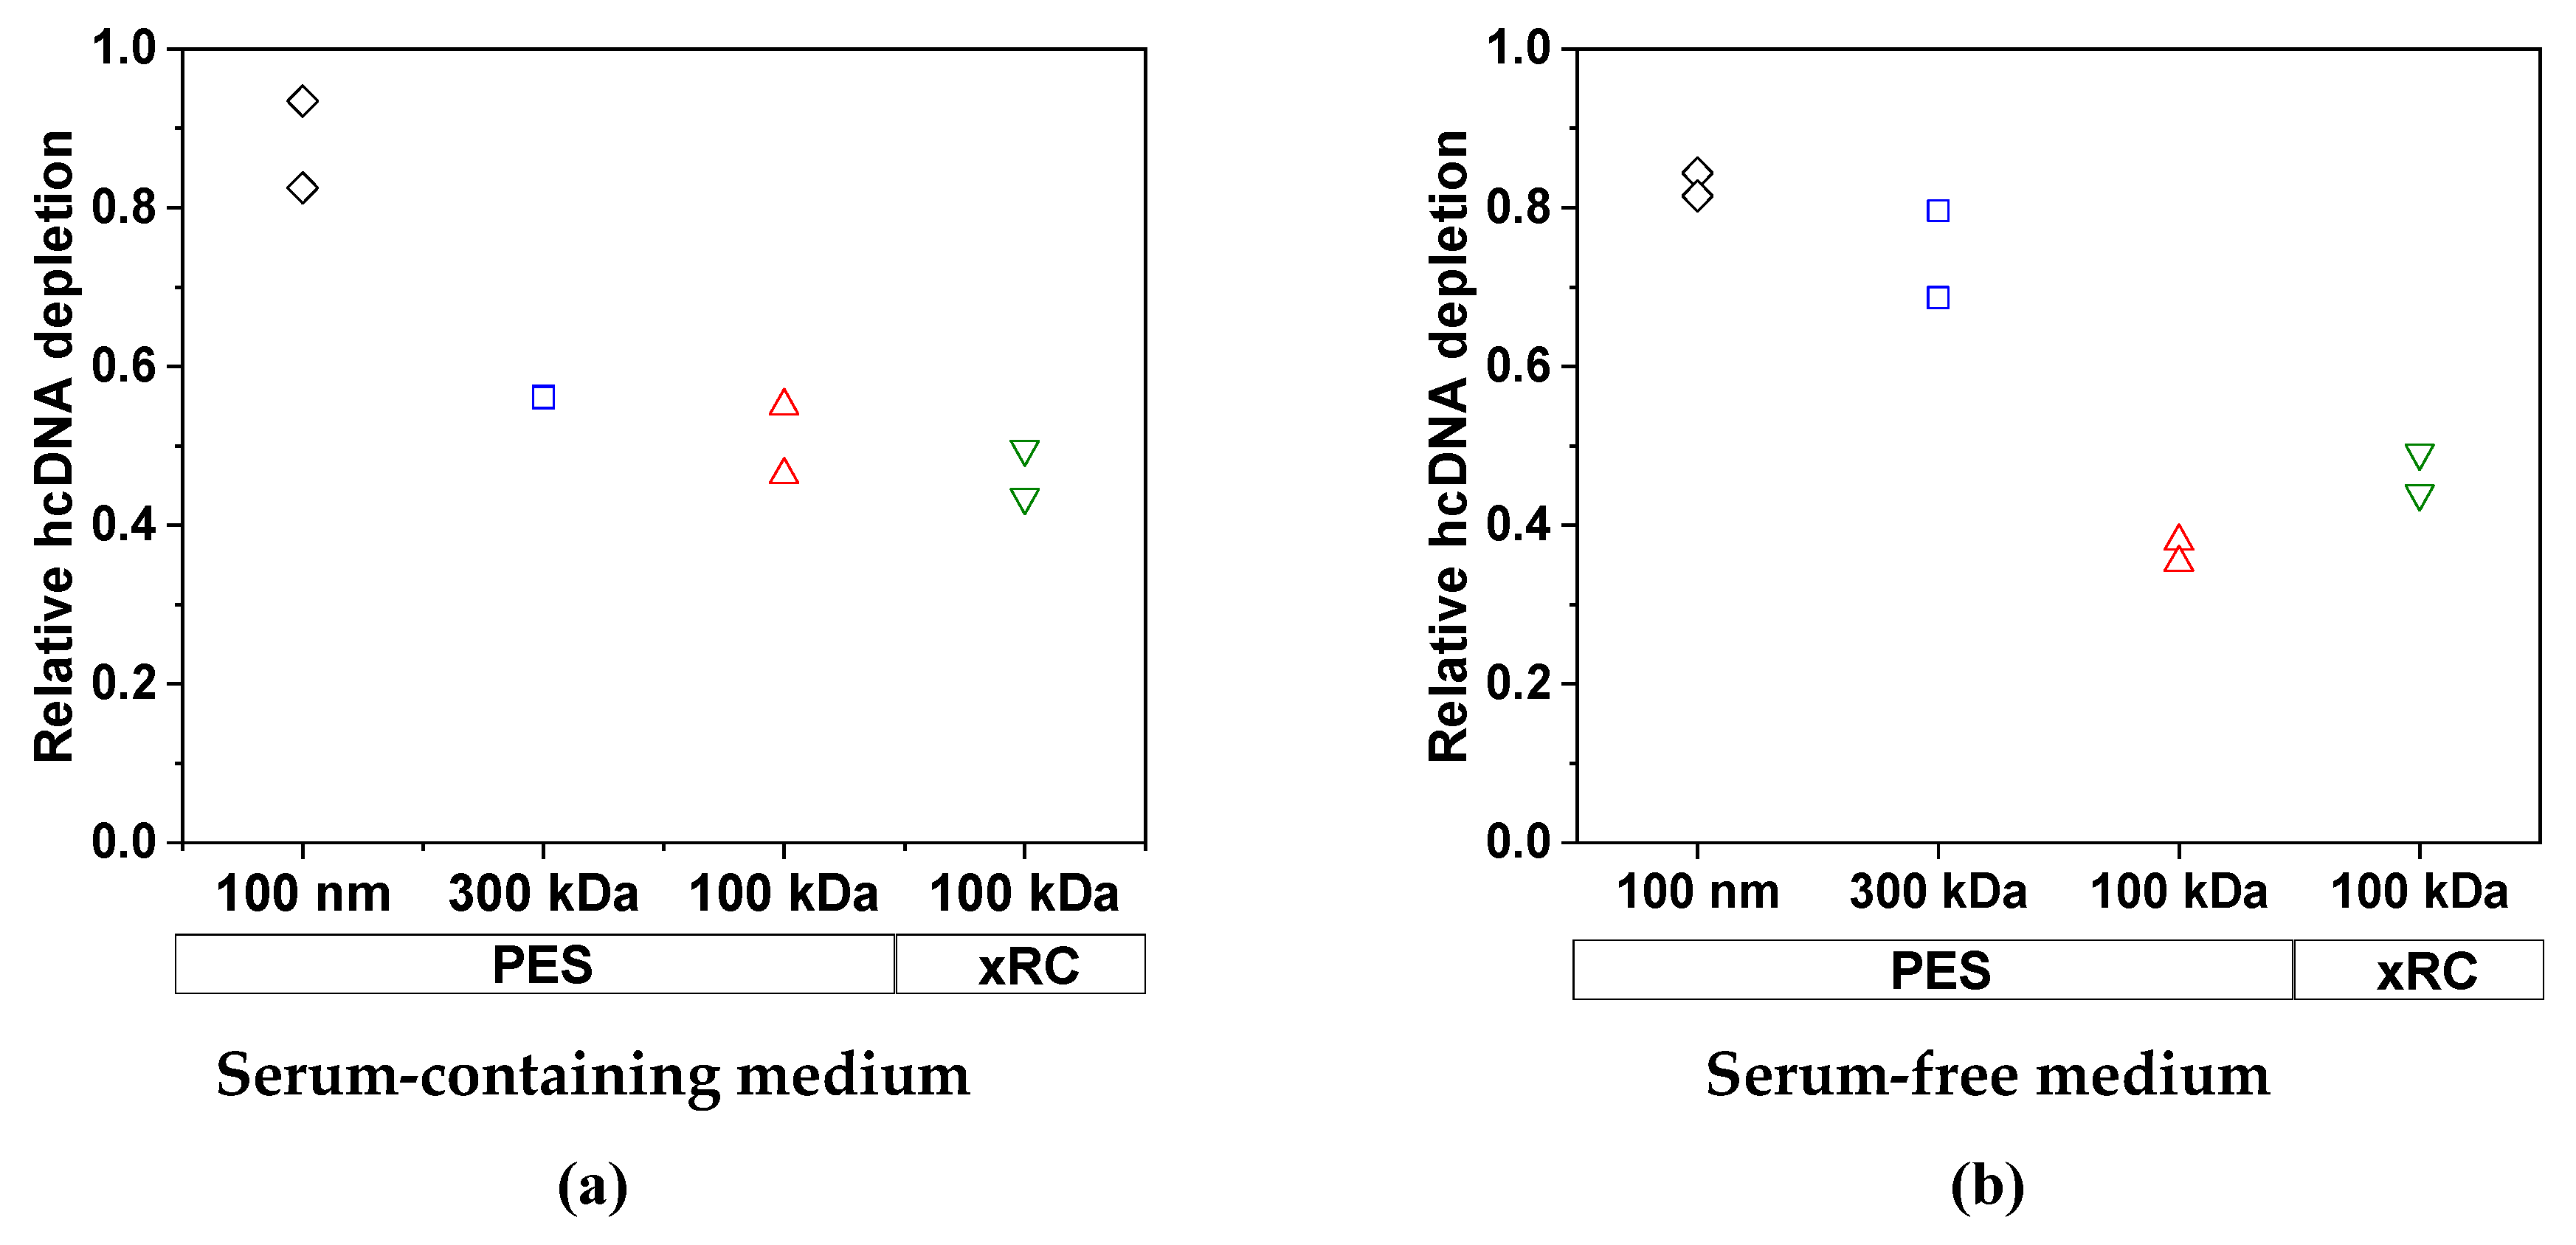
3.2.2. Removal of Impurities by TFF
3.2.3. Characterization of the Concentrated MV Fractions
3.3. Analysis of Membrane Fouling
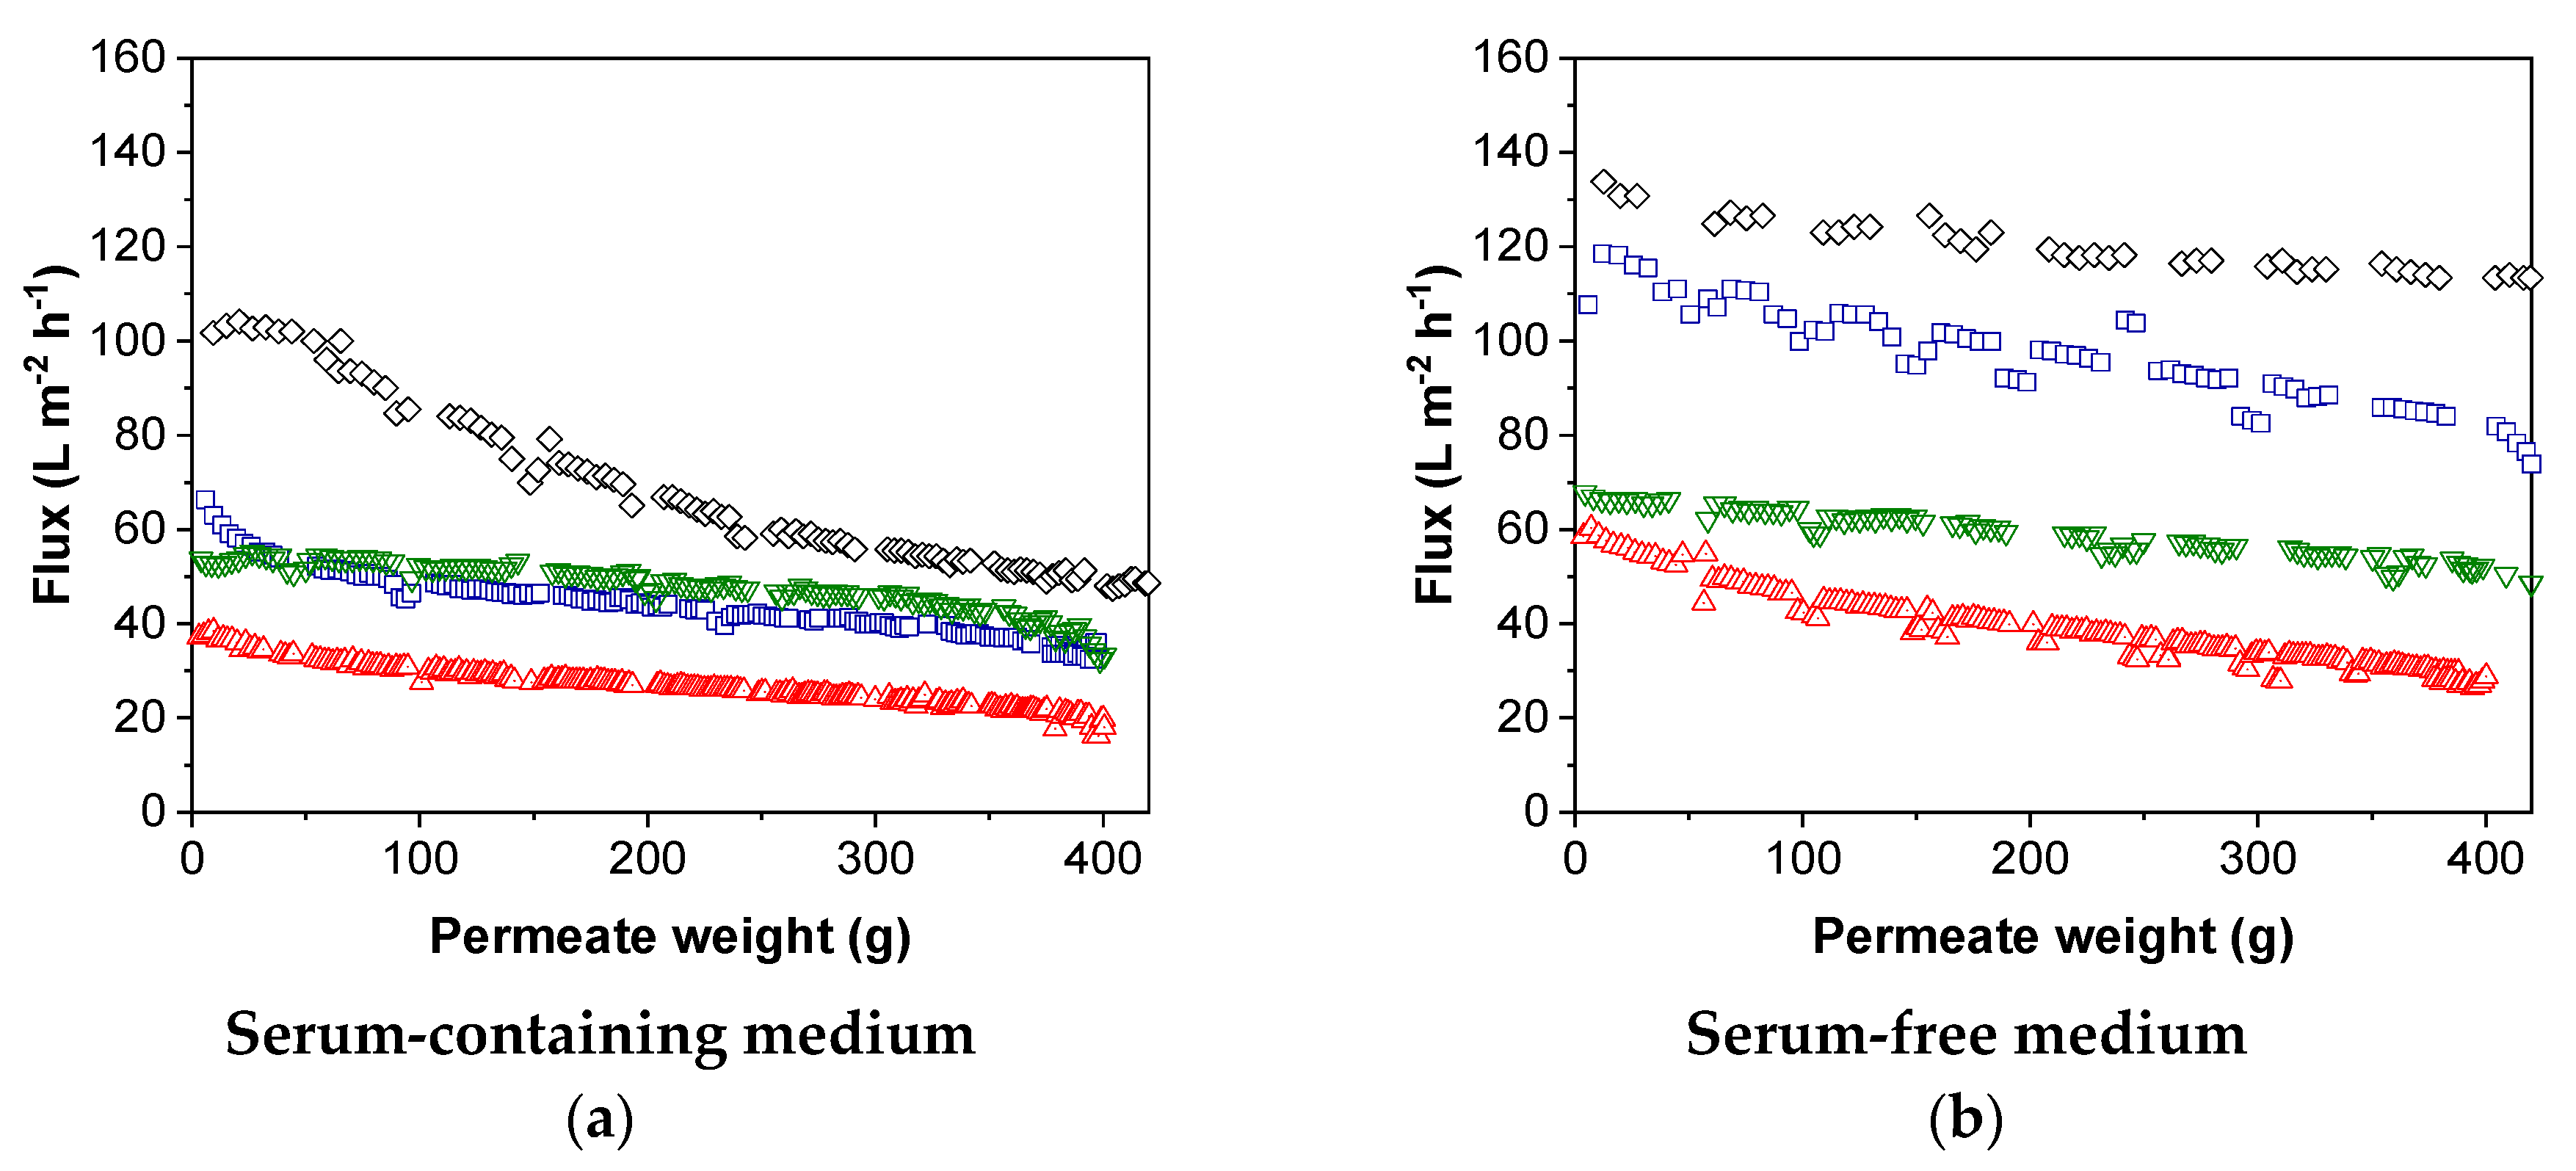
3.3.1. Flux during MV Purification
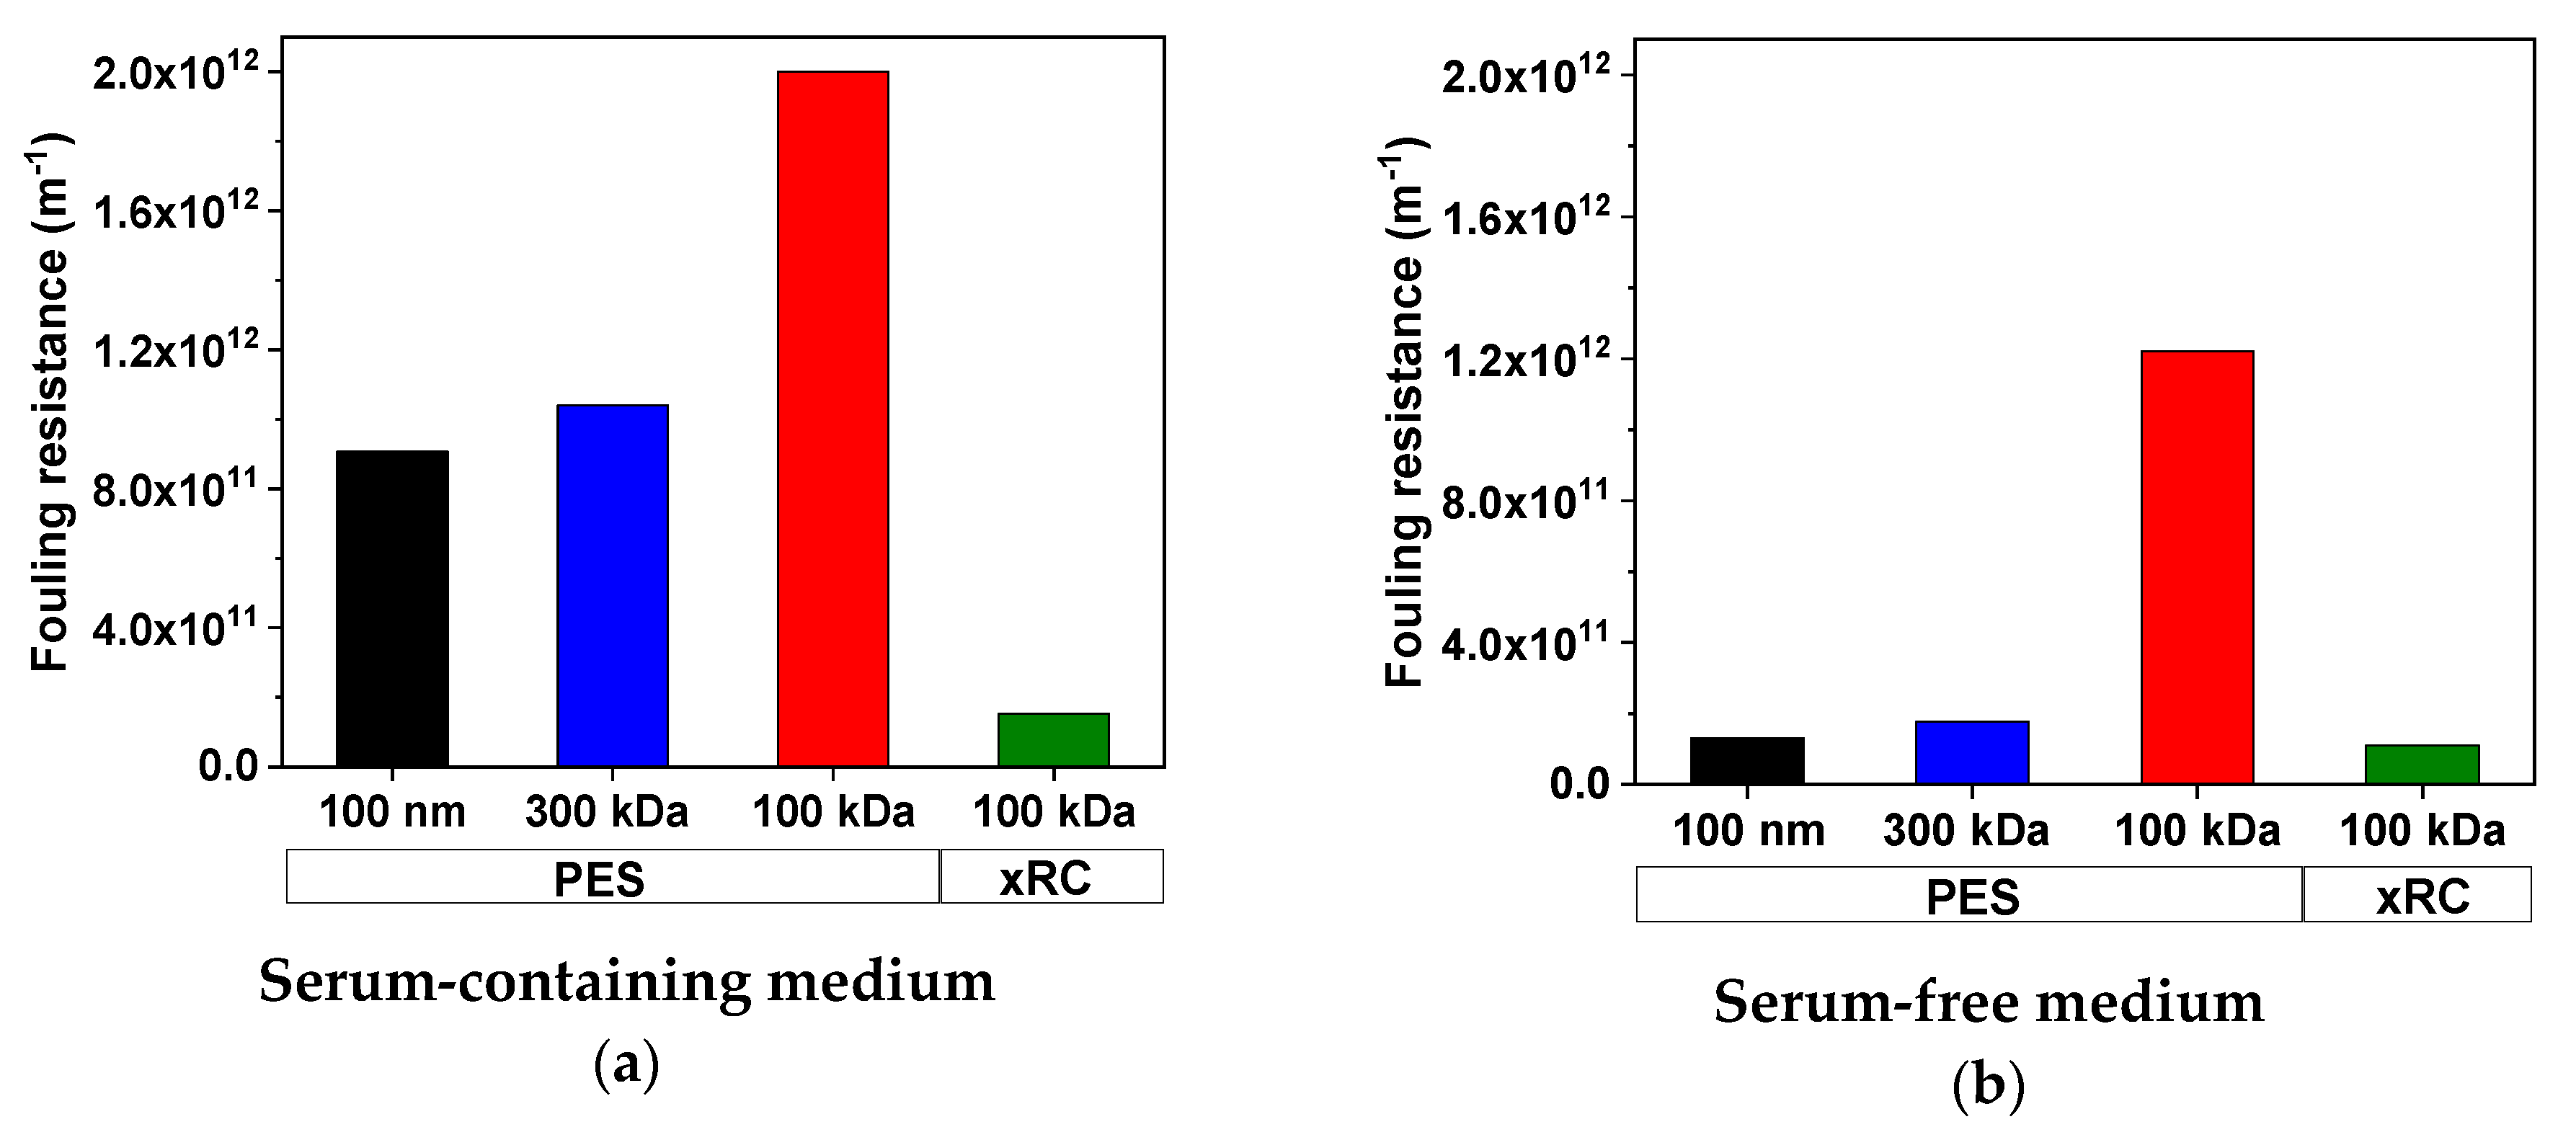
3.3.2. Determination of Fouling Resistance Using the Resistance-in-Series Model
3.3.3. Classification of Fouling Mechanisms
4. Discussion
5. Conclusions
Author Contributions
Funding
Acknowledgments
Conflicts of Interest
Abbreviations
| PES | Polyether sulfone |
| xRC | Cross-linked regenerated cellulose |
| A | Membrane area (m2) |
| V | Permeate volume (m3) |
| t | Time (s) |
| J | Flux (m3 m−2 s−1) |
| µ | Dynamic viscosity (N m−2 s) |
| Feed pressure (Pa) | |
| Retentate pressure (Pa) | |
| Permeate pressure (Pa) | |
| TMP | Transmembrane pressure (Pa) |
| Total membrane resistance (m−1) | |
| Membrane resistance (m−1) | |
| Fouling resistance (m−1) | |
| SCM | Serum-containing medium |
| SFM | Serum free medium, |
| HCP | Host cell proteins |
| hcDNA | Host cell DNA |
| LP | Hydraulic permeability (L m−2 h−1 bar−1) |
| Jw, J0 | Pure water flux (L m−2 h−1) |
| α | Permeability |
| m | Fouling constant (-) |
| k | Resistance coefficient |
| c | Concentration (feed, permeate, retentate) |
| c0 | Initial concentration |
| ci | Concentration at a specific concentration factor (cf) |
| cf | Concentration factor (-) |
| y-value of the model function | |
| y-value of the experimental data | |
| kcf | Fouling constant – cake filtration |
| kib | Fouling constant – intermediate blocking |
| ksb | Fouling constant – standard blocking |
| kcb | Fouling constant – complete blocking |
| Re | Reynolds number (-) |
| SSE | Sum square error |
| Rfit2 | Coefficient of determination |
| MWCO | Molecular weight cut-off (kDa) |
| n.d. | not determined |
Appendix A
References
- Chiocca, E.A.; Rabkin, S.D. Oncolytic viruses and their application to cancer immunotherapy. Cancer Immunol. Res. 2014, 2, 295–300. [Google Scholar] [CrossRef] [PubMed]
- Fielding, A.K. Measles as a potential oncolytic virus. Rev. Med. Virol. 2005, 15, 135–142. [Google Scholar] [CrossRef] [PubMed]
- Russell, S.J.; Whye Peng, K. Measles virus for cancer therapy. Curr. Top. Microbiol. Immunol. 2009, 330, 213–241. [Google Scholar] [PubMed]
- Galanis, E.; Atherton, P.J.; Maurer, M.J.; Knutson, K.L.; Dowdy, S.C.; Cliby, W.A.; Haluska, P.; Long, H.J.; Oberg, A.; Aderca, I.; et al. Oncolytic measles virus expressing the sodium iodide symporter to treat drug-resistant ovarian cancer. Cancer Res. 2015, 75, 22–30. [Google Scholar] [CrossRef]
- Weiss, K.; Gerstenberger, J.; Salzig, D.; Mühlebach, M.D.; Cichutek, K.; Pörtner, R.; Czermak, P. Oncolytic measles viruses produced at different scales under serum-free conditions. Eng. Life Sci. 2015, 15, 425–436. [Google Scholar] [CrossRef]
- Grein, T.A.; Schwebel, F.; Kress, M.; Loewe, D.; Dieken, H.; Salzig, D.; Weidner, T.; Czermak, P. Screening different host cell lines for the dynamic production of measles virus. Biotechnol. Prog. 2017, 33, 989–997. [Google Scholar] [CrossRef]
- Grein, T.A.; Loewe, D.; Dieken, H.; Weidner, T.; Salzig, D.; Czermak, P. Aeration and Shear Stress Are Critical Process Parameters for the Production of Oncolytic Measles Virus. Front. Bioeng. Biotechnol. 2019, 7, 78. [Google Scholar] [CrossRef]
- Grein, T.A.; Loewe, D.; Dieken, H.; Salzig, D.; Weidner, T.; Czermak, P. High titer oncolytic measles virus production process by integration of dielectric spectroscopy as online monitoring system. Biotechnol. Bioeng. 2018, 115, 1186–1194. [Google Scholar] [CrossRef]
- Weiss, K.; Salzig, D.; Röder, Y.; Gerstenberger, J.; Mühlebach, M.D.; Cichutek, K.; Pörtner, R.; Czermak, P. Influence of process conditions on measles virus stability. Am. J. Biochem. Biotechnol. 2013, 9, 243–254. [Google Scholar] [CrossRef]
- Weiss, K.; Salzig, D.; Mühlebach, M.D.; Cichutek, K.; Pörtner, R.; Czermak, P. Key parameters of Measles virus production for oncolytic virotherapy. Am. J. Biochem. Biotechnol. 2012, 8, 81–98. [Google Scholar] [CrossRef]
- Wright, J.F. Product-Related Impurities in Clinical-Grade Recombinant AAV Vectors: Characterization and Risk Assessment. Biomedicines 2014, 2, 80–97. [Google Scholar] [CrossRef] [PubMed]
- Kramberger, P.; Urbas, L.; Štrancar, A. Downstream processing and chromatography based analytical methods for production of vaccines, gene therapy vectors, and bacteriophages. Hum. Vaccines Immunother. 2015, 11, 1010–1021. [Google Scholar] [CrossRef] [PubMed]
- Champion, K.; Madden, H.; Dougherty, J.; Shacter, E. Defining Your Product Profile and Maintaining Control Over It, Part 2: Challenges of Monitoring Host Cell Protein Impurities: Challenges of Monitoring Host Cell Protein Impurities. BioProcess Int. 2005, 3, 52–57. [Google Scholar]
- WHO Expert Committee on Biological Standardization; World Health Organization; Ebrary, Inc. WHO Expert Committee on Biological Standardization; Fifty-Sixth Report; World Health Organization: Geneva, Switzerland, 2007; ISBN 9241209410. [Google Scholar]
- Loughney, J.W.; Lancaster, C.; Ha, S.; Rustandi, R.R. Residual bovine serum albumin (BSA) quantitation in vaccines using automated Capillary Western technology. Anal. Biochem. 2014, 461, 49–56. [Google Scholar] [CrossRef]
- Daikoku, E.; Chizuko, M.; Kohno, T.; Sano, K. Analysis of Morphology and Infectivity of Measles Virus Particles. Bull. Osaka Med Coll. 2007, 53, 107–114. [Google Scholar]
- Loewe, D.; Häussler, J.; Grein, T.A.; Dieken, H.; Weidner, T.; Salzig, D.; Czermak, P. Forced degradation studies to identify critical parameters for Measles virus purification. Viruses 2019, 11, 725. [Google Scholar] [CrossRef]
- Sviben, D.; Forčić, D.; Kurtović, T.; Halassy, B.; Brgles, M. Stability, biophysical properties and effect of ultracentrifugation and diafiltration on measles virus and mumps virus. Arch. Virol. 2016, 161, 1455–1467. [Google Scholar] [CrossRef]
- Udem, A.S. Measles virus: Conditions for the propagation and purification of infectious virus in high yield. J. Virol. Methods 1984, 8, 123–136. [Google Scholar] [CrossRef]
- Bellini, W.J.; Trudgett, A.; McFarlin, D.E. Purification of measles virus with preservation of infectivity and antigenicity. J. Gen. Virol. 1979, 43, 633–639. [Google Scholar] [CrossRef]
- Sviben, D.; Forcic, D.; Ivancic-Jelecki, J.; Halassy, B.; Brgles, M. Recovery of infective virus particles in ion-exchange and hydrophobic interaction monolith chromatography is influenced by particle charge and total-to-infective particle ratio. J. Chromatogr. B Analyt. Technol. Biomed. Life Sci. 2017, 1054, 10–19. [Google Scholar] [CrossRef]
- Michalsky, R.; Passarelli, A.L.; Pfromm, P.H.; Czermak, P. Purification of the baculovirus Autographa californica M nucleopolyhedrovirus by tangential flow ultrafiltration. Desalination 2009, 245, 694–700. [Google Scholar] [CrossRef]
- Wickramasinghe, S.R.; Kalbfuss, B.; Zimmermann, A.; Thom, V.; Reichl, U. Tangential flow microfiltration and ultrafiltration for human influenza A virus concentration and purification. Biotechnol. Bioeng. 2005, 92, 199–208. [Google Scholar] [CrossRef] [PubMed]
- Kalbfuss, B.; Genzel, Y.; Wolff, M.; Zimmermann, A.; Morenweiser, R.; Reichl, U. Harvesting and concentration of human influenza A virus produced in serum-free mammalian cell culture for the production of vaccines. Biotechnol. Bioeng. 2007, 97, 73–85. [Google Scholar] [CrossRef]
- Nehring, D.; Gonzalez, R.; Pörtner, R.; Czermak, P. Experimental and modeling study of a membrane filtration process using ceramic membranes to increase retroviral pseudotype vector titer. J. Membr. Sci. 2004, 237, 25–38. [Google Scholar] [CrossRef]
- Negrete, A.; Pai, A.; Shiloach, J. Use of hollow fiber tangential flow filtration for the recovery and concentration of HIV virus-like particles produced in insect cells. J. Virol. Methods 2014, 195, 240–246. [Google Scholar] [CrossRef] [PubMed]
- Vicente, T.; Peixoto, C.; Carrondo, M.J.T.; Alves, P.M. Purification of recombinant baculoviruses for gene therapy using membrane processes. Gene Ther. 2009, 16, 766–775. [Google Scholar] [CrossRef]
- Grein, T.A.; Michalsky, R.; Czermak, P. Virus separation using membranes. Methods Mol. Biol. 2014, 1104, 459–491. [Google Scholar] [CrossRef]
- Maiorella, B.; Dorin, G.; Carion, A.; Harano, D. Crossflow microfiltration of animal cells. Biotechnol. Bioeng. 1991, 37, 121–126. [Google Scholar] [CrossRef]
- Nestola, P.; Martins, D.L.; Peixoto, C.; Roederstein, S.; Schleuss, T.; Alves, P.M.; Mota, J.P.B.; Carrondo, M.J.T. Evaluation of novel large cut-off ultrafiltration membranes for adenovirus serotype 5 (Ad5) concentration. PLoS ONE 2014, 9, e115802. [Google Scholar] [CrossRef]
- Peixoto, C.; Sousa, M.F.Q.; Silva, A.C.; Carrondo, M.J.T.; Alves, P.M. Downstream processing of triple layered rotavirus like particles. J. Biotechnol. 2007, 127, 452–461. [Google Scholar] [CrossRef]
- Opdensteinen, P.; Clodt, J.I.; Müschen, C.R.; Filiz, V.; Buyel, J.F. A Combined Ultrafiltration/Diafiltration Step Facilitates the Purification of Cyanovirin-N from Transgenic Tobacco Extracts. Front. Bioeng. Biotechnol. 2018, 6, 206. [Google Scholar] [CrossRef] [PubMed]
- Czermak, P.; Grzenia, D.L.; Wolf, A.; Carlson, J.O.; Specht, R.; Han, B.; Wickramasinghe, S.R. Purification of the densonucleosis virus by tangential flow ultrafiltration and by ion exchange membranes. Desalination 2008, 224, 23–27. [Google Scholar] [CrossRef]
- Hensgen, M.I.; Czermak, P.; Carlson, J.O.; Wickramasinghe, S.R. Purification of Minute Virus of Mice using high performance tangential flow filtration. Desalination 2010, 250, 1121–1124. [Google Scholar] [CrossRef] [Green Version]
- Hermia, J. Constant pressure blocking filtration laws—Application to power-law non-Newtonian fluids. Chem. Eng. Res. Des. 1982, 60, 183–187. [Google Scholar]
- Kärber, G. Beitrag zur kollektiven Behandlung pharmakologischer Reihenversuche. Arch. Exp. Pathol. Pharmakol. 1931, 162, 480–483. [Google Scholar] [CrossRef]
- Reed, L.J.; Muench, H. A simple method of estimating fifty per cent endpoints. Am. J. Epidemiol. 1938, 27, 493–497. [Google Scholar] [CrossRef]
- Baekelandt, V.; Eggermont, K.; Michiels, M.; Nuttin, B.; Debyser, Z. Optimized lentiviral vector production and purification procedure prevents immune response after transduction of mouse brain. Gene Ther. 2003, 10, 1933–1940. [Google Scholar] [CrossRef] [Green Version]
- Rodrigues, T.; Carrondo, M.J.T.; Alves, P.M.; Cruz, P.E. Purification of retroviral vectors for clinical application: Biological implications and technological challenges. J. Biotechnol. 2007, 127, 520–541. [Google Scholar] [CrossRef]
- Tuschong, L.; Soenen, S.L.; Blaese, R.M.; Candotti, F.; Muul, L.M. Immune response to fetal calf serum by two adenosine deaminase-deficient patients after T cell gene therapy. Hum. Gene Ther. 2002, 13, 1605–1610. [Google Scholar] [CrossRef]
- Carvalho, S.B.; Silva, R.J.S.; Moleirinho, M.G.; Cunha, B.; Moreira, A.S.; Xenopoulos, A.; Alves, P.M.; Carrondo, M.J.T.; Peixoto, C. Membrane-Based Approach for the Downstream Processing of Influenza Virus-Like Particles. Biotechnol. J. 2019, 14, e1800570. [Google Scholar] [CrossRef]
- Mundle, S.T.; Giel-Moloney, M.; Kleanthous, H.; Pugachev, K.V.; Anderson, S.F. Preparation of pure, high titer, pseudoinfectious Flavivirus particles by hollow fiber tangential flow filtration and anion exchange chromatography. Vaccine 2015, 33, 4255–4260. [Google Scholar] [CrossRef] [PubMed]
- Nayak, D.P.; Lehmann, S.; Reichl, U. Downstream processing of MDCK cell-derived equine influenza virus. J. Chromatogr. B Analyt. Technol. Biomed. Life Sci. 2005, 823, 75–81. [Google Scholar] [CrossRef] [PubMed]
- Bandeira, V.; Peixoto, C.; Rodrigues, A.F.; Cruz, P.E.; Alves, P.M.; Coroadinha, A.S.; Carrondo, M.J.T. Downstream processing of lentiviral vectors: Releasing bottlenecks. Hum. Gene Ther. Methods 2012, 23, 255–263. [Google Scholar] [CrossRef] [PubMed] [Green Version]
- Grzenia, D.L.; Carlson, J.O.; Czermak, P.; Han, B.; Specht, R.K.; Wickramasinghe, S.R. Purification of densonucleosis virus by tangential flow ultrafiltration. Biotechnol. Prog. 2006, 22, 1346–1353. [Google Scholar] [CrossRef] [PubMed]


| m | Fouling Mechanism | Flux Decline Equation |
|---|---|---|
| 0 | Cake filtration | |
| 1 | Intermediate blocking | |
| 1.5 | Pore blocking | |
| 2 | Complete blocking |
| Measles Virus In: | Virus Titer (TCID50 mL−1) | Total Viral RNA (Copies mL−1) | RT/I (Copies/TCID50) | Proteins (µg mL−1) | DNA (ng mL−1) |
|---|---|---|---|---|---|
| Serum-containing medium (SCM) | 3.6 × 10⁴ ± 1.6 × 10⁴ | 6.5 × 10⁸ ± 7.4 × 10⁷ | 1.8 × 10⁴ | 4436.7 ± 623.7 | 137.9 ± 7.8 |
| Serum-free medium (SFM) | 1.0 × 10⁵ ± 4.0 × 10⁴ | 4.7 × 10⁹ ± 2.4 × 10⁹ | 4.6 × 10⁴ | 570.1 ± 78.3 | 144.9 ± 19.5 |
| MV in | Permeability for Total Proteins | |||
|---|---|---|---|---|
| PES | xRC | |||
| 100 nm | 300 kDa | 100 kDa | 100 kDa | |
| SCM | 0.97 | 0.56 | 0.35 | 0.54 |
| SFM | 1.00 | 1.00 | 1.00 | 1.00 |
| MV in: | Permeability of hcDNA | |||
|---|---|---|---|---|
| PES | xRC | |||
| 100 nm | 300 kDa | 100 kDa | 100 kDa | |
| SCM | 0.87 | 0.51 | 0.24 | 0.36 |
| SFM | 0.81 | 0.75 | 0.36 | 0.53 |
| Measles Virus in | Virus Titer (TCID50 mL−1) | Total Viral RNA (Copies mL−1) | RT/I (Copies/TCID50) | Proteins (mg mL−1) | DNA (ng mL−1) |
|---|---|---|---|---|---|
| SCM | |||||
| 100 nm | 1.9 × 10⁵ | 5.8 × 10⁹ | 3.1 × 10⁴ | 7.3 | 243.0 |
| 300 kDa | 2.4 × 10⁶ | 8.2 × 10⁹ | 3.3 × 10³ | 23.1 | 896.7 |
| 100 kDa (PES) | 2.9 × 10⁶ | 8.7 × 10⁹ | 3.0 × 10³ | 46.1 | 1045.7 |
| 100 kDa (xRC) | 2.1 × 10⁶ | 8.5 × 10⁹ | 4.1 × 10³ | 42.4 | 1127.1 |
| SFM | |||||
| 100 nm | 8.2 × 10⁵ | 2.4 × 10¹⁰ | 2.9 × 10⁴ | 1.1 | 346.6 |
| 300 kDa | 2.9 × 10⁶ | 4.2 × 10¹⁰ | 1.4 × 10⁴ | 1.7 | 494.9 |
| 100 kDa (PES) | 4.2 × 10⁶ | 2.9 × 10¹⁰ | 6.8 × 10³ | 1.8 | 1547.9 |
| 100 kDa (xRC) | 3.9 × 10⁶ | 1.6 × 10¹⁰ | 4.0 × 10³ | 1.3 | 1229.8 |
| MV in: | Productivity (L m−2 h−1) | |||
|---|---|---|---|---|
| PES | xRC | |||
| 100 nm | 300 kDa | 100 kDa | 100 kDa | |
| SCM | 66.6 | 44.4 | 27.6 | 50.1 |
| SFM | 134.7 | 95.7 | 40.8 | 59.9 |
| Measles Virus in | 100 nm/300 kDa (mPa s) | 100 kDa (PES/xRC) (mPa s) | Pure Water (mPa s) |
|---|---|---|---|
| SCM | 1.29 ± 0.05 | 1.11 ± 0.06 | 0.96 ± 0.02 |
| SFM | 1.03 ± 0.01 | ||
| MV in | Relative Water Flux after Filtration | |||
|---|---|---|---|---|
| PES | xRC | |||
| 100 nm | 300 kDa | 100 kDa | 100 kDa | |
| SCM | 0.60 | 0.53 | 0.45 | 0.90 |
| SFM | 0.89 | 0.86 | 0.59 | 0.94 |
| Material | Cut-Off | Cake Filtration | Intermediate Blocking | Pore Blocking | Complete Blocking | ||||
|---|---|---|---|---|---|---|---|---|---|
| SCM | SFM | SCM | SFM | SCM | SFM | SCM | SFM | ||
| PES | 100 nm | 0.98 | n.d. | 0.98 | n.d. | 0.97 | n.d. | 0.95 | n.d. |
| 300 kDa | 0.96 | n.d. | 0.95 | n.d. | 0.95 | n.d. | 0.94 | n.d. | |
| 100 kDa | 0.97 | 0.98 | 0.96 | 0.98 | 0.96 | 0.97 | 0.95 | 0.96 | |
© 2019 by the authors. Licensee MDPI, Basel, Switzerland. This article is an open access article distributed under the terms and conditions of the Creative Commons Attribution (CC BY) license (http://creativecommons.org/licenses/by/4.0/).
Share and Cite
Loewe, D.; Grein, T.A.; Dieken, H.; Weidner, T.; Salzig, D.; Czermak, P. Tangential Flow Filtration for the Concentration of Oncolytic Measles Virus: The Influence of Filter Properties and the Cell Culture Medium. Membranes 2019, 9, 160. https://doi.org/10.3390/membranes9120160
Loewe D, Grein TA, Dieken H, Weidner T, Salzig D, Czermak P. Tangential Flow Filtration for the Concentration of Oncolytic Measles Virus: The Influence of Filter Properties and the Cell Culture Medium. Membranes. 2019; 9(12):160. https://doi.org/10.3390/membranes9120160
Chicago/Turabian StyleLoewe, Daniel, Tanja A. Grein, Hauke Dieken, Tobias Weidner, Denise Salzig, and Peter Czermak. 2019. "Tangential Flow Filtration for the Concentration of Oncolytic Measles Virus: The Influence of Filter Properties and the Cell Culture Medium" Membranes 9, no. 12: 160. https://doi.org/10.3390/membranes9120160