1. Introduction
Since the beginning of the 1980s it has been well known that membrane distillation (MD) for aqueous solutions can operate with membrane contactors (MC) containing hydrophobic macroporous membranes [
1,
2]. Membranes are required with an average pore diameter in the range from 20 to 200 nm, manufactured with hydrophobic materials able to guarantee minimum liquid entry pressure (
LEPmin) values at room temperature not lower than nearly 1 bar, to have a safety margin for industrial applications at higher temperatures. Membranes with the smallest thickness as possible are recommended in order to increase the diffusion rate across the membrane.
Recently, there has been a growing interest among the scientific community in the application of ceramic membranes for MD, owing to their high thermal and chemical stability; such materials might give greater morphological stability than polymeric membranes over time [
3].
Ceramic membranes are typically asymmetrical, formed by the deposition of different layers made of γ-alumina and/or titania and/or zirconia and/or silica or a combination of them. The main drawback for their application in MD is their hydrophilicity; it can be circumvented by the modification of the top layer by polymer grafting (generally fluoroalkylsilanes) and/or carbonization techniques. Patents [
4,
5] and many papers document innovations and advances in the hydrophobization of ceramic membranes, both in the shape of flat samples and of hollow fibers; the most representative documentation of the state-of-the-art is given by [
6,
7,
8,
9,
10,
11,
12,
13,
14,
15,
16,
17,
18].
Typically, in each paper, authors introduce their own manufacturing procedure, both of the basic ceramic membrane and of the grafting procedure, and present results on the characterization of the membrane material (scanning electron microscope (SEM) pictures, contact angle, mercury porosimetry, thermogravimetric analysis (TGA), gas permeation tests, liquid entry pressure (LEP) with water at room temperature, and/or gas-liquid displacement tests). Sometimes the characterization is extended to the measurement of water flux across the membrane performed in one of the MD operation modes; however, of the case study, no process simulation nor the corresponding mathematical modeling nor the final comparison with the experimental results are reported.
Since the possibility of manufacturing hydrophobic ceramic membranes is well-established, nowadays it is important to understand which characterization techniques are fundamental to assess firstly the process applicability of a membrane and, secondly, to define the separation efficiency of a module.
The process applicability of a membrane can be tested by the
LEPmin measurement performed in a wide range of operating temperatures, or by the minimum liquid entry temperature measurement performed in a wide range of differential pressures across the membrane. The normalized-flooding-curve method, recently presented and discussed by Varela-Corredor and Bandini in [
19] and properly developed for ceramic membranes, can be followed.
The separation efficiency of a module can be predicted by good process simulation.
Obviously, the process principle in the case of ceramic membranes is exactly the same as in the case of polymeric ones. As far as the pressure difference across the membrane does not overcome the breakthrough pressure (
LEPmin), a liquid-vapor interface is immobilized at the pore mouth. The liquid vaporizes and vapors diffuse across the membrane under a driving force of partial pressure difference, which is strictly related to the gradient of the main operation variable (an activity gradient and/or a pressure gradient, as an example [
1,
2]). When asymmetric multilayer ceramic membranes are used, the liquid–vapor interface should be located on the top layer of the membrane (the lower pore size layer), and diffusion occurs across all the different layers of the membrane.
Therefore, we can expect that the equations describing the mass transfer across the ceramic membrane are the same as in symmetric polymeric membranes, with the complication that they should be discretized for each layer and properly combined to calculate the overall mass transfer coefficient of the membrane.
The main features of the mass transfer equations have been known since the end of the last century [
20,
21,
22,
23,
24,
25,
26]; a review of MD modeling in polymeric membranes has recently been reported in [
2]. In order to calculate the mass transfer coefficient of the membrane, all the equations require knowledge of a few morphological parameters, such as the thickness and the porosity–tortuosity ratio. Those parameters are not adjustable parameters, since they can be determined independently of flux measurements in MD operations. Typically, in symmetrical polymeric membranes, they are calculated by elaborating gas permeation data according to the dusty gas model (DGM) equations, whereas for polymeric asymmetrical membranes the same method can be used to obtain information on the skin morphology (details in chapter 8 of [
2]). In [
27] an improved method was developed for asymmetrical polyvinylidene fluoride (PVDF) membranes, later applied by the same authors to the characterization of ceramic membranes also [
10,
11], to obtain averaged parameters over the entire membrane. Only Weyd et al. [
28] performed the characterization of multilayer membranes according to a “layer-by-layer” technique, which allowed morphological parameters of each single layer to be obtained by the elaboration of gas permeation data according to the DGM.
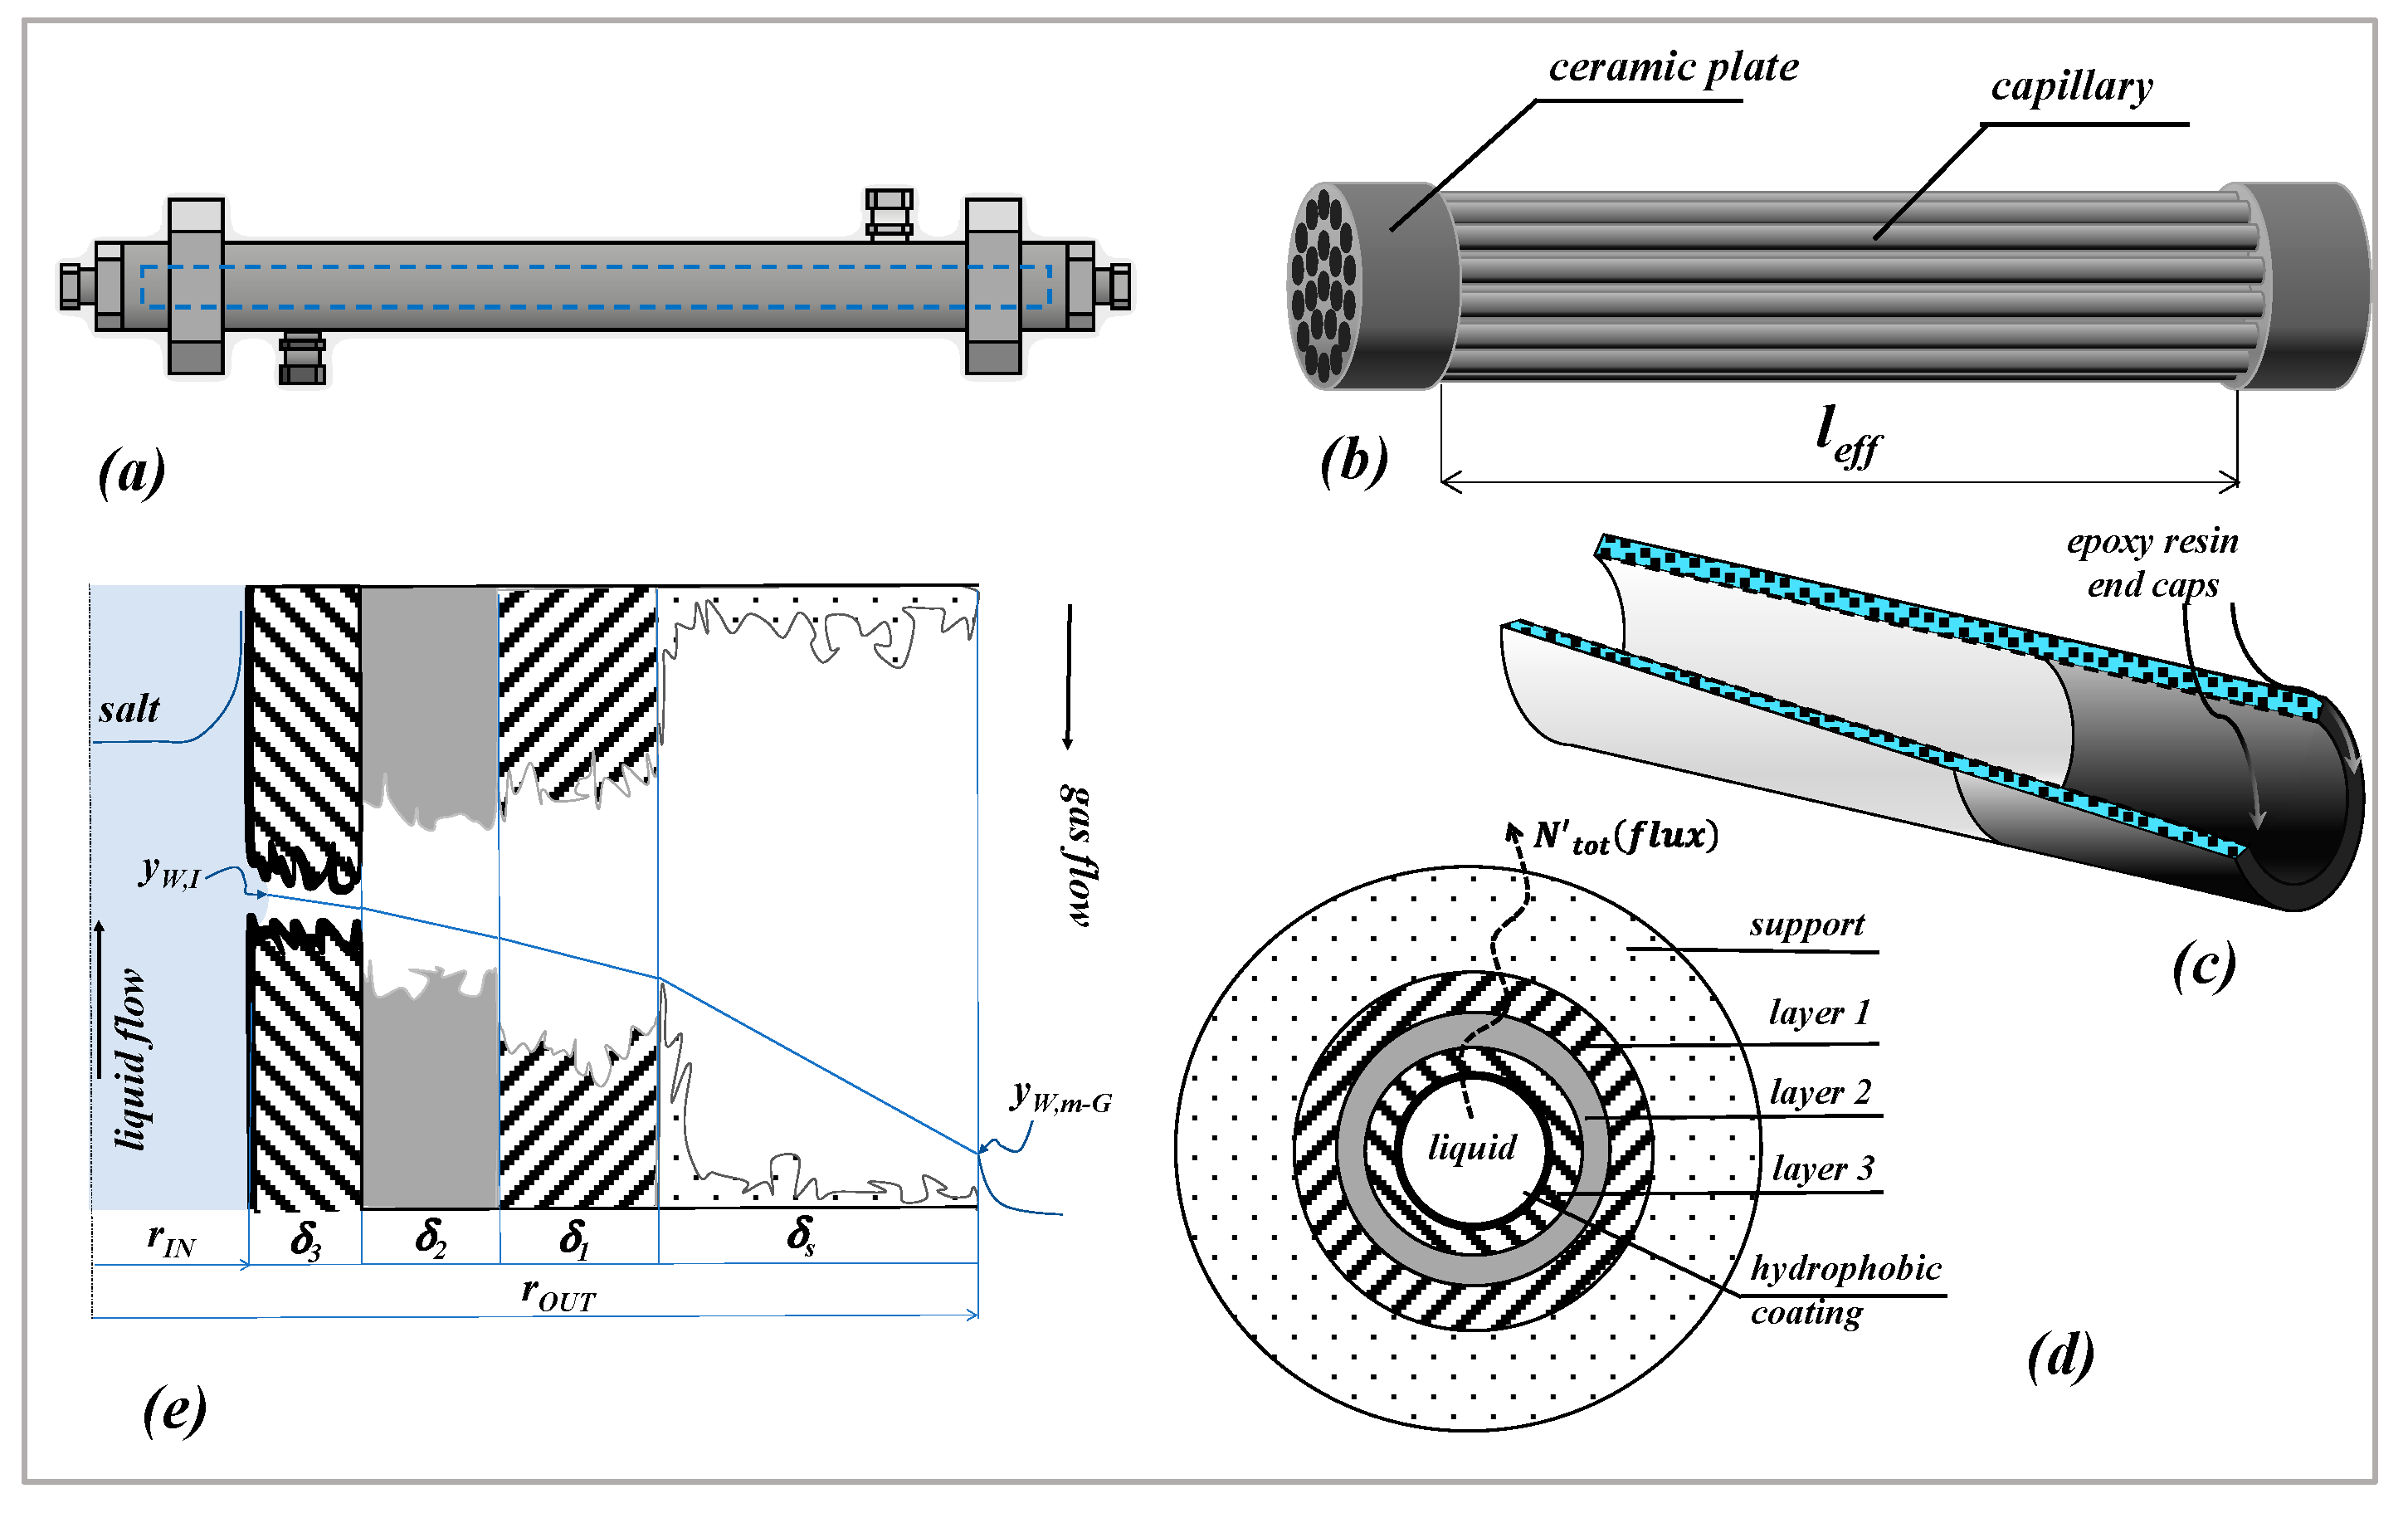
The purpose of this work is to present a critical discussion on the results obtained from the morphological characterization of multilayer hydrophobized ceramic membranes, following both the conventional protocol developed for polymeric membranes and the protocol derived by the application of the layer-by-layer technique. The study is developed by using hydrophobic carbon-based ceramic membranes manufactured by the Fraunhofer Institute for Ceramic Technologies and Systems (IKTS, Hermsdorf, Germany) as cylindrical membranes, in the shape of tubular single-channels and capillary bundles. Gas permeation tests are performed, followed by
LEPmin measurements carried out according to the normalized-flooding-curve method [
19]. For the purposes of this work, the
LEPmin measurements had as the only objective to test if the membranes had the requirements for process applicability for MD.
After a preliminary introduction of the basic equations describing the mass transfer in MD across a multilayer cylindrical membrane, the procedure for calculating the morphological parameters of multilayer cylindrical membrane is described, according to the principles of the DGM. The work is completed with a critical discussion of the results.
3. Theoretical Premises for the Results Discussion
In order to understand the “results and discussion” section, some theoretical premises are necessary.
3.1. Diffusive Mass Transport in Membrane Distillation (MD)
Mass transport in MD across a multilayer cylindrical membrane is here considered, in which the driving force is represented by a composition gradient across the membrane. The scheme and notation of
Figure 1e are used for the development of the following equations; in that case the composition gradient is kept by a sweeping gas downstream of the membrane [
1,
2]. Reference is made to the simple case of aqueous solutions containing only one volatile compound (as, for example, in the case of sodium chloride-water solutions with air as a gas stream). However, the same kind of composition profile across the membrane can be expected in other MD operations, such as direct contact MD and/or air gap MD and/or osmotic distillation, for example [
1,
2]. It is worth-noting that in this problem conceptualization we are interested in describing mass transfer across the membrane, assuming that the composition value at the feed/membrane interface (y
WI) is a known value. However, the complete modelling should certainly account for the mass and heat transfer in the external phases which determine the value of y
wIThe membrane is cylindrical and composed of four layers (indicated as
j); each layer is characterized by its corresponding pore diameter (
dpj), thickness (
δj) and porosity-tortuosity ratio
. Although the hydrophobic coating is in principle distributed along the surface of all the pores, only the coating located at the inner surface of the membrane (the “layer 3”) is effective to give the hydrophobicity necessary to immobilize a liquid–vapor interface at the feed-membrane side. The concept is explained in
Figure 1e) in which all the pores are depicted as unflooded by the liquid feed. As a consequence, in the case of a perfect coating, mass transfer across the membrane is represented by the transfer of water vapor across four cylindrical layers containing a stagnant gas phase.
The case of molecular diffusion across a stagnant layer under steady-state conditions is well known in literature [
33]. In the case of macroporous membranes, those equations require some modifications in order to account for possible different contributions to the diffusive mechanism, as well as of the number of pores existing in the cylindrical wall of the membrane.
Although molecular diffusion is the main mechanism, owing to the rather high pore sizes, the contribution of Knudsen diffusion can be accounted for also, and included in an equivalent diffusivity (
), according to the Bosanquet equation [
34], as represented by Equation (2). The Knudsen diffusivity in Equation (2) depends on the average pore diameter and on the average temperature existing in the
j-layer;
Rg and
MW represent the universal gas constant and the molecular weight, respectively.
is the molecular diffusion of water in the gas phase, which should be calculated at the temperature and pressure existing in the
j-layer.
The number of pores per unit length (
) is included in the volume porosity (
εj) which generally depends on the radial coordinate. It can be considered as an average value, according to the relationships (3), which are written referring to the case of cylindrical pores of equal diameter, assuming the logarithmic mean surface as average interfacial area:
The general equation describing the total molar flow per unit length across a single membrane layer (
) is then represented by Equation (4), in which the mass transfer coefficient of water in the
j-layer of the membrane (
) is defined straightforwardly, accounting for the volume porosity and for the pore tortuosity:
and represent the inner and outer radius of the layer (j), cj is the molar concentration of the gas phase inside the layer and y is the mole fraction.
In the case of a multilayer membrane, under steady state conditions, by using Equation (4) it is easy to combine the mass transfer coefficients of each layer to obtain the mass transfer coefficient of the membrane (
); with reference to the scheme and notation of
Figure 1e), Equation (5) can finally be derived:
Equation (5) does not contain adjustable parameters depending on the process type nor on the process fluids; the morphological parameters of each layer can be determined by independent measurements, as made in the “layer-by-layer method” by Weyd et al. [
28], for instance. When the parameters are known, Equation (5) can be used to predict total flux across the membrane, in order to simulate module and process performances at any operative conditions of temperature, pressure and composition, once the mole fraction of water is related to the corresponding bulk conditions.
3.2. Pressure-Driven Gas Transport in Macro-Porous Membranes
Gas permeation across porous solids is typically due to the contribution of three main mechanisms [
35]: a viscous motion according to a Poiseuille flow, the Knudsen diffusion and the so-called slip flow regime. For macro-porous membranes such as those of this work, the simpler dusty gas model [
36] can be used with a good approximation accounting only of the viscous and Knudsen contributions expressed with the same equations. In addition, since this work continues and completes the morphological characterization started in [
28], it is important to apply the same equations used in that paper (the DGM), since all the morphological parameters (reported in
Table 1 as nominal ones) derive from that: they are related to each other and, therefore, they should be used consistently.
A summary of the equations used in this work is reported in the following (schemes and notation of
Figure 1 are used).
At a generic axial section of a layer
j of a cylindrical membrane, the steady-state gas flow rate of
i-compound across the layer per unit length (
), under a constant pressure difference (
), can be expressed as reported in Equation (6a).
where
is the permeance of
i-compound across the
j-layer;
and
are the inlet and outlet pressures, respectively, in the
j-layer;
and
are coefficients representing the viscous and Knudsen diffusion contributions, respectively;
is the dynamic viscosity of the gas phase.
In the case in which the parameters can be assumed as constant values along the membrane length
L (or as average values along
L), the total gas flow rate across the layer can be written as:
Apparently, the permeance of each layer depends on the morphological parameters of the layer, on the gas properties and on the operative conditions.
Combining the resistances in all the layers, the overall membrane permeance of the
i-compound (
) can be expressed by Equation (7):
It is important to observe that the porosity parameter of each layer, appearing in Equations (6), corresponds to the same volume porosity defined in Equation (3), owing to the same geometry of the problem.
In the case of a 4-layer membrane, as is the case in this work, Equations (6) represent a set of equations which allow us to calculate the gas molar flow and the pressures along each layer, if the operative conditions of temperature and of PIN,3 and POUT,s (that is of ) are given and the values of the morphological parameters of each layer are known. The permeance of each single layer, as well as the total membrane permeance, can be finally estimated straightforwardly.
On the other hand, Equations (6) to (7) can be used also to calculate the unknown morphological parameters of a layer, by fitting the experimental results of total permeance, assuming that the morphological parameters of all the other layers are known.
That procedure is exactly the one used by Weyd et al. in [
28] to calculate the tortuosity factors of the “support” and of the “layers 1 and 2” of the “uncoated” single channels, and it will be used also in this work to estimate the morphological properties of “layer 3”, both for uncoated and for coated samples.
The results can then be compared to those obtained following the usual protocols used for polymeric membranes [
2,
10,
27], according to which average values of the porosity–tortuosity ratio
(ε/τ)m and of the average pore diameter (
) are calculated by fitting the experimental results of permeance over the entire membrane. In that case, referring to the notation of this work, Equation (8) represents the overall membrane permeance as a function of the average pressure across the membrane, according to the DGM premises.
It is self-evident that Equation (8) predicts a linear behavior of the total membrane permeance with the average pressure existing across the overall membrane; the parameters can be estimated according to a very simple fitting procedure which accounts for the slope and the intercept of the interpolating straight line.
4. Results and Discussion
4.1. Single Channels
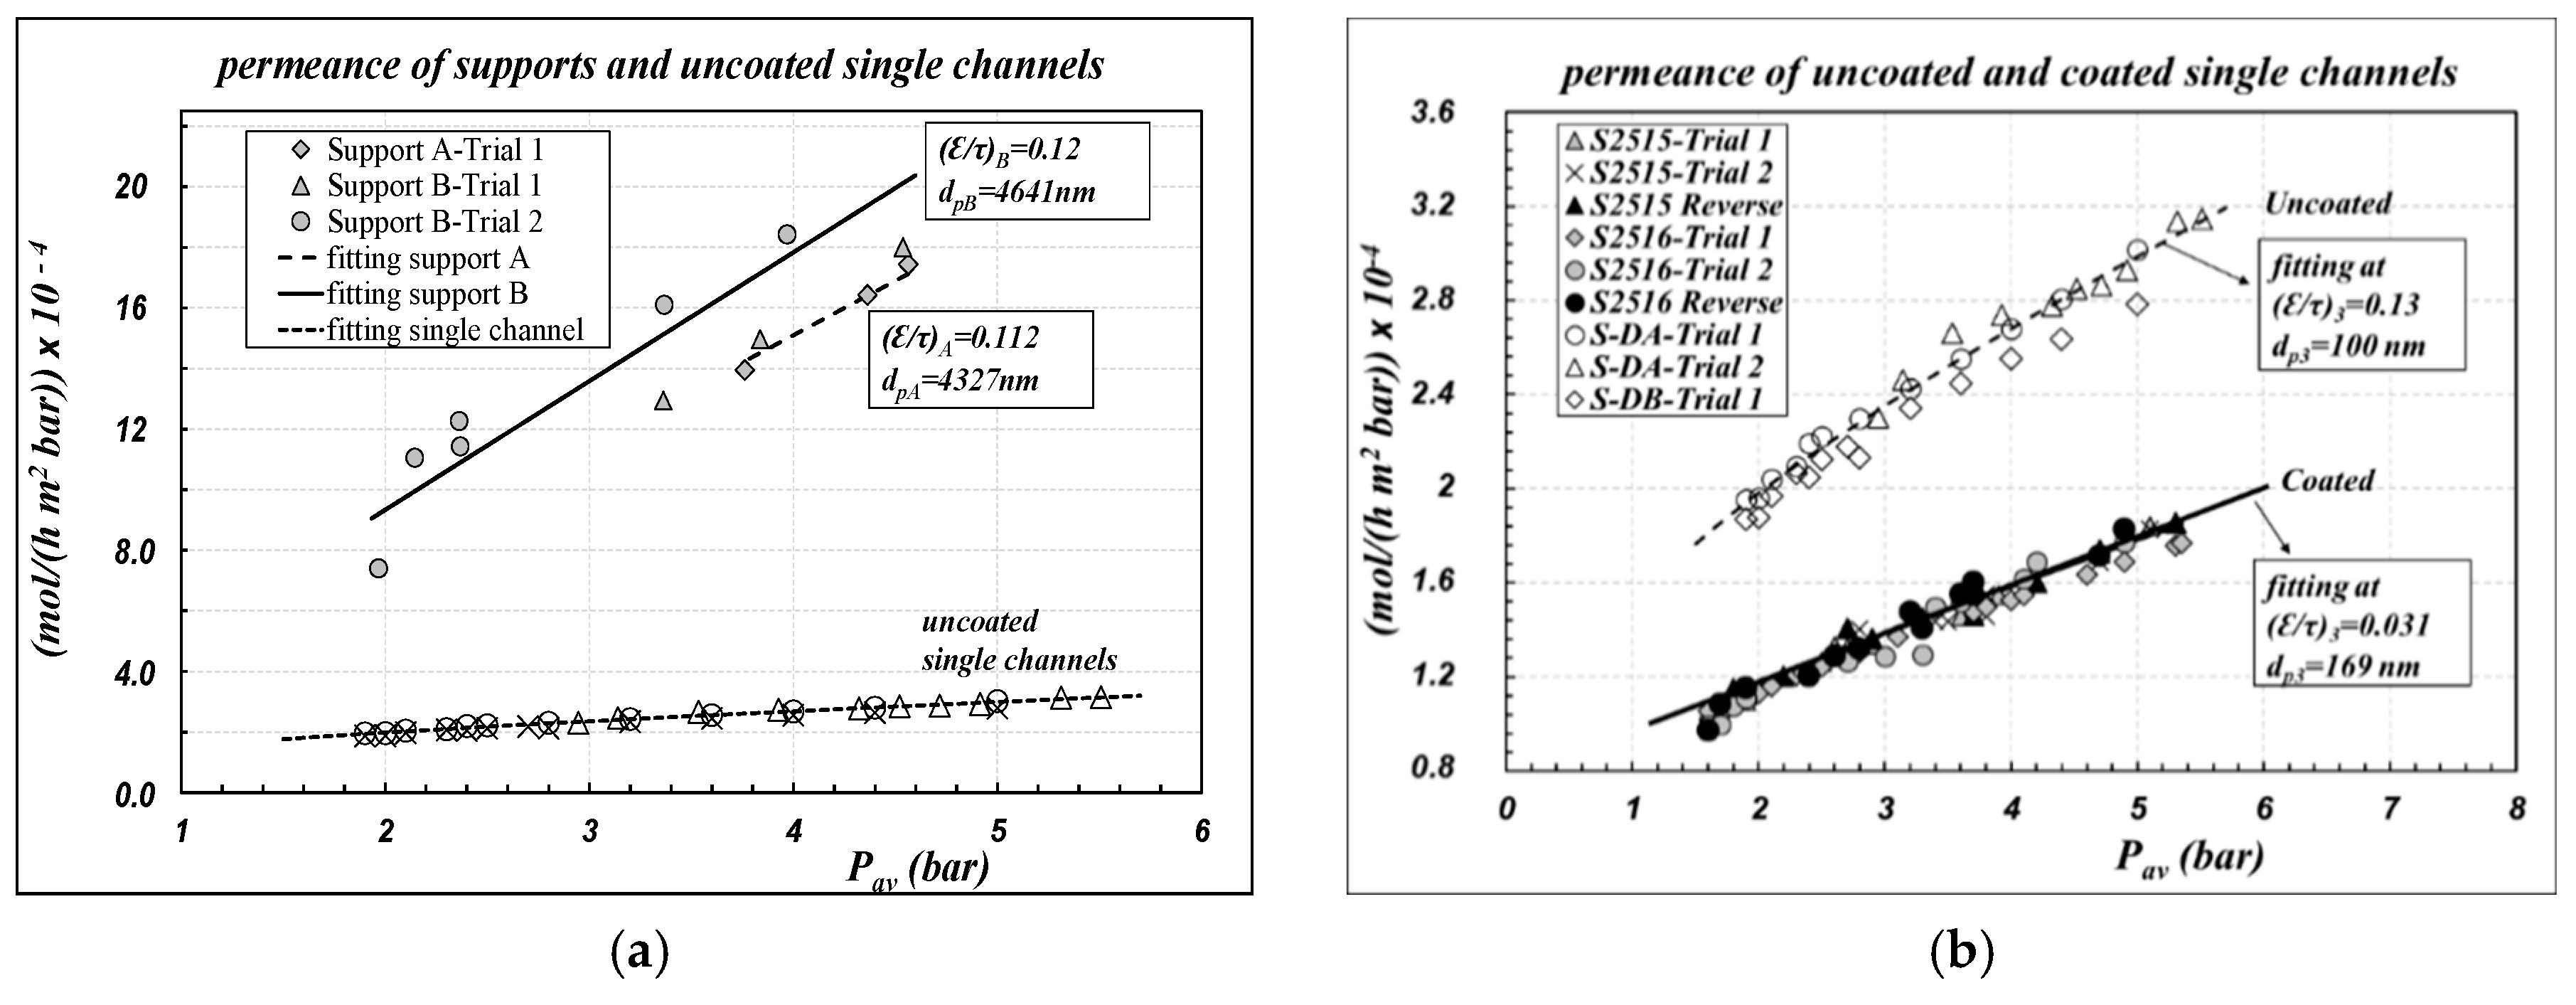
Air permeance data, referring to the inner area of the sample as defined in Equation (1), are reported in
Figure 2 for different kinds of single channels, as a function of the average pressure across the membrane.
Figure 2a compares the permeance of uncoated “support” with the overall permeance of the “uncoated” 4-layer membrane. The permeance of the “support” is nearly five to 10 times greater than the corresponding values for the uncoated 4-layer membranes, owing to its very large pore size.
Figure 2b compares the permeance of the “uncoated” samples with the corresponding values obtained for “coated” samples. No differences are observed between the results in the “straight mode” and in the “reverse mode”; this result is an intrinsic confirmation that the measurement procedure is good to characterize the “open pores”. Conversely, there is a remarkable effect of the coating, resulting in a 50% decrease in the permeance of the “coated” samples with respect to the “uncoated” ones. In
Figure 2a,b, experimental data are also compared with the results of the fitting procedure (lines), performed according to Equations (6) and (7). All the parameters obtained are collected in
Table 1 and compared with the corresponding nominal values given by the manufacturer; the quality of the fitting is documented as percentage relative error (%RE) between calculated and experimental data.
The main results are the following.
Apparently, the typical linear behavior of the DGM is obtained, both for uncoated and for coated samples, thus indicating that the model premises are fulfilled. There was a substantial reconfirmation of the nominal values of the “support”. As regards “layer 3” of uncoated samples, a reconfirmation of the pore diameter value declared by the manufacturer was obtained, whereas the () value was obtained lower than the corresponding values of “layers 2 and 1”, but aligned with them.
The procedure was repeated for “layer 3” of “coated” samples, assuming that the morphological parameters of the supporting layers (“layer 2”, “layer 1” and “support”) were not affected by the coating procedure, owing to their higher pore size. The results are rather interesting: the (
) value was obtained rather lower than the “uncoated” case, whereas an increasing value of the average pore diameter was calculated. Those results are not in contradiction with each other, rather, they can be explained by accounting for the fact that the first step of the coating procedure, the carbonization, can cause pore-blocking of the thinner pores. Of course, also the grafting procedure with fluoroalkylsilanes can lead to an additional decrease of the pore size. Owing to both of the motivations, the pore size distribution can change and shift the average size towards greater values. Those results are mostly aligned also with what was observed by other authors with different membranes grafted by fluoroalckylsilanes [
10,
12,
37].
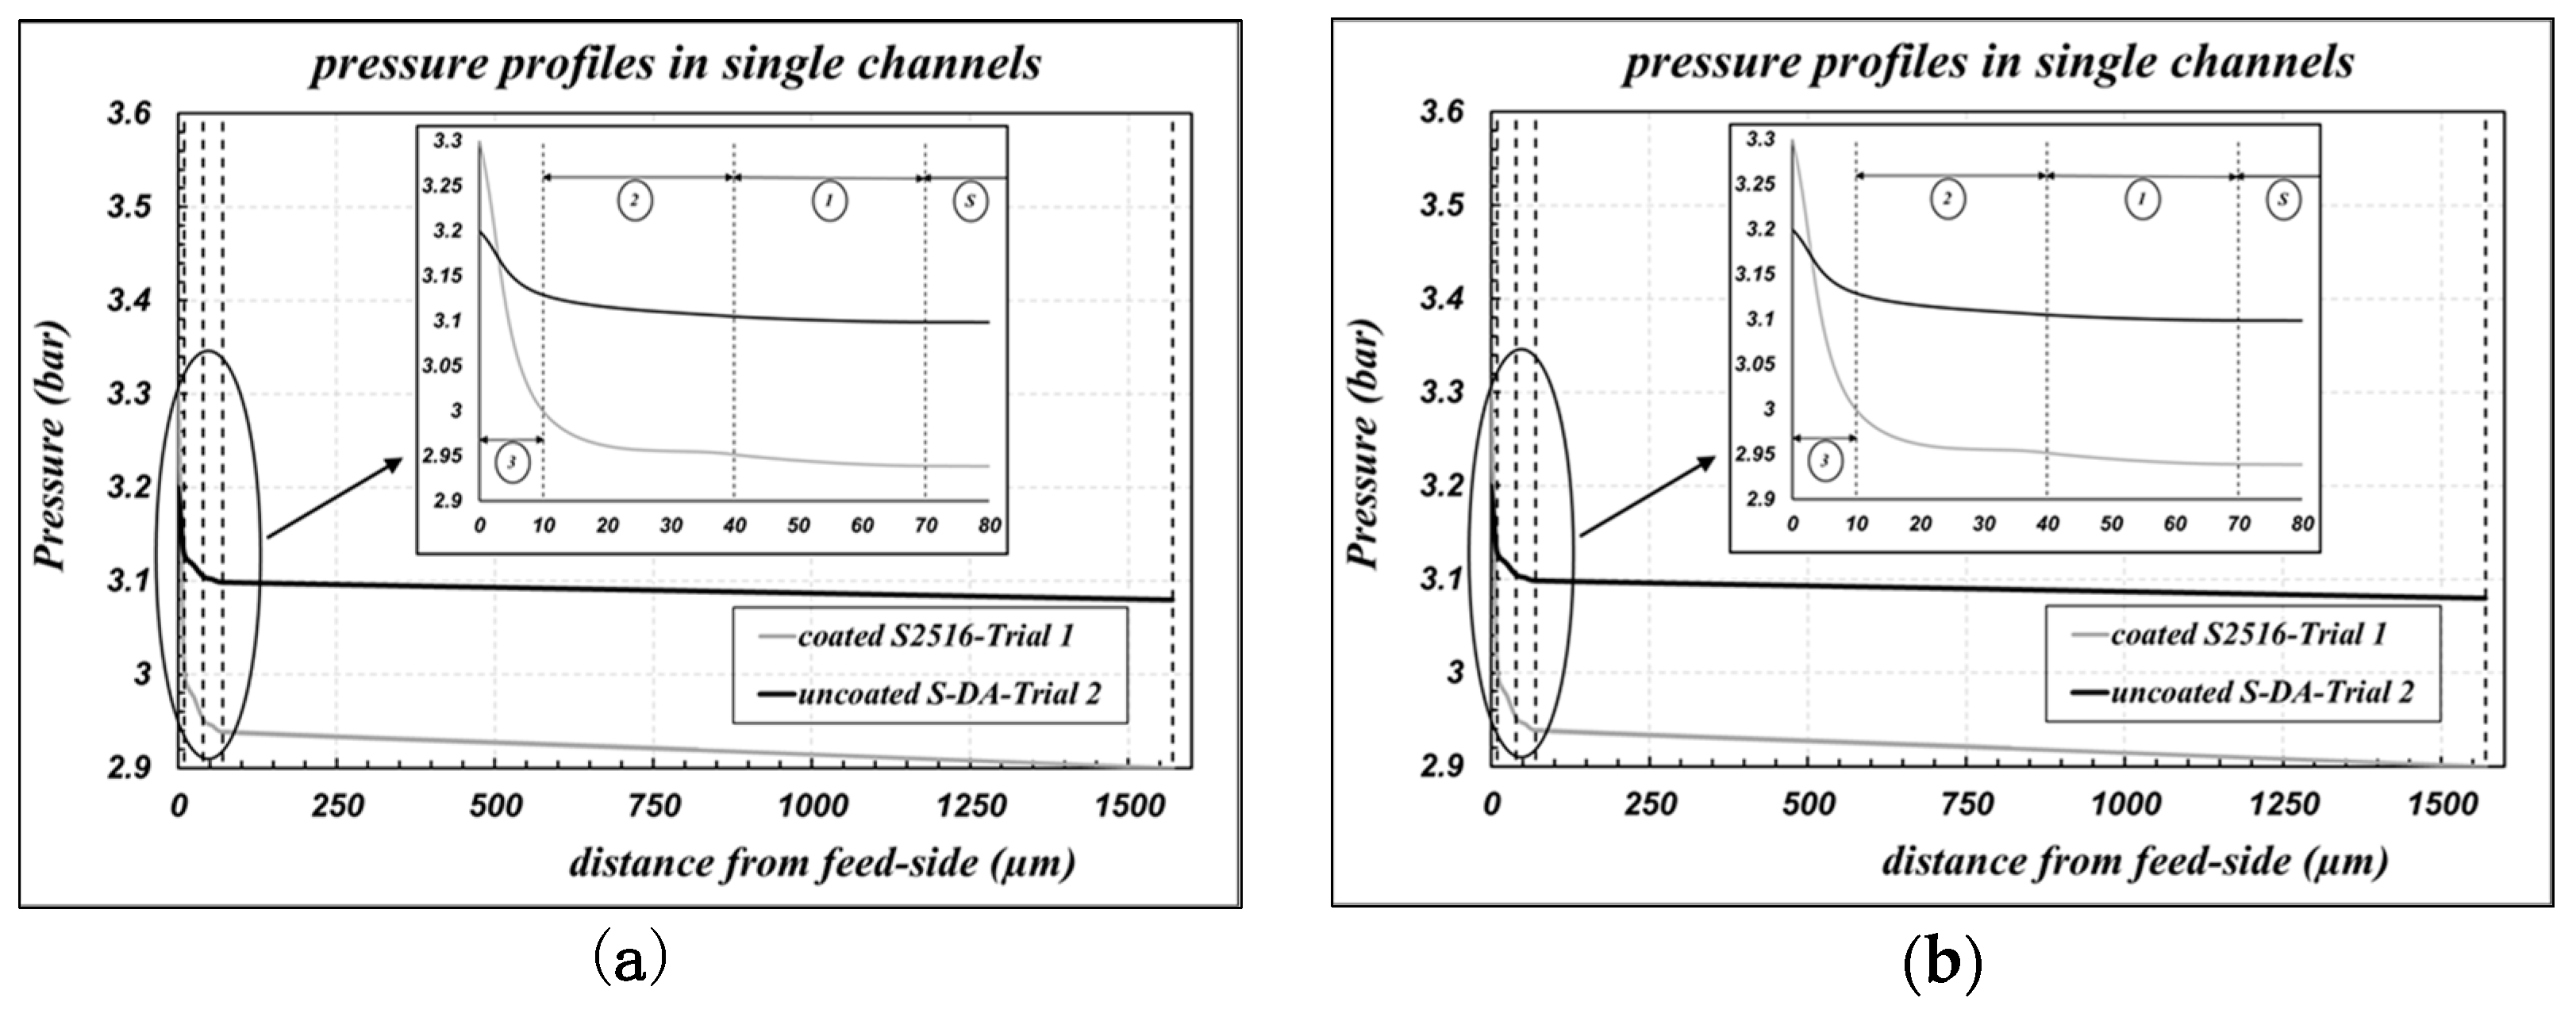
While performing data fitting, the pressure profiles along the radial coordinate of the membrane can be obtained also. The cases of the “uncoated S-DA” and of the “coated S2516” samples are reported in
Figure 3a. We can observe that very steep pressure drops are obtained across the “layer 3”, which is the less gas permeable layer: the membrane permeance is mainly controlled by the properties of “layer 3”.
As a final calculation, all the experimental data reported in
Figure 2b were elaborated to estimate the average membrane parameters, according to the usual protocols for polymeric membranes, as reported in Equation (8). Results are again collected in
Table 1 as “average membrane values”, both for the cases of “uncoated” and “coated” samples.
Also, by those calculations, the coating effect in the pore reduction or in the pore-blocking is self-evident. However, the values of porosity-tortuosity ratios seem to be rather inconsistent with their physical meaning, since they are obtained as numbers greater than unity. Those values, however, are aligned also with those obtained by other authors who performed elaborations of the same kind. As an example, basing on the results documented by Koonaphapdeelert and Li [
10], it is possible to calculate a value of
= 1.88 for ungrafted 300 μm thickness alumina fibers and
= 2.24 after their grafting.
We suspect that the membrane parameters averaged over the entire membrane are not representative of the membrane properties. A more detailed and critical discussion about the meaning of these results is reported in
Section 4.3.
Finally, the LEPmin measurements gave the threshold values of 2.7 and 2.3 bar at 60 °C for the samples S2515 and S2516, respectively; those values certainly represent a positive test of the process applicability of the membranes, which can be proposed as good elements for membrane contactor devices in the future.
4.2. Capillary Bundles
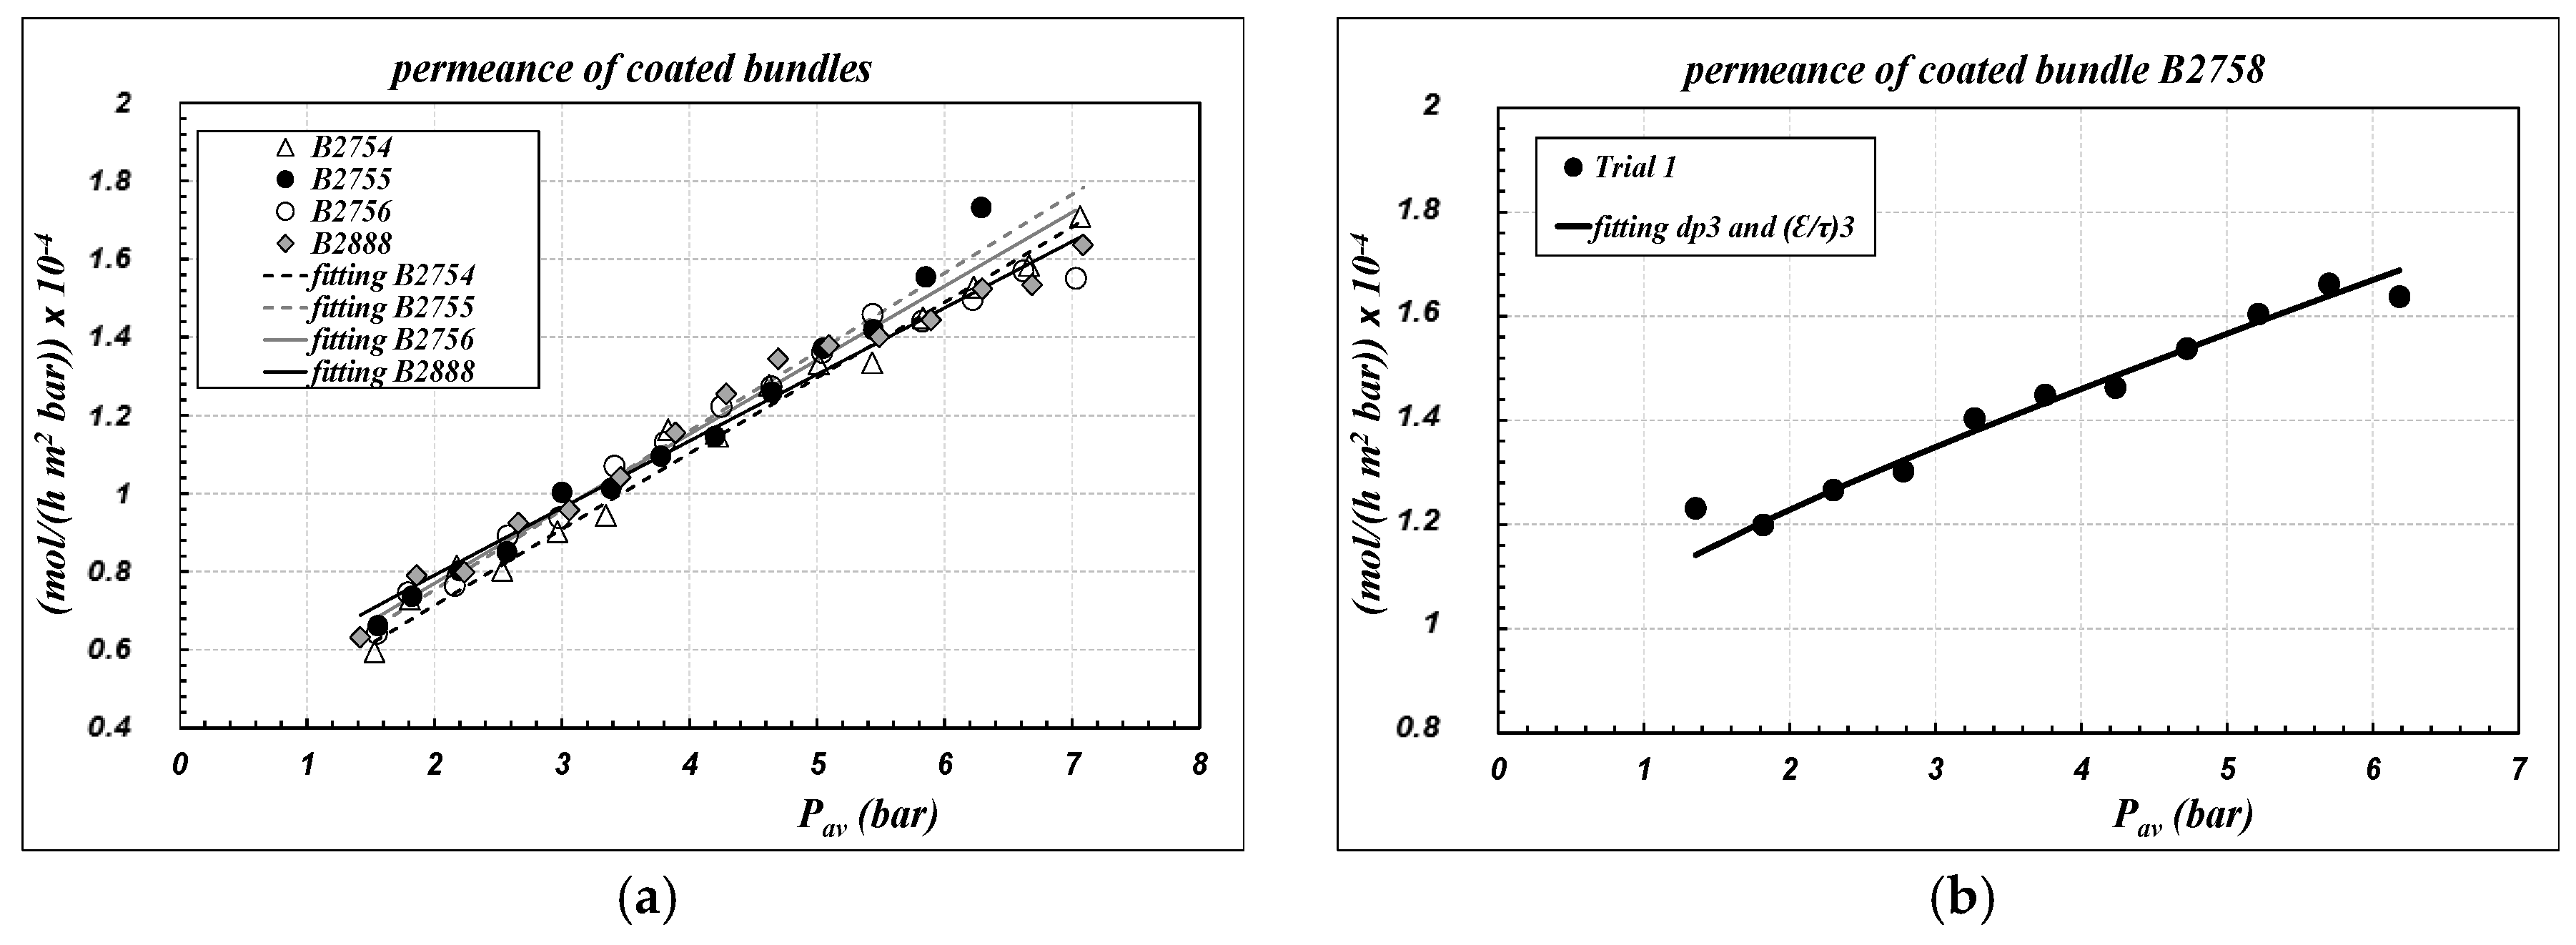
Air permeance data of “coated” bundles, referring to the inner area of the sample as defined in Equation (1), are reported as symbols in
Figure 4, as a function of the average pressure across the capillaries. Experimental data are compared with the results of the fitting procedure, performed according to Equations (6) and (7) to calculate the parameters of “layer 3”, assuming that the morphological parameters of the other supporting layers were not affected by the coating procedure. The results are collected in
Table 3. The corresponding pressure profiles across the membrane for the bundle B2758 are reported in
Figure 3b also, as an example of the general trend.
There is a substantial reconfirmation of the results already obtained for single-channel membranes, with regards to the linear trend of data as well as to the range of the permeance values. Indeed, since “layer 3” is the controlling layer on the gas permeance, the overall air permeance is not affected in a sensible manner by the different thicknesses of the “support” layer of the single-channel and of the capillary, as could have been expected. The reproducibility of the results is very good for all the bundles; the sample B2758, however, seems to be much more aligned with single channels.
For the bundles B2754, B2755, B2756 and B2888, it can be observed that after coating there is a remarkable increase of the pore diameter of “layer 3”, in association with a remarkable decrease of the porosity–tortuosity ratio. That result is again consistent with the hypothesis of pore-blocking of the thinner pores, but it should alert about the process applicability of the membranes, since we might expect low values of the breakthrough pressure. Also, for the bundles, experimental data reported in
Figure 4 were elaborated to calculate the average membrane parameters according to the definitions reported in Equation (8). Results are reported in
Table 3 as “average membrane parameters”.
Finally, the
LEPmin measurements gave the threshold values of 6.9 and 5.8 bar at 25 °C for the samples B2758 and B2756, respectively; those values are notably higher than those typically measured for polymeric membranes of similar pore size [
2,
19]. The process applicability test of those membranes has been considered as positive.
4.3. Discussion and Conclusions
The morphological characterization developed in the previous sections allowed us to obtain the parameters (dpj) and (ε/τ)j necessary for the determination of the overall mass transfer coefficient of the membrane, as described by Equations (4) and (5), to be used to simulate/predict the transmembrane flux in MD operations.
Based on those results, it was then possible to estimate the mass transfer resistances of each layer and the overall resistance across the multilayer membrane. To that purpose, the relationships reported in Equation (5) are re-elaborated according to Equation (9) in order to obtain an expression of the mass transfer resistance of water across the total membrane (
) and across each layer
j (
).
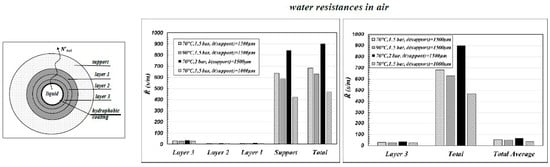
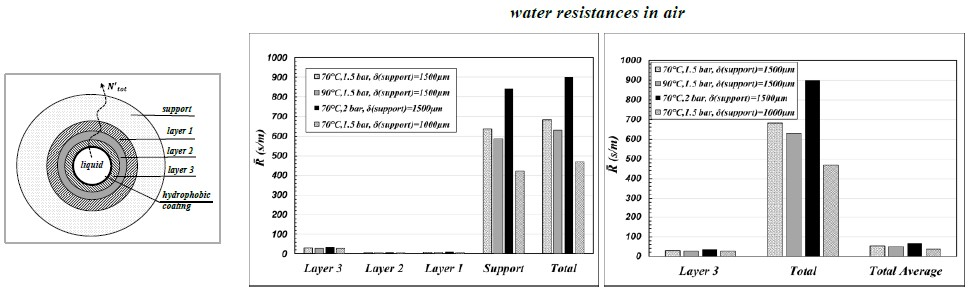
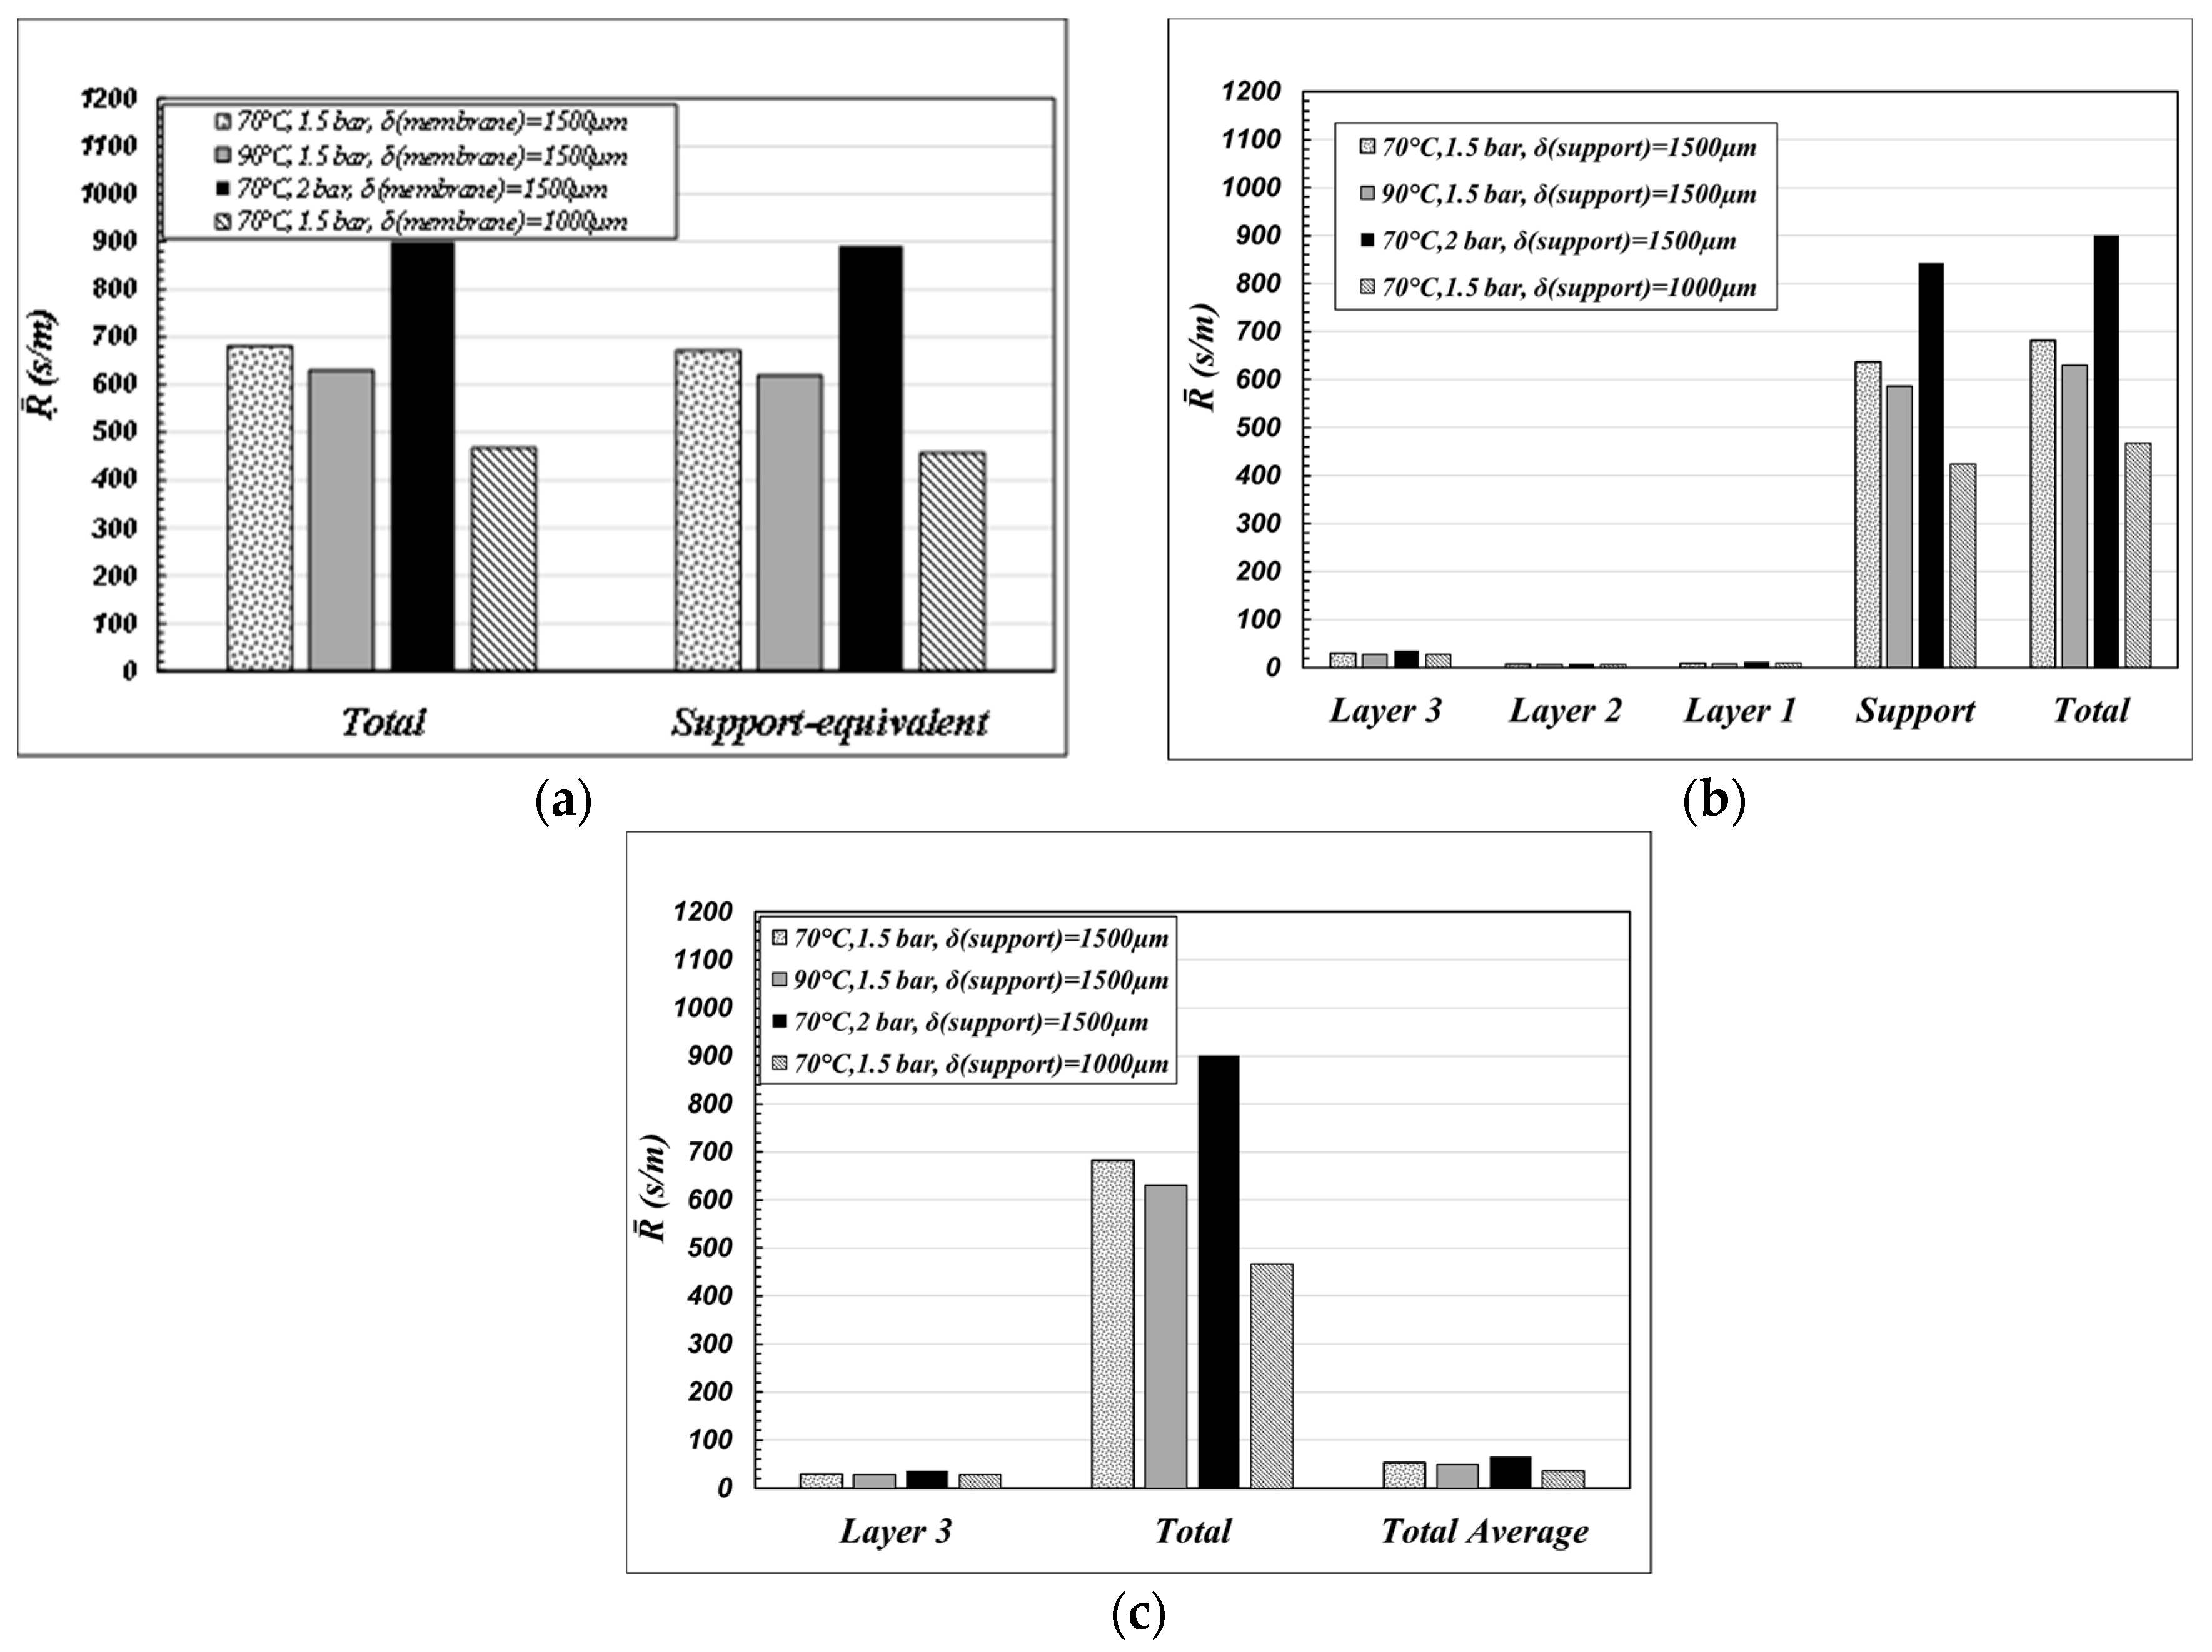
The case of water-air is considered. The water mass transfer resistances were calculated at 70 °C and 90 °C, at 1.5 and 2 bar in the gas phase, for “support” thicknesses of 1500 and 1000 μm, referring to the case of “coated” single channels. The results are collected in
Figure 5.
The results plotted in
Figure 5a put clearly in evidence that, when the membrane is used in MD operations, the “support” is the controlling step of the mass transfer resistance across the membrane. Since the mass transfer is mainly due to a diffusive mechanism (Equation (4)), the thinner is the “support” thickness the greater is the total flux across the membrane. By contrast, “layer 3” is not remarkable in determining the mass transfer. It actually works only as a mere support for the hydrophobic coating, which is to be deposited/grafted on thin pores in order to prevent pore-wetting (that is to give the highest values of
LEPmin as possible). In order to increase the total transmembrane flux in MD operations, it is necessary to decrease the “support” thickness as much as possible, by keeping the pore size of “layer 3” as it is, in order to be sure to immobilize the liquid–vapor interface on it.
The role of the “support” is put in evidence in
Figure 5b also, in which the total membrane resistance of
Figure 5a is compared with the resistance calculated according to Equation (9) as “support-equivalent”, that is as the membrane parameters were coincident with those corresponding to the “support” at the total thickness of the membrane (
).
The results reported in
Figure 5c are interesting and remarkable. That figure compares the total water resistance calculated by using the parameters of each layer (“Total” is as in
Figure 5a) with the overall water resistance calculated by using the “average membrane values” (“Total Average”), as defined in Equation (8) and reported in
Table 1—case c. Apparently, the use of the morphological parameters averaged over the entire membrane gives a heavy underestimation of the overall membrane resistance with respect to the calculation performed by using the morphological parameters of each single layer.
Since in all the MD operations the mass transfer across the membrane is mainly a diffusive transfer, it is important to have a very good estimation of the porosity-tortuosity ratio, in order to be able to simulate the transmembrane flux. For the membranes here considered, the calculation of (ε/τ)m as an average value, basing on gas permeation data, is not practicable, since it is greatly affected by the determining role of “layer 3” on the air permeance, which, by contrast, is not so important when the membrane operates in MD. Absurdly, an error in the evaluation of the parameters of “layer 3” could not be so remarkable in determining the overall mass transfer of the membrane. Also, errors in the estimation of the pore diameter of “layer 3” are not so relevant, since the pore diameter is only necessary to calculate the Knudsen contribution to the equivalent diffusivity, which typically has a minor role (with the exception of vacuum membrane distillation). Conversely, a precise evaluation of the parameters of the “support” is fundamental, since it is the controlling layer on the mass transfer resistance of the membrane.
As a consequence, the method of fitting permeance data with average morphological parameters over the entire membrane, as was generally suggested in the case of polymeric symmetric membranes [
2] and as was generally performed also in the case of ceramic membranes [
3,
10], should be used carefully, since it might lead to heavy errors on the simulation of membrane flux in most of the MD operations.
The calculation of the morphological parameters of each layer, according to the “layer-by-layer” gas permeance method, as introduced in [
28] and completed in this work, is more appropriate.
The final verification of these conclusions will be reported in the next paper in which experimental data of fluxes across the membrane will be compared with the predicted values at the same operative conditions calculated by using the morphological parameters obtained in this work.
Finally, it is interesting to observe that many other kinds of hydrophobic membranes have been proposed in literature such as composite membranes [
38] and/or mixed matrix membranes used for pervaporation [
39,
40]. In those cases, however, the “layer-by-layer method” of combining the resistances according to the DGM should be modified significantly, since the gas permeance is regulated also by different transport mechanisms, and more specific detailed studies should be performed.


