
Mechanism of Silica Nanoparticle-Induced Particulate Fouling in Vacuum Membrane Distillation

Abstract
:1. Introduction
2. Materials and Methods
2.1. Materials
2.2. Membrane
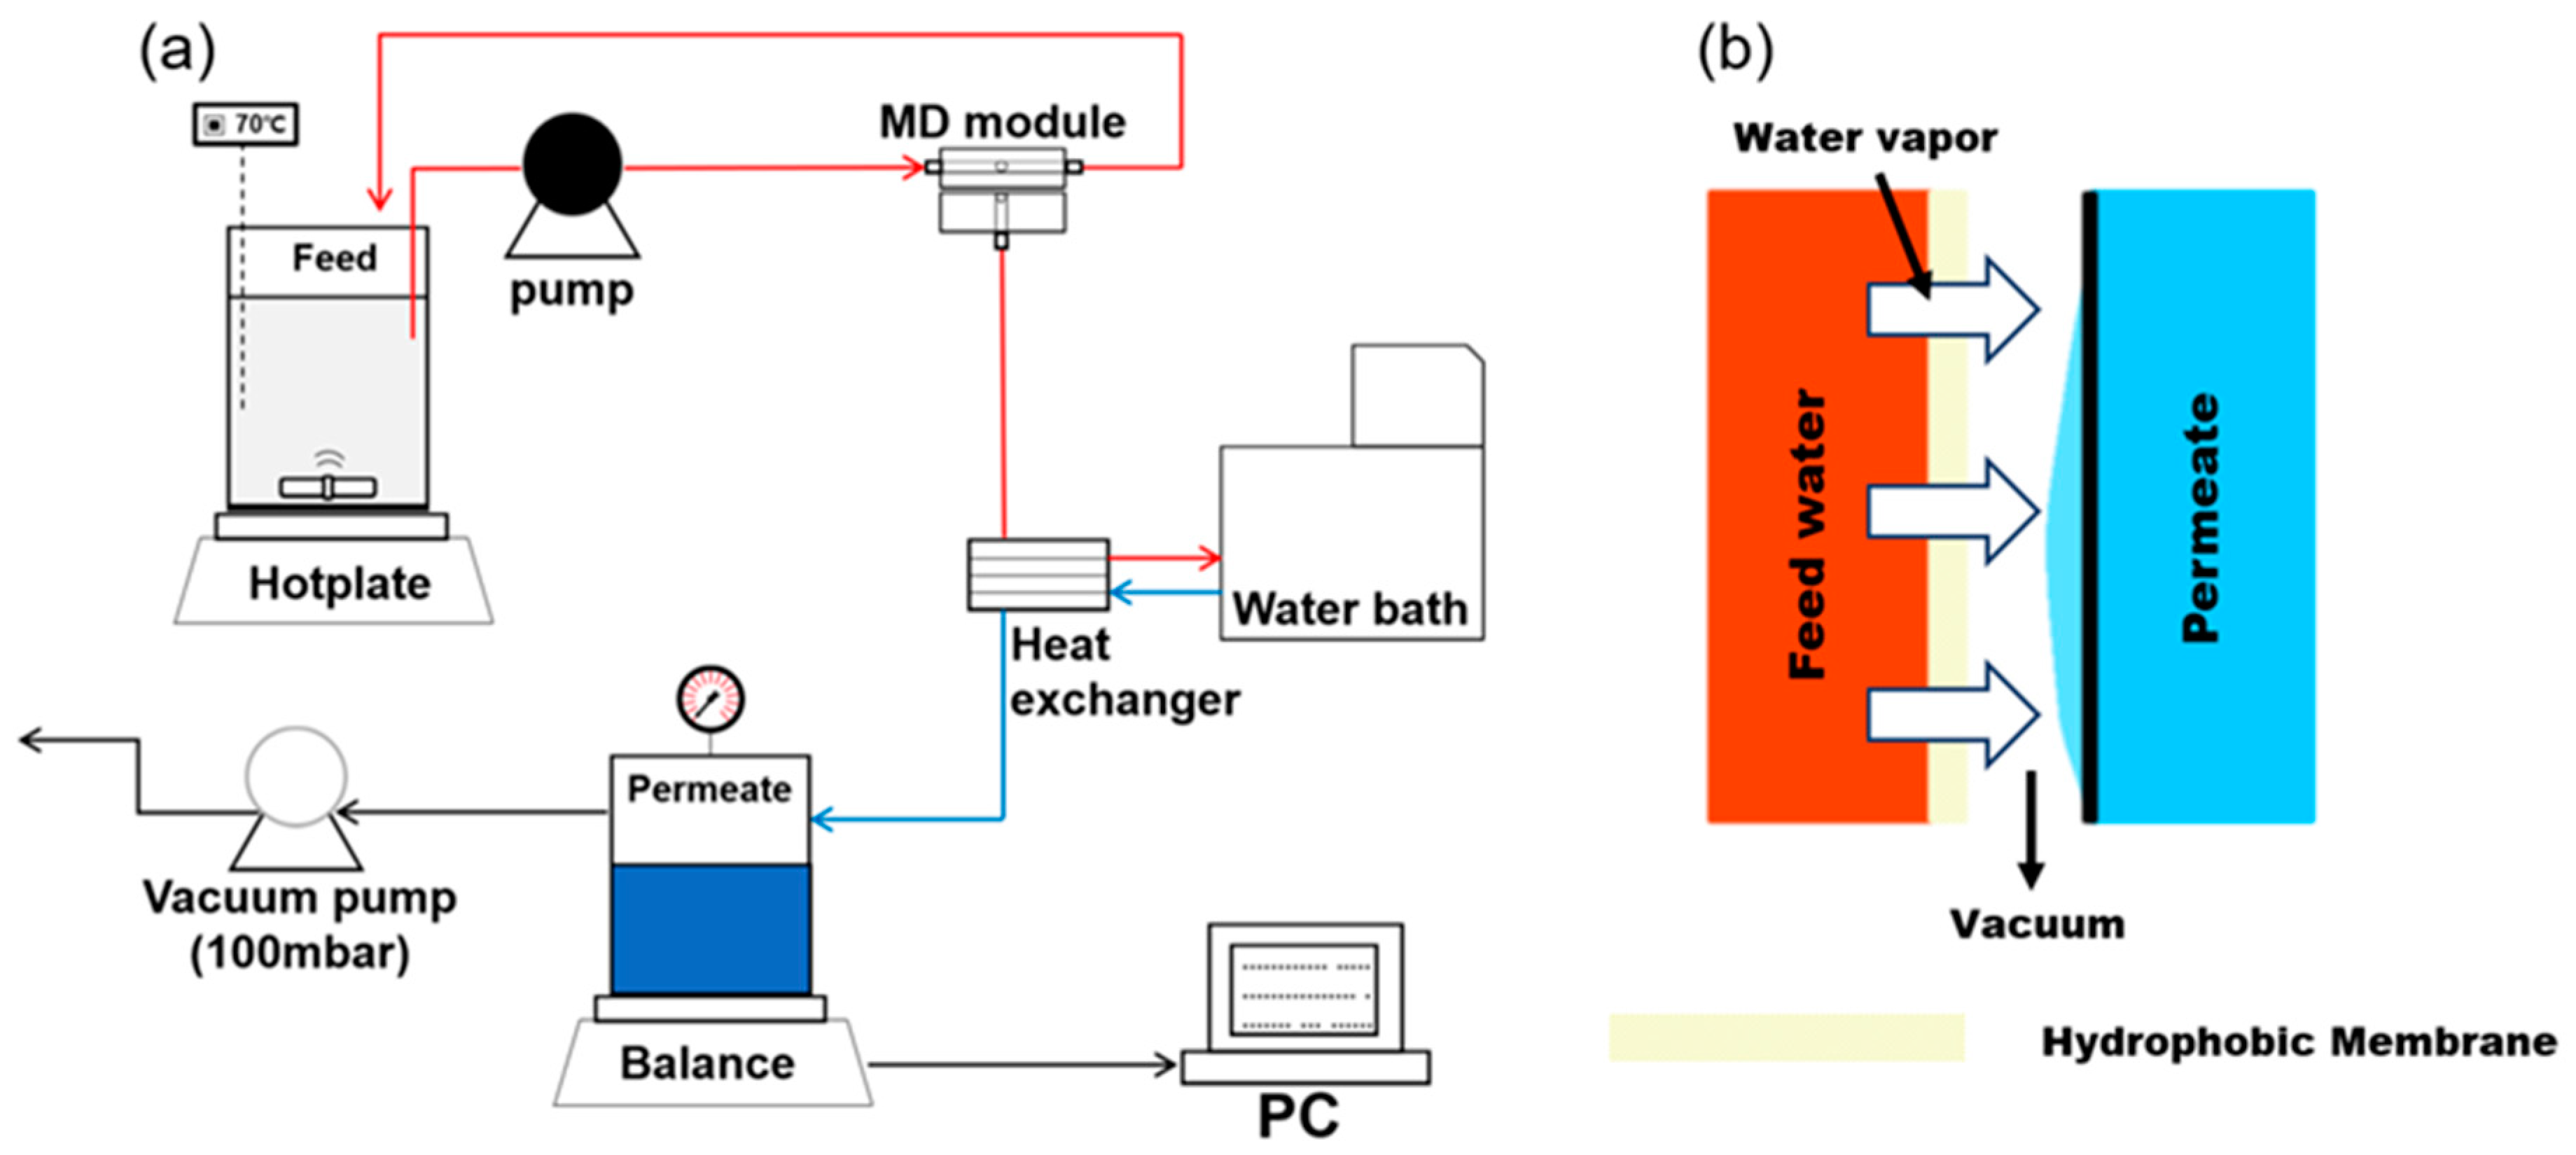
2.3. VMD Setup
2.4. Silica Nanoparticles
2.5. Experimental Conditions
2.6. Analytical Methods
3. Results
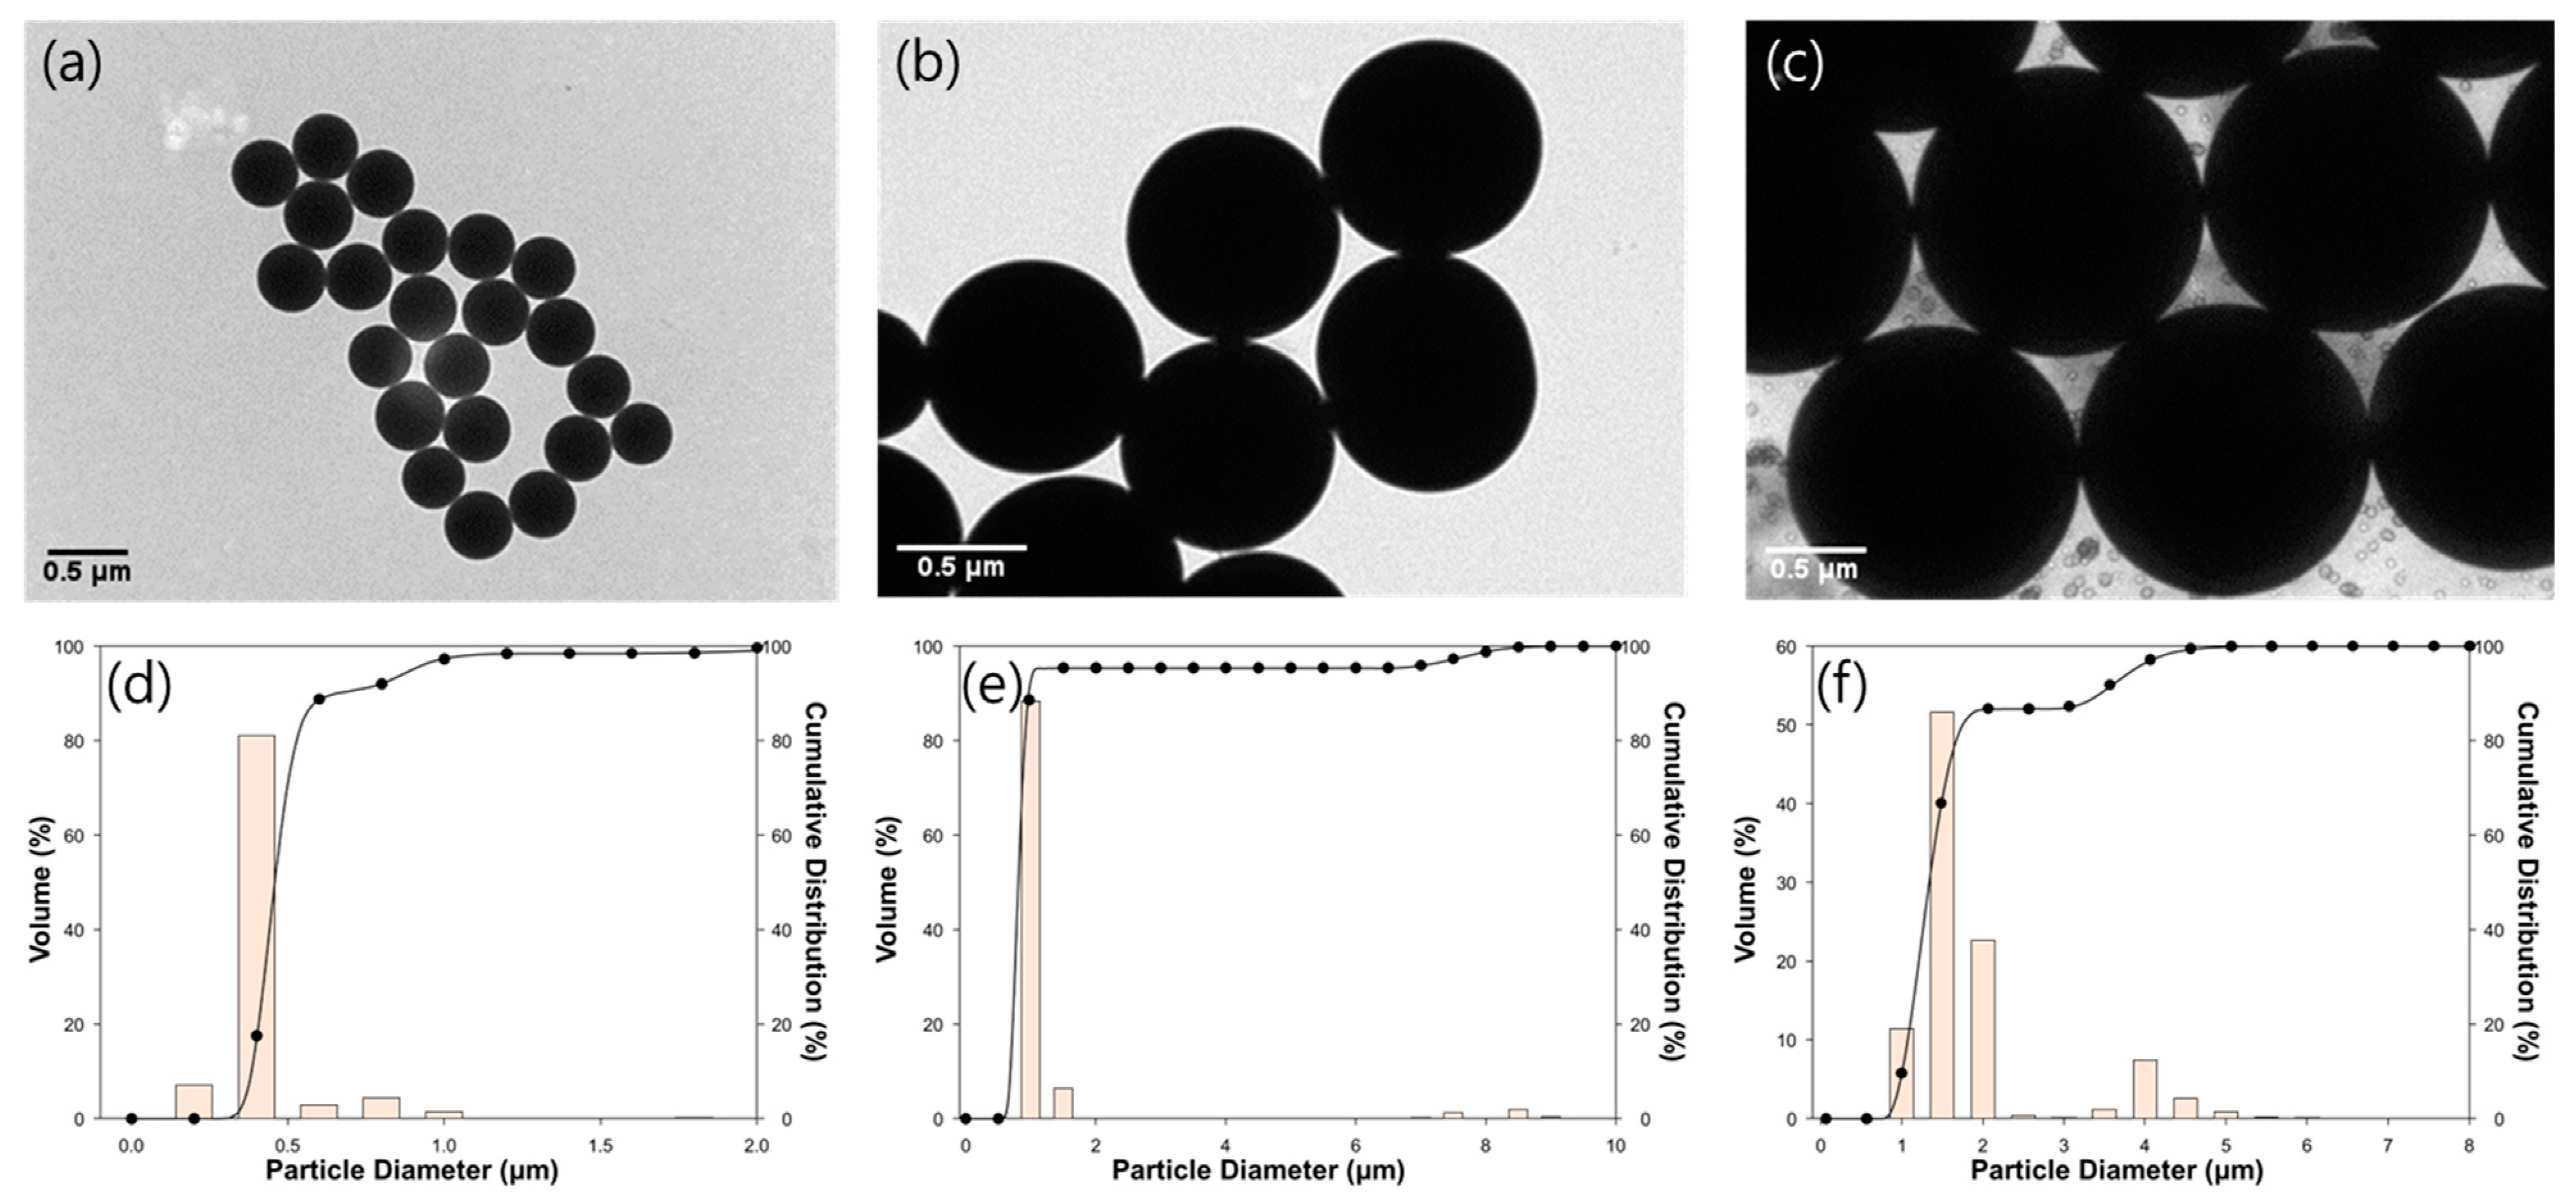
3.1. Preparation of the SNPs
3.2. Factors on Particulate Fouling on MD Membrane
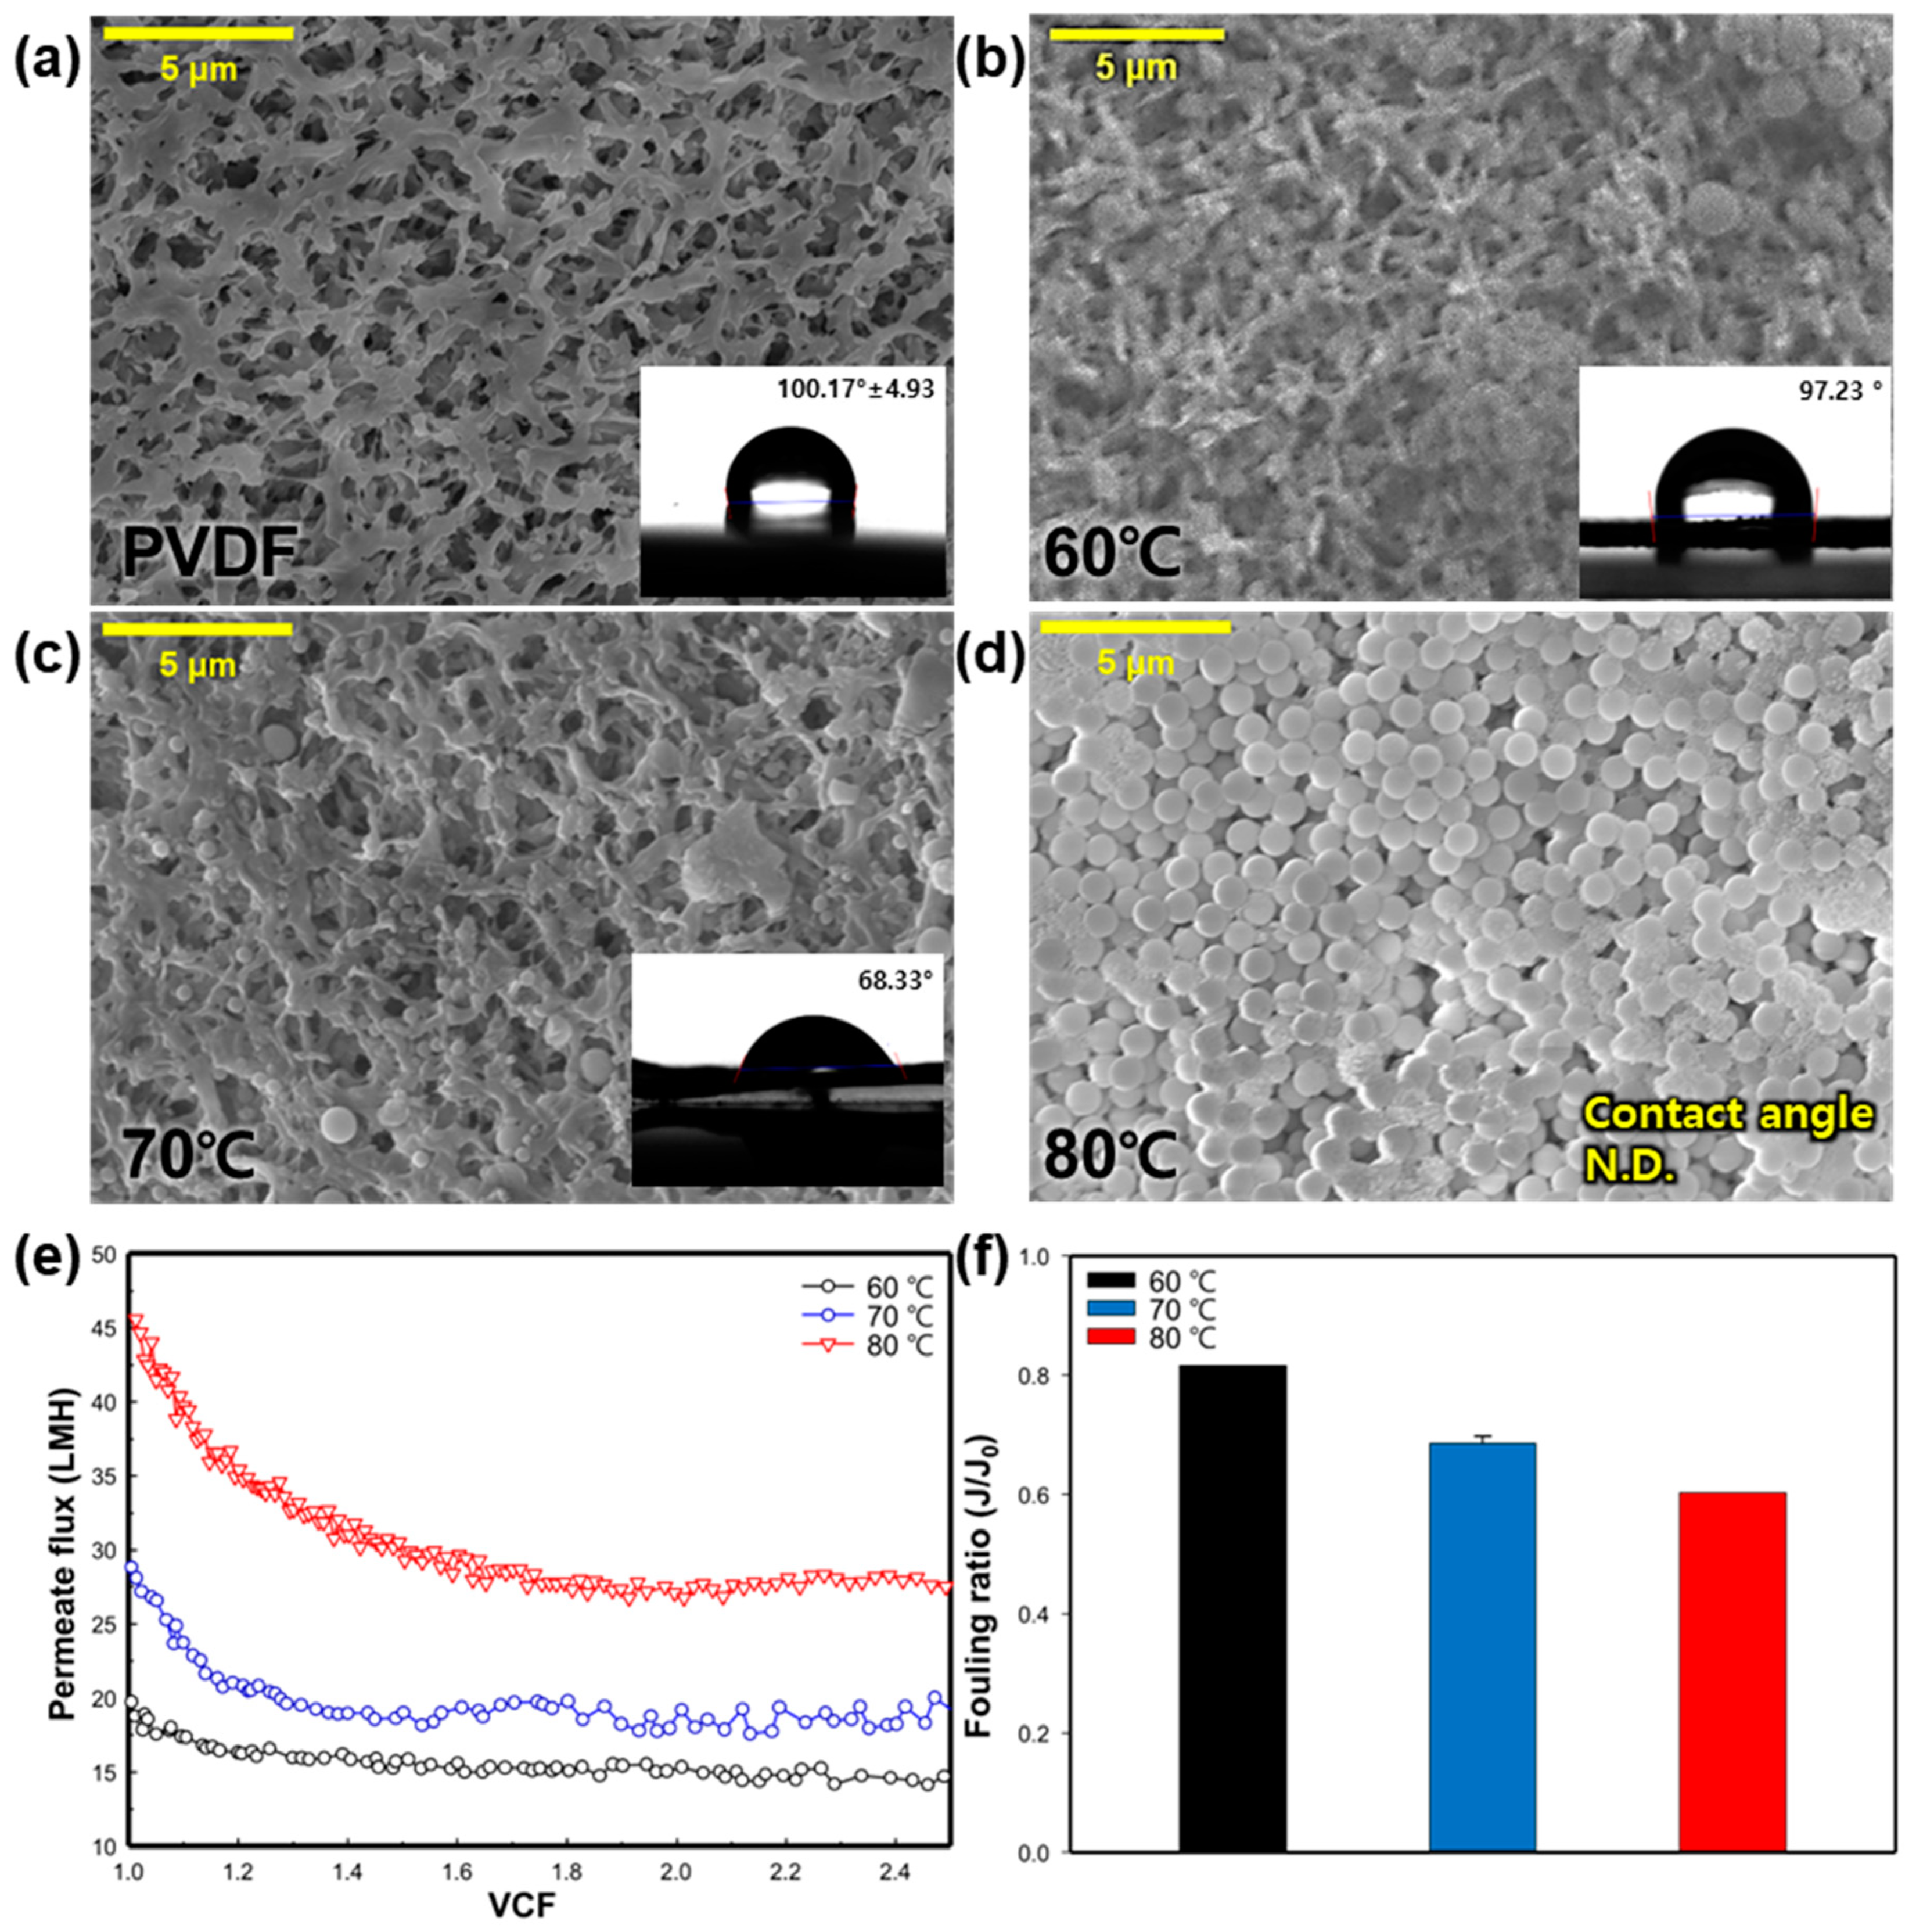
3.2.1. Effect of Feed Water Temperature
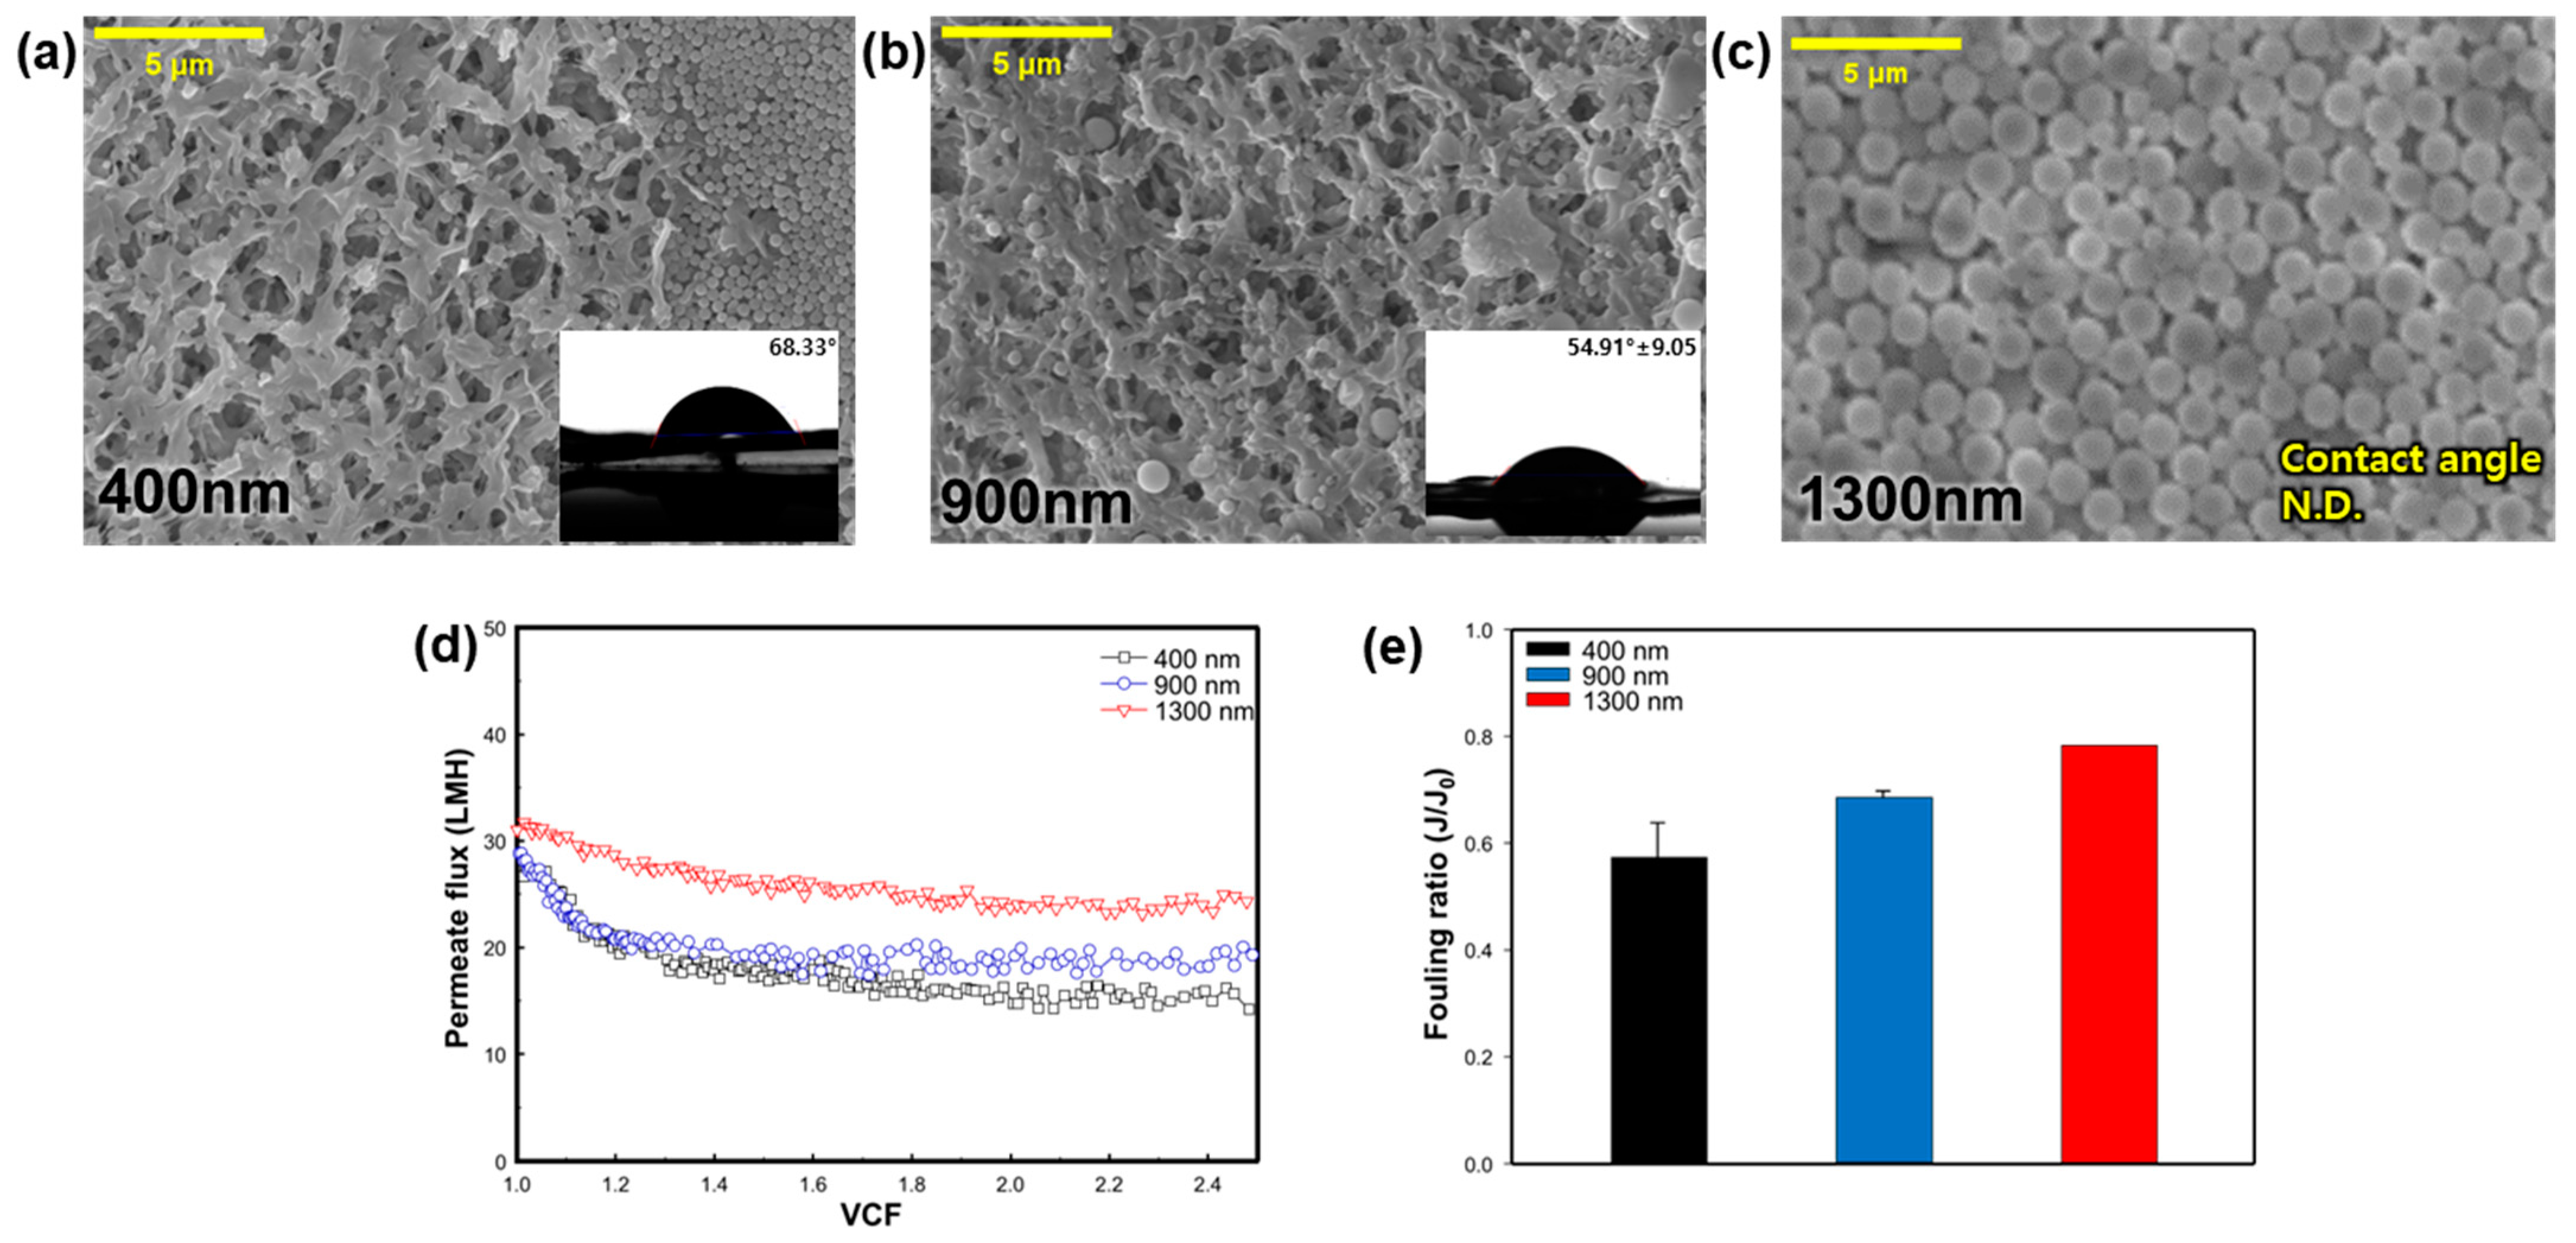
3.2.2. Effect of SNP Size
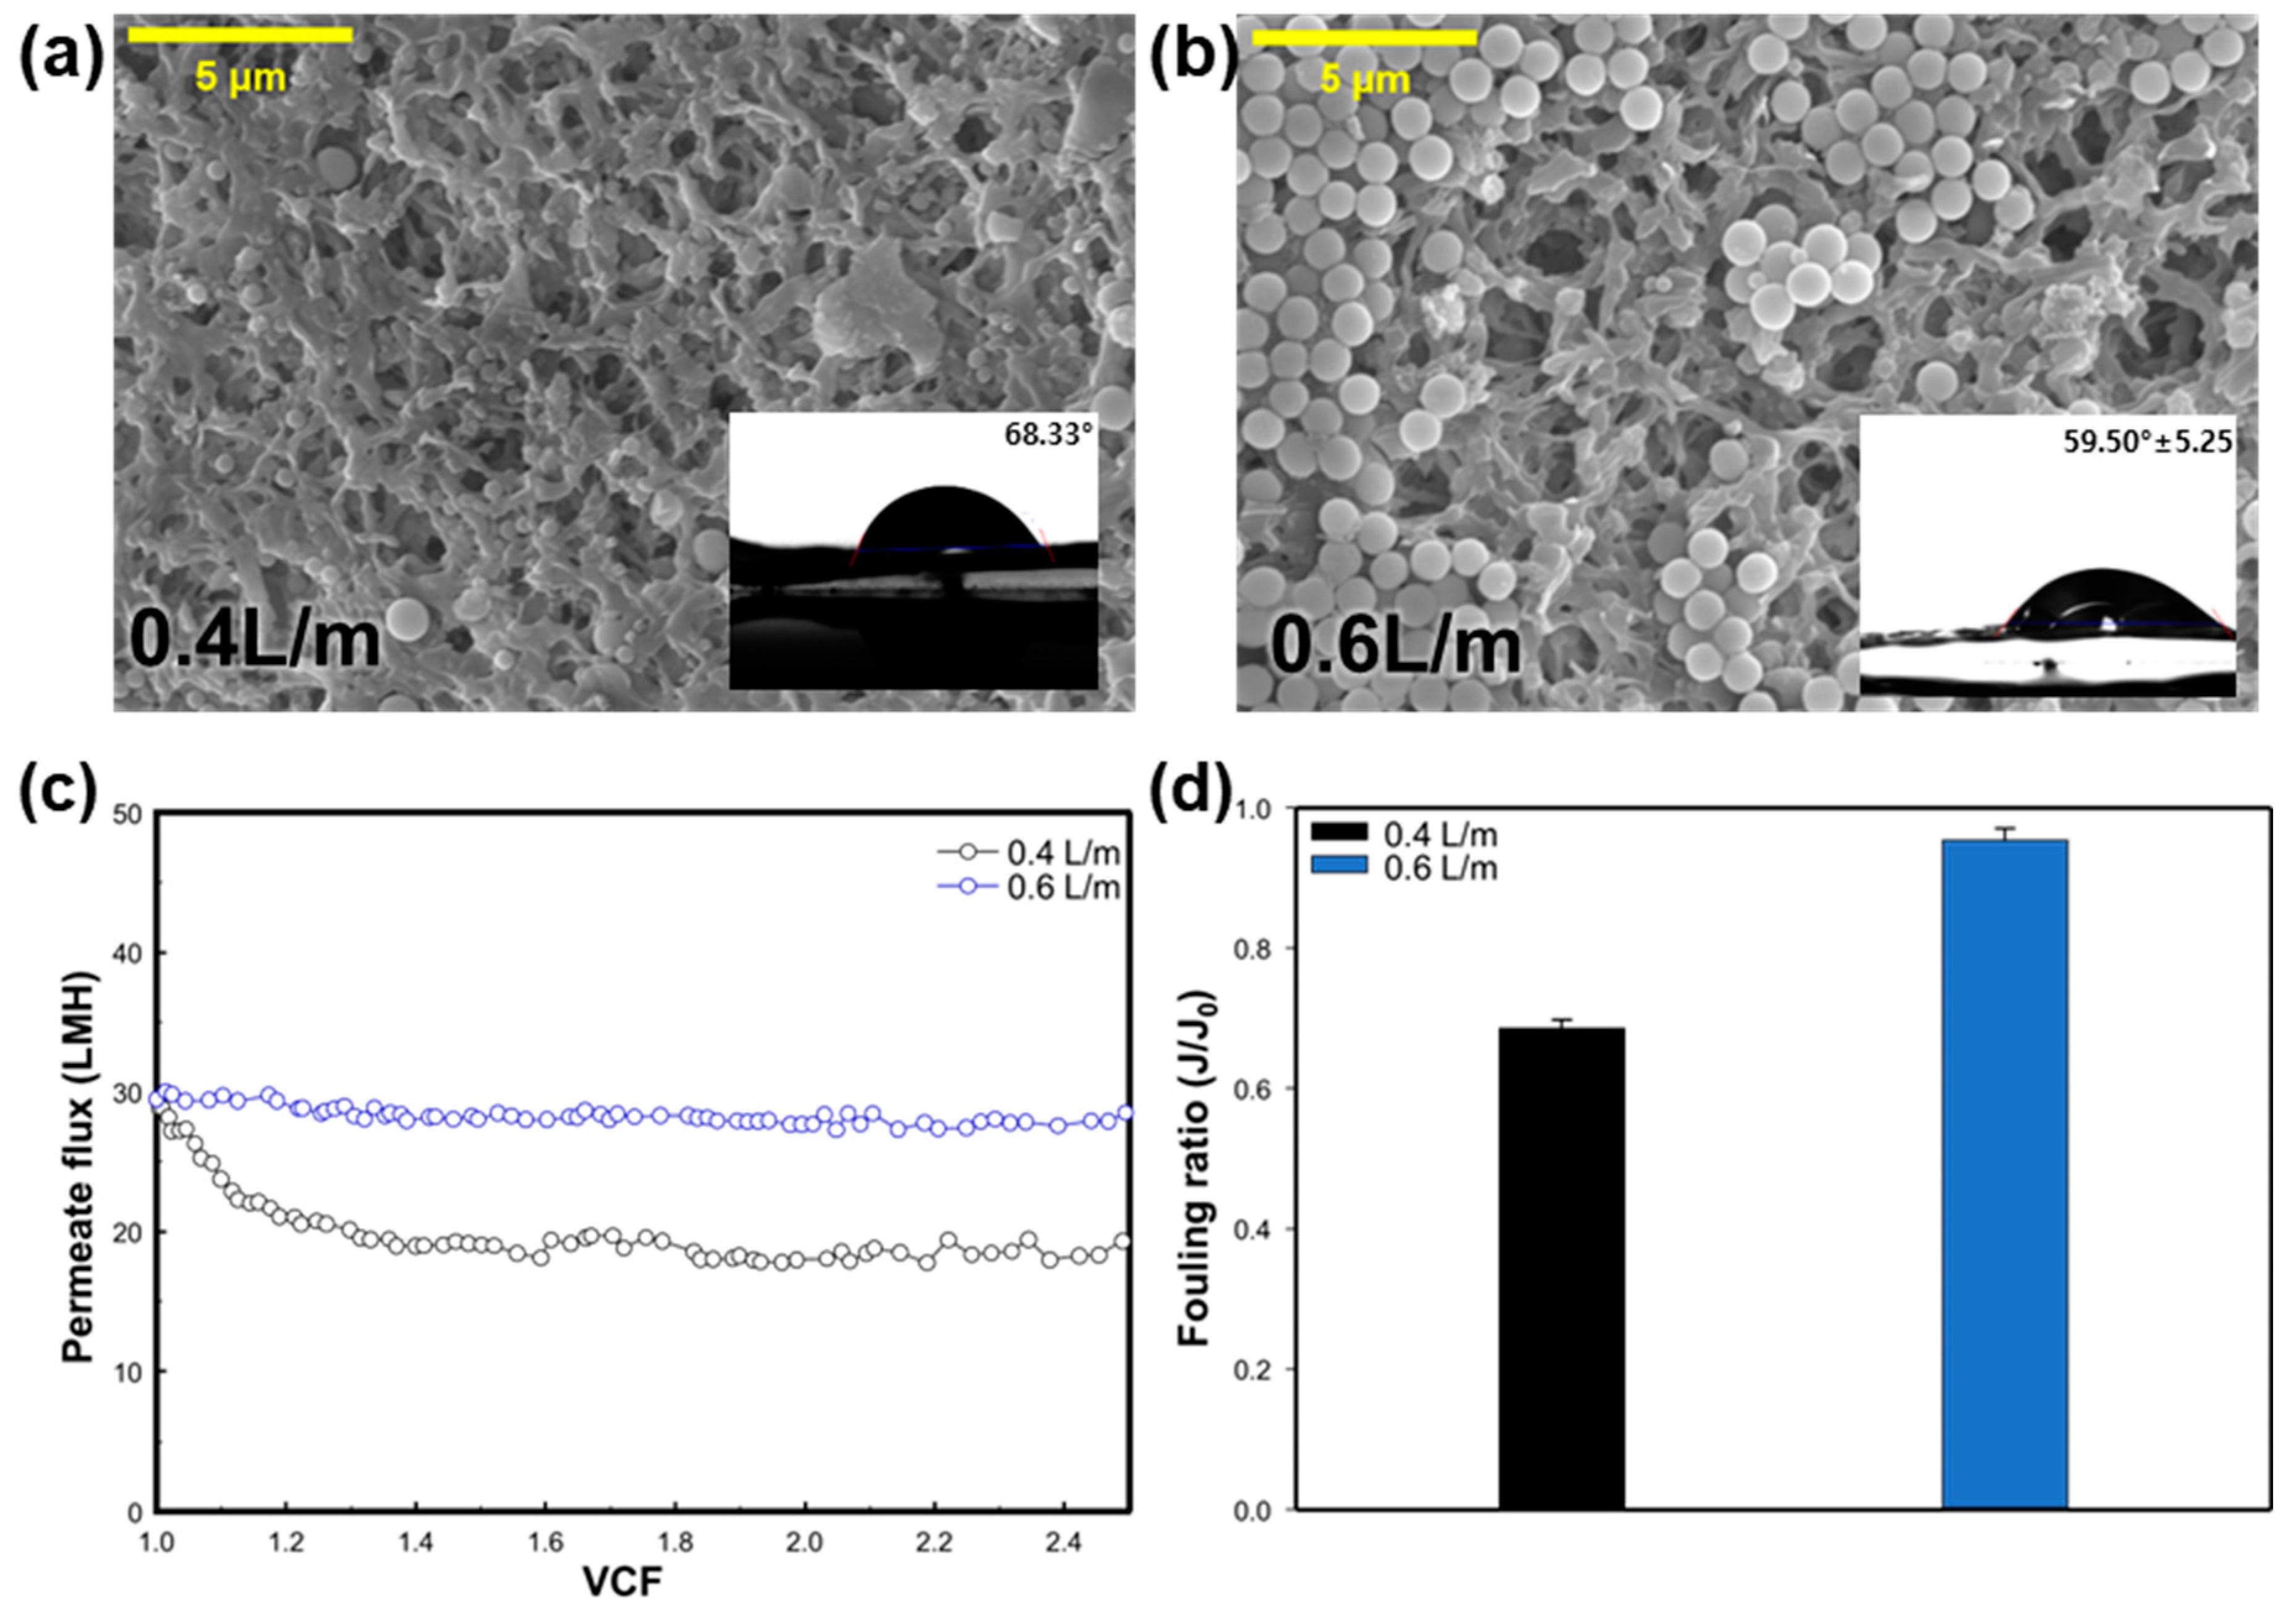
3.2.3. Effect of the Flow Rate
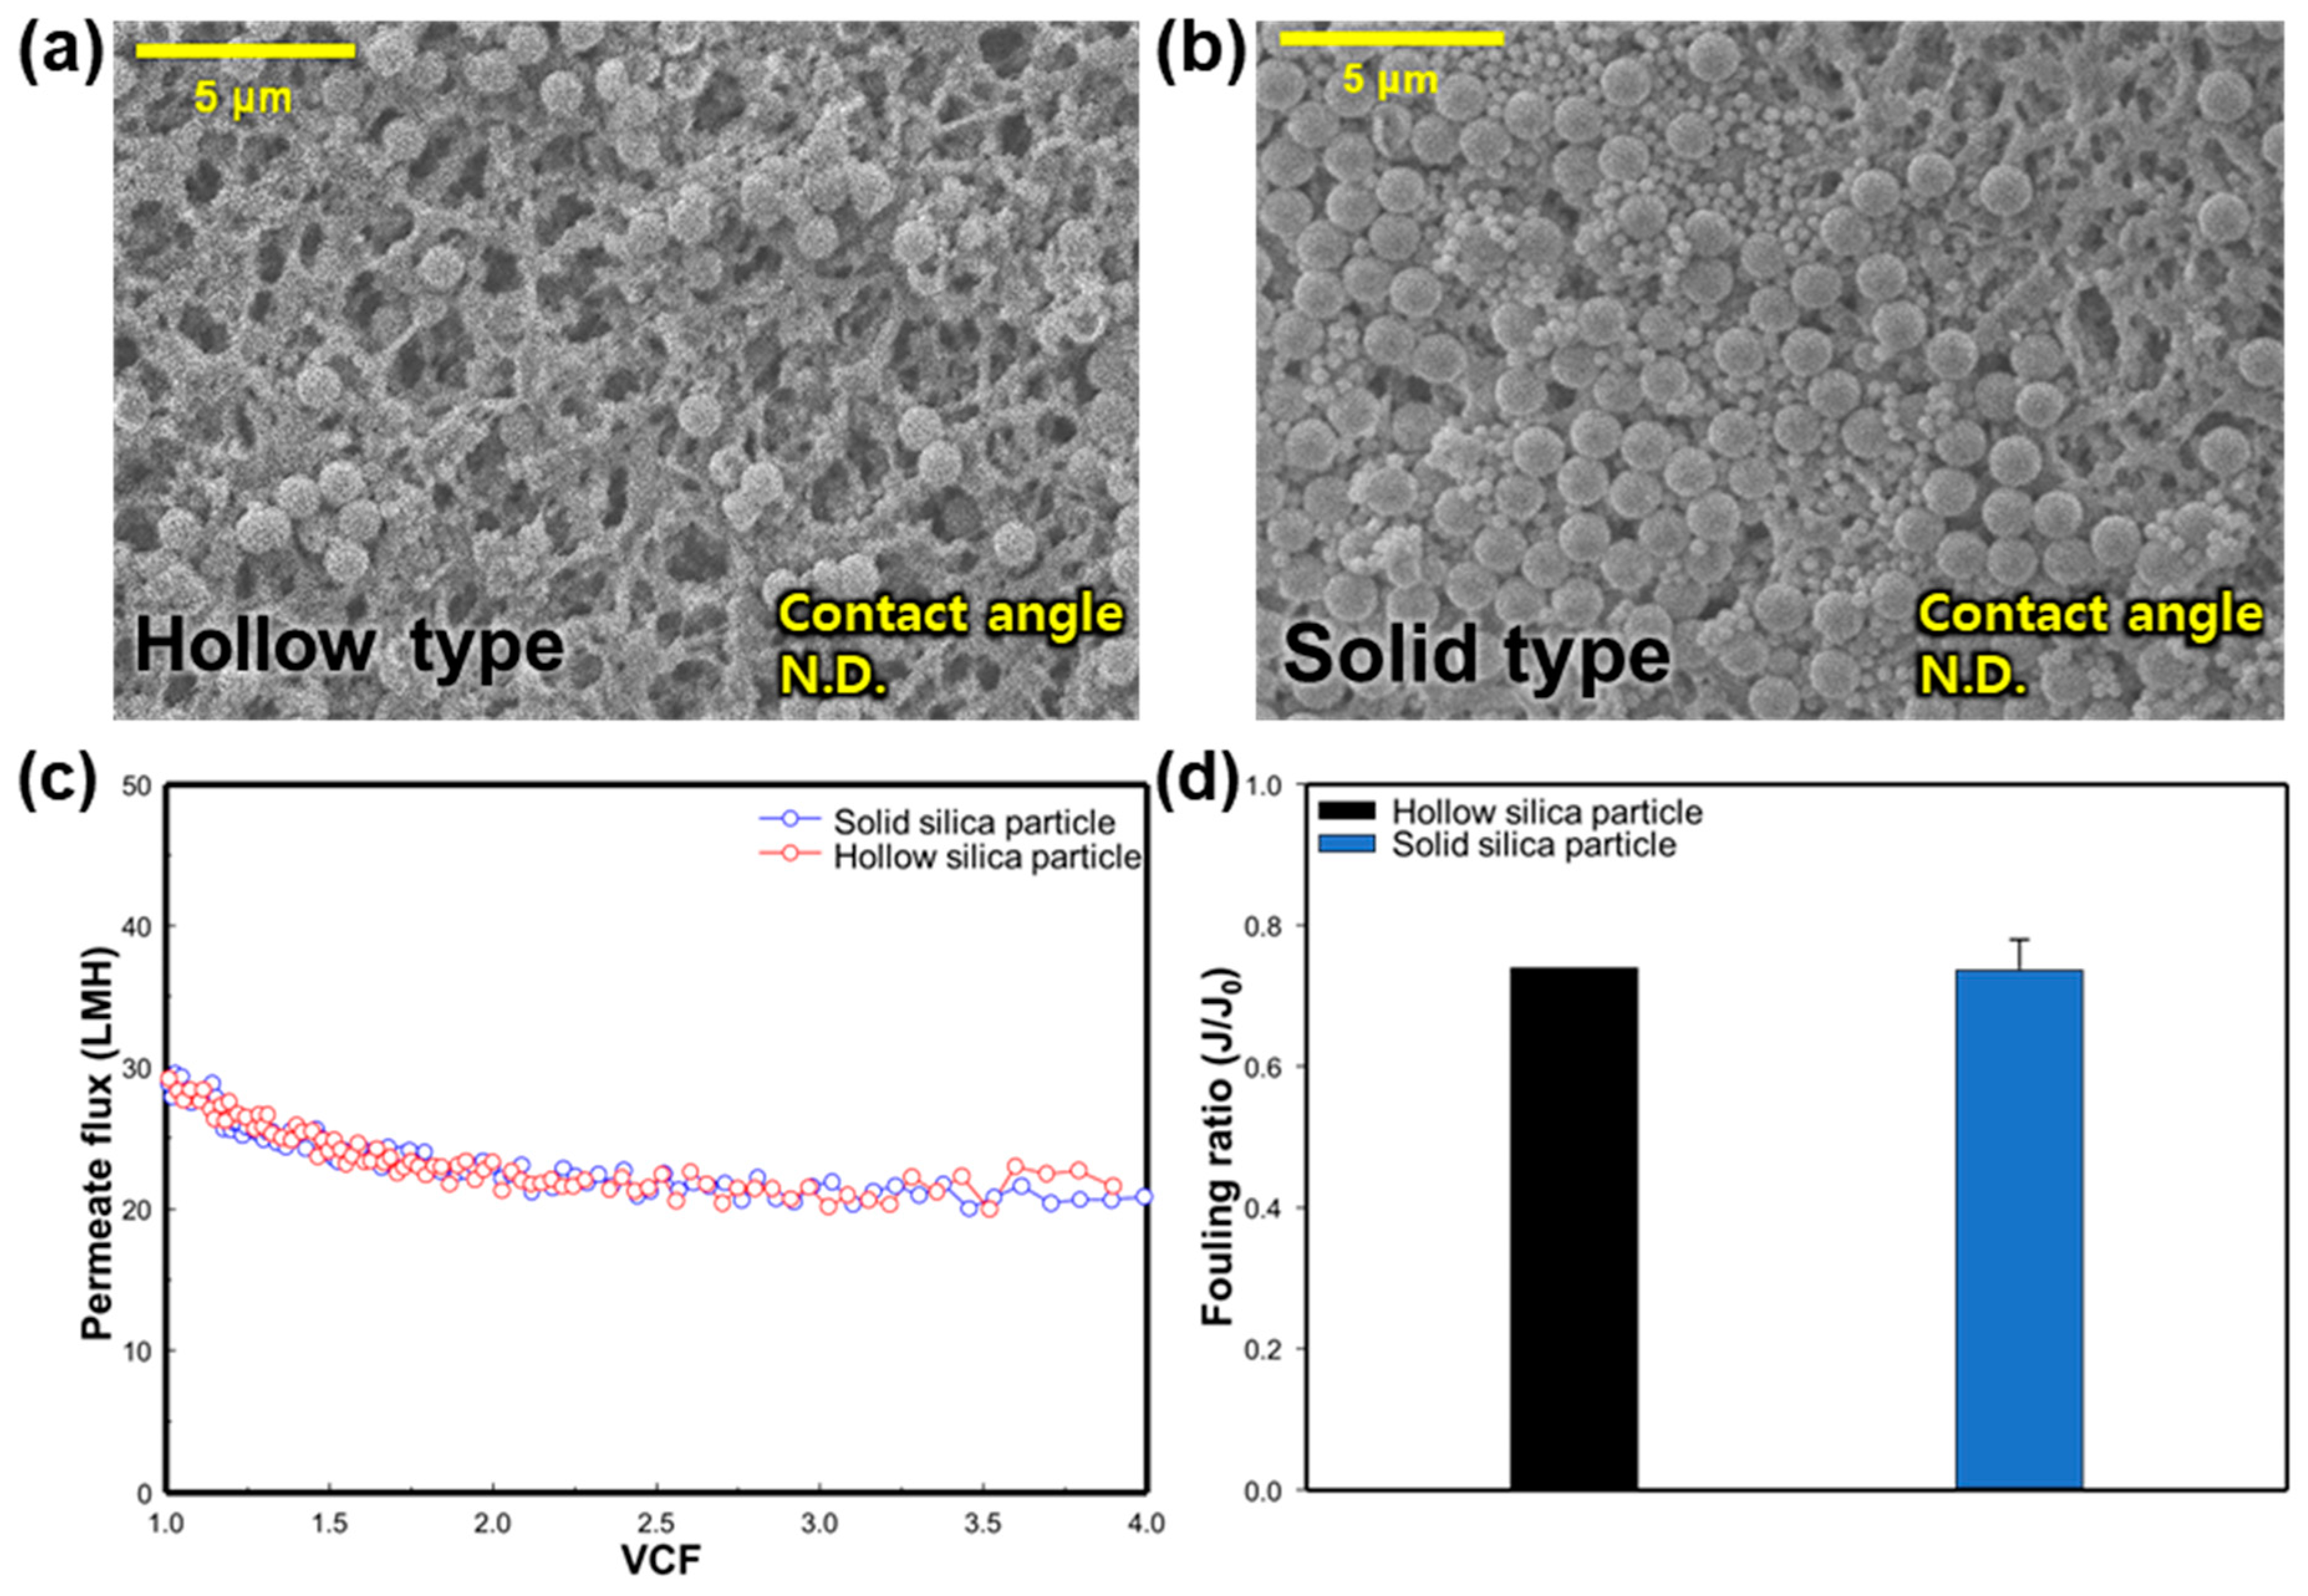
3.2.4. Effect of SNP Type
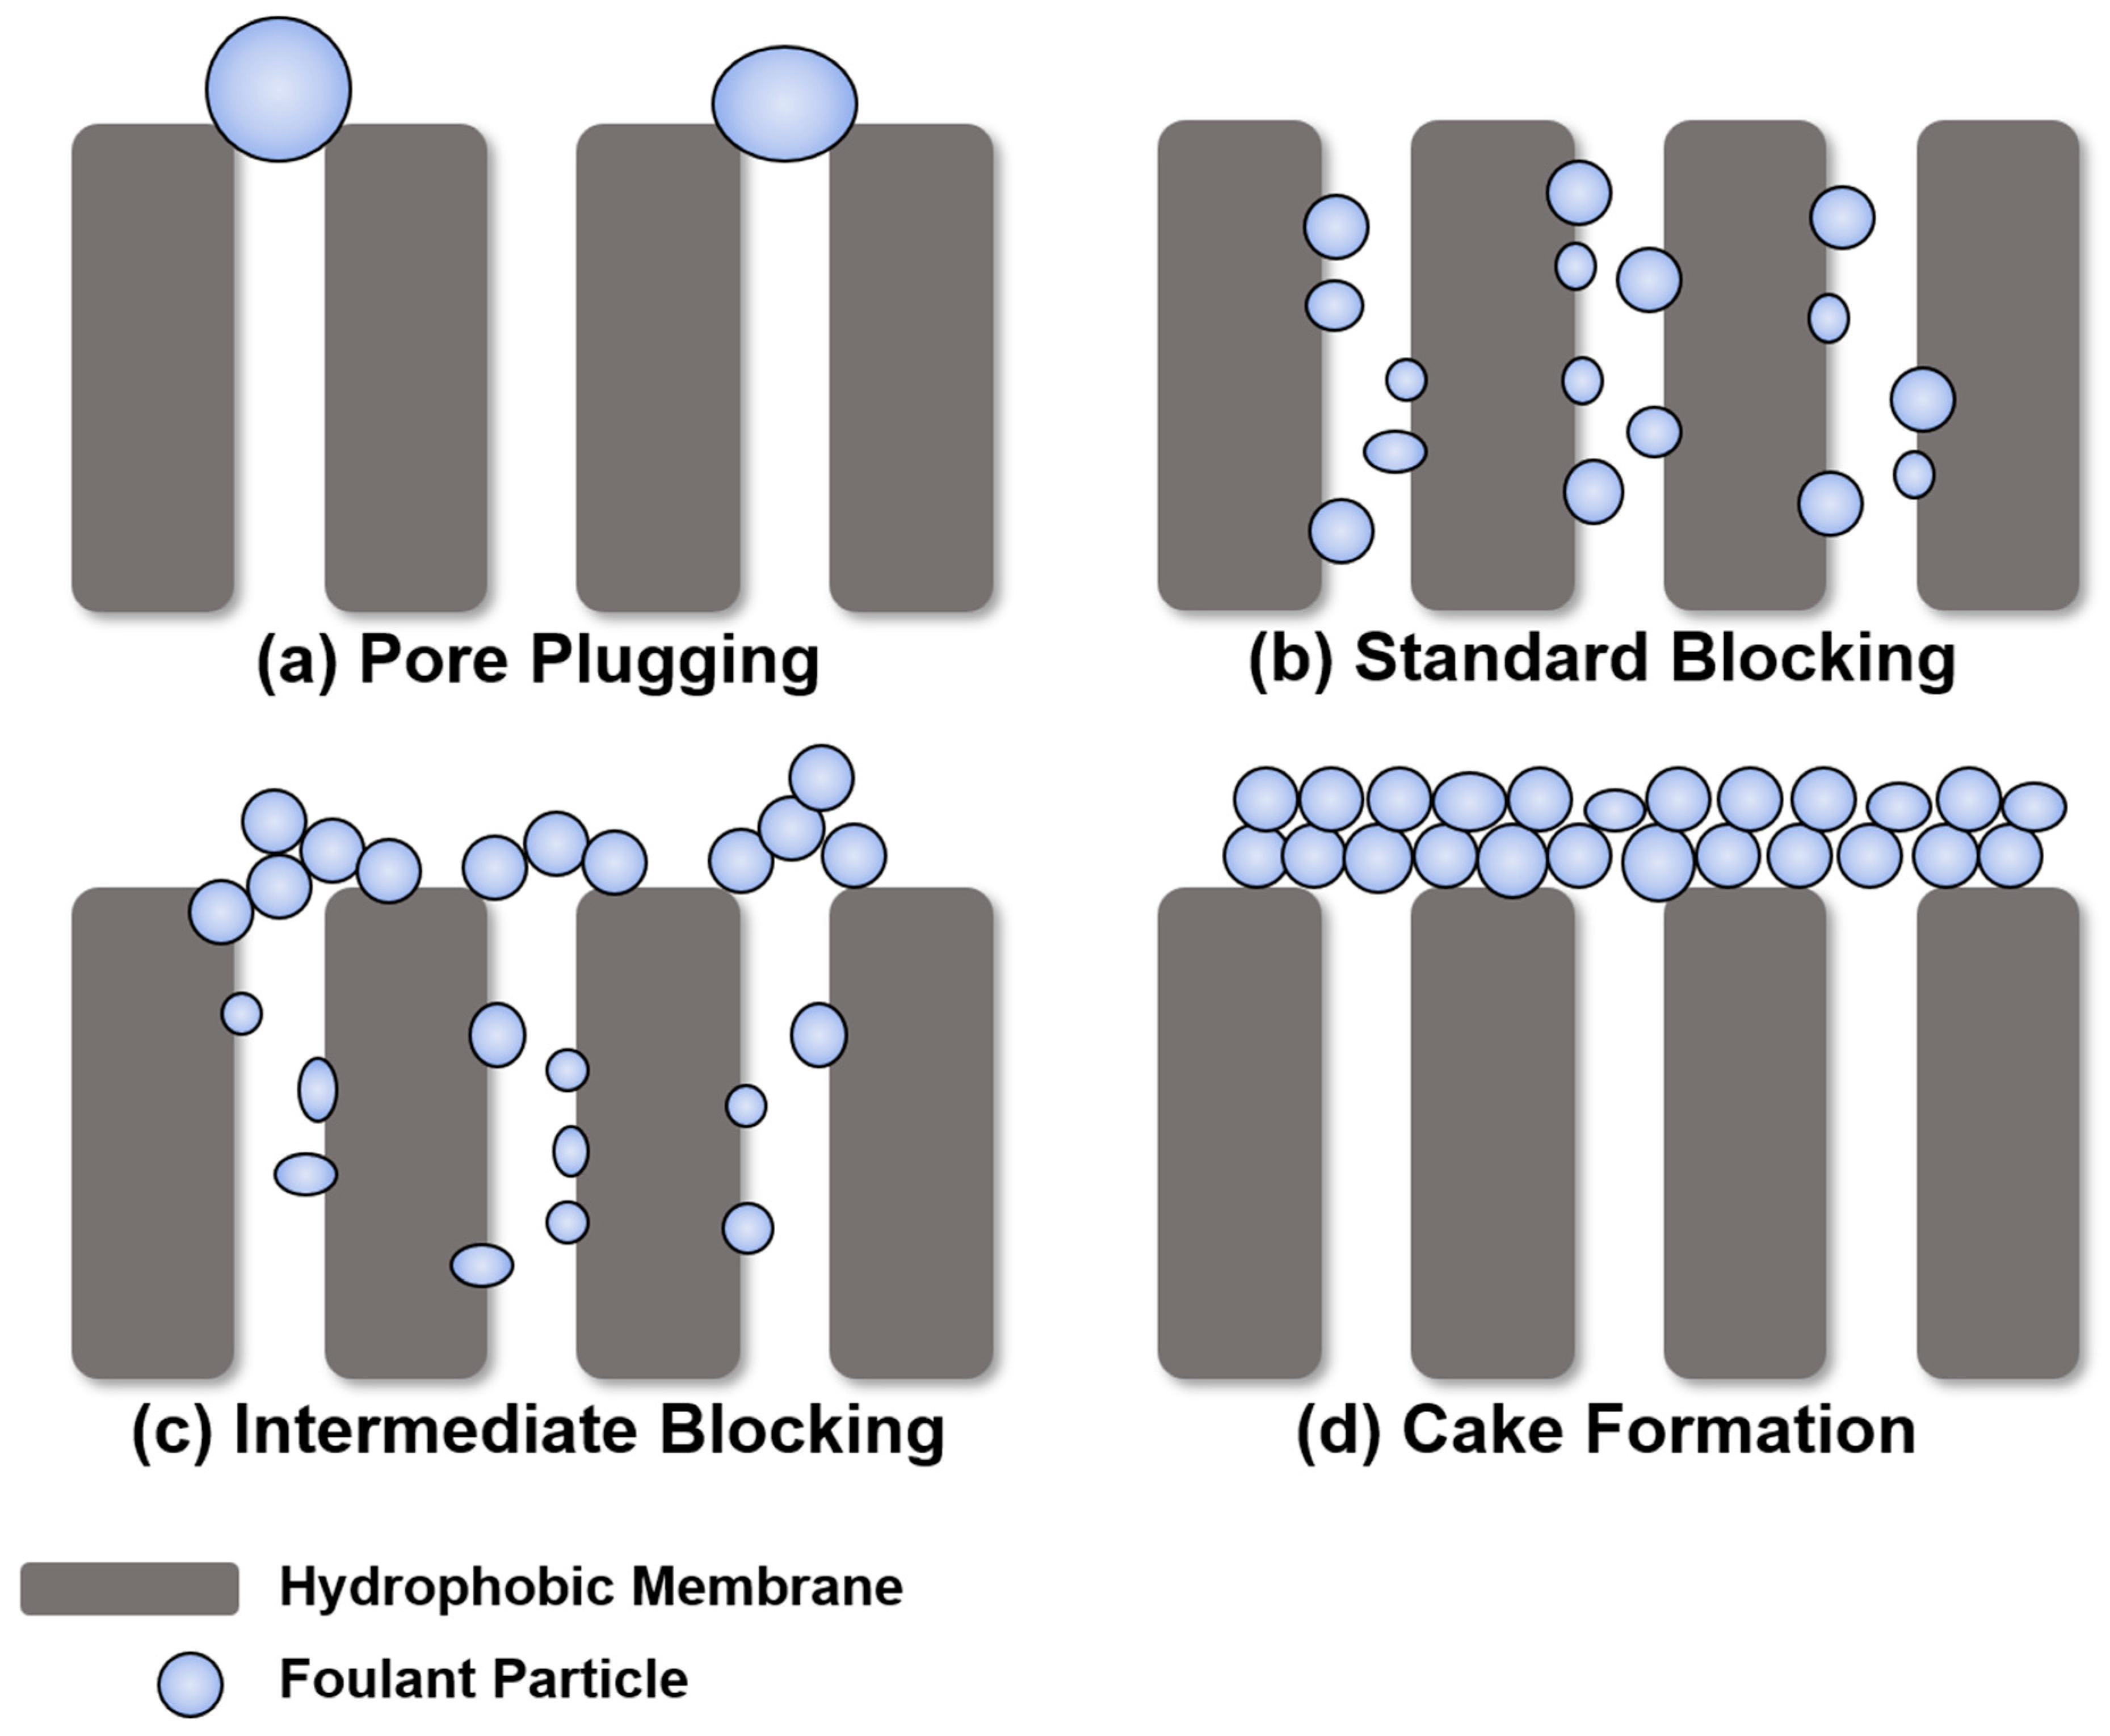
3.3. Possible Mechanism and Fouling Control Strategy
4. Conclusions
- As the feed water temperature increases, the initial permeate flux also increases due to a higher vapor pressure difference. However, the flux decline also accelerates, and membrane fouling intensifies with higher feed water temperatures.
- During the examination of the SNP size, smaller particles were found to have a more significant impact on membrane fouling due to their similarity to the pore size of the membrane.
- Under 0.4 L/min and 0.6 L/min flow rate conditions, the Reynolds number was greater than 4000, indicating a turbulent flow. As the turbulence increases, the fouling rate decreases. Therefore, a faster flow rate impedes the SNPs from accumulating on the membrane surface.
- Regarding the SNP type, the results showed similar flux and fouling patterns for both solid and hollow-type SNPs.
Author Contributions
Funding
Institutional Review Board Statement
Data Availability Statement
Conflicts of Interest
References
- Eckardt, N.A.; Cominelli, E.; Galbiati, M.; Tonelli, C. The Future of Science: Food and Water for Life; American Society of Plant Biologists: Rockville, MD, USA, 2009. [Google Scholar]
- Parfit, M.; Graves, W. Water: The Power, Promise, and Turmoil of North America’s Fresh Water; National Geographic Society: Washington, DC, USA, 1993. [Google Scholar]
- Khawaji, A.D.; Kutubkhanah, I.K.; Wie, J.-M. Advances in seawater desalination technologies. Desalination 2008, 221, 47–69. [Google Scholar] [CrossRef]
- Hsu, S.; Cheng, K.; Chiou, J.-S. Seawater desalination by direct contact membrane distillation. Desalination 2002, 143, 279–287. [Google Scholar] [CrossRef]
- Al-Obaidani, S.; Curcio, E.; Macedonio, F.; Di Profio, G.; Al-Hinai, H.; Drioli, E. Potential of membrane distillation in seawater desalination: Thermal efficiency, sensitivity study and cost estimation. J. Membr. Sci. 2008, 323, 85–98. [Google Scholar] [CrossRef]
- Shirazi, M.M.A.; Kargari, A.; Shirazi, M.J.A. Direct contact membrane distillation for seawater desalination. Desalin. Water Treat. 2012, 49, 368–375. [Google Scholar] [CrossRef]
- Molinari, R.; Argurio, P.; Bellardita, M.; Palmisano, L.; Bertoni, C. Photocatalytic processes in membrane reactors. In Comprehensive Membrane Science and Engineering, 2nd ed.; Elsevier: Amsterdam, The Netherlands, 2017. [Google Scholar]
- Lyngbye, M.; Hansen, M.J.; Jonassen, K.E. New air purification system for pig production units based on membrane technology. In Proceedings of the Livestock Environment VIII, Iguassu Falls, Brazil, 31 August–4 September 2008; American Society of Agricultural and Biological Engineers: St. Joseph, MI, USA, 2008. [Google Scholar]
- Usachov, V.V.; Teplyakov, V.V.; Okunev, A.Y.; Laguntsov, N.I. Membrane contactor air conditioning system: Experience and prospects. Sep. Purif. Technol. 2007, 57, 502–506. [Google Scholar] [CrossRef]
- Bergero, S.; Chiari, A. Experimental and theoretical analysis of air humidification/dehumidification processes using hydrophobic capillary contactors. Appl. Therm. Eng. 2001, 21, 1119–1135. [Google Scholar] [CrossRef]
- Ha, S.; Lee, J.; Jeong, S.; Jeong, S. Fouling Control Strategies for High Concentrated Liquid Desiccants Concentrating Using Membrane Distillation. Membranes 2023, 13, 222. [Google Scholar] [CrossRef]
- Mohammadi, T.; Madaeni, S.S.; Moghadam, M.K. Investigation of membrane fouling. Desalination 2003, 153, 155–160. [Google Scholar] [CrossRef]
- Alkhatib, A.; Ayari, M.A.; Hawari, A.H. Fouling mitigation strategies for different foulants in membrane distillation. Chem. Eng. Process.-Process Intensif. 2021, 167, 108517. [Google Scholar] [CrossRef]
- Jang, Y.; Lee, J.-G.; Fortunato, L.; Lee, J.; Lee, Y.; An, A.K.; Ghaffour, N.; Lee, S.; Jeong, S. Colloidal silica fouling mechanism in direct-contact membrane distillation. Desalination 2022, 527, 115554. [Google Scholar] [CrossRef]
- Horseman, T.; Yin, Y.; Christie, K.S.S.; Wang, Z.; Tong, T.; Lin, S. Wetting, Scaling, and Fouling in Membrane Distillation: State-of-the-Art Insights on Fundamental Mechanisms and Mitigation Strategies. ACS EST Eng. 2021, 1, 117–140. [Google Scholar] [CrossRef]
- Yu, X.; Yang, H.; Lei, H.; Shapiro, A. Experimental evaluation on concentrating cooling tower blowdown water by direct contact membrane distillation. Desalination 2013, 323, 134–141. [Google Scholar] [CrossRef]
- Gilron, J.; Ladizansky, Y.; Korin, E. Silica Fouling in Direct Contact Membrane Distillation. Ind. Eng. Chem. Res. 2013, 52, 10521–10529. [Google Scholar] [CrossRef]
- Tijing, L.D.; Woo, Y.C.; Choi, J.-S.; Lee, S.; Kim, S.-H.; Shon, H.K. Fouling and its control in membrane distillation—A review. J. Membr. Sci. 2015, 475, 215–244. [Google Scholar] [CrossRef]
- Naidu, G.; Choi, Y.; Jeong, S.; Hwang, T.M.; Vigneswaran, S. Experiments and modeling of a vacuum membrane distillation for high saline water. J. Ind. Eng. Chem. 2014, 20, 2174–2183. [Google Scholar] [CrossRef]
- Khayet, M. Membranes and theoretical modeling of membrane distillation: A review. Adv. Colloid Interface Sci. 2011, 164, 56–88. [Google Scholar] [CrossRef]
- Suga, Y.; Takagi, R.; Matsuyama, H. Effect of the Characteristic Properties of Membrane on Long-Term Stability in the Vacuum Membrane Distillation Process. Membranes 2021, 11, 252. [Google Scholar] [CrossRef] [PubMed]
- Lee, J.-G.; Kim, W.-S. Numerical modeling of the vacuum membrane distillation process. Desalination 2013, 331, 46–55. [Google Scholar] [CrossRef]
- Ramon, G.; Agnon, Y.; Dosoretz, C. Heat transfer in vacuum membrane distillation: Effect of velocity slip. J. Membr. Sci. 2009, 331, 117–125. [Google Scholar] [CrossRef]
- Abu-Zeid, M.A.E.-R.; Zhang, Y.; Dong, H.; Zhang, L.; Chen, H.-L.; Hou, L. A comprehensive review of vacuum membrane distillation technique. Desalination 2015, 356, 1–14. [Google Scholar] [CrossRef]
- Lee, H.; Lee, J. Electrochemical Characteristics of Porous Silicon/Carbon Composite Anode Using Spherical Nano Silica. Korean Chem. Eng. Res. 2016, 54, 459–464. [Google Scholar] [CrossRef]
- Lee, H.-L.; Park, J.H.; Choe, H.-S.; Lee, M.-S.; Park, J.-M.; Harada, N.; Sasaki, Y.; Yanai, N.; Kimizuka, N.; Zhu, J.; et al. Upconverting Oil-Laden Hollow Mesoporous Silica Microcapsules for Anti-Stokes-Based Biophotonic Applications. ACS Appl. Mater. Interfaces 2019, 11, 26571–26580. [Google Scholar] [CrossRef]
- Lay, H.T.; Wang, R.; Chew, J.W. Influence of foulant particle shape on membrane fouling in dead-end microfiltration. J. Membr. Sci. 2022, 647, 120265. [Google Scholar] [CrossRef]
- Alklaibi, A.M.; Lior, N. Membrane-distillation desalination: Status and potential. Desalination 2005, 171, 111–131. [Google Scholar] [CrossRef]
- Saffarini, R.B.; Mansoor, B.; Thomas, R.; Arafat, H.A. Effect of temperature-dependent microstructure evolution on pore wetting in PTFE membranes under membrane distillation conditions. J. Membr. Sci. 2013, 429, 282–294. [Google Scholar] [CrossRef]
- Laqbaqbi, M.; Sanmartino, J.A.; Khayet, M.; García-Payo, C.; Chaouch, M. Fouling in membrane distillation, osmotic distillation and osmotic membrane distillation. Appl. Sci. 2017, 7, 334. [Google Scholar] [CrossRef]
- Weirich, M.; Antonyuk, S. Monitoring of Particulate Fouling Potential of Feed Water with Spectroscopic Measurements. Membranes 2023, 13, 664. [Google Scholar] [CrossRef] [PubMed]
- Pourbozorg, M.; Li, T.; Law, A.W.K. Effect of turbulence on fouling control of submerged hollow fibre membrane filtration. Water Res. 2016, 99, 101–111. [Google Scholar] [CrossRef] [PubMed]
- Ve, Q.L.; Koirala, R.; Bawahab, M.; Faqeha, H.; Do, M.C.; Nguyen, Q.L.; Date, A.; Akbarzadeh, A. Experimental investigation of the effect of the spacer and operating conditions on mass transfer in direct contact membrane distillation. Desalination 2021, 500, 114839. [Google Scholar] [CrossRef]
- Rajabzadeh, A. Membrane Fouling During Hollow Fiber Ultrafiltration of Protein Solutions: Computational Fluid Modeling and Physicochemical Properties; University of Waterloo: Waterloo, ON, Canada, 2010. [Google Scholar]
- Aliasghari, M.; Mirsaeedghazi, H.; Aboonajmi, M.; Kianmehr, M.H. Effect of ultrasound on different mechanisms of fouling during membrane clarification of pomegranate juice. Innov. Food Sci. Emerg. Technol. 2015, 30, 127–131. [Google Scholar] [CrossRef]
- Zainol Abidin, M.N.; Nasef, M.; Matsuura, T. Fouling Prevention in Polymeric Membranes by Radiation Induced Graft Copolymerization. Polymers 2022, 14, 197. [Google Scholar] [CrossRef] [PubMed]
- Pizzichetti, A.R.P.; Pablos, C.; Álvarez-Fernández, C.; Reynolds, K.; Stanley, S.; Marugán, J. Kinetic and mechanistic analysis of membrane fouling in microplastics removal from water by dead-end microfiltration. J. Environ. Chem. Eng. 2023, 11, 109338. [Google Scholar] [CrossRef]
- Guo, W.; Ngo, H.-H.; Li, J. A mini-review on membrane fouling. Bioresour. Technol. 2012, 122, 27–34. [Google Scholar] [CrossRef] [PubMed]
- Huang, H.; Spinette, R.; O’Melia, C.R. Direct-flow microfiltration of aquasols: I. Impacts of particle stabilities and size. J. Membr. Sci. 2008, 314, 90–100. [Google Scholar] [CrossRef]
- Salahi, A.; Mohammadi, T.; Rahmat Pour, A.; Rekabdar, F. Oily wastewater treatment using ultrafiltration. Desalin. Water Treat. 2009, 6, 289–298. [Google Scholar] [CrossRef]


| No. | Type of Silica (Size) | Feed Temp. (°C) | Flow Rate (L/min) | |
|---|---|---|---|---|
| Effect of temperature | E1 | Solid type (900 nm) | 60 | 0.4 |
| E2 | 70 | |||
| E3 | 80 | |||
| Effect of silica size | E4 | Solid type (400 nm) | 70 | 0.4 |
| E5 | Solid type (1300 nm) | |||
| Effect of flow rate | E6 | Solid type (900 nm) | 70 | 0.6 |
| Effect of silica type | E7 | Hollow type (900 nm) | 70 | 0.4 |
Disclaimer/Publisher’s Note: The statements, opinions and data contained in all publications are solely those of the individual author(s) and contributor(s) and not of MDPI and/or the editor(s). MDPI and/or the editor(s) disclaim responsibility for any injury to people or property resulting from any ideas, methods, instructions or products referred to in the content. |
© 2024 by the authors. Licensee MDPI, Basel, Switzerland. This article is an open access article distributed under the terms and conditions of the Creative Commons Attribution (CC BY) license (https://creativecommons.org/licenses/by/4.0/).
Share and Cite
Lee, Y.; Jeong, S.; Kim, J.-H.; Jeong, S. Mechanism of Silica Nanoparticle-Induced Particulate Fouling in Vacuum Membrane Distillation. Membranes 2024, 14, 76. https://doi.org/10.3390/membranes14040076
Lee Y, Jeong S, Kim J-H, Jeong S. Mechanism of Silica Nanoparticle-Induced Particulate Fouling in Vacuum Membrane Distillation. Membranes. 2024; 14(4):76. https://doi.org/10.3390/membranes14040076
Chicago/Turabian StyleLee, Yejin, Suyoung Jeong, Jae-Hyuk Kim, and Sanghyun Jeong. 2024. "Mechanism of Silica Nanoparticle-Induced Particulate Fouling in Vacuum Membrane Distillation" Membranes 14, no. 4: 76. https://doi.org/10.3390/membranes14040076