
Efficiency of Fabricated Adsorptive Polysulfone Mixed Matrix Membrane for Acetic Acid Separation

 ,
,  , , , , ,
  and
and 
Abstract
:1. Introduction
2. Materials and Methods
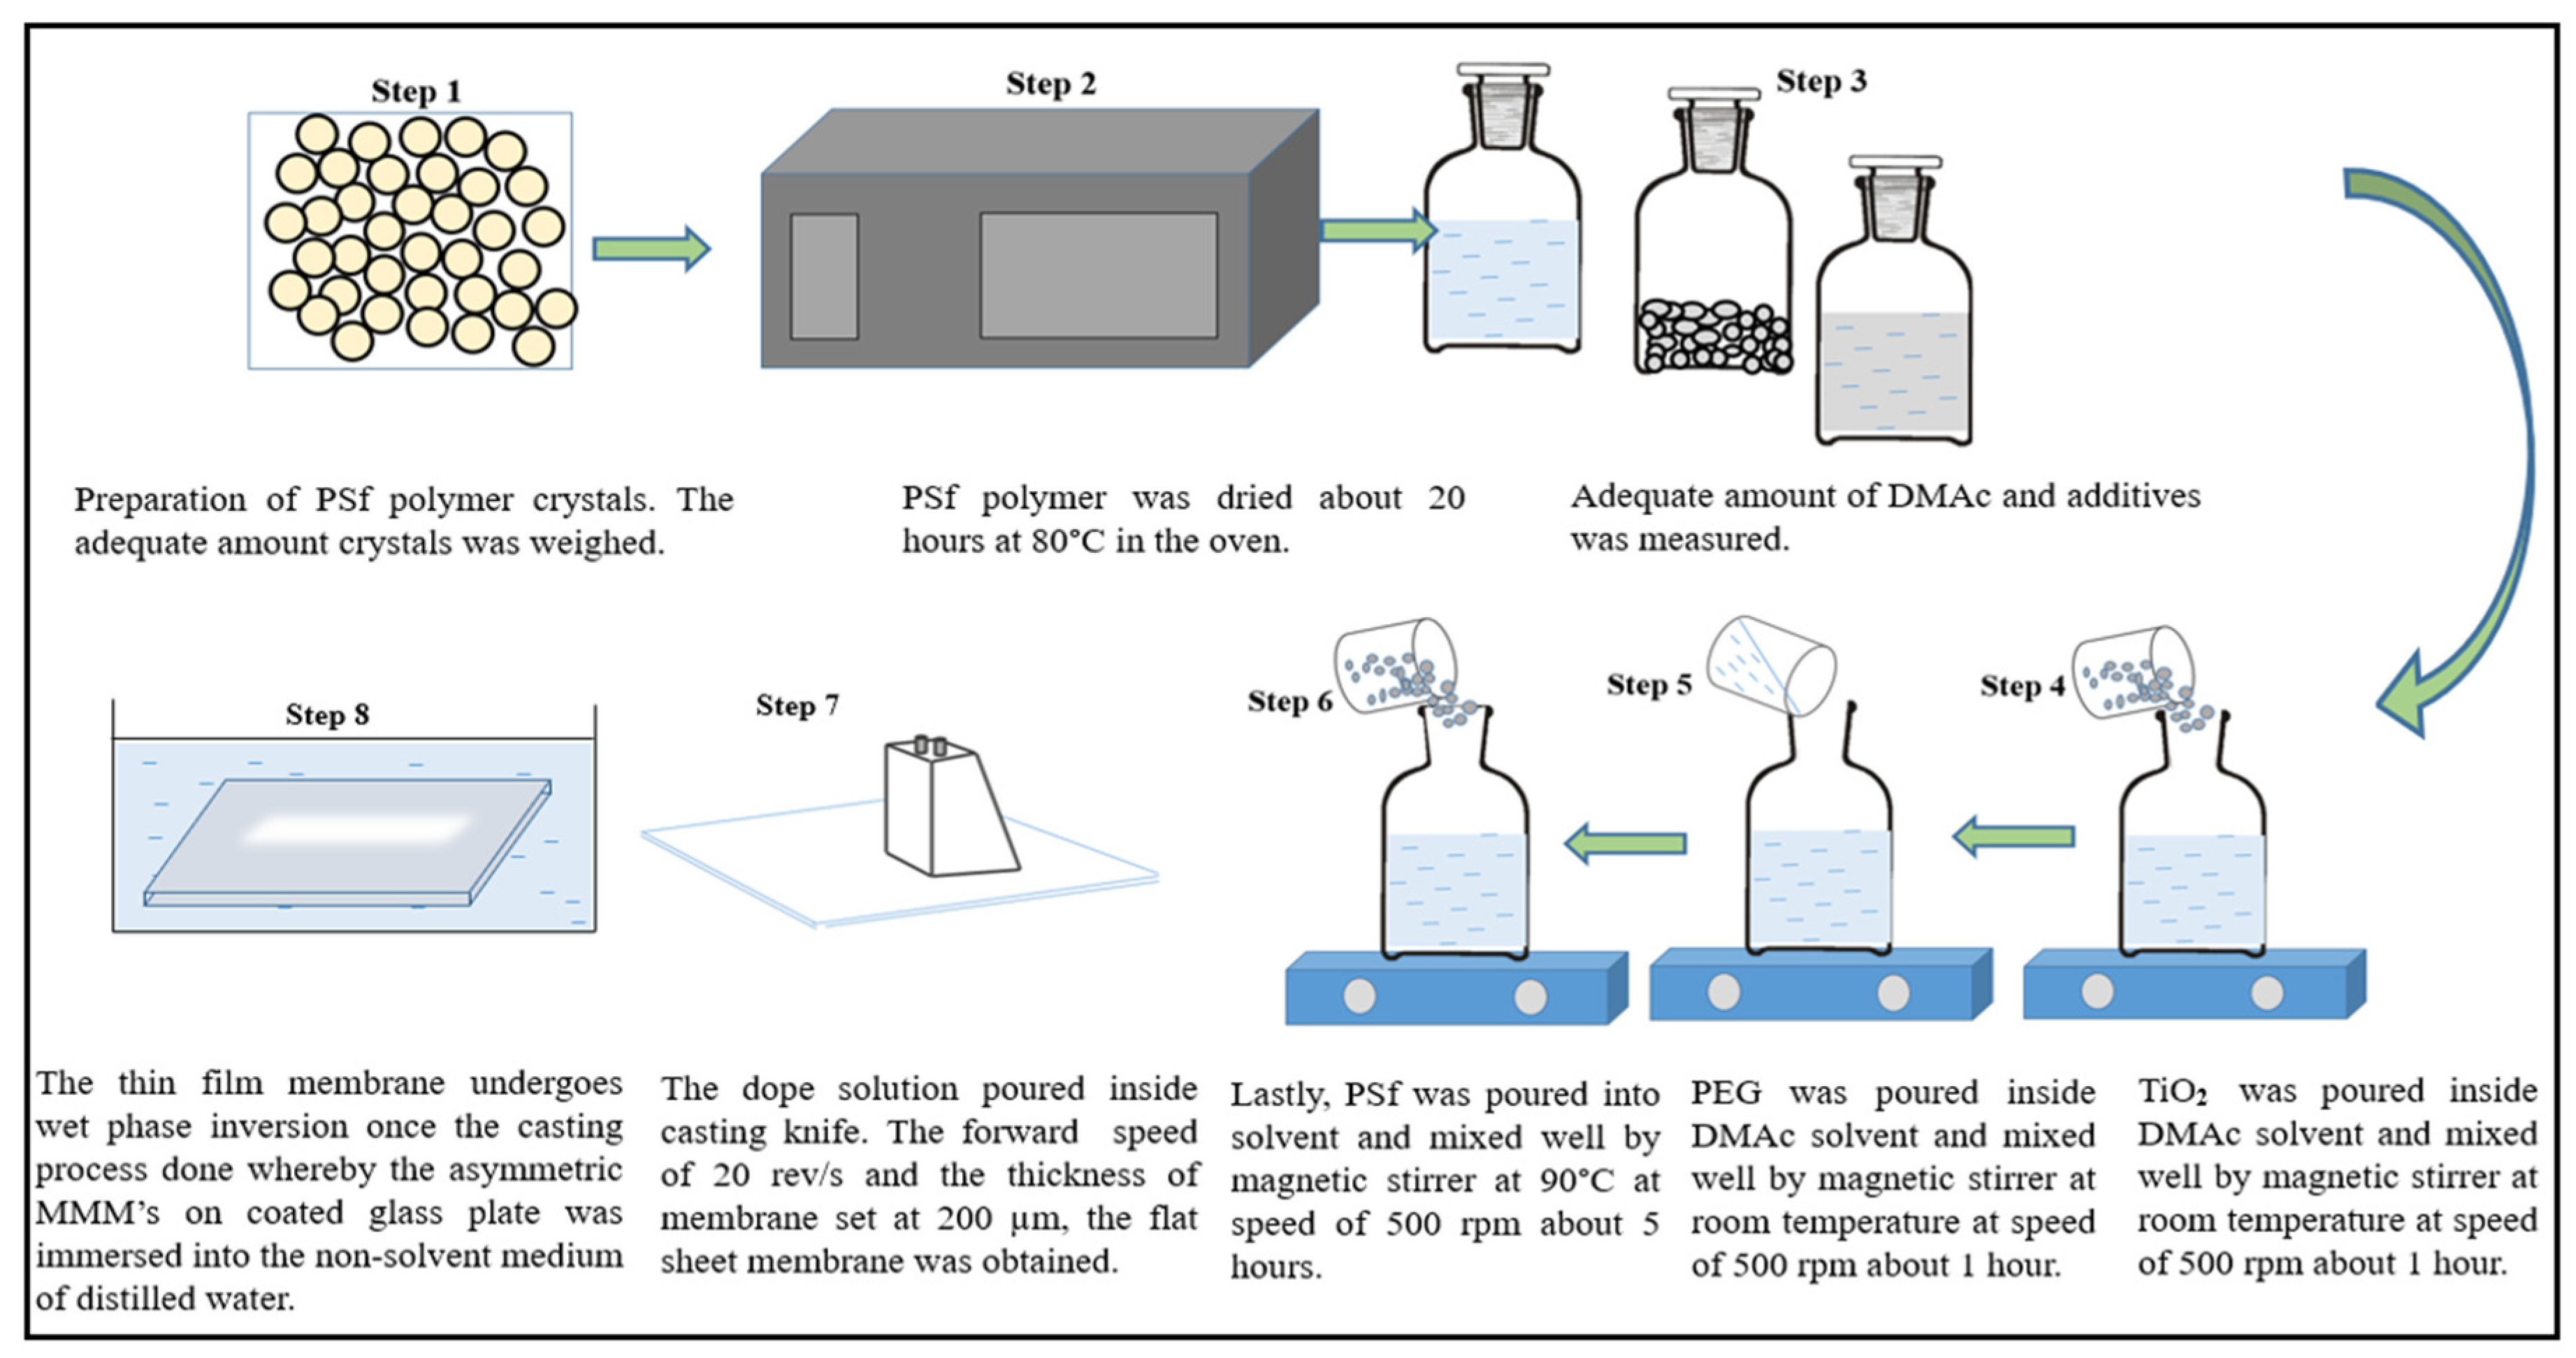
2.1. Fabrication of Polysulfone Mixed Matrix Membrane (PSf MMMs)

2.2. Characterization of Fabricated Ultrafiltration Polysulfone Mixed Matrix Membranes (PSf MMMs)
2.2.1. Physical Characterization
Scanning Electron Microscopy (SEM)
Contact Angle (CA) Evaluation
Porosity
Mean Pore Size of Membrane
2.2.2. Chemical Characterization
Fourier Transform Infrared Spectroscopy (FTIR)
X-ray Diffractometer (XRD)
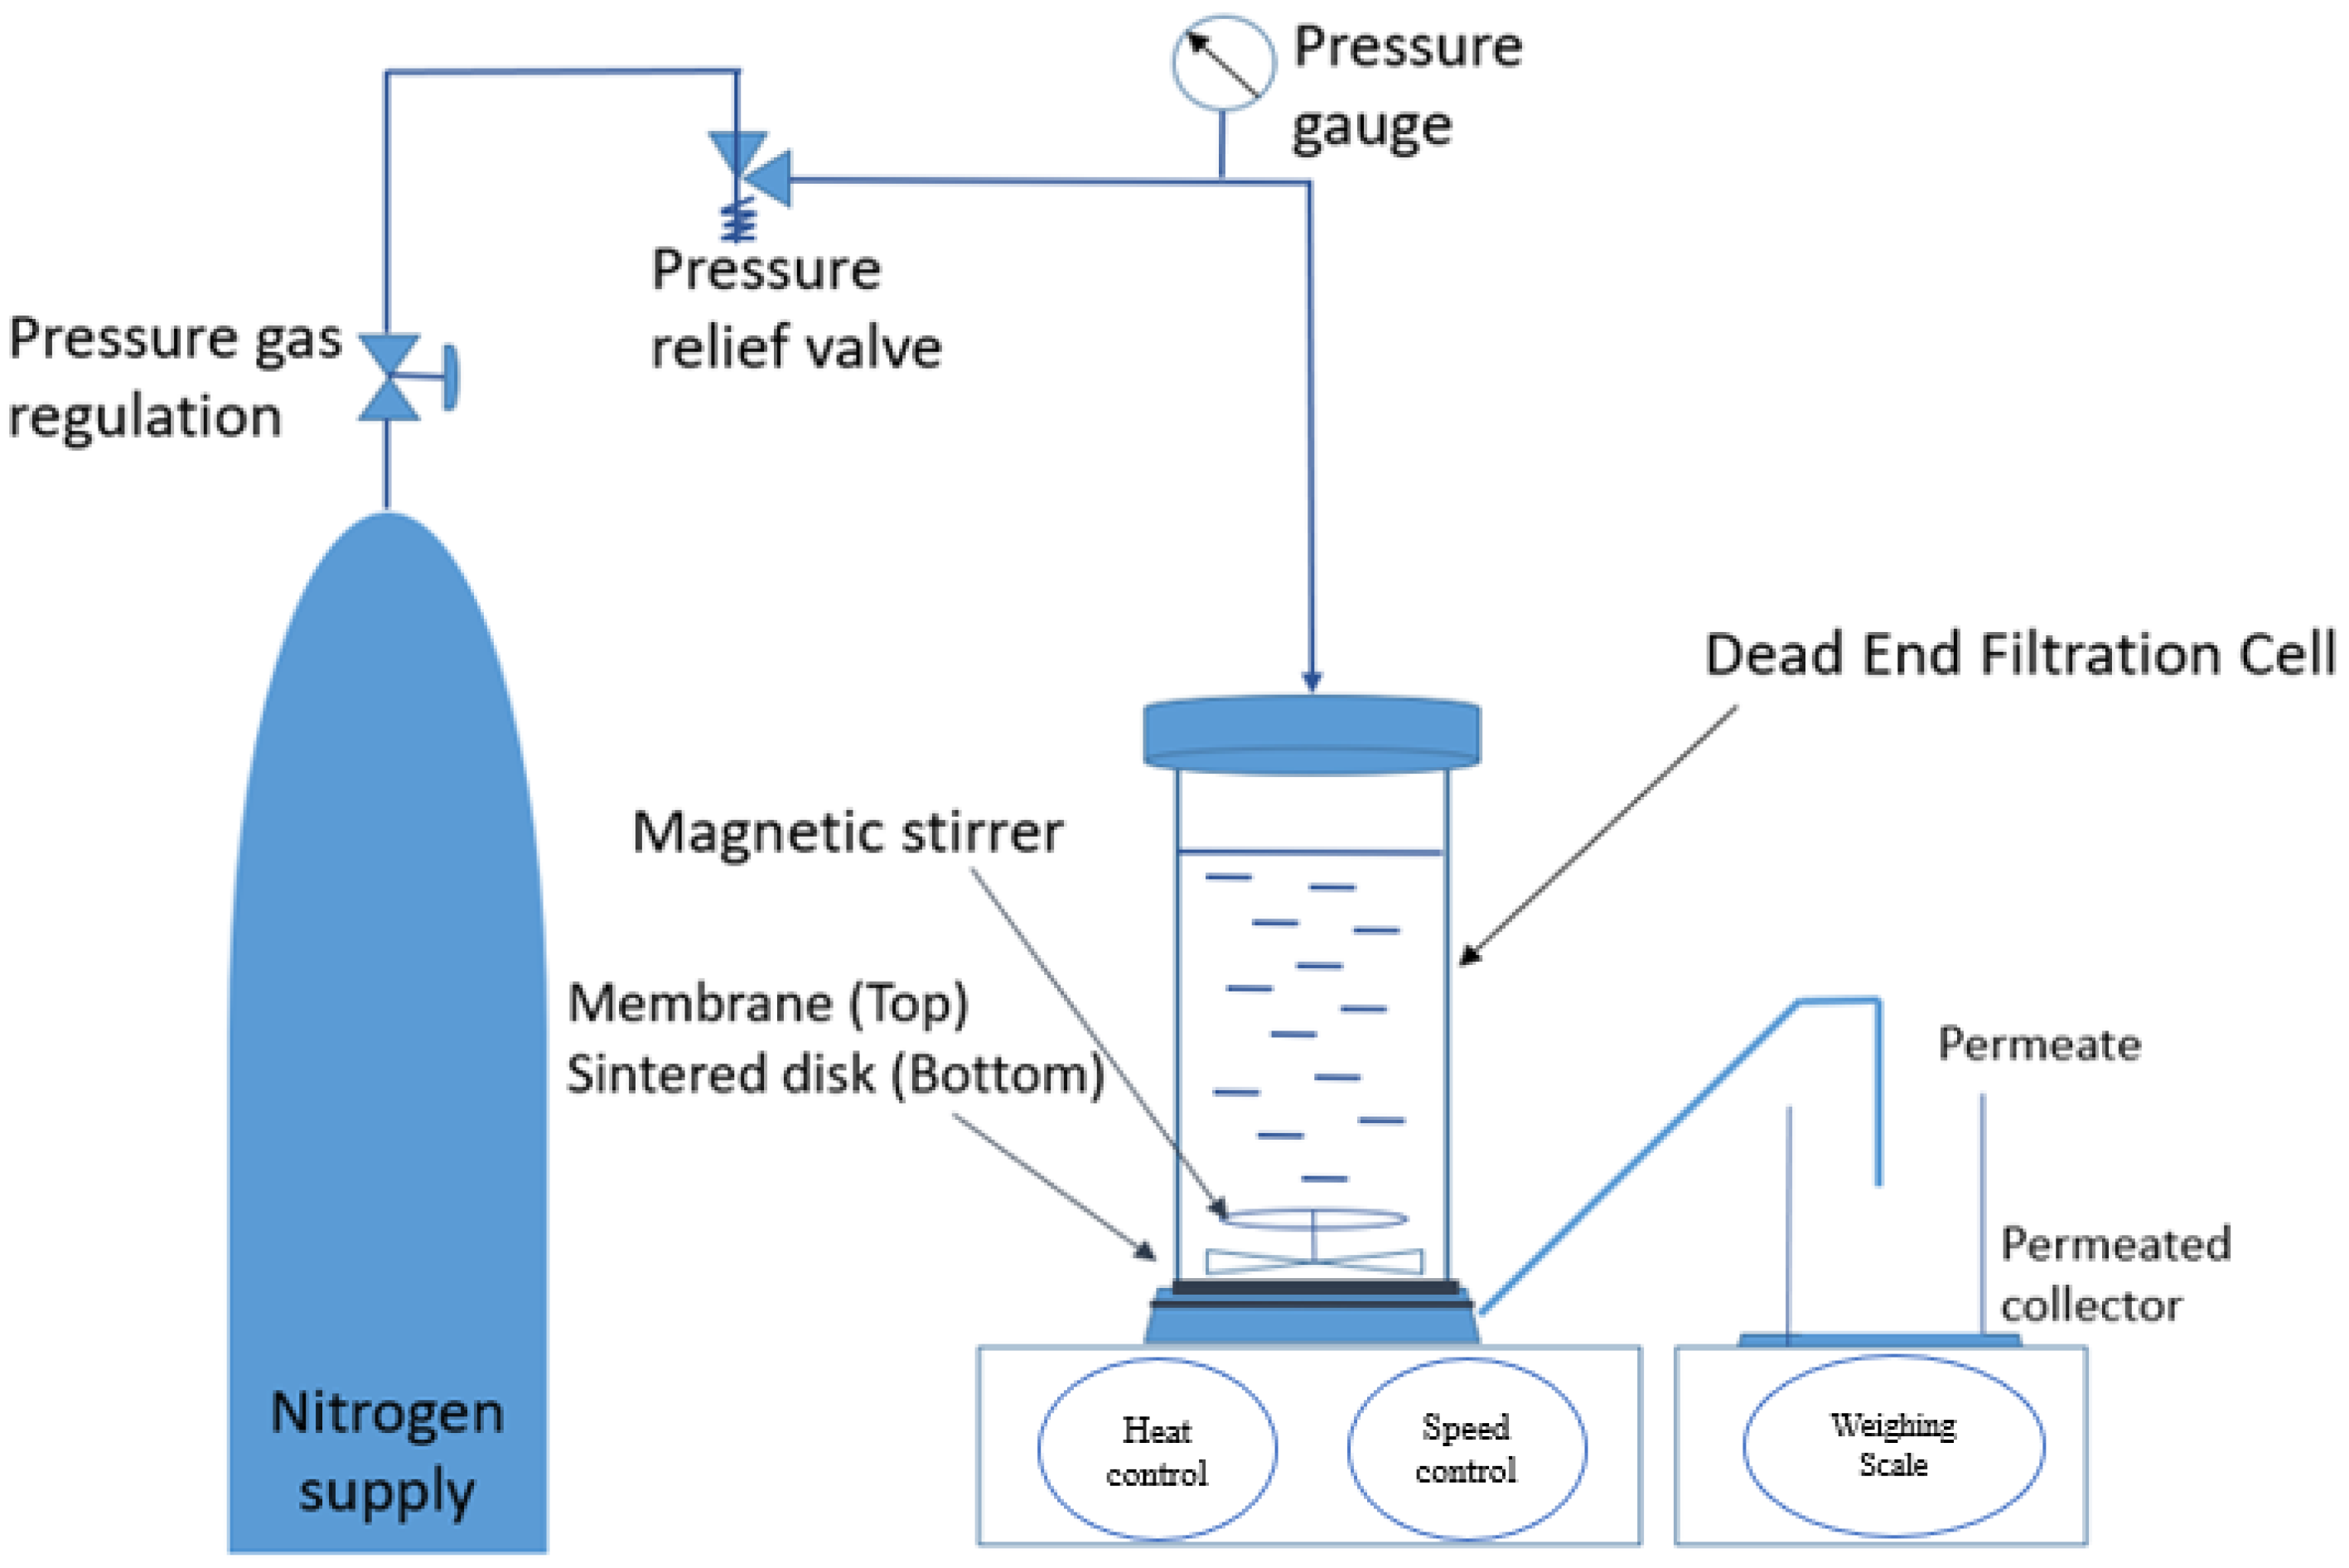
Membrane Permeation Test for Acetic Acid Removal
2.2.3. Fouling Resistance Evaluation
2.2.4. Concentration Polarization (CP)
3. Results
- i.
- To fabricate and characterize asymmetric polysulfone mixed matrix membranes (PSf MMMs);
- ii.
- Determination of membrane performance and its efficiency based on flux and rejection of acetic acid (AA) solute;
- iii.
- Interpretation of antifouling properties of fabricated MMMs as well as the correlation of concentration polarization (CP) on the surface of the membrane.
3.1. Fabrication and Characterization of PSf MMMs
3.1.1. Formation of Fabricated Flat-Sheet PSf MMMs
3.1.2. Characterization of MMMs
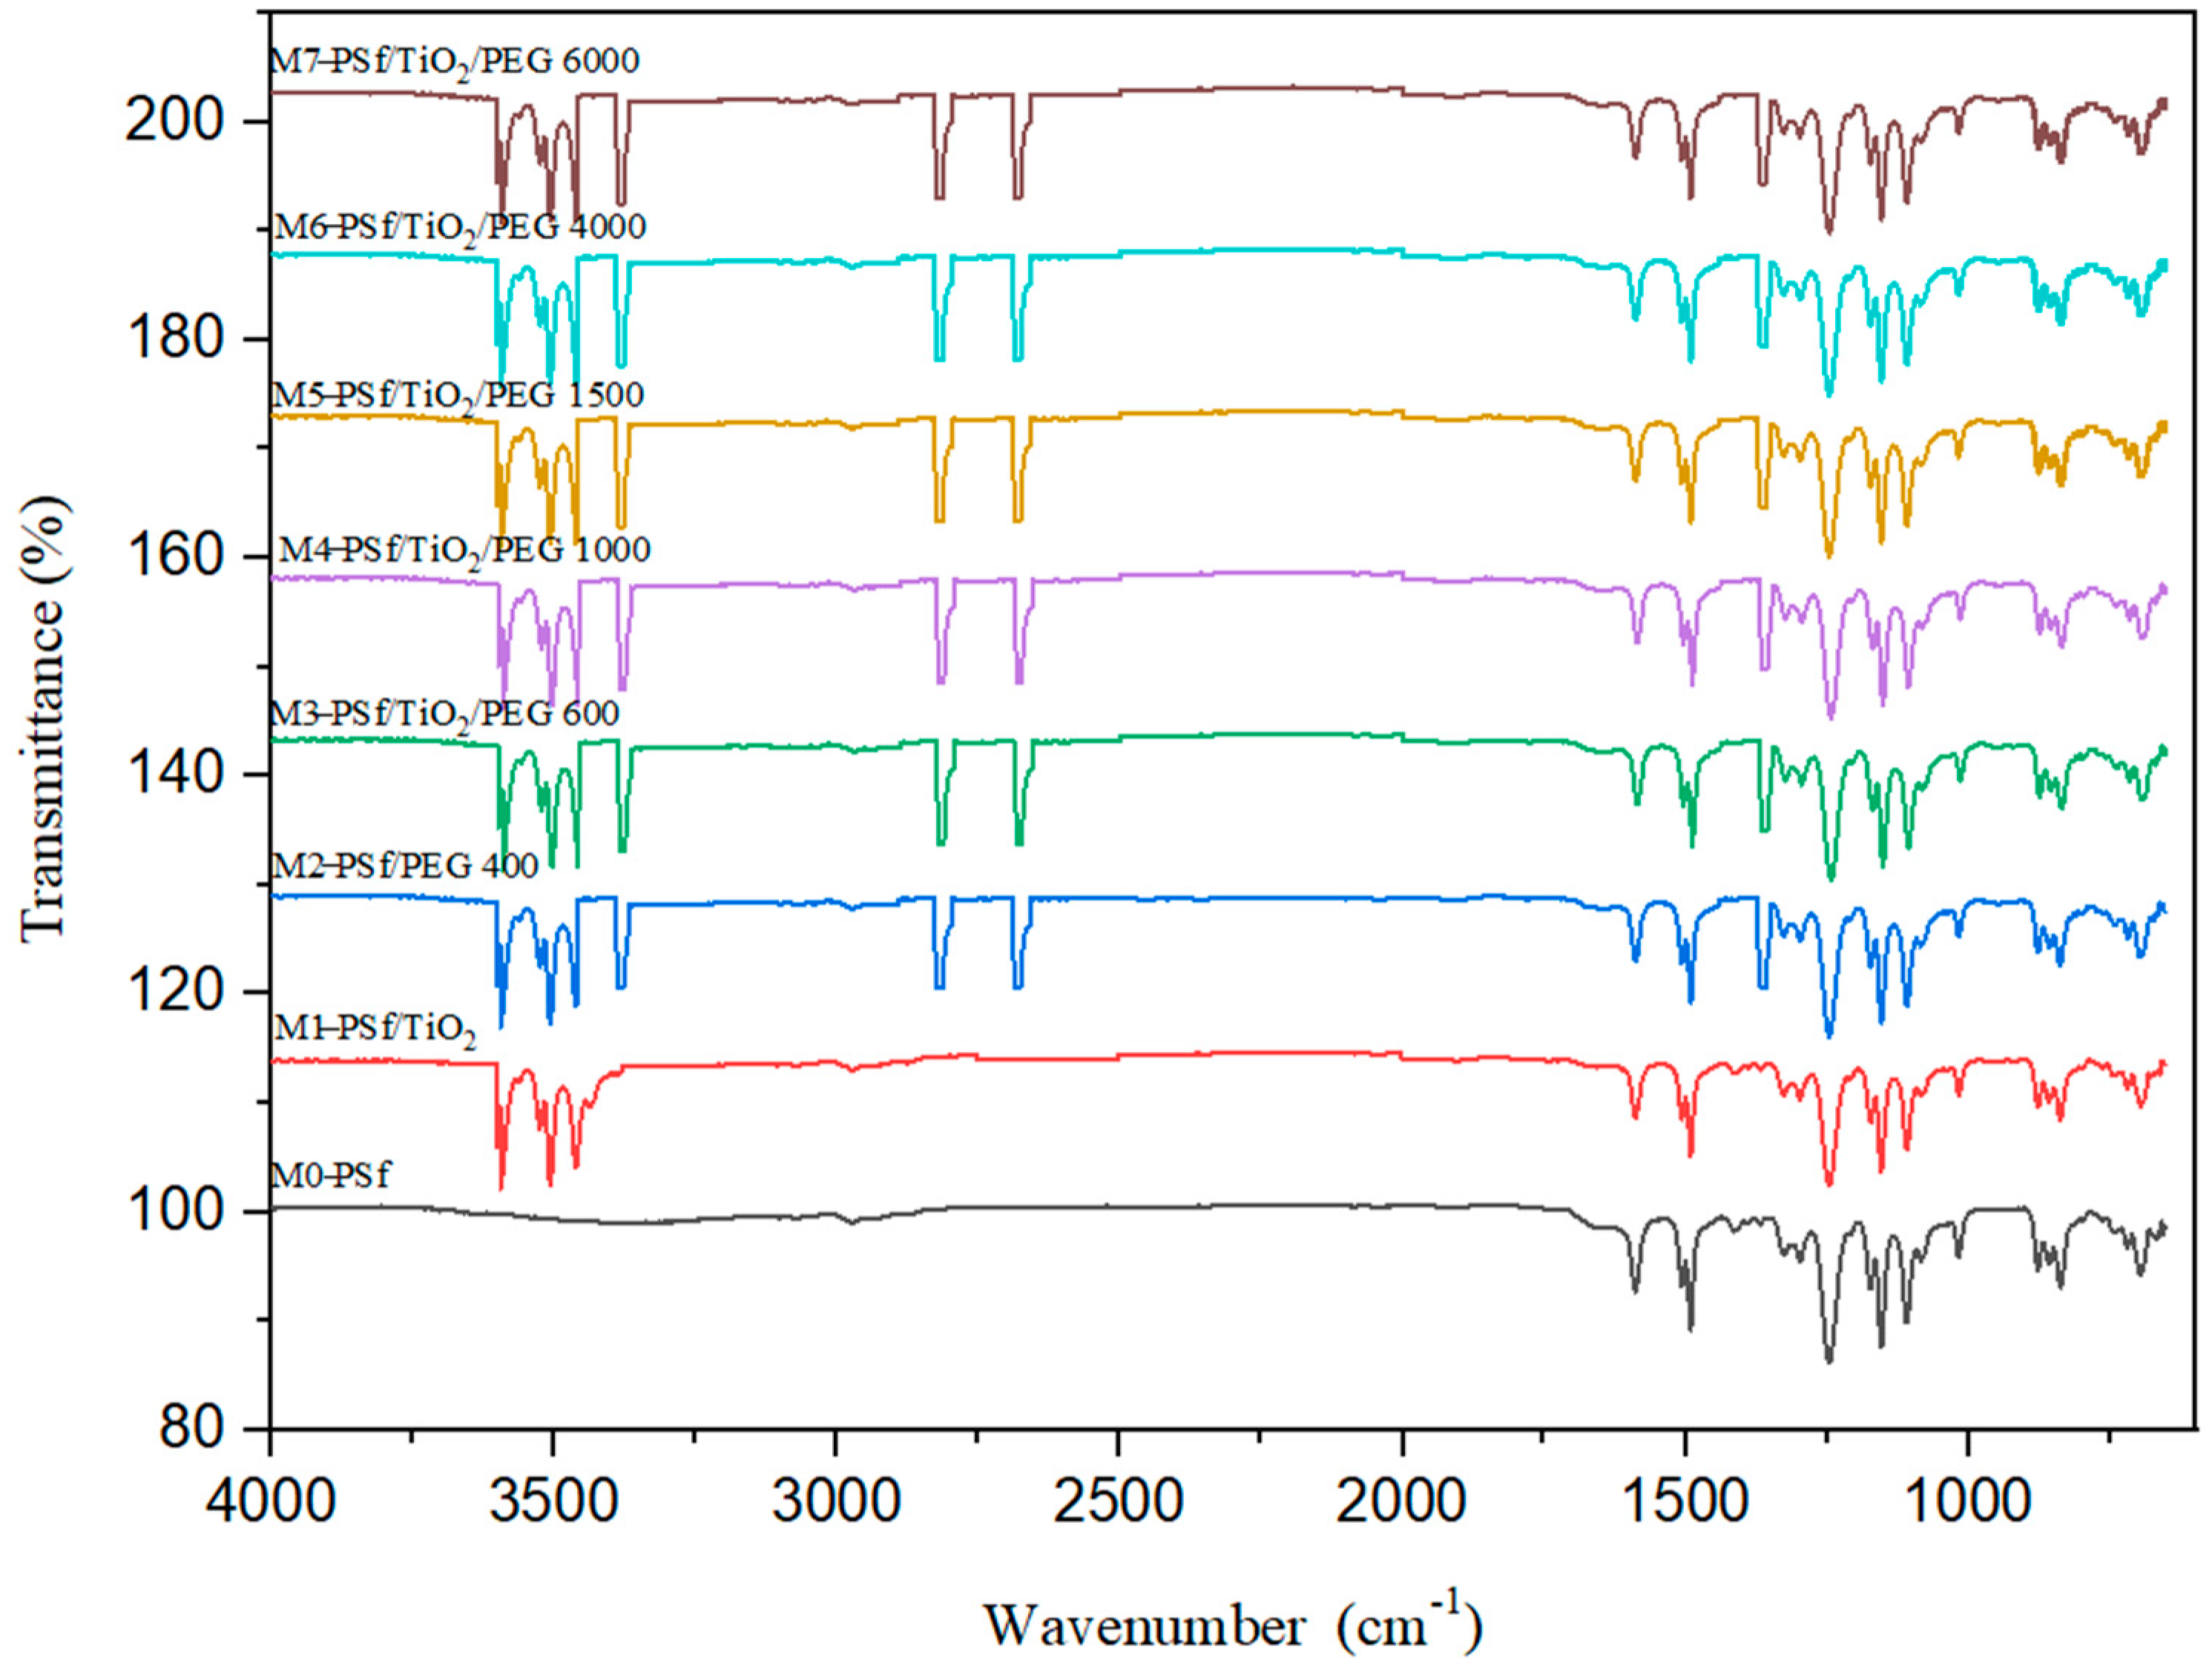
Fourier Transform Infrared Spectroscopy (FTIR)
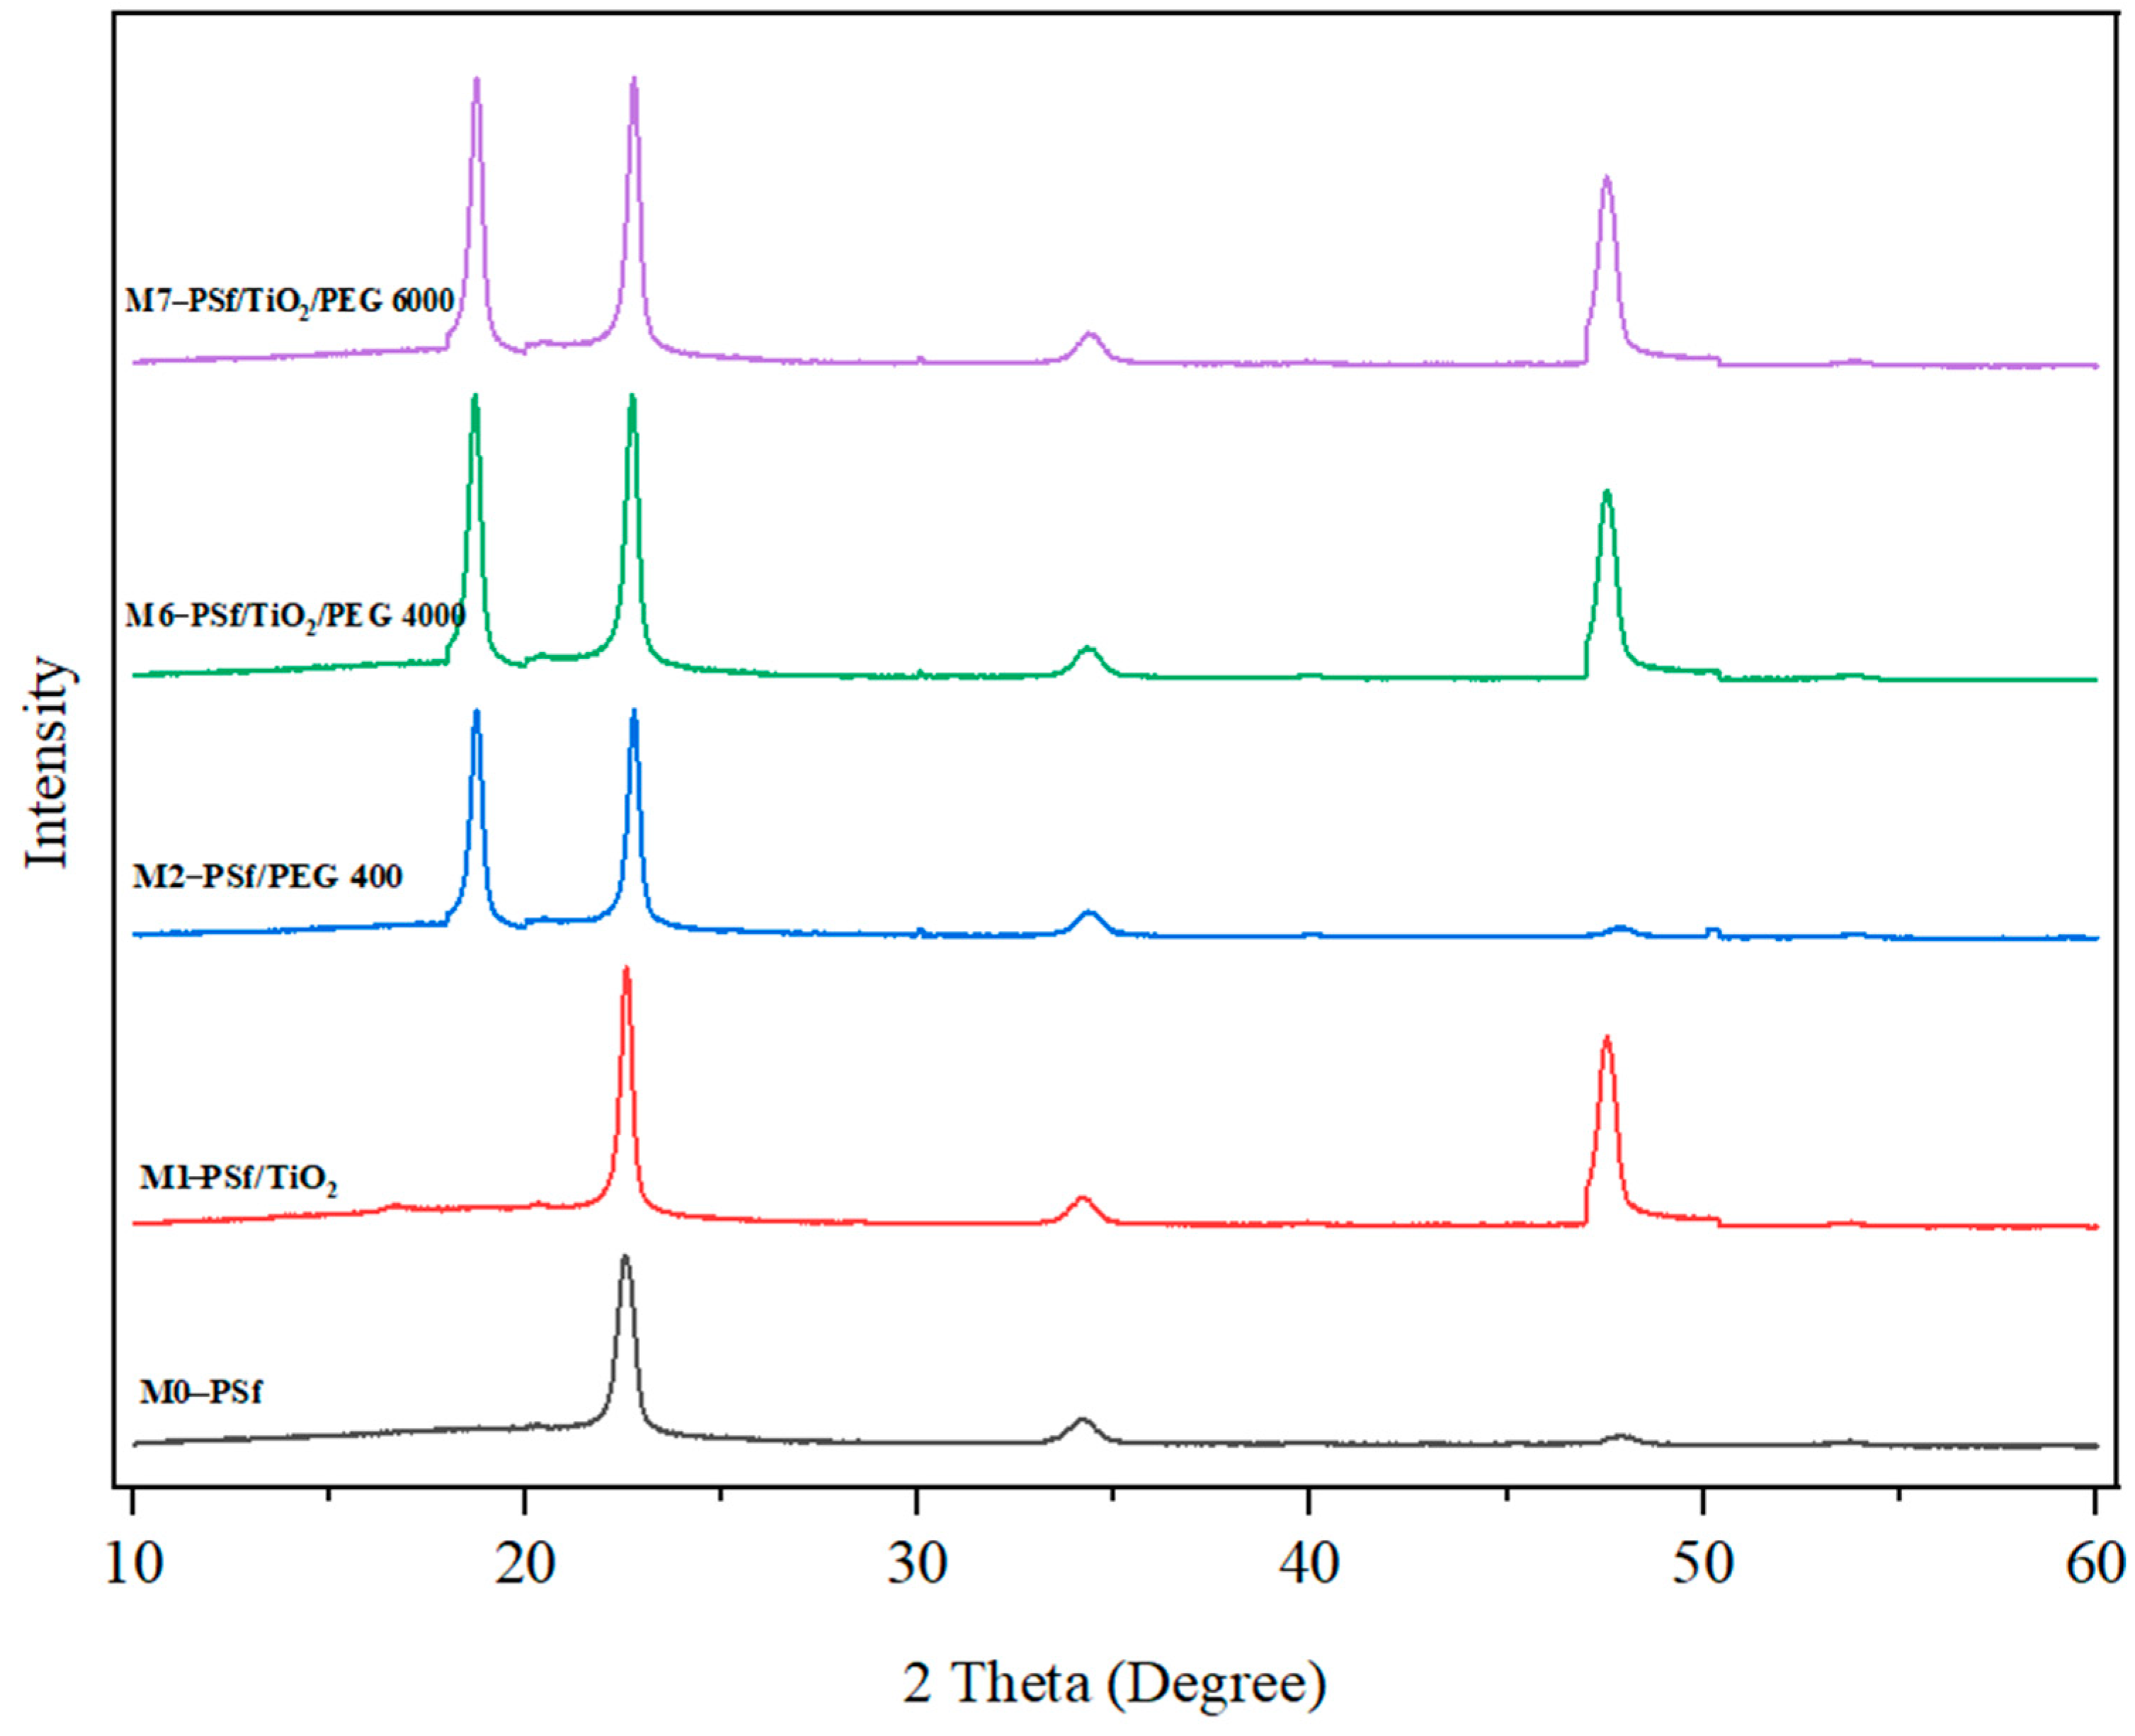
X-ray Diffractometer Analysis (XRD)
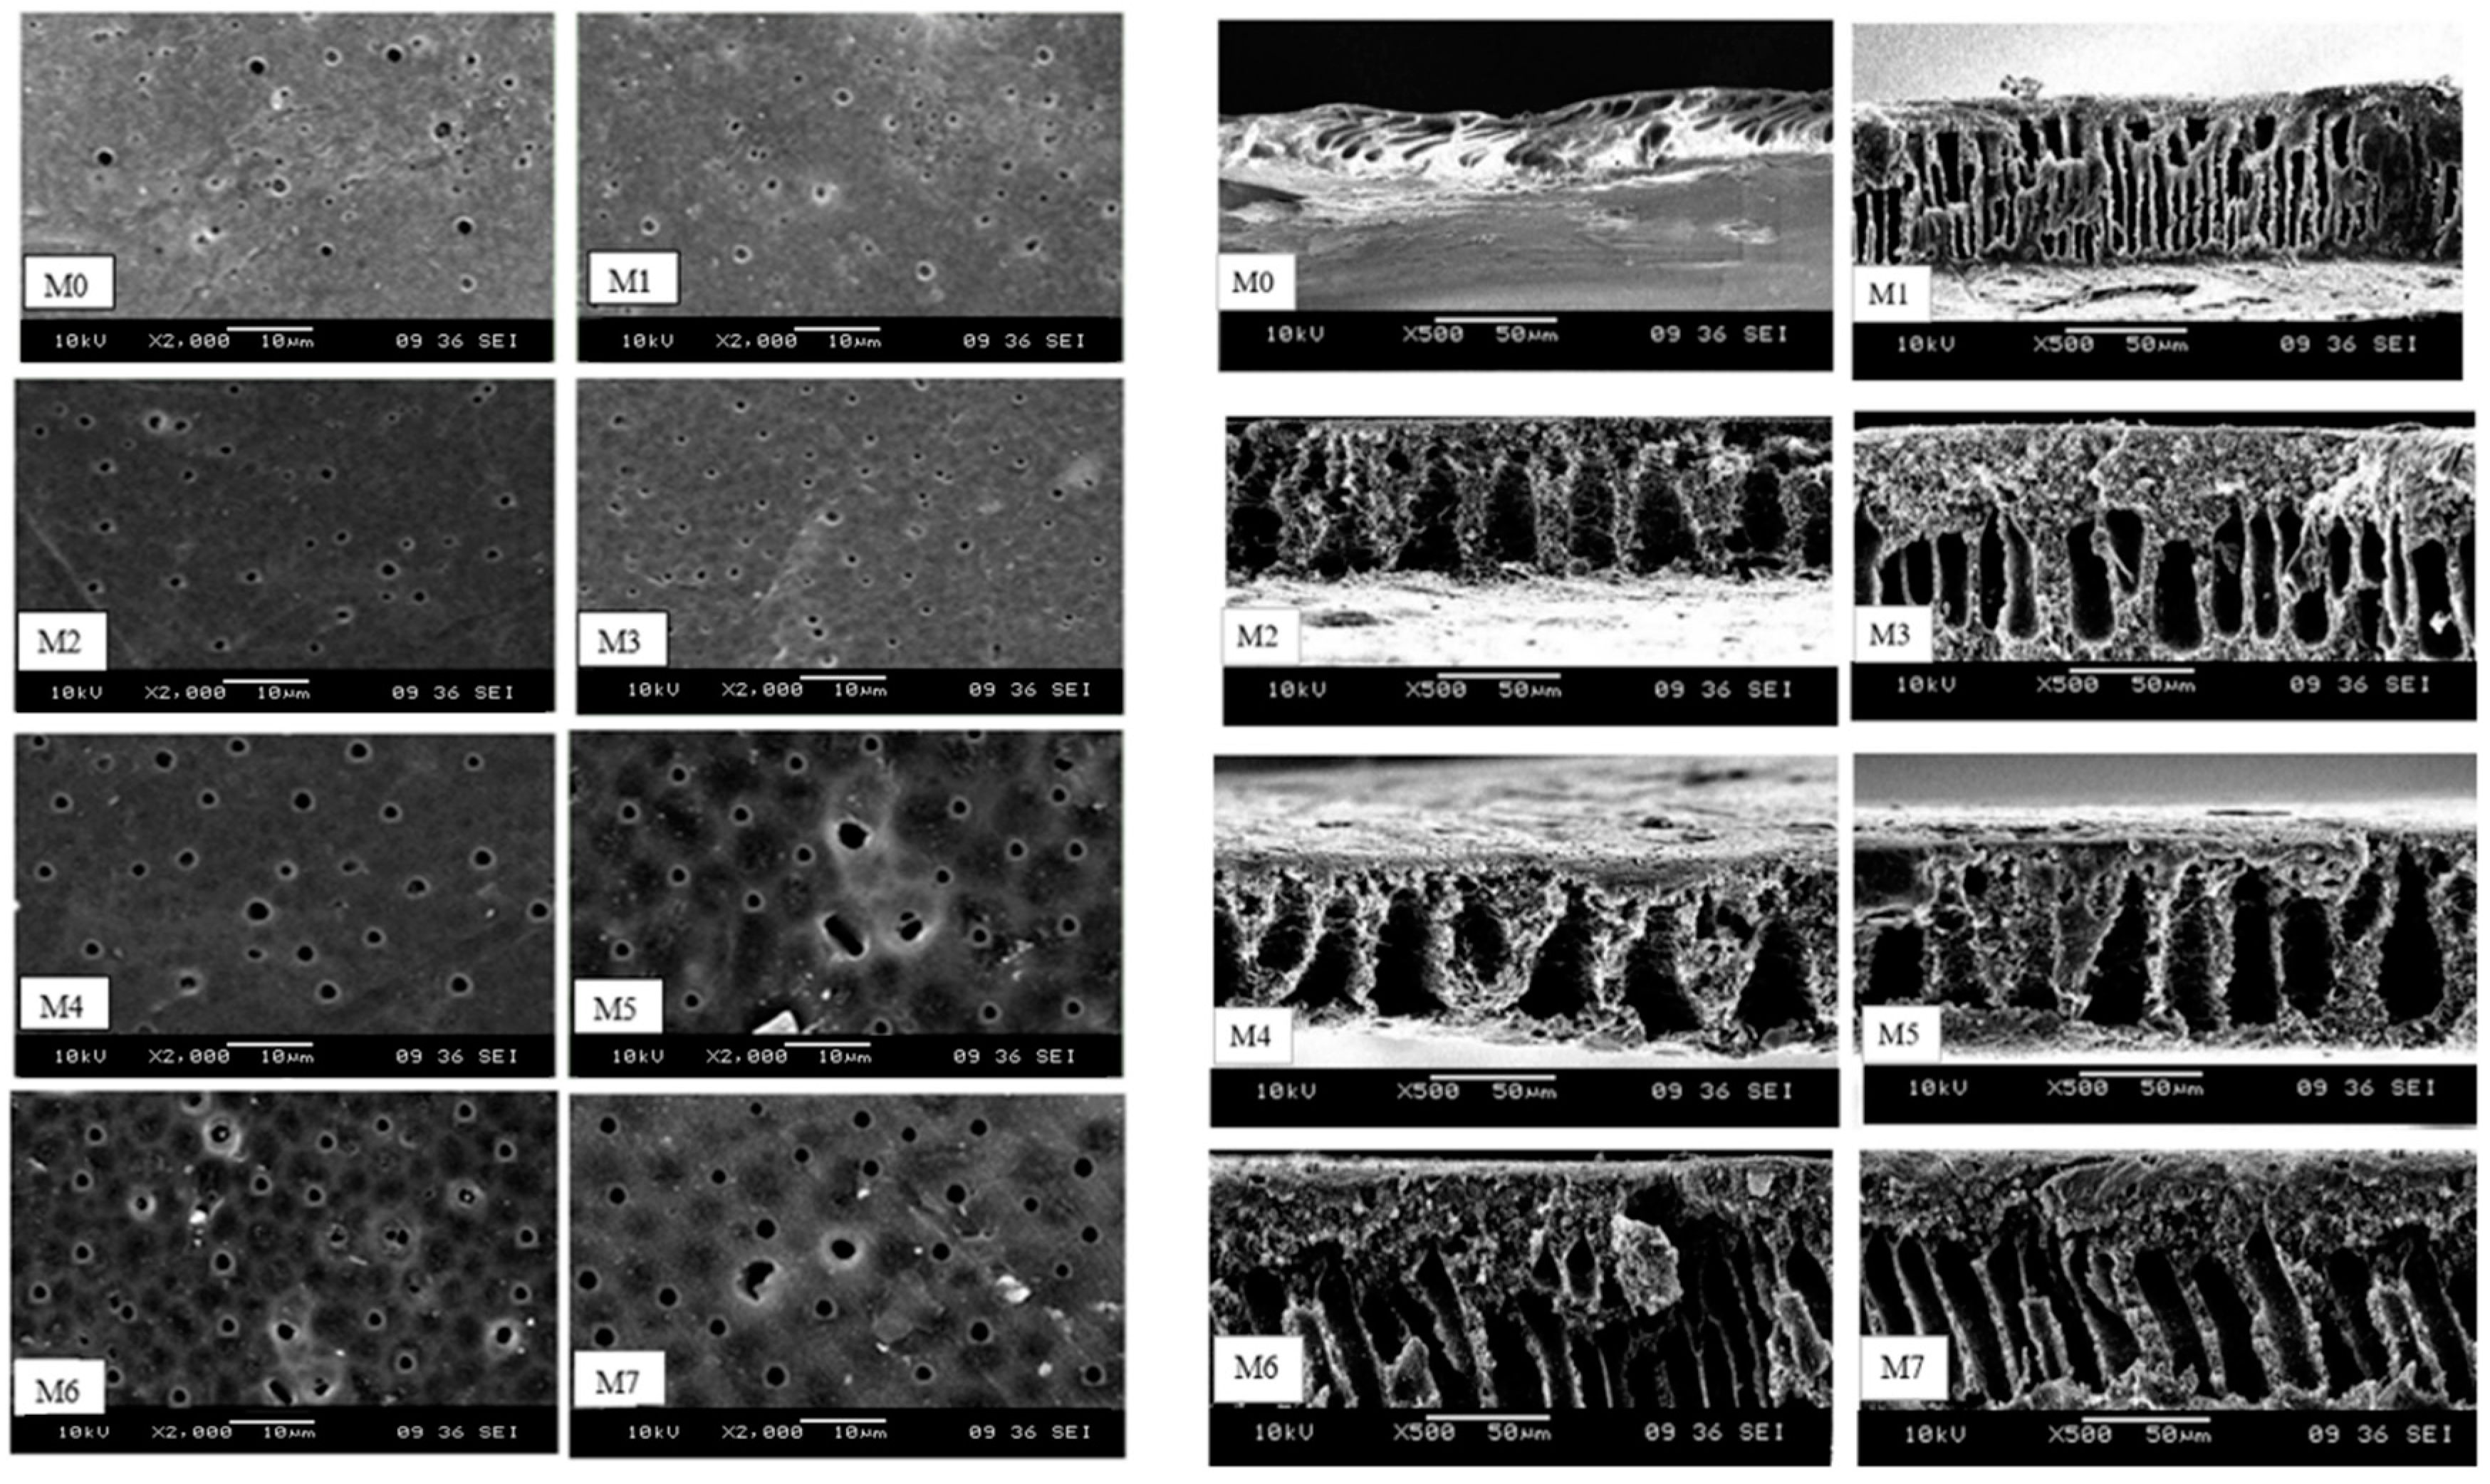
Scanning Electron Microscopy Analysis (SEM)
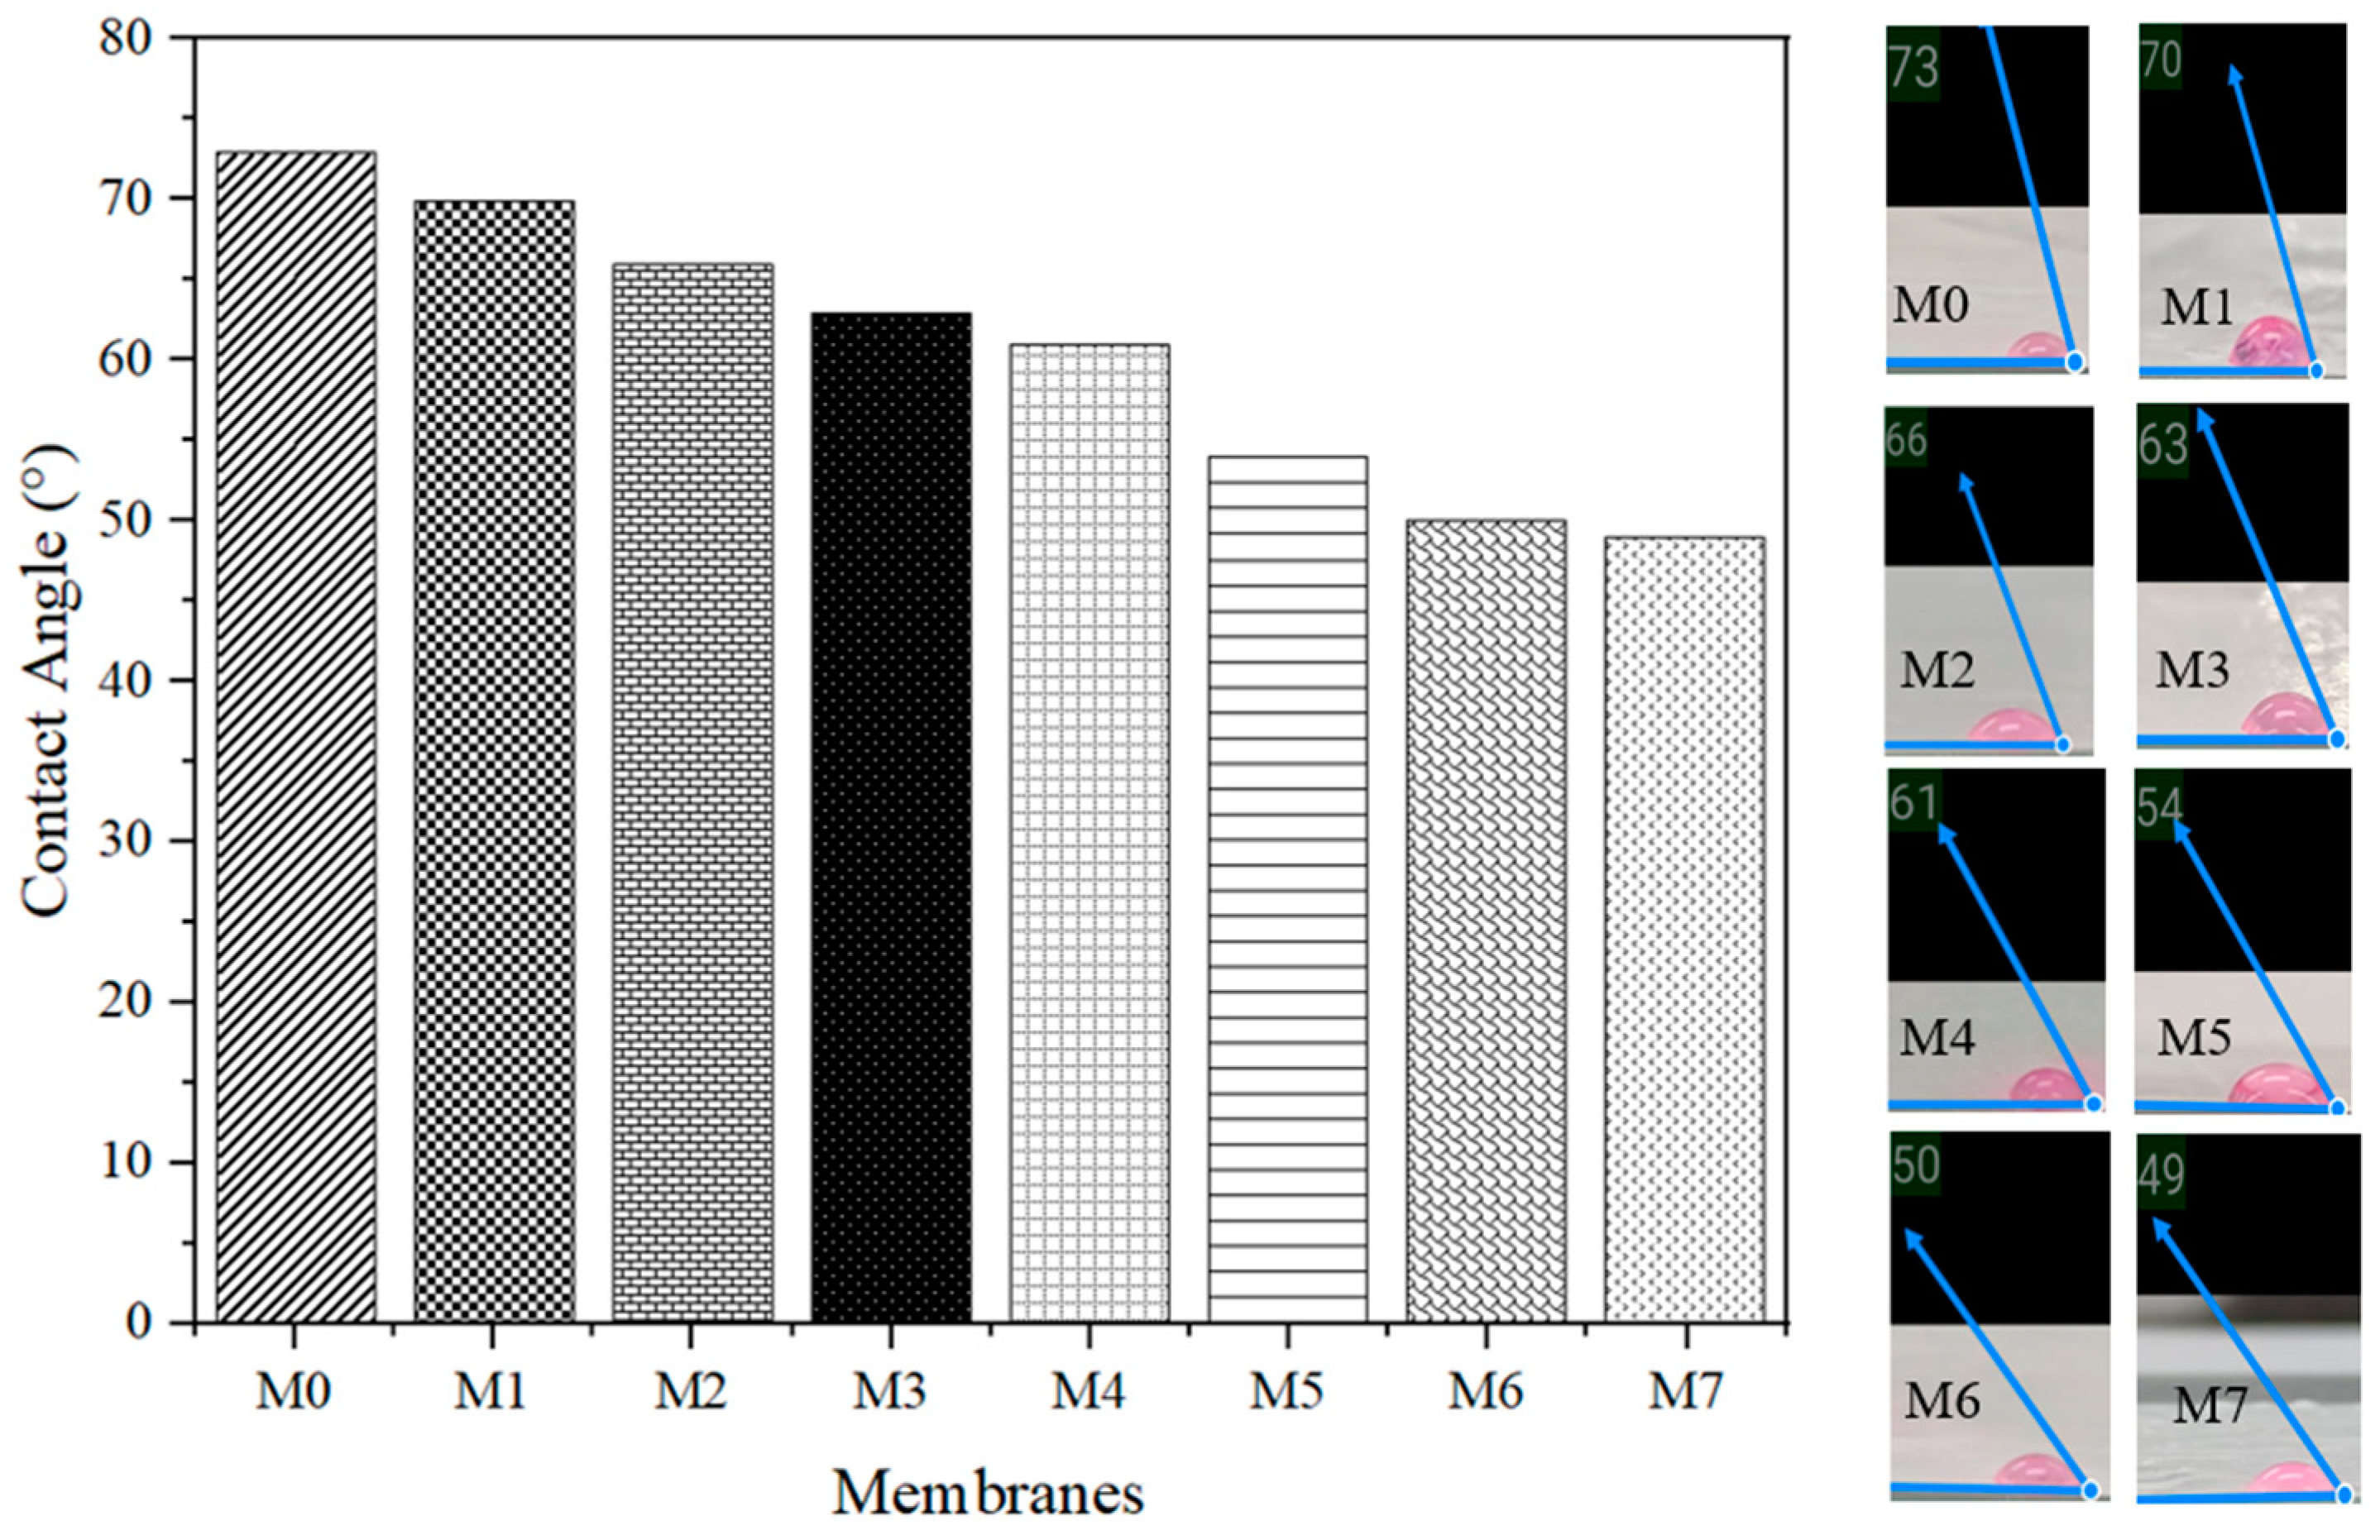
Water Contact Angle Analysis
Porosity Analysis
3.2. Acetic Acid Removal Performance of Ultrafiltration PSf MMMs via Dead-End Filtration
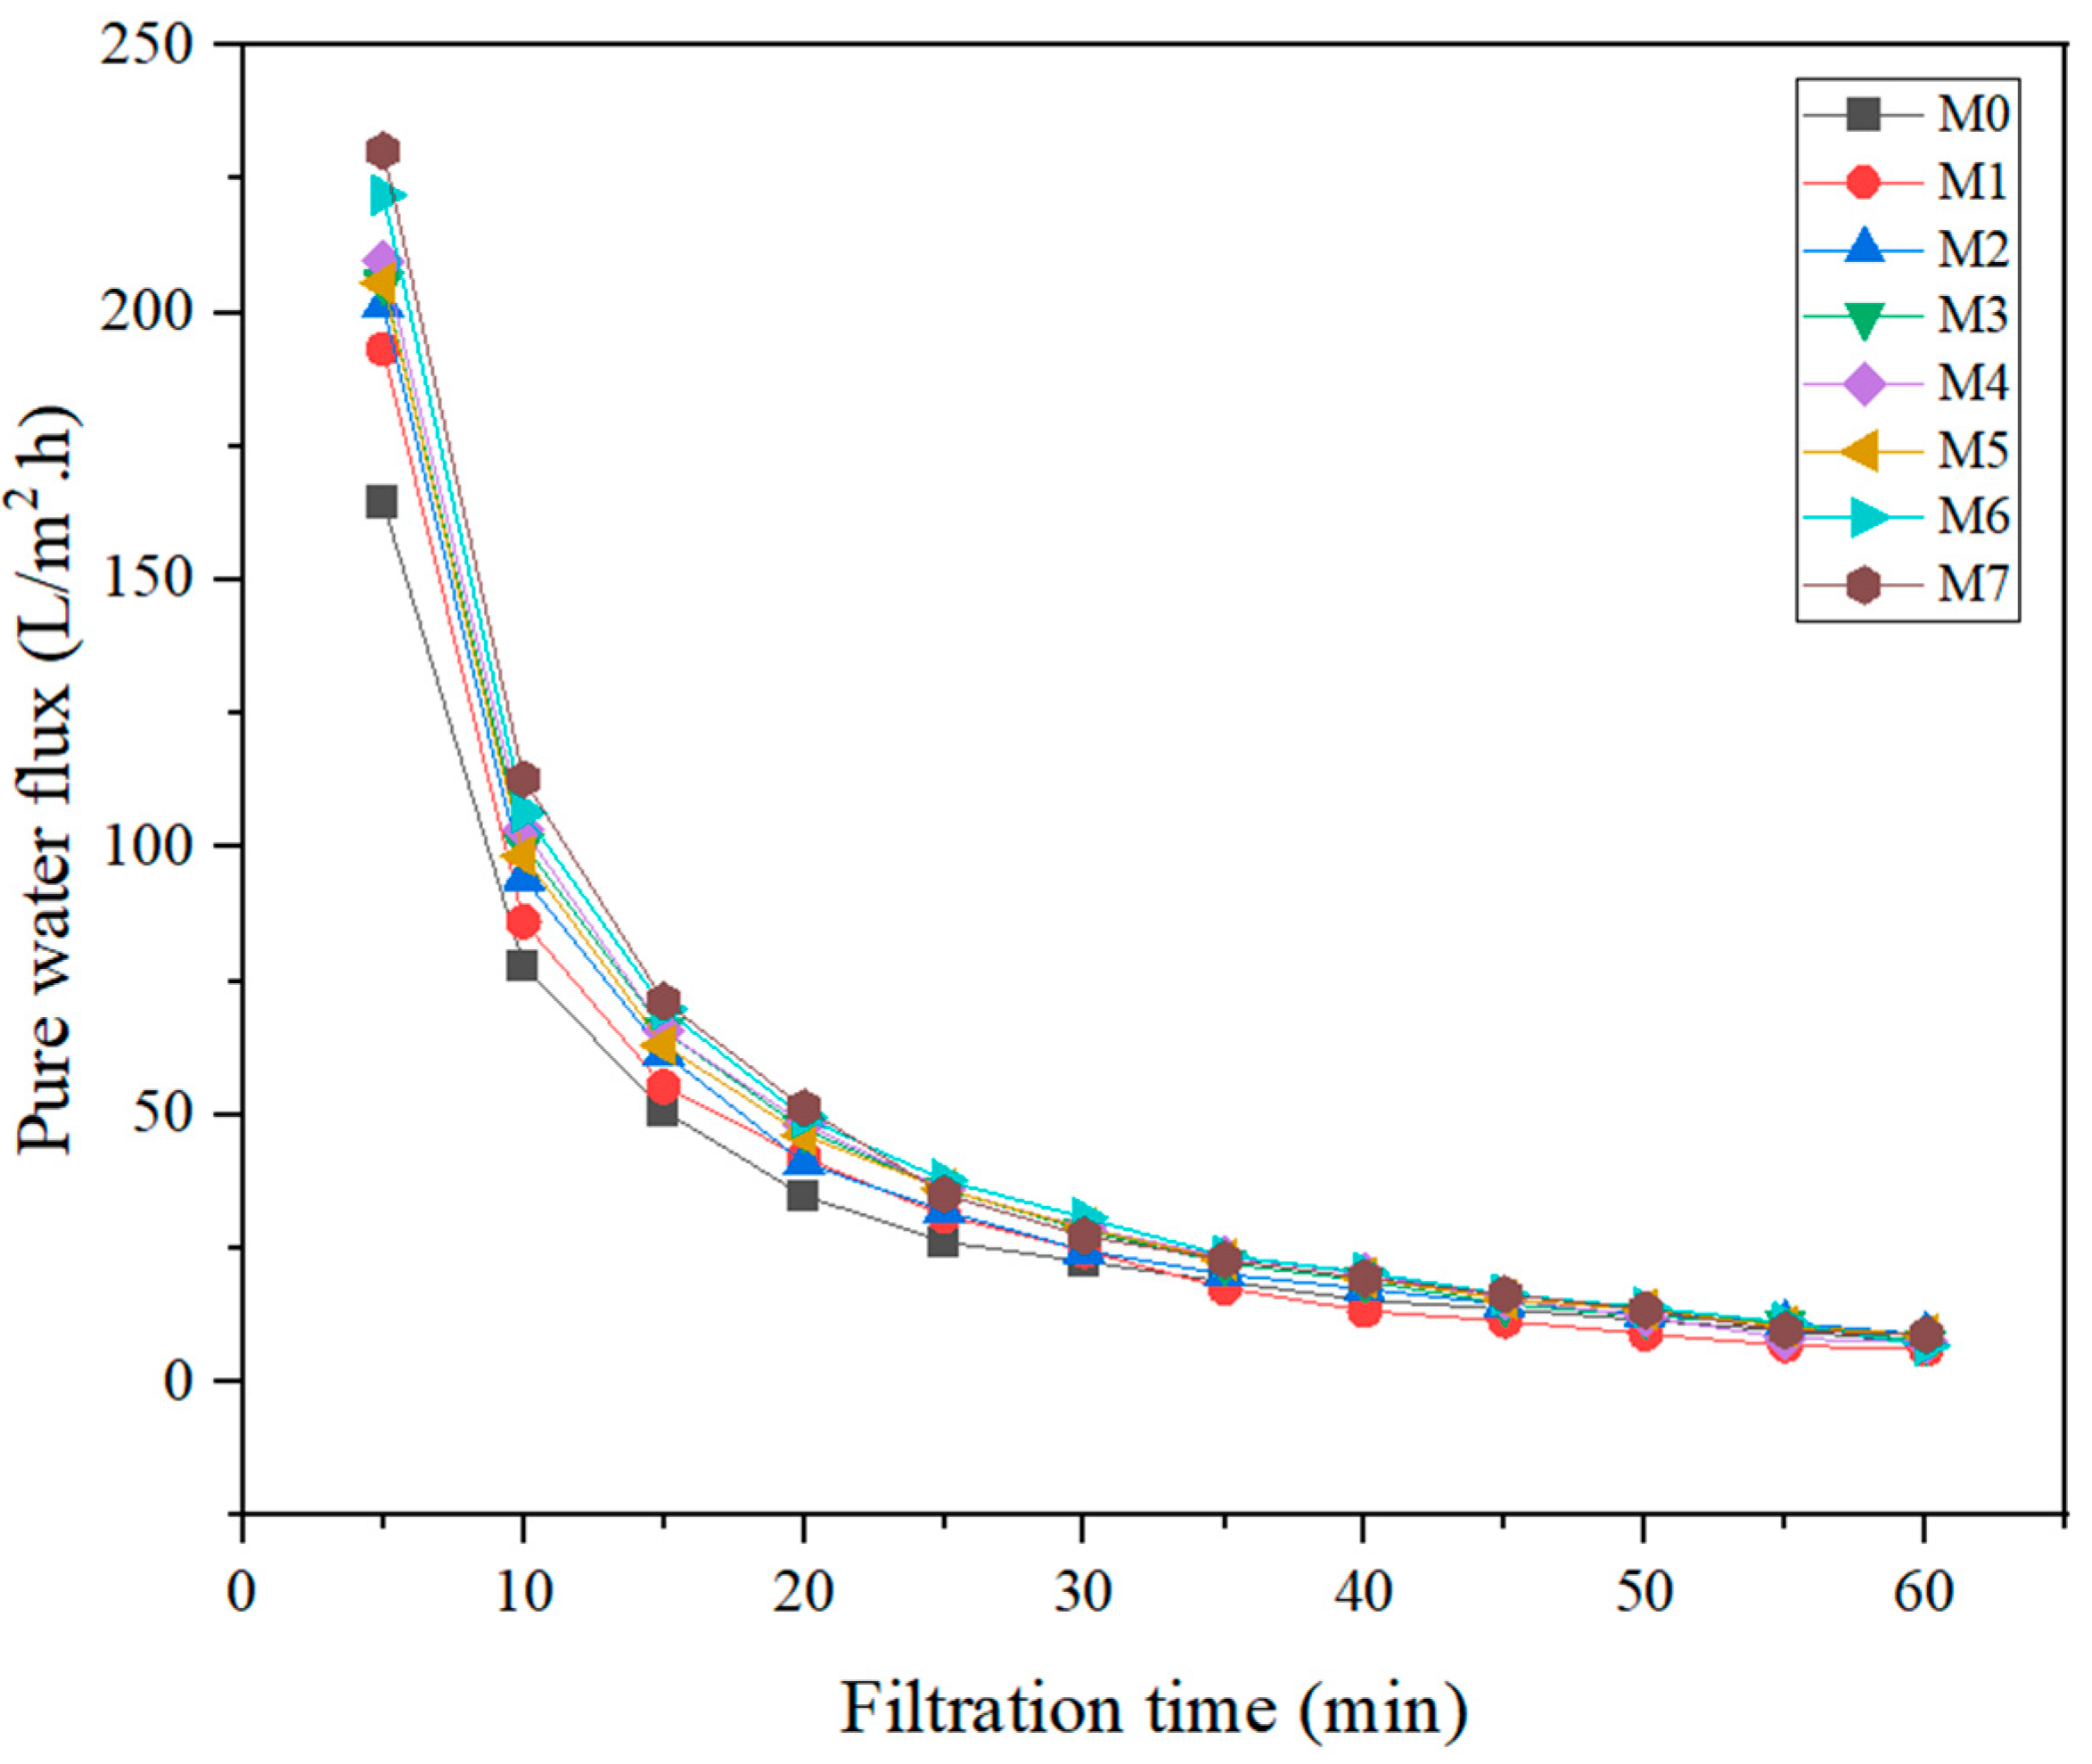
3.2.1. Pure Water Flux
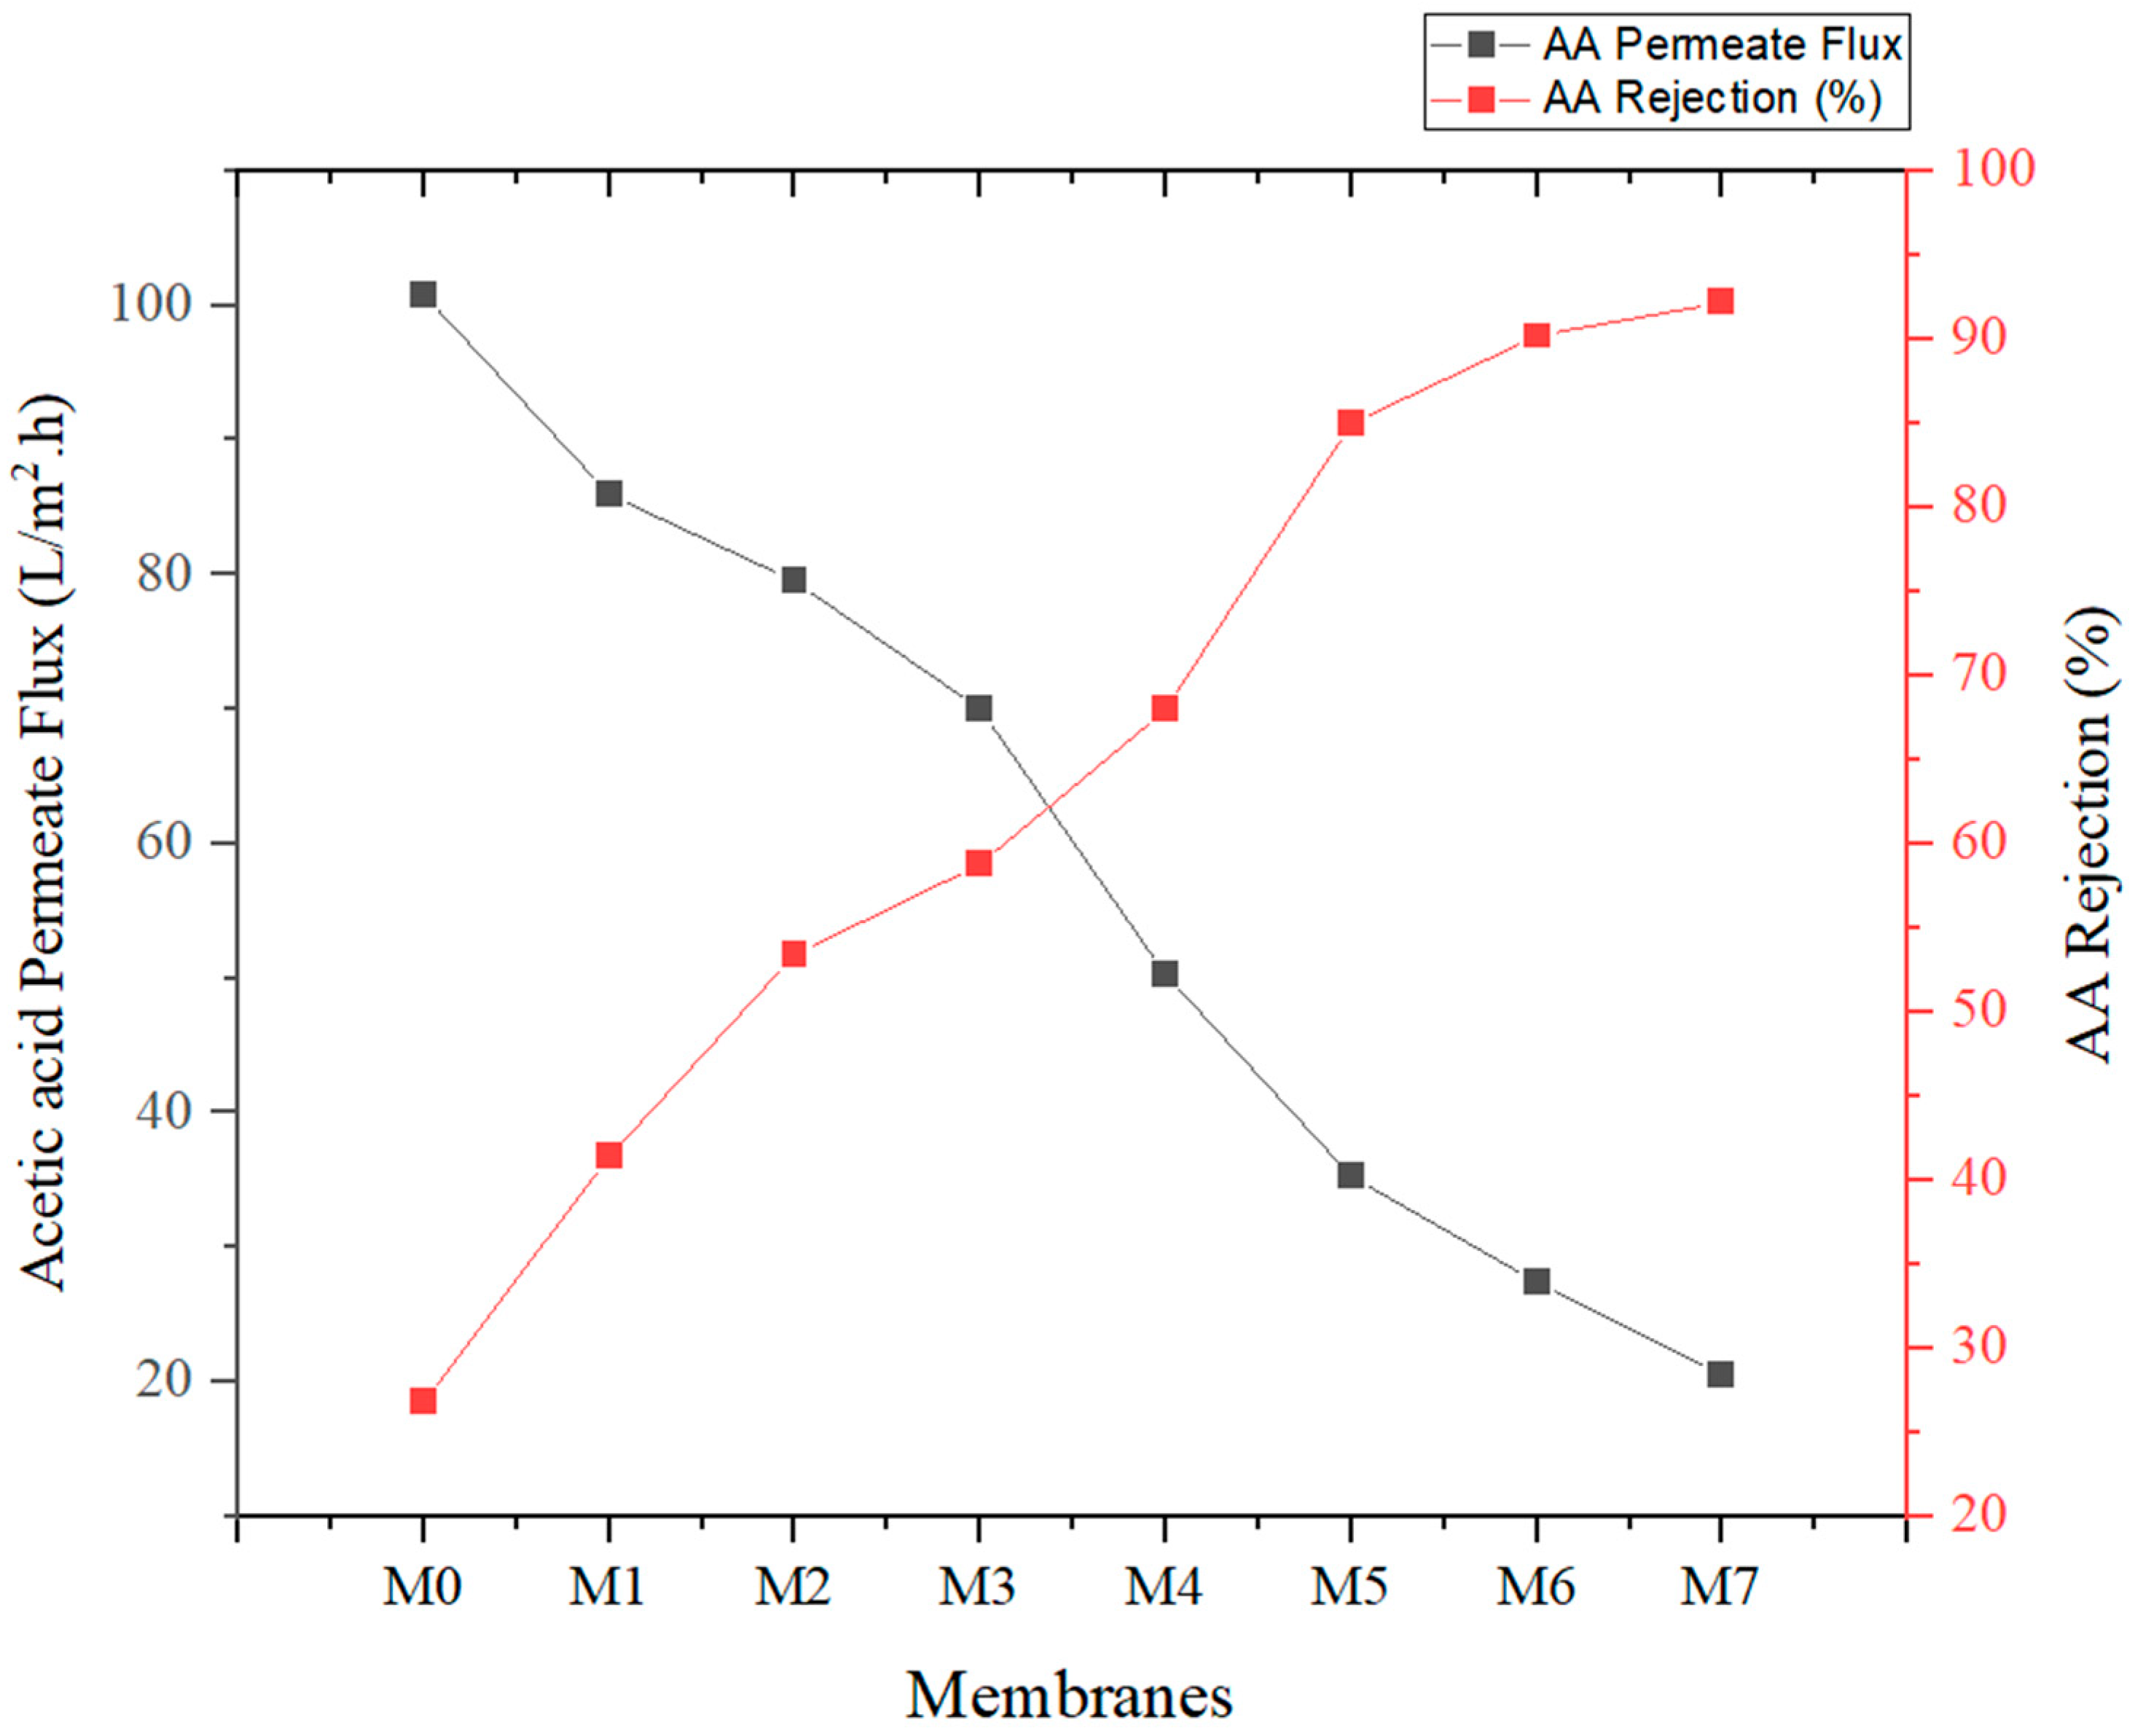
3.2.2. Dilute Acetic Acid Flux (JAA) and Rejection (RAA)
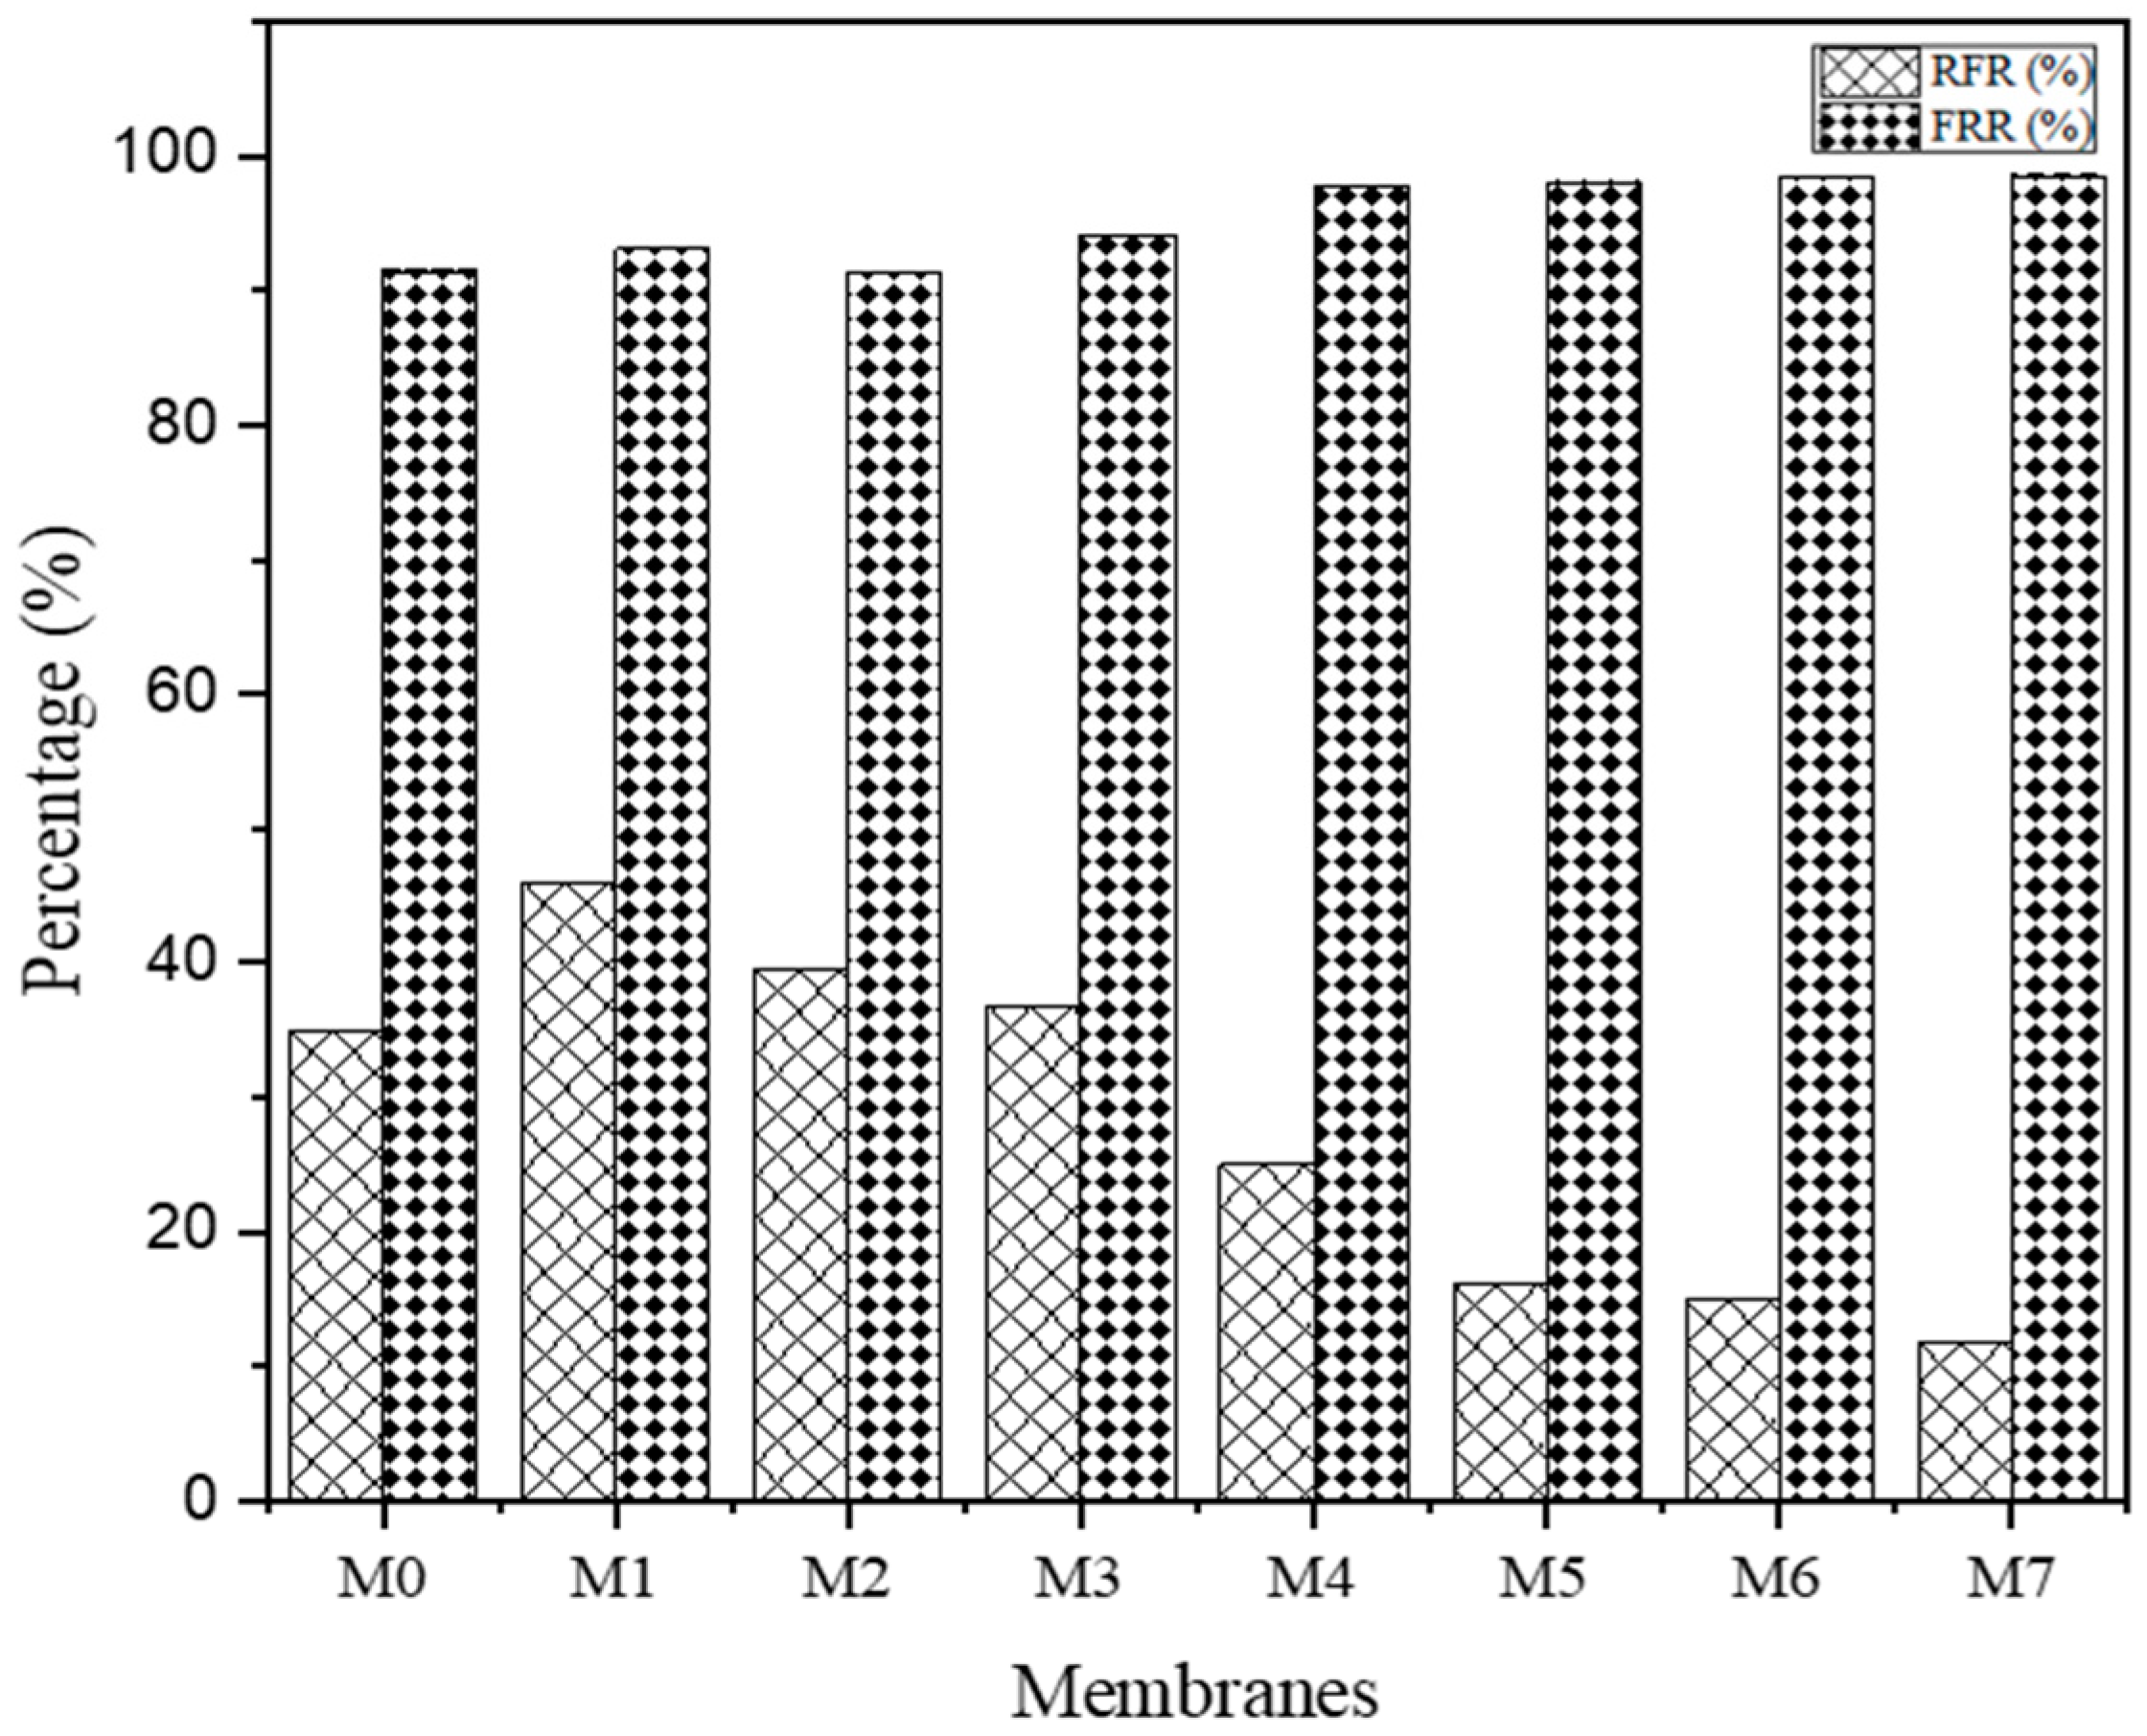
3.3. Fouling Study
3.3.1. Membrane Fouling Analysis
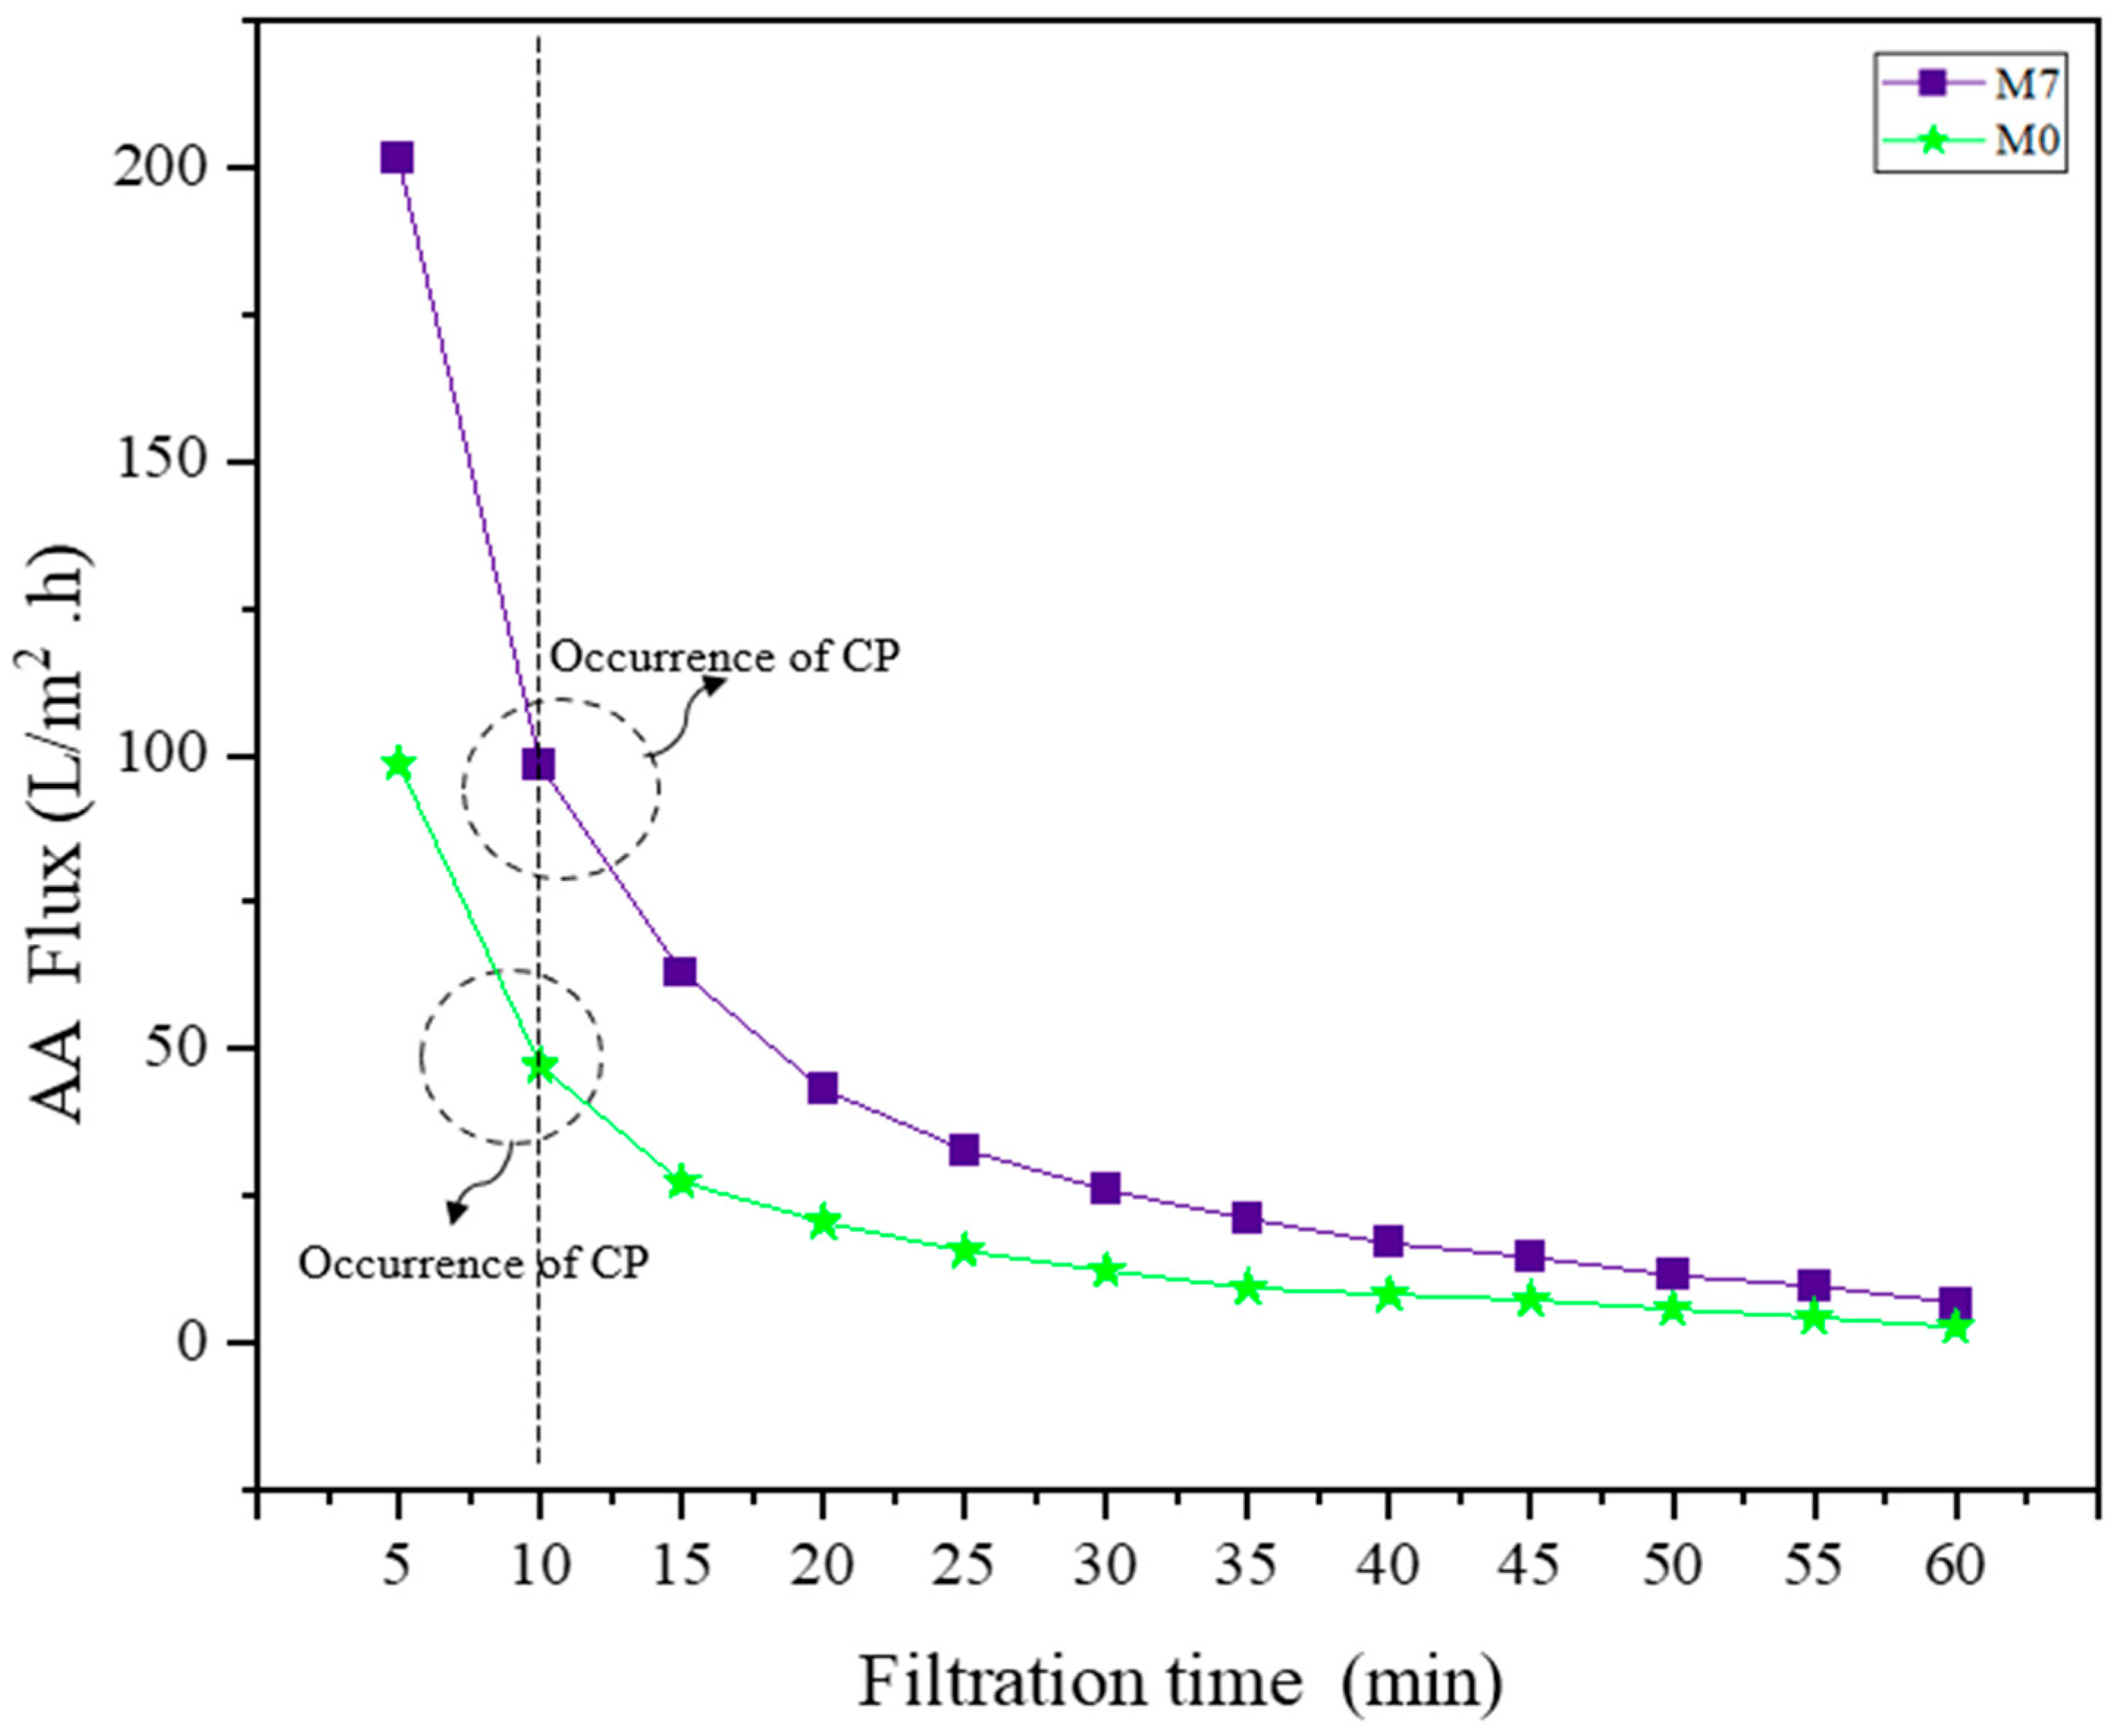
3.3.2. Concentration Polarization (CP)
4. Discussion
5. Conclusions
Author Contributions
Funding
Institutional Review Board Statement
Data Availability Statement
Acknowledgments
Conflicts of Interest
References
- Kiss, A.A.; Lange, J.P.; Schuur, B.; Brilman DW, F.; van der Ham AG, J.; Kersten SR, A. Separation technology–Making a difference in biorefineries. Biomass Bioenergy 2016, 95, 296–309. [Google Scholar] [CrossRef]
- He, Y.; Bagley, D.M.; Leung, K.T.; Liss, S.N.; Liao, B.Q. Recent advances in membrane technologies for biorefining and bioenergy production. Biotechnol. Adv. 2018, 30, 817–858. [Google Scholar] [CrossRef] [PubMed]
- Lim, Y.J.; Goh, K.; Wang, R. The coming of age of water channels for separation membranes: From biological to biomimetic to synthetic. Chem. Soc. Rev. 2022, 51, 4537–4582. [Google Scholar] [CrossRef]
- Ahmad, A.L.; Pang, W.Y.; Mohd Shafie ZM, H.; Zaulkiflee, N.D. PES/PVP/TiO2 mixed matrix hollow fiber membrane with antifouling properties for humic acid removal. J. Water Process Eng. 2019, 7, 2639–2643. [Google Scholar] [CrossRef]
- Kheirieh, S.; Asghari, M.; Afsari, M. Application and modification of polysulfone membranes. Rev. Chem. Eng. 2018, 34, 657–693. [Google Scholar] [CrossRef]
- Selli, D.; Tawfilas, M.; Mauri, M.; Simonutti, R.; Di Valentin, C. Optimizing PEGylation of TiO2 Nanocrystals through a Combined Experimental and Computational Study. Chem. Mater. 2019, 31, 7531–7546. [Google Scholar] [CrossRef] [PubMed]
- Kresnowati, M.T.A.P.; Regina, D.; Bella, C.; Wardani, A.K.; Wenten, I.G. Combined ultrafiltration and electrodeionization techniques for microbial xylitol purification. Food Bioprod. Process. 2019, 114, 245–252. [Google Scholar] [CrossRef]
- Khan, A.; Sherazi, T.A.; Khan, Y.; Li, S.; Naqvi SA, R.; Cui, Z. Fabrication and characterization of polysulfone/modified nanocarbon black composite antifouling ultrafiltration membranes. J. Membr. Sci. 2018, 554, 71–82. [Google Scholar] [CrossRef]
- Mbuli, B.S.; Mahlambi, M.M.; Ngila, C.J.; Moutloali, R.M. Polysulfone ultrafiltration membranes modified with carbon-coated alumina supported ni-TiO2 nanoparticles for water treatment: Synthesis, characterization and application. J. Membr. Sci. Res. 2019, 5, 222–232. [Google Scholar]
- Ahmad, A.L.; Abdulkarim, A.A.; Mohd Shafie ZM, H.; Ooi, B.S. Fouling evaluation of PES/ZnO mixed matrix hollow fiber membrane. Desalination 2017, 403, 53–63. [Google Scholar] [CrossRef]
- Dong, X.; Al-Jumaily, A.; Escobar, I.C. Investigation of the use of a bio-derived solvent for non-solvent-induced phase separation (NIPS) fabrication of polysulfone membranes. Membranes 2018, 8, 23. [Google Scholar] [CrossRef] [PubMed]
- Wang, Y.; Chung, T. Separation characteristics of acetic acid–water mixtures by pervaporation using poly (vinyl alcohol) membranes modified with malic acid. Chem. Eng. Process. 2017, 44, 1019–1027. [Google Scholar]
- Mishra, S.K.; Tripathi, S.N.; Choudhary, V.; Gupta, B.D. Surface plasmon resonance-based fiber optic methane gas sensor utilizing graphene-carbon nanotubespoly (methyl methacrylate) hybrid nanocomposite. Plasmonics 2015, 10, 1147–1157. [Google Scholar] [CrossRef]
- Bunaciu, A.A.; Udriştioiu, E.G.; Aboul-Enein, H.Y. X-Ray Diffraction: Instrumentation and Applications. Crit. Rev. Anal. Chem. 2015, 45, 289–299. [Google Scholar] [CrossRef] [PubMed]
- Zhang, S.; Tang, Y.; Vlahovic, B. A Review on Preparation and Applications of Silver-Containing Nanofibers. Nanoscale Res. Lett. 2016, 11, 80. [Google Scholar] [CrossRef]
- Kalantari, K.; Moradihamedani, P.; Ibrahim, N.; Bin, A.; Abdol, H. Polysulfone mixed-matrix membrane incorporating talc clay particles for gas separation. Polym. Bull. 2018, 87, 373–798. [Google Scholar] [CrossRef]
- Karimi, K.; Tabatabaei, M.; Horváth, I.S.; Kumar, R. Recent trends in acetone, butanol, and ethanol (ABE) production. Biofuel Res. J. 2015, 2, 301–308. [Google Scholar] [CrossRef]
- Lim, Y.J.; Goh, K.; Lai, G.S.; Zhao, Y.; Torres, J.; Wang, R. Unraveling the role of support membrane chemistry and pore properties on the formation of thin-film composite polyamide membranes. J. Membr. Sci. 2021, 640, 119805. [Google Scholar] [CrossRef]
- Sanaeepur, H.; Ahmadi, R.; Ebadi Amooghin, A.; Ghanbari, D. A novel ternary mixed matrix membrane containing glycerol-modified poly (ether-block-amide)/copper nanoparticles for CO2 separation. J. Membrane. Sci. 2019, 573, 234–246. [Google Scholar] [CrossRef]
- Esfahani, M.R.; Arce, P. Sequential Use Of UV/H2O2, (PSf/TiO2/MWCNT) Mixed Matrix Membranes For Dye Removal In Water Purification: MembranePermeation, Fouling, Rejection, and Decolorization. Environ. Eng. Sci. 2016, 378, 64–68. [Google Scholar]
- Nasirian, D.; Salahshoori, I.; Sadeghi, M.; Rashidi, N.; Hassanzadeganroudsari, M. Investigation of the gas permeability properties from polysulfone/polyethylene glycol composite membrane. Polym. Bull. 2020, 50, 100. [Google Scholar] [CrossRef]
- Zahir, H.; Rahman, M.M.; Irshad, K. Shape-Stabilized Phase Change Materials for Solar Energy Storage: MgO and Mg (OH) Mixed with Polyethylene Glycol. Nanomaterials 2019, 20, 1773. [Google Scholar] [CrossRef] [PubMed]
- Razmjou, A.; Mansouri, J.; Chen, V. The effects of mechanical and chemical modification of TiO2 nanoparticles on the surface chemistry, structure and fouling performance of PES ultrafiltration membranes. J. Membr. Sci. 2017, 378, 73–84. [Google Scholar] [CrossRef]
- Vatanpour, V.; Madaeni, S.S.; Moradian, R.; Zinadini, S.; Astinchap, B. Fabrication and characterization of novel antifouling nanofiltration membrane prepared from 89 oxidized multiwalled carbon nanotube/polyethersulfone nanocomposite. J. Membr. Sci. 2011, 375, 284–294. [Google Scholar] [CrossRef]
- Salahshoori, I.; Seyfaee, A.; Babapoor, A. Recent advances in synthesis and applications of mixed matrix membranes. Synth. Sinter. 2021, 1, 1–27. [Google Scholar] [CrossRef]
- Seyed Dorraji, M.S.; Vatanpour, V. 4-Organic–inorganic composite membrane preparation and characterization for biorefining. In Membrane Technologies for Biorefining; Woodhead Publishing: Sawston, UK, 2016; pp. 85–102. [Google Scholar]
- Mavukkandy, M.; Bilad, M.; Kujawa, J.; Al-Gharabli, S.; Arafat, H. On the effect of fumed silica particles on the structure, properties and application of PVDF membranes. Sep. Purif. Technol. 2017, 187, 365–373. [Google Scholar] [CrossRef]
- Xia, Y.; Kiseeva, E.S.; Wade, J.; Huang, F. The effect of core segregation on the Cu and Zn isotope composition of the silicate Moon. J. Membr. Sci. Res. 2017, 3, 12–17. [Google Scholar] [CrossRef]
- Ariono, D.; Wardani, A.K. Analysis of Fouling Mechanism in Polysulfone based Ultrafiltration Membrane during Peat Water Filtration. J. Phys. Conf. Ser. 2018, 1090, 012052. [Google Scholar] [CrossRef]
- BLalia, S.; Kochkodan, V.; Hashaikeh, R.; Hilal, N. A review on membrane fabrication: Structure, properties and performance relationship. Desalination 2013, 326, 77–95. [Google Scholar]
- Liu, Y.; Koops, G.; Strathmann, H. Characterization of morphology controlled polyethersulfone hollow fiber membranes by the addition of polyethylene glycol to the dope and bore liquid solution. J. Membr. Sci. 2003, 223, 187–199. [Google Scholar] [CrossRef]
- Kamal, N.; Ahzi, S.; Kochkodan, V. Polysulfone/halloysite composite membranes with low fouling properties and enhanced compaction resistance. Appl. Clay Sci. 2020, 199, 105873. [Google Scholar] [CrossRef]
- Jyothi, M.S.; Padaki, M.; Geetha Balakrishna, R.; Krishna Pai, R. Synthesis and design of PSf/TiO2 composite membranes for reduction of chromium (VI): Stability and reuse of the product and the process. J. Mater. Res. 2014, 29, 1537–1545. [Google Scholar] [CrossRef]
- Moideen, K.I.; Isloor, A.M.; Ismail, A.F.; Obaid, A.; Fun, H.K. Fabrication and Characterization of New PSF/PPSU UF Blend Membrane For Heavy Metal Rejection. Desalination Water Treat. 2015, 57, 19810–19819. [Google Scholar] [CrossRef]
- Agbaje, T.A.; Al-Gharabli, S.; Mavukkandy, M.O.; Kujawa, J.; Arafat, H.A. PVDF/magnetite blend membranes for enhanced flux and salt rejection in membrane distillation. Desalination 2018, 436, 69–80. [Google Scholar] [CrossRef]
- Feng, Y.; Han, G.; Chung, T.S.; Weber, M.; Widjojo, N.; Maletzko, C. Effects of polyethylene glycol on membrane formation and properties of hydrophilic sulfonated polyphenylenesulfone (sPPSU) membranes. J. Membr. Sci. 2017, 531, 27–35. [Google Scholar] [CrossRef]
- Moslehyani, A.; Ismail, A.F.; Matsuura, T.; Rahman, M.A.; Goh, P.S. Recent Progresses of Ultrafiltration (UF) Membranes and Processes in Water Treatment Membrane. Sep. Princ. Appl. 2019, 10, 85–110. [Google Scholar]
- Singh, R.; Sinha, M.K.; Purkait, M.K. Stimuli responsive mixed matrix polysulfone ultrafiltration membrane for humic acid and photocatalytic dye removal applications. Sep. Purif. Technol. 2020, 250, 20–24. [Google Scholar] [CrossRef]
- Sun, M.; Su, Y.; Mu, C.; Jiang, Z. Improved antifouling property of PES ultrafiltration membranes using additive of silica−PVP nanocomposite. Ind. Eng. Chem. Res. 2009, 49, 790–796. [Google Scholar] [CrossRef]
- Ulbricht, M. Polymer Nanocomposite Ultrafiltration Membrane. Membranes 2020, 2, 10–15. [Google Scholar]
- Field, R.W.; Wu, J.J. Permeate Flux in Ultrafiltration Processes—Understandings and Misunderstandings. Membranes 2022, 12, 187. [Google Scholar] [CrossRef] [PubMed]
- Alexandra, M.; Schneider, R.; Venus, J. Membrane technologies for lactic acid separation from fermentation broths derived from renewable resources. Membranes 2018, 8, 94. [Google Scholar] [CrossRef] [PubMed]
- Ma, Y.; Shi, F.; Ma, J.; Wu, M.; Zhang, J.; Gao, C. Effect of PEG additive on the morphology and performance of polysulfone ultrafiltration membranes. Desalination 2011, 272, 51–58. [Google Scholar] [CrossRef]
- Tang, Y.; Lin, Y.; Ma, W.; Wang, X. A review on microporous polyvinylidene fluoride membranes fabricated via thermally induced phase separation for MF/UF application. J. Membr. Sci. 2021, 639, 20–25. [Google Scholar] [CrossRef]
- Na’aman WH, W.; Saufi, S.M.; Seman MN, A.; Yussof, H.W.; Mohammad, A.W. Fabrication of asymmetric nanofiltration flatsheet membrane for the separation of acetic acid from xylose and glucose. Chem. Eng. Trans. 2017, 56, 1201–1206. [Google Scholar]
- Chew, T.L.; Ding, S.H.; Oh, P.C.; Ahmad, A.L.; Ho, C.D. Functionalized KIT-6/polysulfone mixed matrix membranes for enhanced CO2/CH4 gas separation. Polymers 2020, 12, 2312. [Google Scholar] [CrossRef] [PubMed]


| Label of the Membrane | UF Membrane | PSf wt.% | DMAc wt.% | Mixed Matrix Membrane (MMM) | |
|---|---|---|---|---|---|
| TiO2 (wt.%) | PEG (wt.%) | ||||
| M0 | PSf membrane | 16 | 84 | - | - |
| M1 | PSf + TiO2 membrane | 16 | 83.5 | 0.5 | - |
| M2 | PSf + PEG 400 membrane | 16 | 79 | - | 5 |
| M3 | PSf + TiO2 + PEG 600 membrane | 16 | 78.5 | 0.5 | 5 |
| M4 | PSf + TiO2 + PEG 1000 membrane | 16 | 78.5 | 0.5 | 5 |
| M5 | PSf + TiO2 + PEG 1500 membrane | 16 | 78.5 | 0.5 | 5 |
| M6 | PSf + TiO2 + PEG 4000 membrane | 16 | 78.5 | 0.5 | 5 |
| M7 | PSf + TiO2 + PEG 6000 membrane | 16 | 78.5 | 0.5 | 5 |
| Possible Interaction between Polymer and Additives | Description |
|---|---|
 | Reaction of PSf and PEG. |
 | The carbon oxygen reaction between PSf and PEG molecules blended in membrane. |
 | Carbon oxygen stretching between polymer chain and TiO2 particles in membrane matrix. |
| Peaks | Peak Position, 2θ | Intensity | Interplanar Spacing d (Å) | Crystallite Size (nm) |
|---|---|---|---|---|
| Peak 1 | 22.45 | 11,961 | 1.499 | 27.176 |
| Peak 2 | 34.109 | 1936 | 2.25 | 25.237 |
| Peak 3 | 47.57 | 12,547 | 3.104 | 22.196 |
| Peak 4 | 19.10 | 2759 | 1.277 | 30.05 |
| Peak 5 | 19.10 | 2831 | 1.277 | 50.543 |
| Peak 6 | 19.10 | 3407 | 1.277 | 48.659 |
| Membrane | Porosity (%) | Mean Pore Size (nm) |
|---|---|---|
| M0 | 32.9 | 25.02 ± 0.2 |
| M1 | 38.5 | 29.02 ± 0.2 |
| M2 | 46.1 | 31.45 ± 0.3 |
| M3 | 62.9 | 32.39 ± 0.4 |
| M4 | 68.2 | 33.57 ± 0.4 |
| M5 | 68.3 | 34.65 ± 0.2 |
| M6 | 68.8 | 44.92± 0.2 |
| M7 | 70.7 | 50.63 ± 0.4 |
| Membranes | Initial PWF (JwF1) (L/m2·h) | Diluted AA Permeate (JAA) (L/m2·h) | Diluted AA Retentate (RAA) (L/m2·h) | Final PWF (JwF2) (L/m2·h) | The Concentration of Permeated Diluted Acetic Acid (Retentate) (mg/mL) | Retentate (%) of Diluted AA on Membrane |
|---|---|---|---|---|---|---|
| M0 | 130 | 100.82 | 70.41 | 126.71 | 36.6 | 26.8 |
| M1 | 131.2 | 85.96 | 85.26 | 130.1 | 29.3 | 41.4 |
| M2 | 151.52 | 79.52 | 91.7 | 144.18 | 23.3 | 53.4 |
| M3 | 160.22 | 70 | 101.22 | 150.75 | 20.6 | 58.8 |
| M4 | 161.14 | 50.27 | 120.93 | 154.11 | 16 | 68 |
| M5 | 162 | 35.27 | 135.99 | 156.16 | 7.5 | 85 |
| M6 | 169.12 | 27.40 | 143.84 | 160.96 | 4.9 | 90.2 |
| M7 | 170.1 | 20.50 | 150 | 164.73 | 3.9 | 92.2 |
| Types of Membrane | Concentration Polarization of AA, Cm(g/cm3) | Concentration of Permeated AA, Cp (g/cm3) |
|---|---|---|
| M0 | 0.065 | 0.036 |
| M1 | 0.072 | 0.029 |
| M2 | 0.079 | 0.023 |
| M3 | 0.082 | 0.02 |
| M4 | 0.087 | 0.016 |
| M5 | 0.097 | 0.0075 |
| M6 | 0.100 | 0.0049 |
| M7 | 0.101 | 0.0039 |
Disclaimer/Publisher’s Note: The statements, opinions and data contained in all publications are solely those of the individual author(s) and contributor(s) and not of MDPI and/or the editor(s). MDPI and/or the editor(s) disclaim responsibility for any injury to people or property resulting from any ideas, methods, instructions or products referred to in the content. |
© 2023 by the authors. Licensee MDPI, Basel, Switzerland. This article is an open access article distributed under the terms and conditions of the Creative Commons Attribution (CC BY) license (https://creativecommons.org/licenses/by/4.0/).
Share and Cite
Pusphanathan, K.; Shukor, H.; Shoparwe, N.F.; Makhtar, M.M.Z.; Zainuddin, N.I.; Jullok, N.; Siddiqui, M.R.; Alam, M.; Rafatullah, M. Efficiency of Fabricated Adsorptive Polysulfone Mixed Matrix Membrane for Acetic Acid Separation. Membranes 2023, 13, 565. https://doi.org/10.3390/membranes13060565
Pusphanathan K, Shukor H, Shoparwe NF, Makhtar MMZ, Zainuddin NI, Jullok N, Siddiqui MR, Alam M, Rafatullah M. Efficiency of Fabricated Adsorptive Polysulfone Mixed Matrix Membrane for Acetic Acid Separation. Membranes. 2023; 13(6):565. https://doi.org/10.3390/membranes13060565
Chicago/Turabian StylePusphanathan, Kavita, Hafiza Shukor, Noor Fazliani Shoparwe, Muaz Mohd Zaini Makhtar, Nor’ Izzah Zainuddin, Nora Jullok, Masoom Raza Siddiqui, Mahboob Alam, and Mohd Rafatullah. 2023. "Efficiency of Fabricated Adsorptive Polysulfone Mixed Matrix Membrane for Acetic Acid Separation" Membranes 13, no. 6: 565. https://doi.org/10.3390/membranes13060565