
New Network Polymer Electrolytes Based on Ionic Liquid and SiO2 Nanoparticles for Energy Storage Systems
 ,
,  ,
,  , , , ,
Abstract
:1. Introduction
2. Materials and Methods
2.1. Materials
2.2. PEGDA Kinetics of Radical Polymerization
2.3. Synthesis of Nanocomposite Polymer Electrolytes
2.4. Differential Scanning Calorimetry (DSC) Method
2.5. Fourier Transform Infrared Spectroscopy (FTIR)
2.6. Thermogravimetric Analysis (TGA) Method
2.7. High-Resolution NMR
2.8. NMR with Pulsed Field Gradient
2.9. Electrochemical Methods
2.10. Quantum-Chemical Modeling
3. Results and Discussion
3.1. PEGDA Radical Polymerization Kinetics
3.2. DSC of NPEs
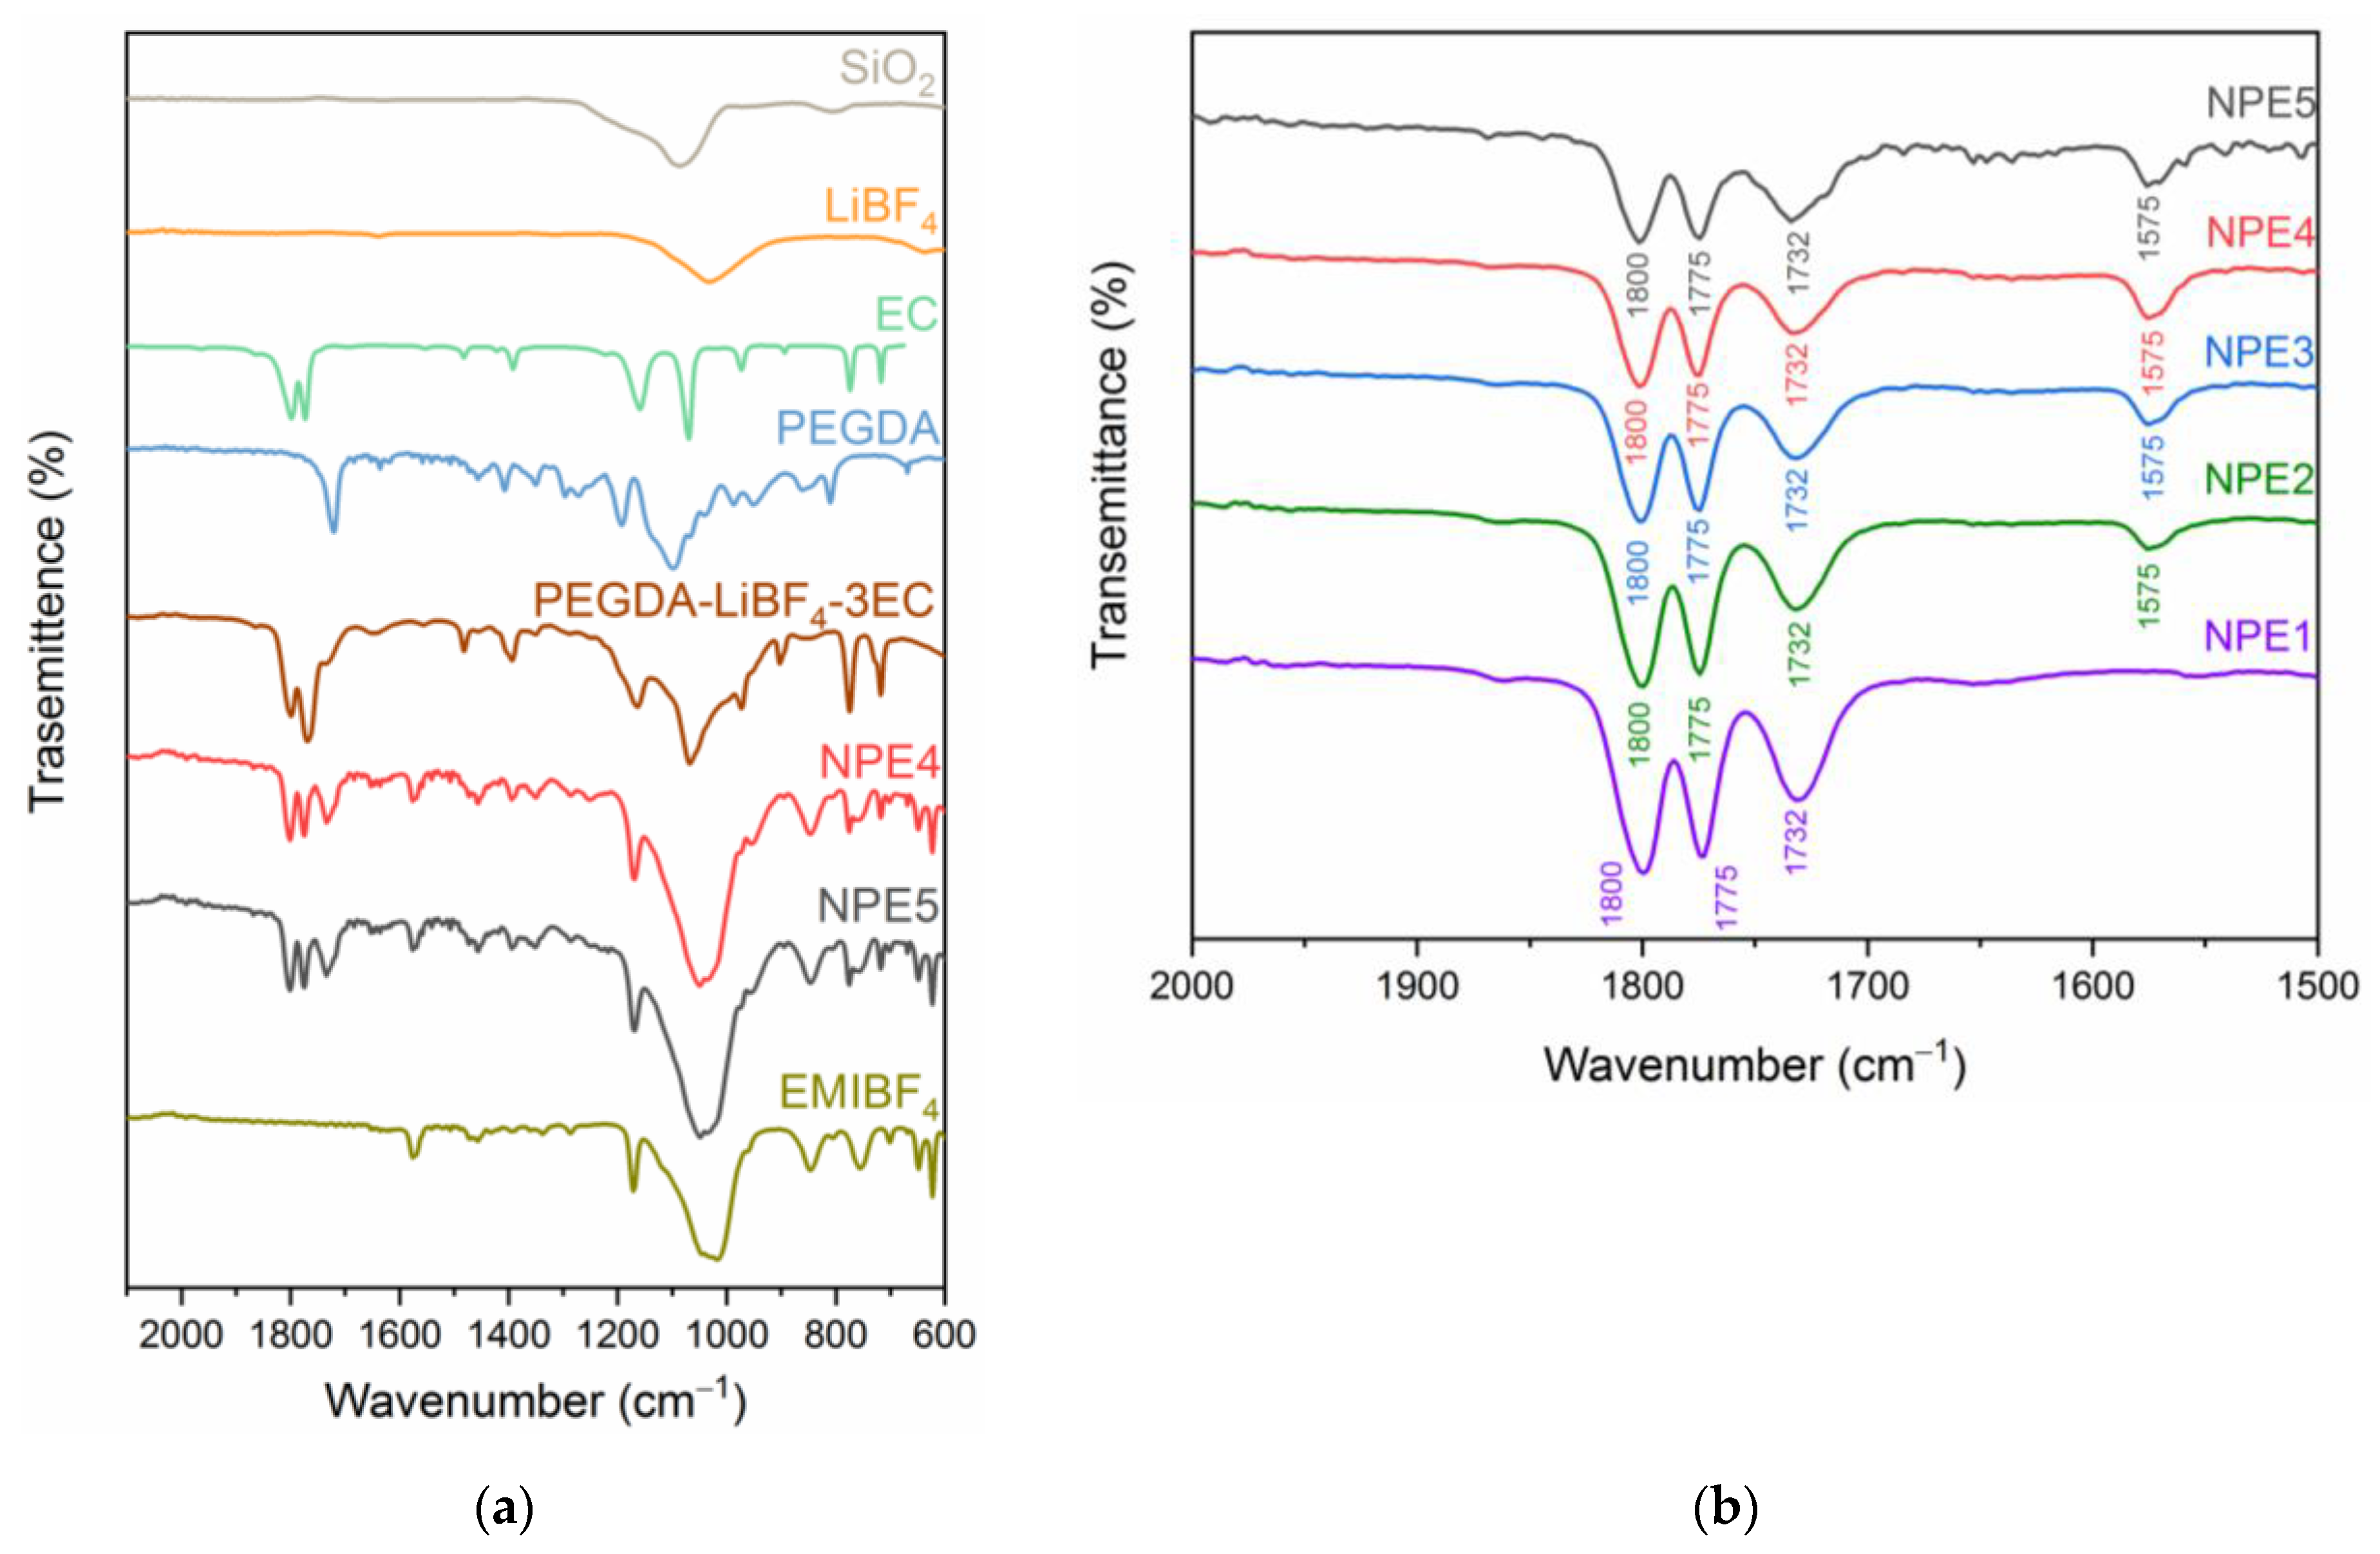
3.3. FTIR Analysis of NPEs
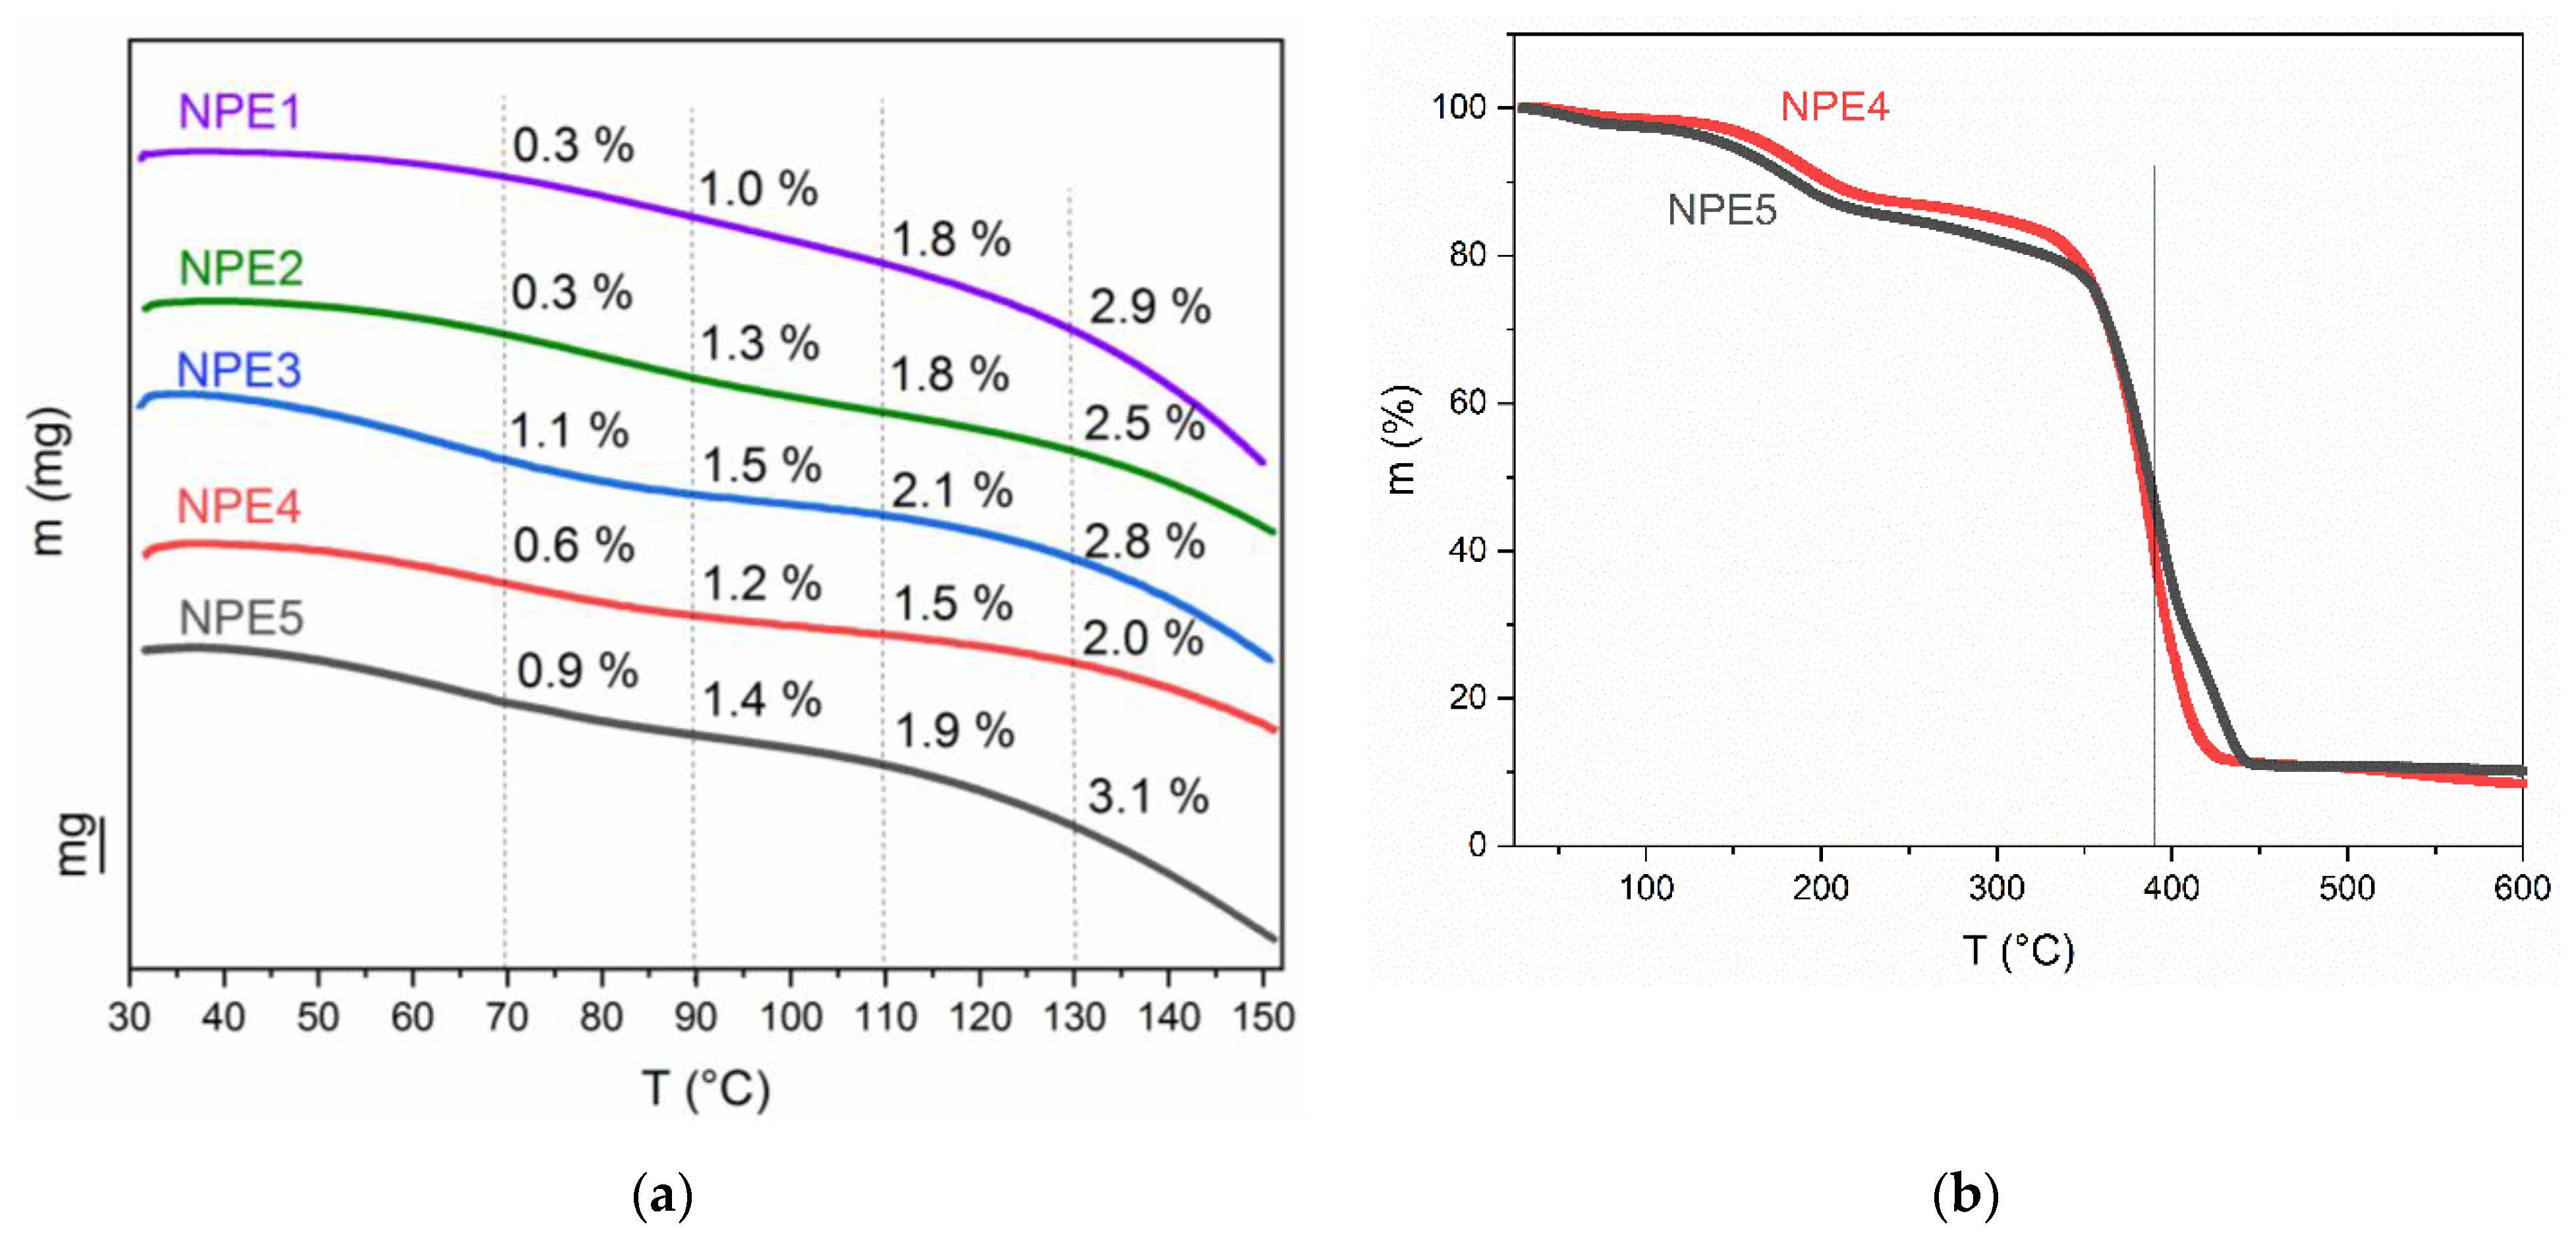
3.4. TGA of NPEs
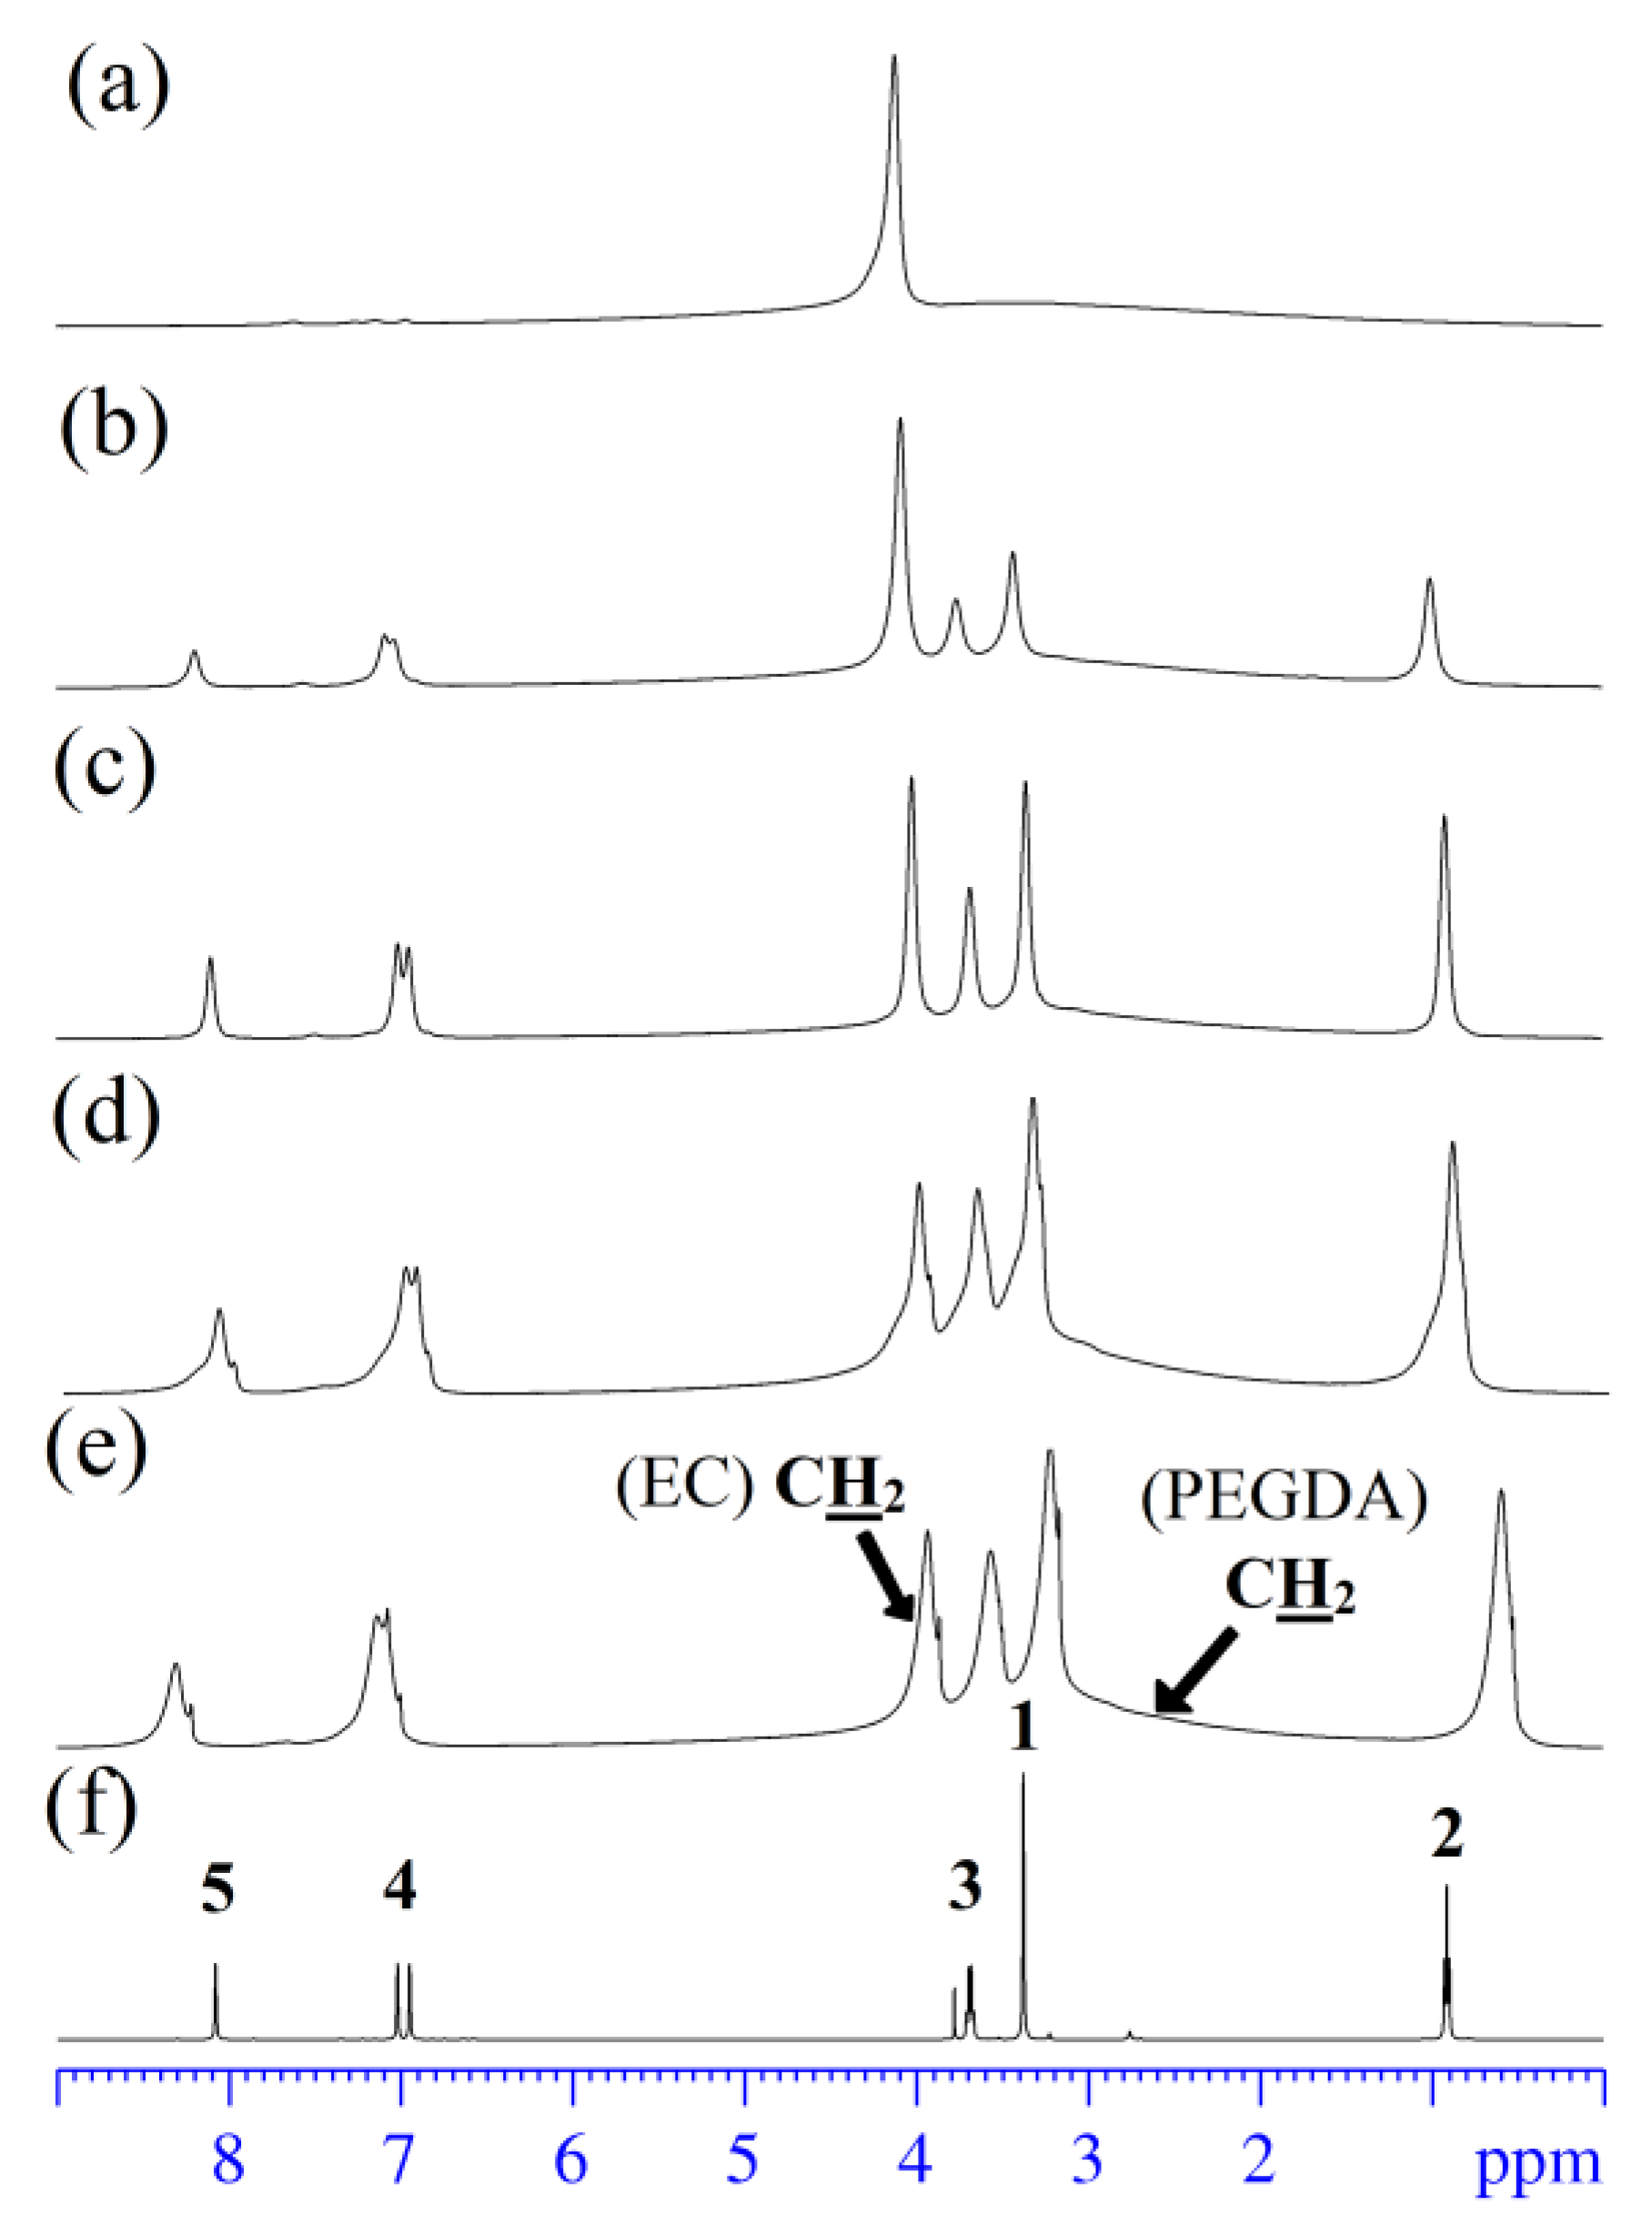
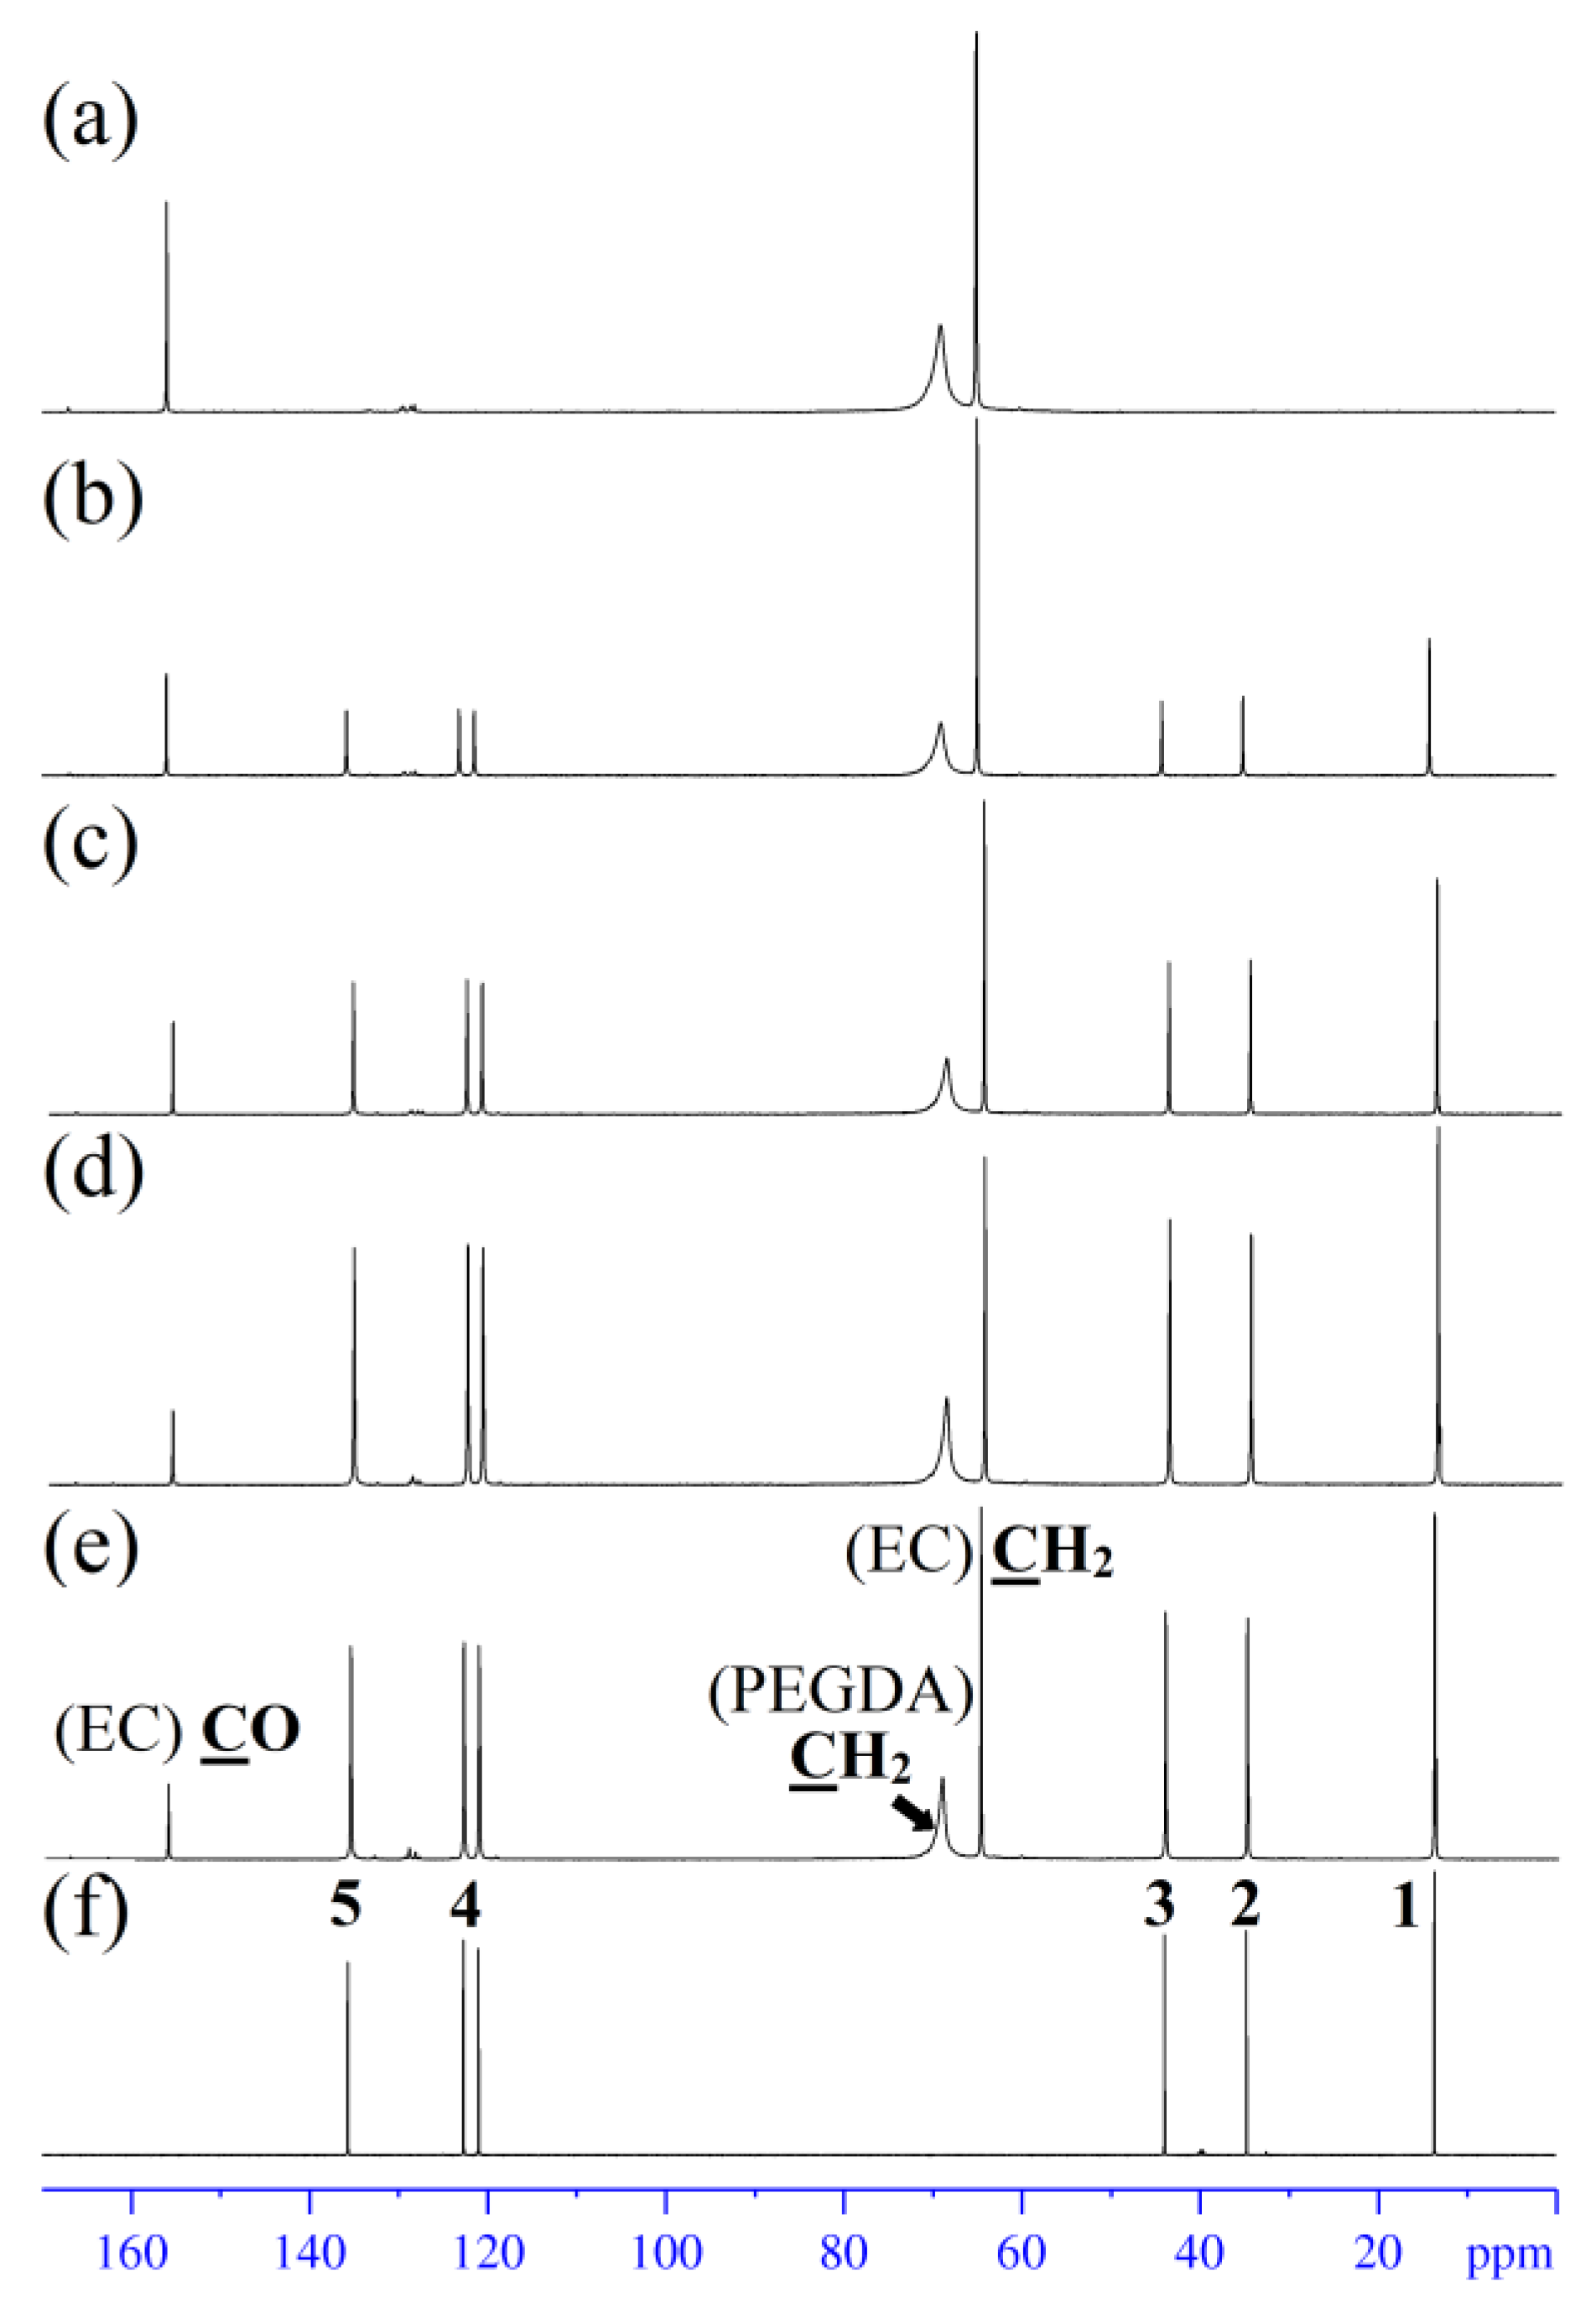
3.5. High-Resolution NMR
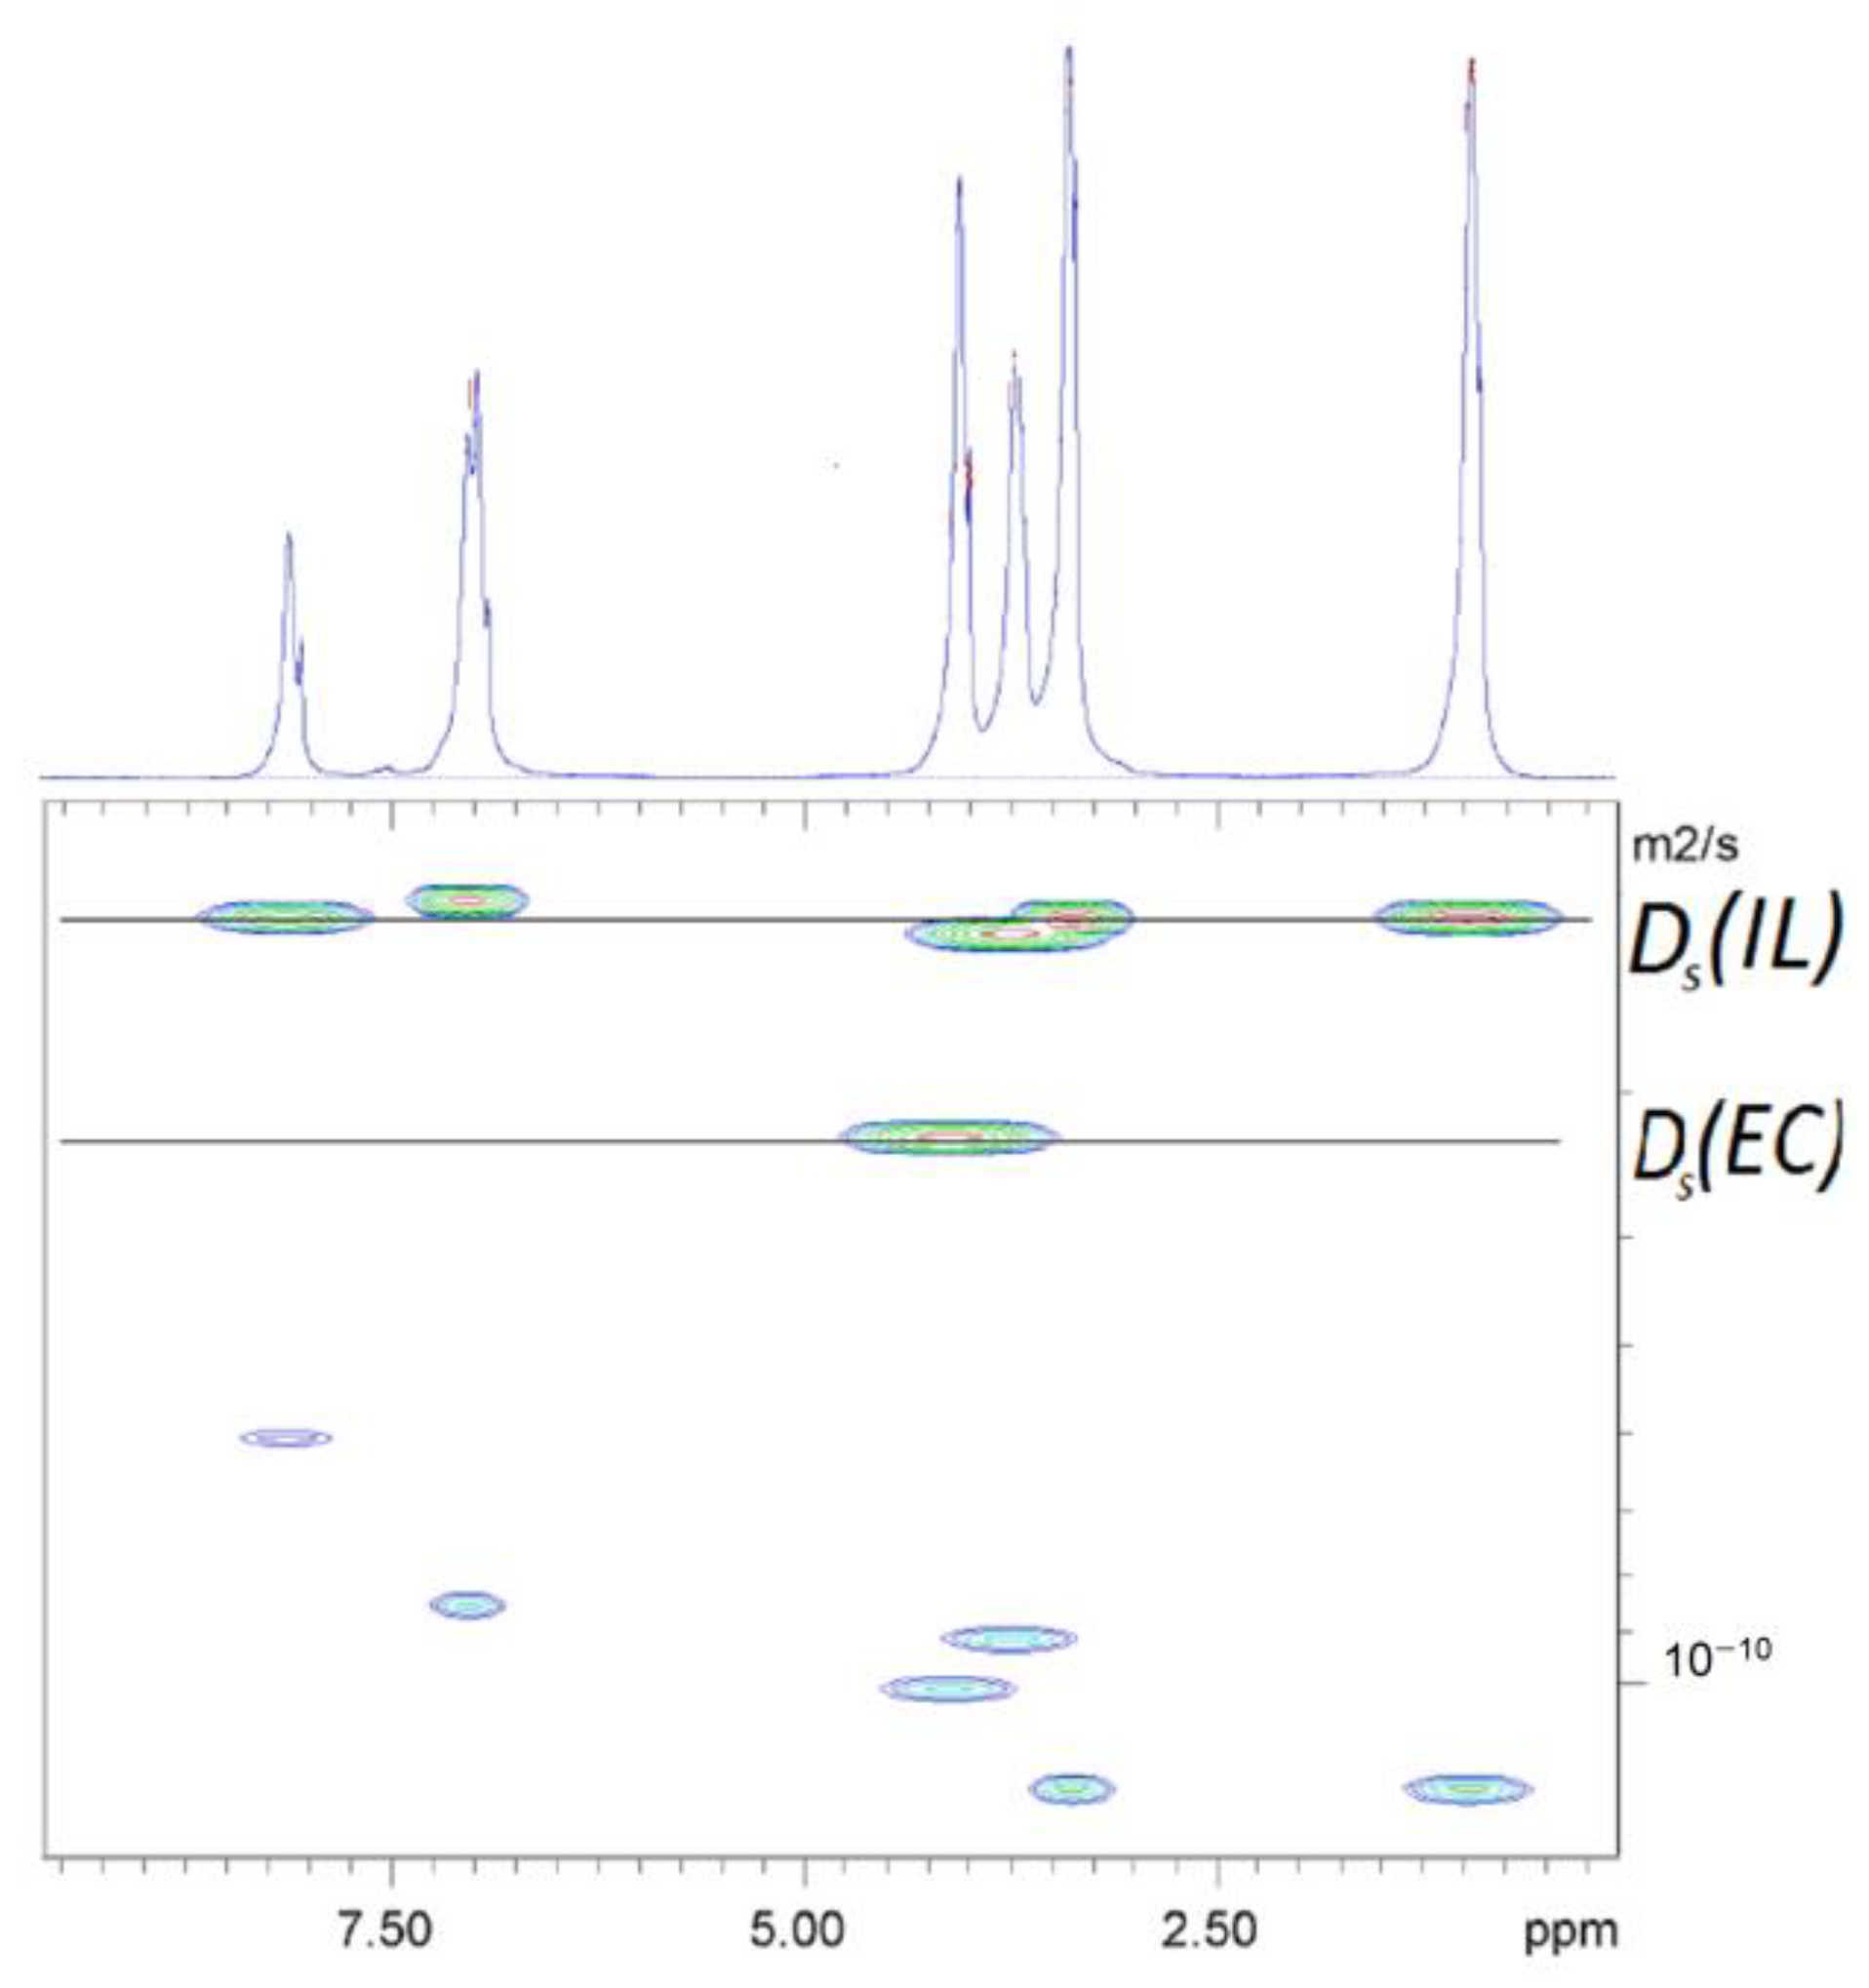
3.6. Self-Diffusion Coefficients (SDCs) According to the PFG NMR Data
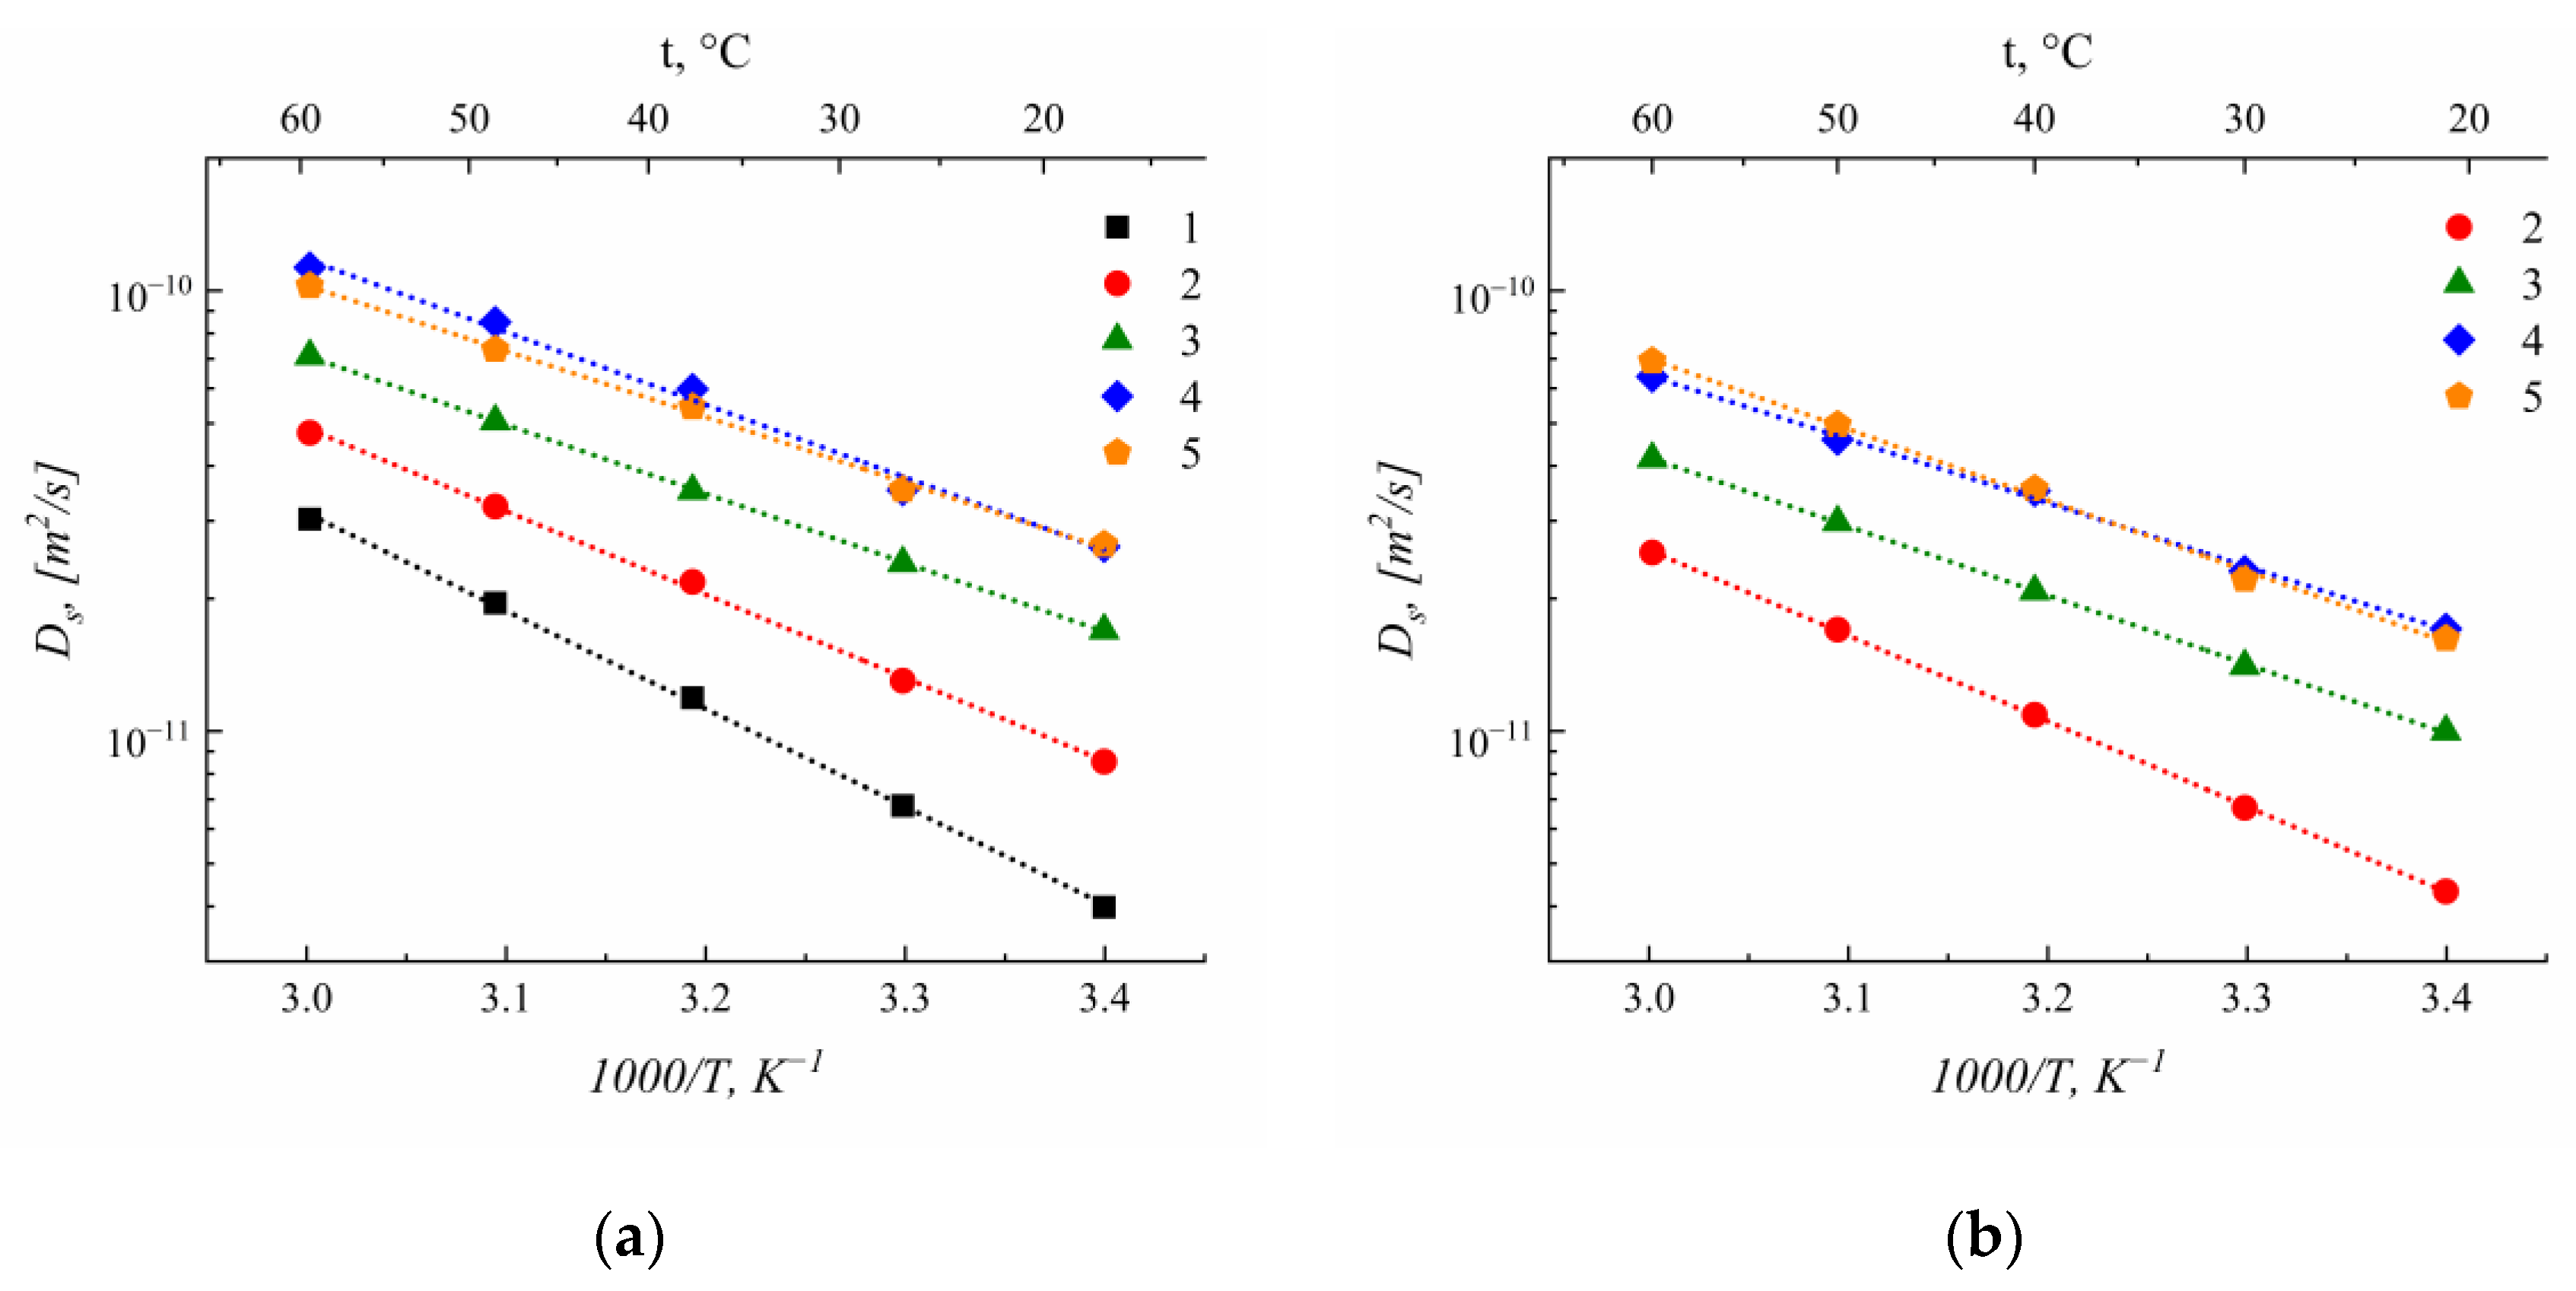
3.6.1. Self-Diffusion Coefficients on 1H Nucleus
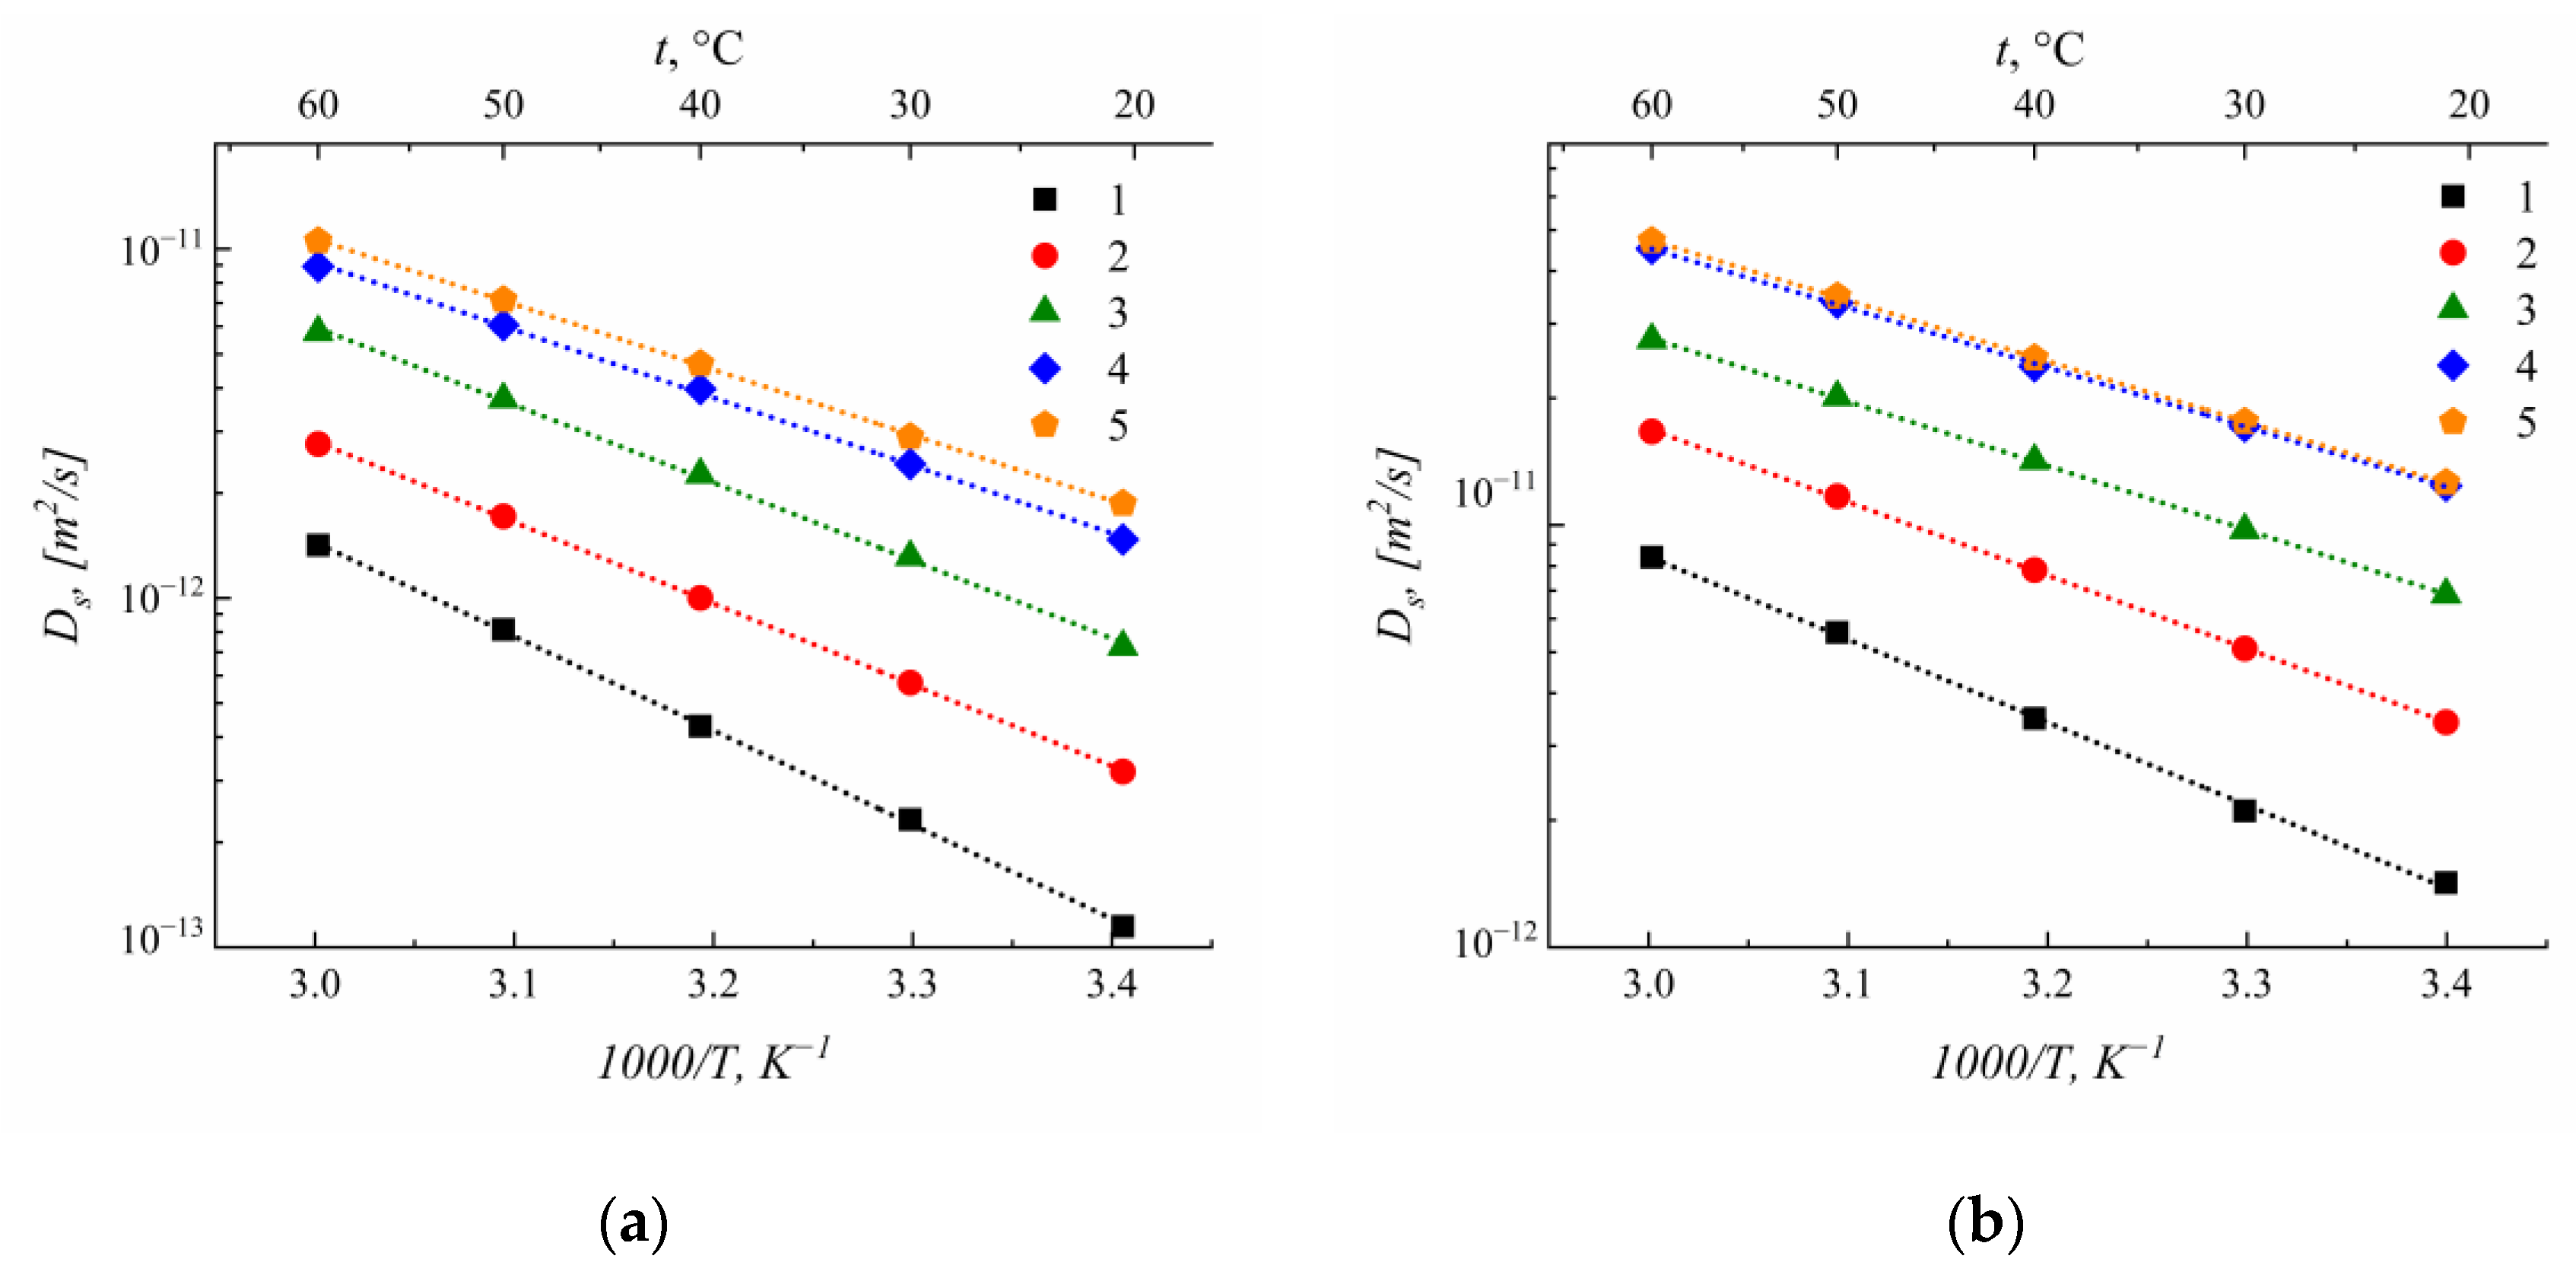
3.6.2. Self-Diffusion Coefficients on 7Li Nucleus
3.6.3. Self-Diffusion Coefficients on 19F Nucleus
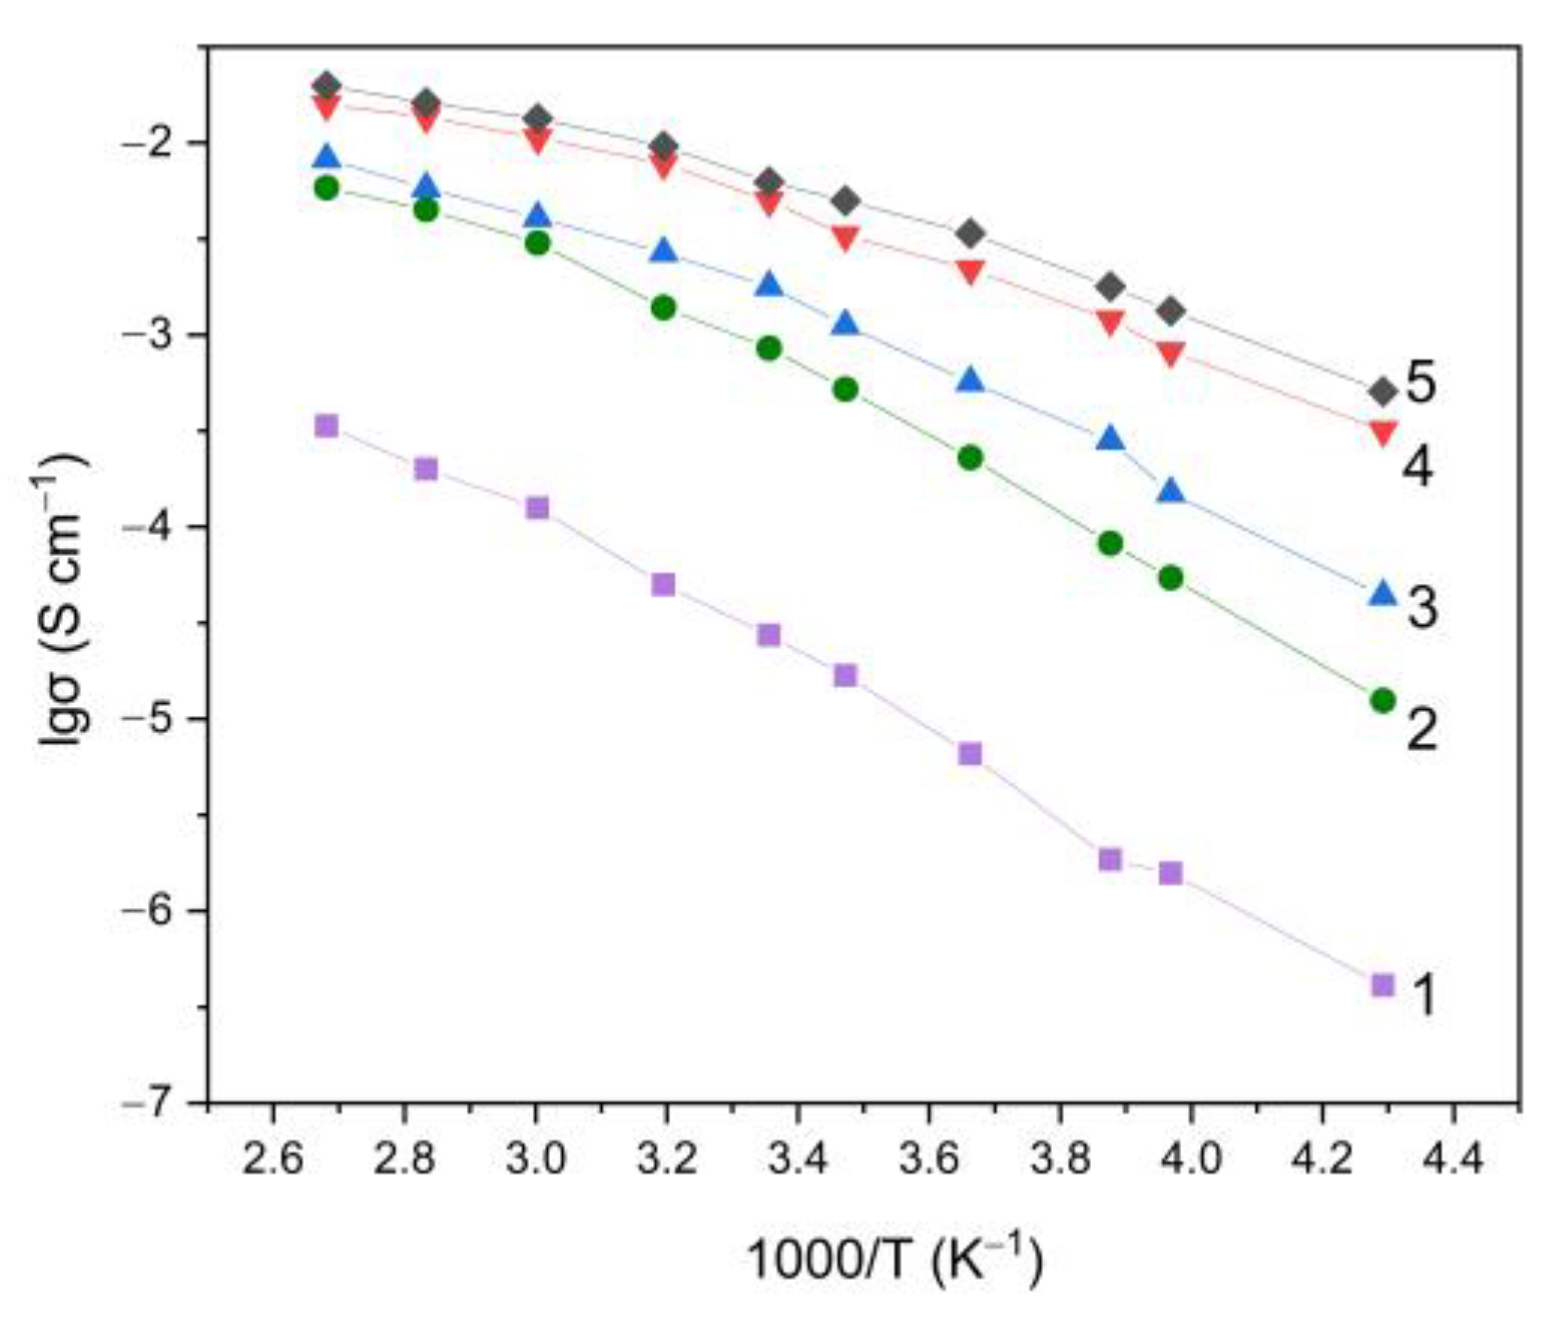
3.7. NPE Conductivity
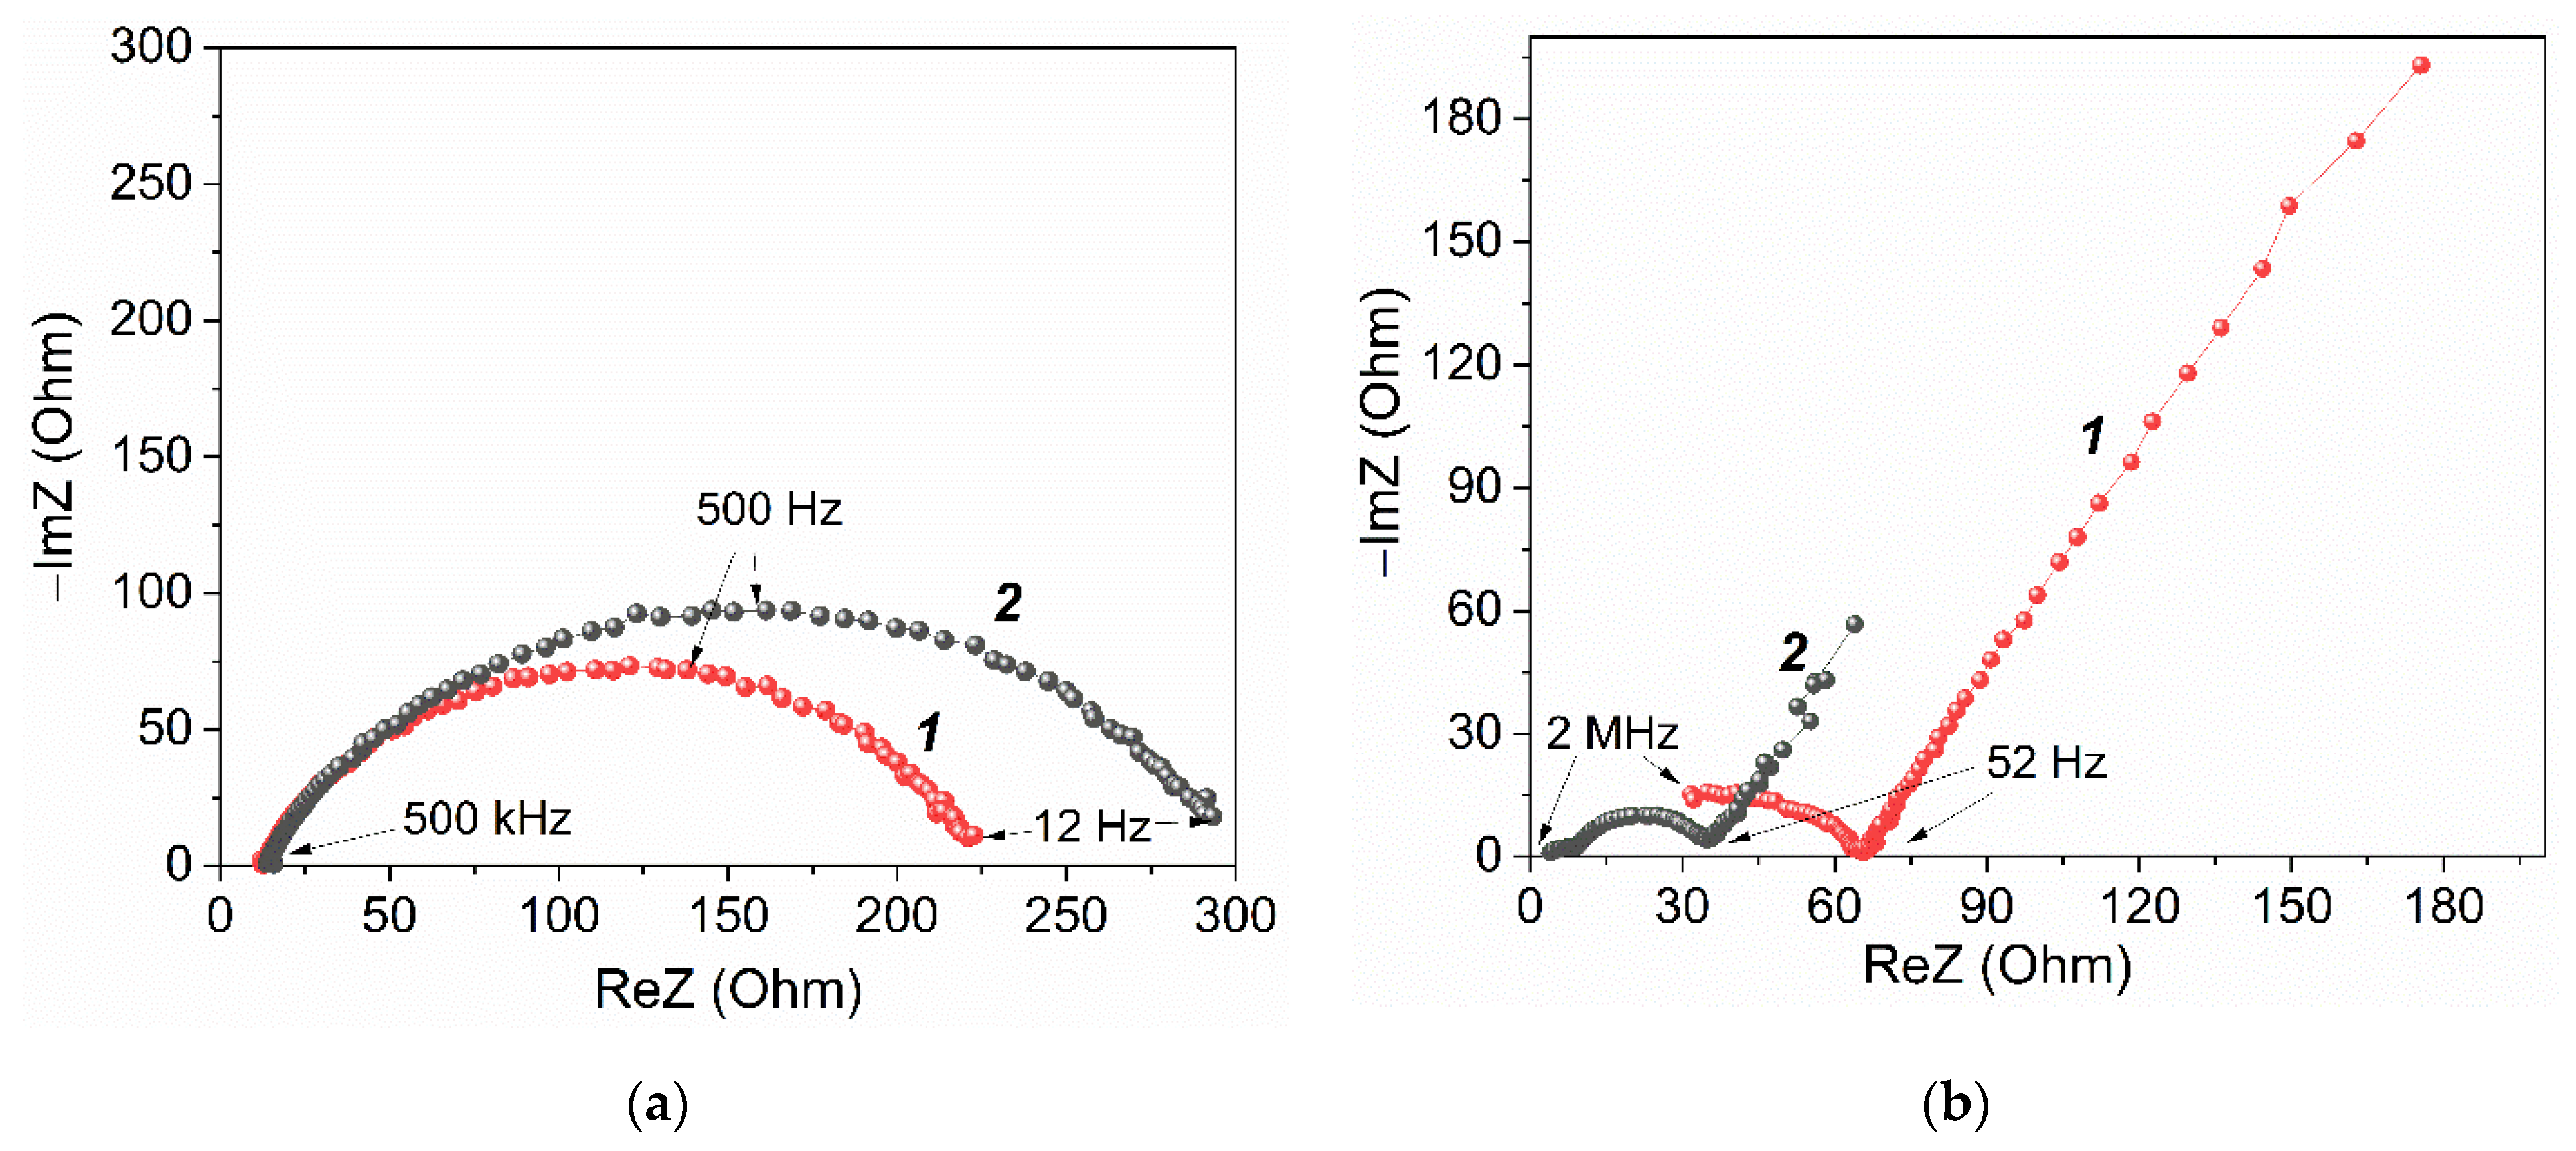
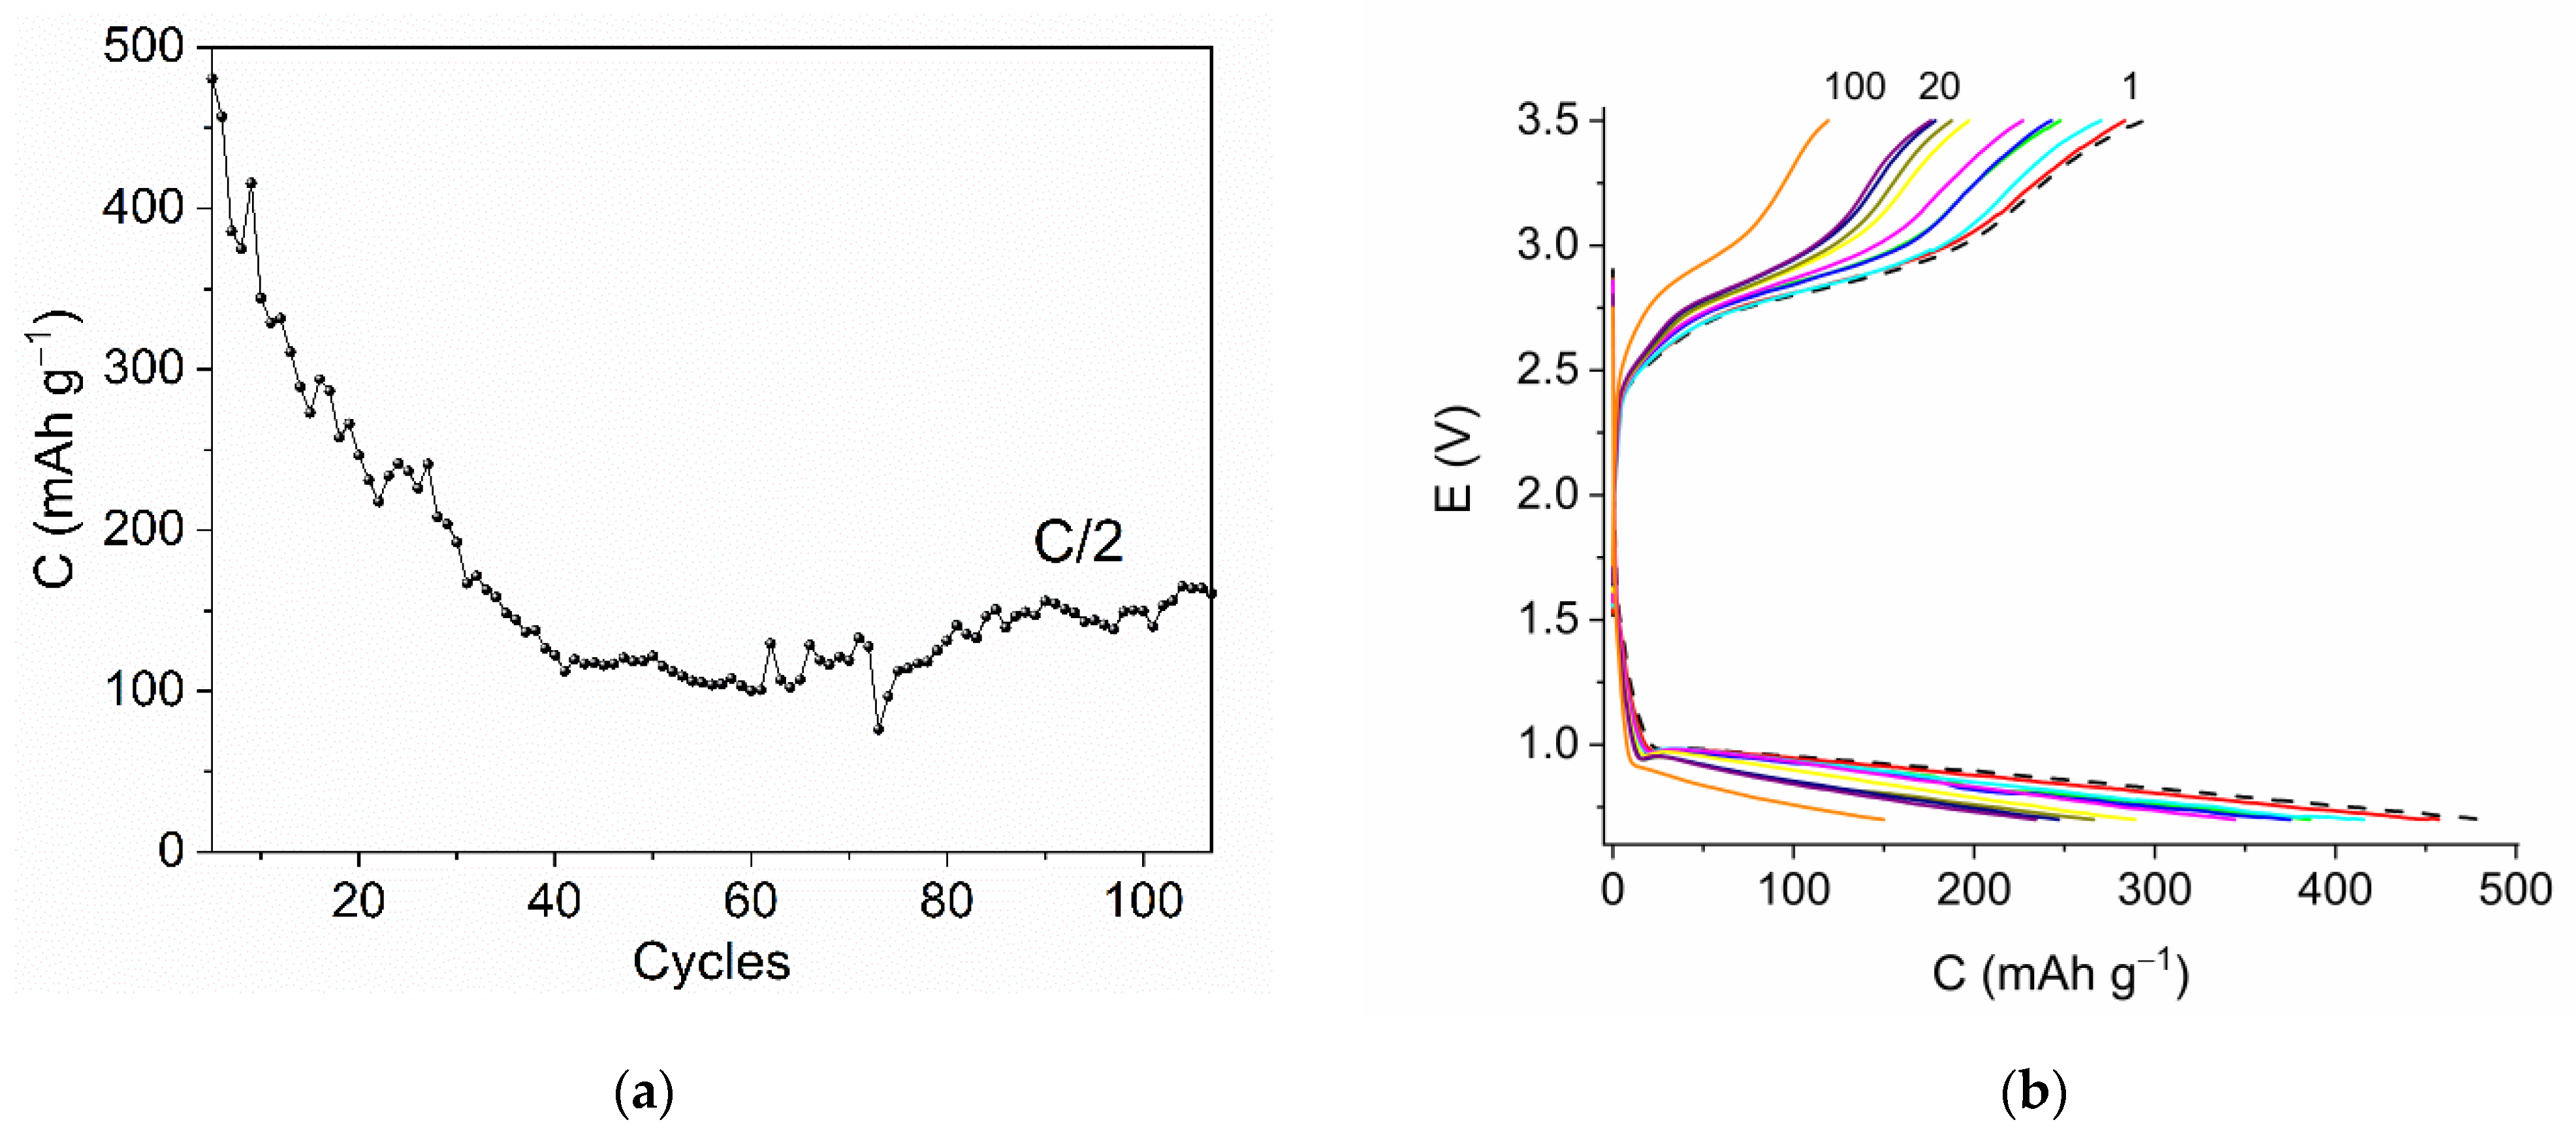
3.8. Electrochemical Study of NPEs in Li//LiOTAP Cells
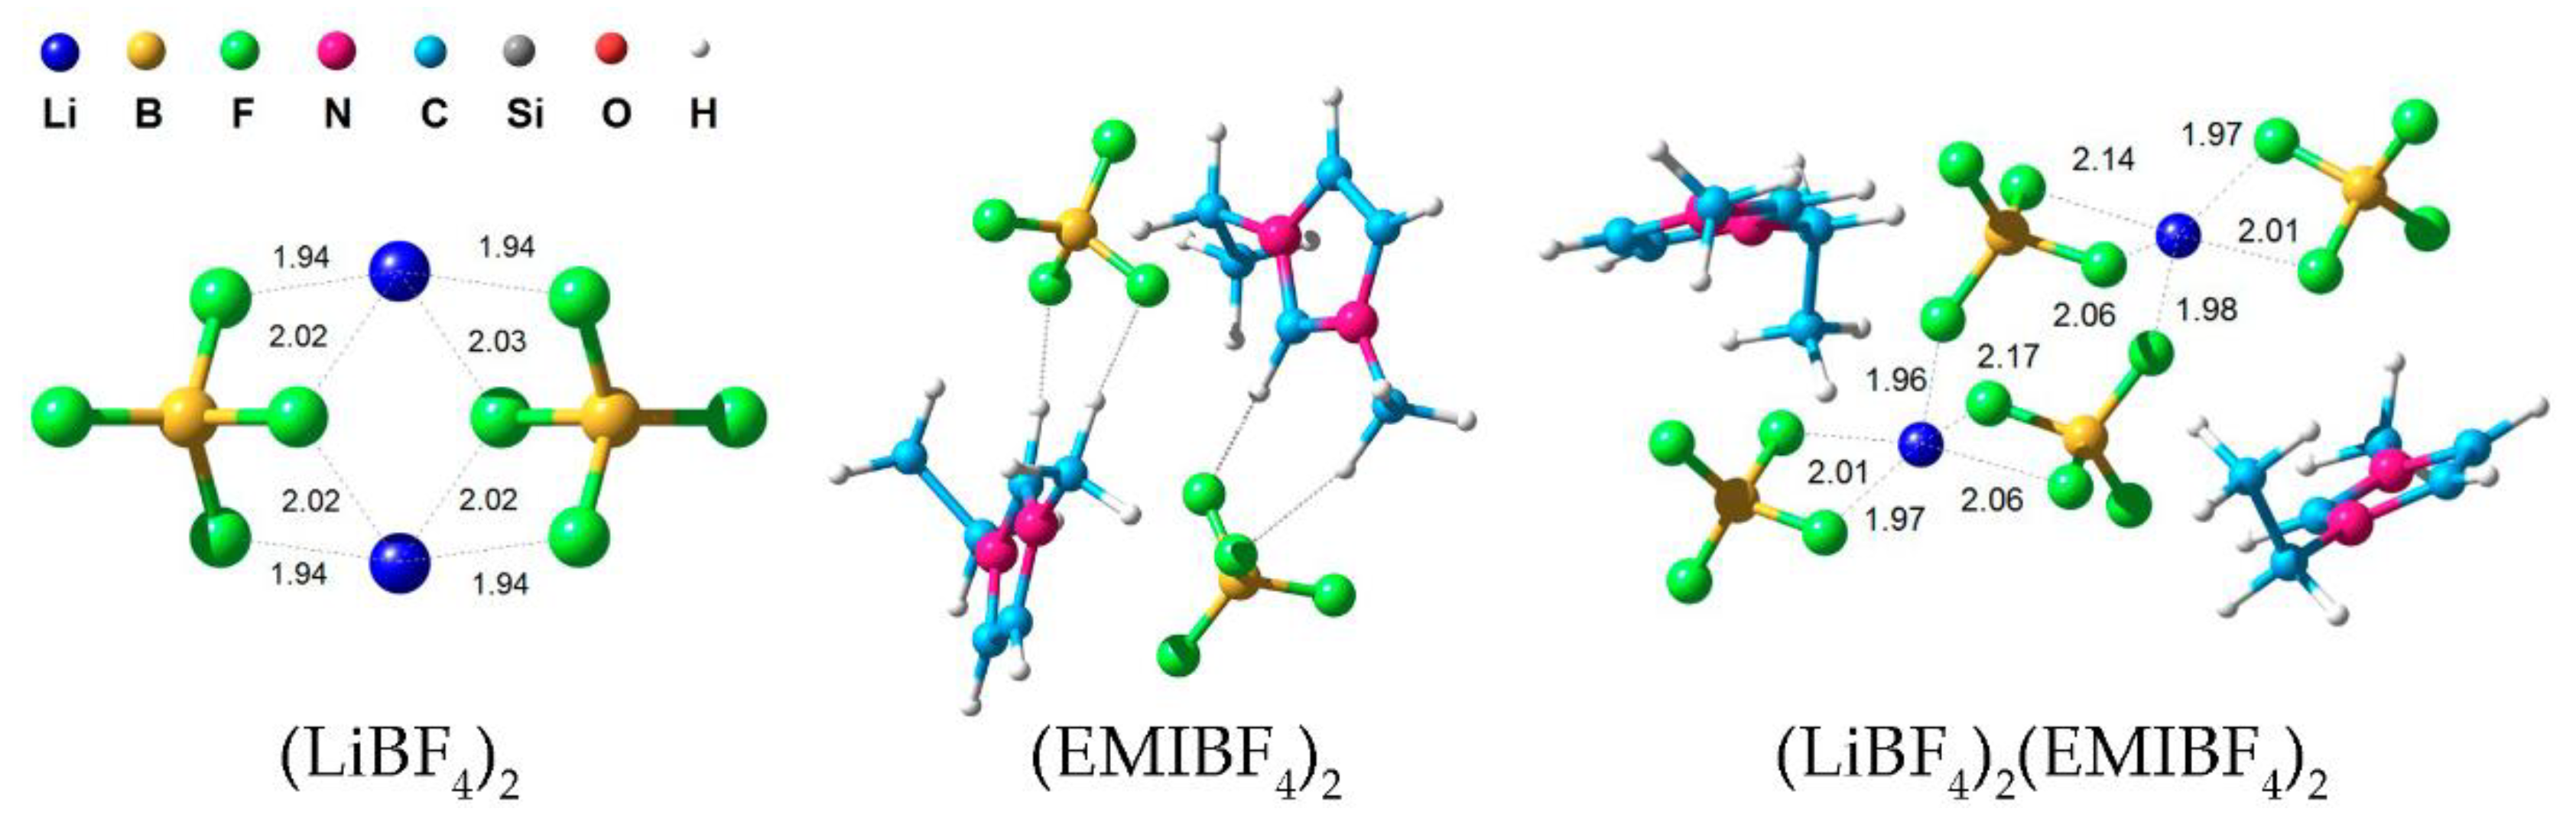
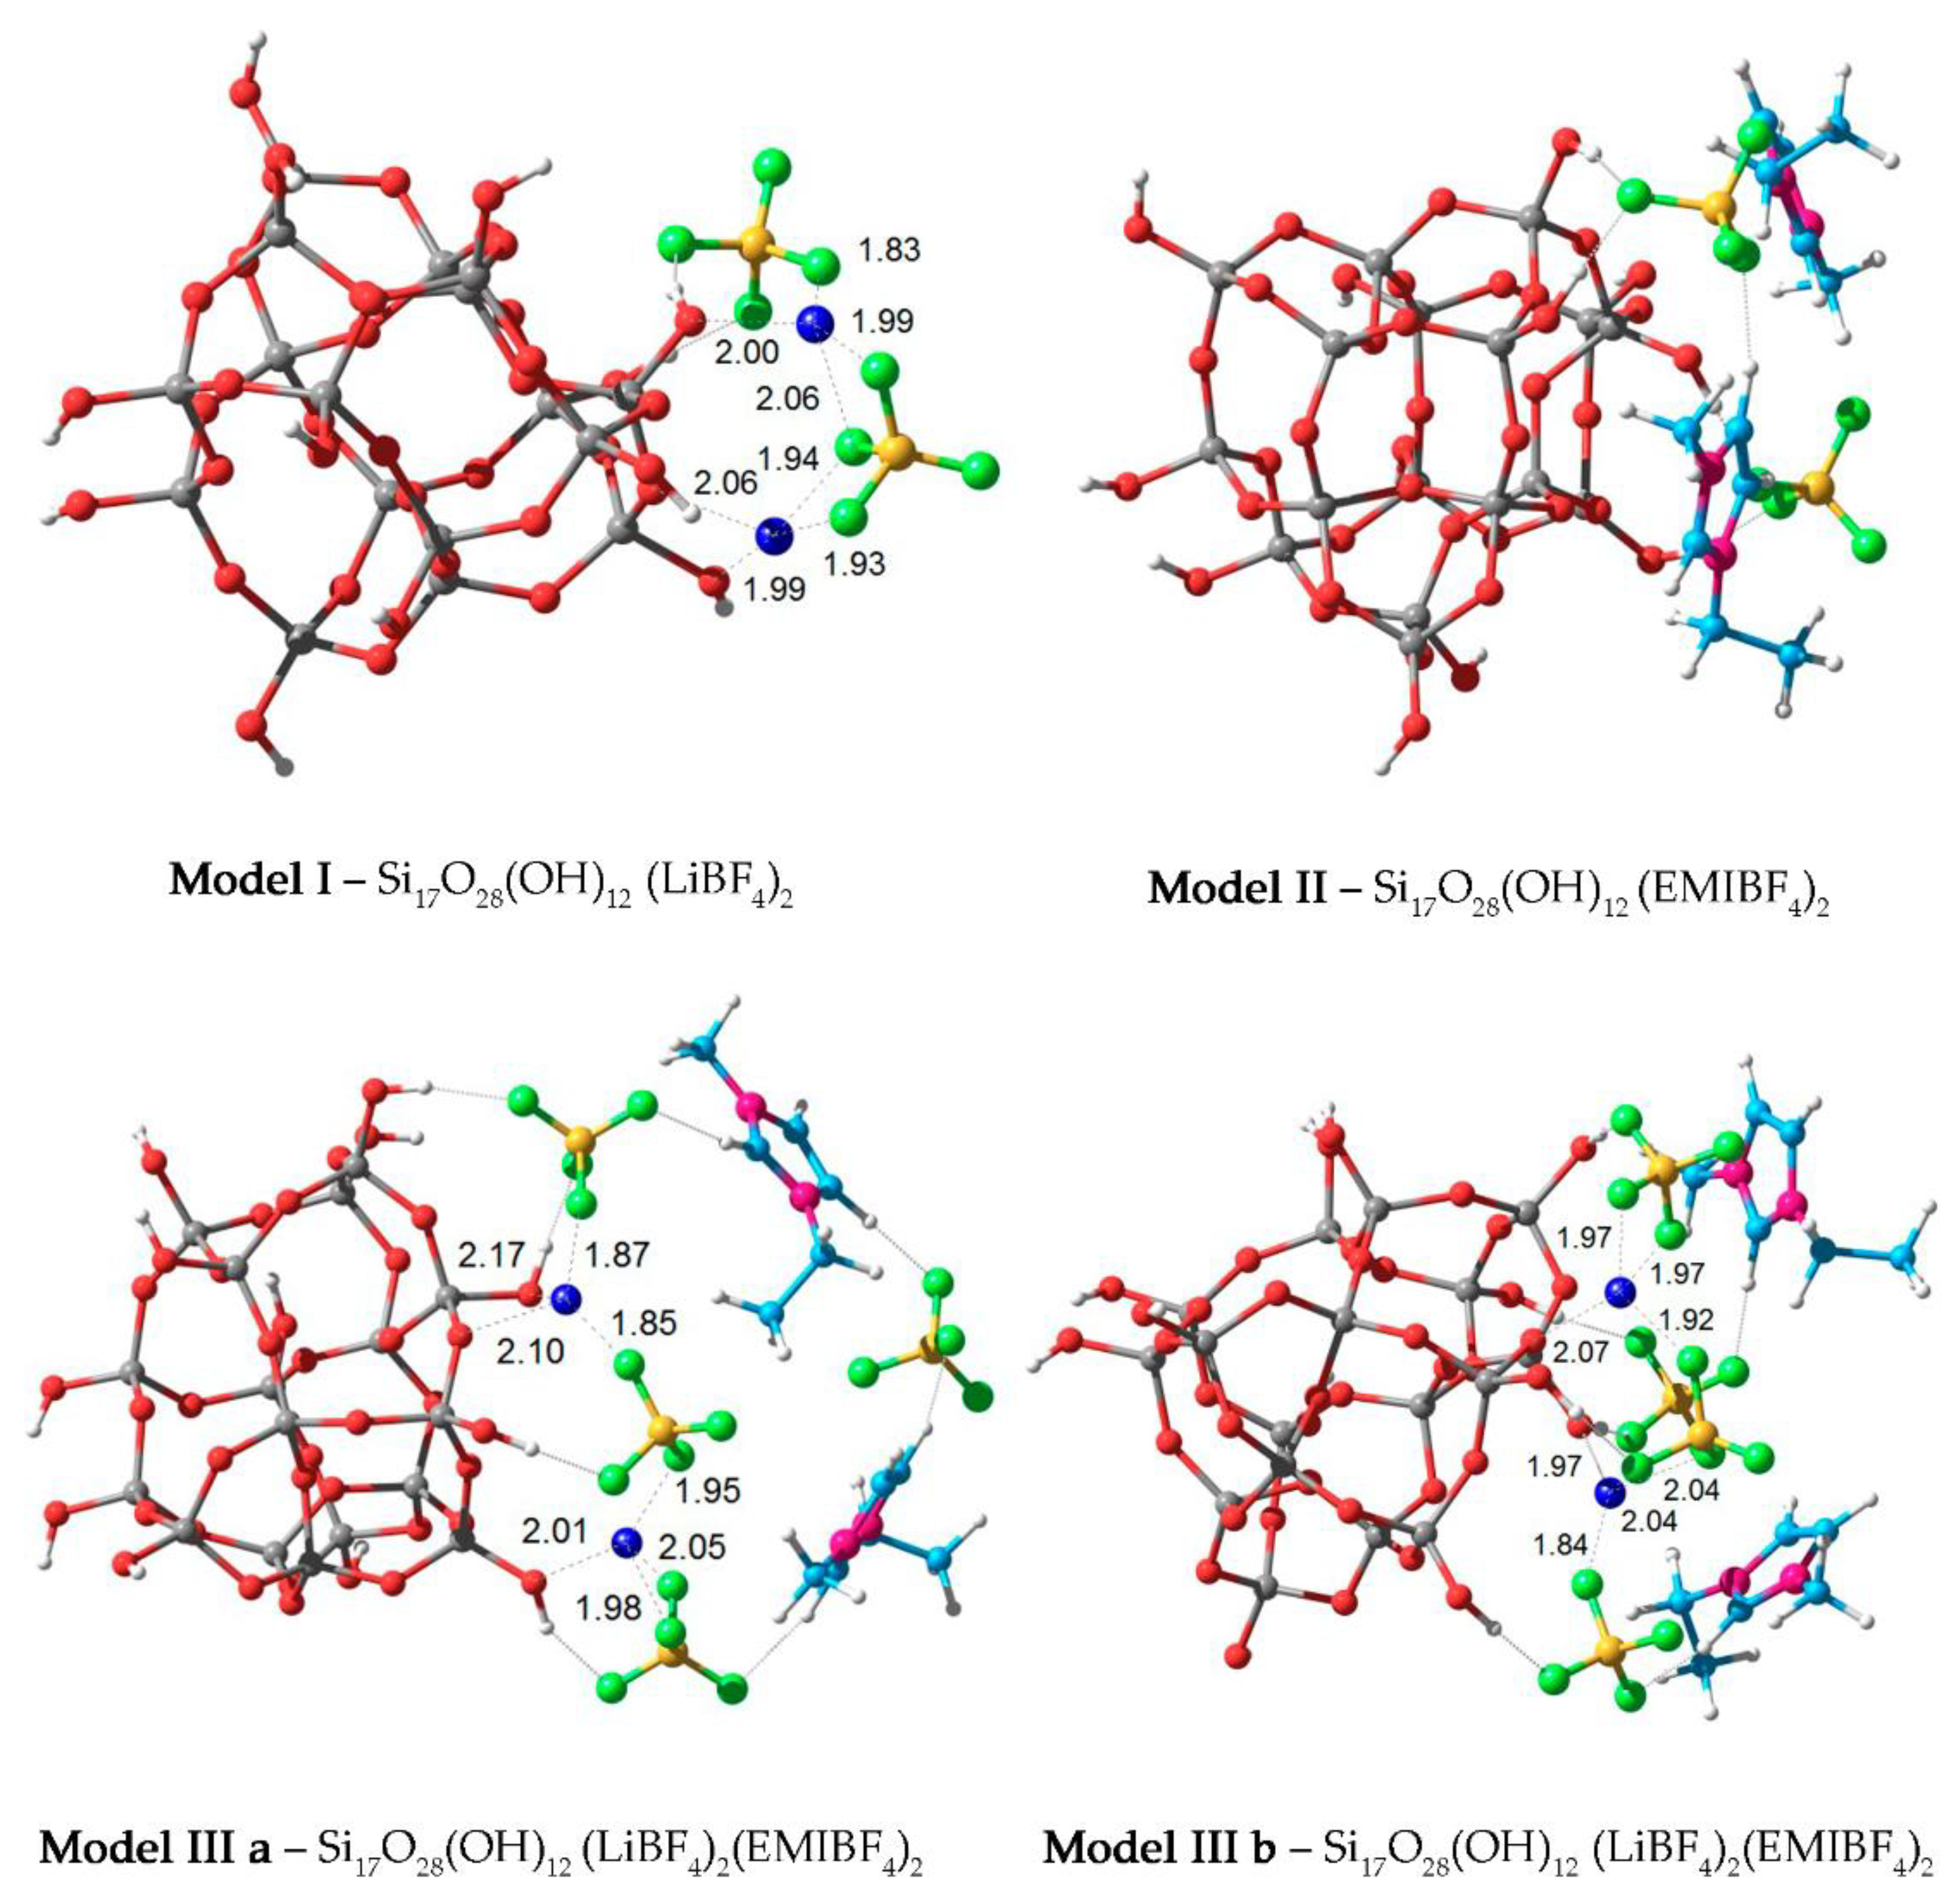
3.9. Quantum-Chemical Modeling
4. Conclusions
Supplementary Materials
Author Contributions
Funding
Institutional Review Board Statement
Data Availability Statement
Conflicts of Interest
References
- Mishra, K.; Devi, N.; Siwal, S.S.; Zhang, Q.; Alsanie, W.F.; Scarpa, F.; Thakur, V.K. Ionic Liquid-Based Polymer Nanocomposites for Sensors, Energy, Biomedicine, and Environmental Applications: Roadmap to the Future. Adv. Sci. 2022, 9, 2202187. [Google Scholar] [CrossRef] [PubMed]
- Kataria, S.; Verma, Y.L.; Gupta, H.; Singh, S.K.; Srivastava, N.; Dhar, R.; Singh, R.K. Ionic Liquid Mediated Nano—Composite Polymer Gel Electrolyte for Rechargeable Battery Application. Polym.-Plast. Tech. Mat. 2020, 59, 952–958. [Google Scholar] [CrossRef]
- Pei, Y.; Zhang, Y.; Ma, J.; Fan, M.; Zhang, S.; Wang, J. Ionic Liquids for Advanced Materials. Mater. Today Nano 2022, 17, 100159. [Google Scholar] [CrossRef]
- Volkov, V.I.; Yarmolenko, O.V.; Chernyak, A.V.; Slesarenko, N.A.; Avilova, I.A.; Baymuratova, G.R.; Yudina, A.V. Polymer Electrolytes for Lithium-Ion Batteries Studied by NMR Techniques. Membranes 2022, 12, 416. [Google Scholar] [CrossRef] [PubMed]
- Boaretto, N.; Meabe, L.; Martinez-Ibañez, M.; Armand, M.; Zhang, H. Review—Polymer Electrolytes for Rechargeable Batteries: From Nanocomposite to Nanohybrid. J. Electrochem. Soc. 2020, 167, 070524. [Google Scholar] [CrossRef]
- Agafonov, A.V.; Grishina, E.P. Nanocomposites of Inorganic Oxides with Ionic Liquids. Synthesis, Properties, Application (Review). Russ. J. Inorg. Chem. 2019, 64, 1641–1648. [Google Scholar] [CrossRef]
- SaiPrasanna, C.M.; Austin Suthanthiraraj, S. PVC/PEMA-based Blended Nanocomposite Gel Polymer Electrolytes Plasticized with Room Temperature Ionic Liquid and Dispersed with Nano-ZrO2 for Zinc Ion Batteries. Polym. Compos. 2019, 40, 3402–3411. [Google Scholar] [CrossRef]
- Bo, L.; Zhang, X.; Luo, Z.; Saboori, T.; Dehghan, M.; Ghasemizadeh, M.; Karimi—Maleh, H.; Alagumalai, A.; Mahian, O. An Overview of the Applications of Ionic Fluids and Deep Eutectic Solvents Enhanced by Nanoparticles. J. Therm. Anal. Calorim. 2022, 147, 7589–7601. [Google Scholar] [CrossRef]
- del Bosque, A.; Muñoz, B.K.; Sánchez, M.; Ureña, A. Thermomechanically Robust Ceramic/Polymer Nanocomposites Modified with Ionic Liquid for Hybrid Polymer Electrolyte Applications. ACS Appl. Energy Mater. 2022, 5, 4247–4258. [Google Scholar] [CrossRef]
- Li, M.; Liao, Y.; Liu, Q.; Xu, J.; Sun, P.; Shi, H.; Li, W. Application of the Imidazolium Ionic Liquid Based Nano-Particle Decorated Gel Polymer Electrolyte for High Safety Lithium Ion Battery. Electrochim. Acta 2018, 284, 188–201. [Google Scholar] [CrossRef]
- Dutta, B.; Deb, D.; Bhattacharya, S. Ionic Liquid-SnO2 Nanoparticle Hybrid Electrolytes for Secondary Charge Storage Devices: Physicochemical and Electrochemical Studies. Int. J. Hydrog. Energy 2018, 43, 4081–4089. [Google Scholar] [CrossRef]
- Singh, S.; Arora, N.; Paul, K.; Kumar, R.; Kumar, R. FTIR and Rheological Studies of PMMA-Based Nano-Dispersed Gel Polymer Electrolytes Incorporated with LiBF4 and SiO2. Ionics 2019, 25, 1495–1503. [Google Scholar] [CrossRef]
- Harshlata; Mishra, K.; Rai, D.K. Studies on Ionic Liquid Based Nanocomposite Gel Polymer Electrolyte and Its Application in Sodium Battery. Mater. Sci. Eng. B 2021, 267, 115098. [Google Scholar] [CrossRef]
- He, Z.; Alexandridis, P. Nanoparticles in Ionic Liquids: Interactions and Organization. Phys. Chem. Chem. Phys. 2015, 17, 18238–18261. [Google Scholar] [CrossRef]
- Nordström, J.; Aguilera, L.; Matic, A. Effect of Lithium Salt on the Stability of Dispersions of Fumed Silica in the Ionic Liquid BMImBF4. Langmuir 2012, 28, 4080–4085. [Google Scholar] [CrossRef] [PubMed]
- Gunday, S.T.; Cevik, E.; Yusuf, A.; Bozkurt, A. Fabrication of Al2 O3 /IL-Based Nanocomposite Polymer Electrolytes for Supercapacitor Application. ChemistrySelect 2019, 4, 5880–5887. [Google Scholar] [CrossRef]
- Gunday, S.T.; Cevik, E.; Yusuf, A.; Bozkurt, A. Synthesis, Characterization and Supercapacitor Application of Ionic Liquid Incorporated Nanocomposites Based on SPSU/Silicon Dioxide. J. Phys. Chem. Solids 2020, 137, 109209. [Google Scholar] [CrossRef]
- Yu, L.; Chen, G.Z. Ionic Liquid-Based Electrolytes for Supercapacitor and Supercapattery. Front. Chem. 2019, 7, 272. [Google Scholar] [CrossRef]
- Cheng, Y.; Zhang, L.; Xu, S.; Zhang, H.; Ren, B.; Li, T.; Zhang, S. Ionic Liquid Functionalized Electrospun Gel Polymer Electrolyte for Use in a High-Performance Lithium Metal Battery. J. Mater. Chem. A 2018, 6, 18479–18487. [Google Scholar] [CrossRef]
- Chen, X.; Put, B.; Sagara, A.; Gandrud, K.; Murata, M.; Steele, J.A.; Yabe, H.; Hantschel, T.; Roeffaers, M.; Tomiyama, M.; et al. Silica Gel Solid Nanocomposite Electrolytes with Interfacial Conductivity Promotion Exceeding the Bulk Li-Ion Conductivity of the Ionic Liquid Electrolyte Filler. Sci. Adv. 2020, 6, eaav3400. [Google Scholar] [CrossRef]
- Chen, N.; Zhang, H.; Li, L.; Chen, R.; Guo, S. Ionogel Electrolytes for High-Performance Lithium Batteries: A Review. Adv. Energy Mater. 2018, 8, 1702675. [Google Scholar] [CrossRef]
- Bose, P.; Deb, D.; Bhattacharya, S. Lithium-Polymer Battery with Ionic Liquid Tethered Nanoparticles Incorporated P(VDF—HFP) Nanocomposite Gel Polymer Electrolyte. Electrochim. Acta 2019, 319, 753–765. [Google Scholar] [CrossRef]
- Tripathi, A.K. Ionic Liquid-Based Solid Electrolytes (Ionogels) for Application in Rechargeable Lithium Battery. Mater. Today Energy 2021, 20, 100643. [Google Scholar] [CrossRef]
- Fuller, J.; Carlin, R.T.; Osteryoung, R.A. The Room Temperature Ionic Liquid 1-Ethyl-3-methylimidazolium Tetrafluoroborate: Electrochemical Couples and Physical Properties. J. Electrochem. Soc. 1997, 144, 3881–3886. [Google Scholar] [CrossRef]
- Wu, F.; Zhu, N.; Bai, Y.; Liu, L.; Zhou, H.; Wu, C. Highly Safe Ionic Liquid Electrolytes for Sodium-Ion Battery: Wide Electrochemical Window and Good Thermal Stability. ACS Appl. Mater. Interfaces 2016, 8, 21381–21386. [Google Scholar] [CrossRef] [PubMed]
- Yarmolenko, O.V.; Khatmullina, K.G.; Baymuratova, G.R.; Tulibaeva, G.Z.; Bogdanova, L.M.; Shestakov, A.F. Causes of the Double Maximum Conductivity of Nanocomposite Polymer Electrolytes for Lithium Power Sources. Mendeleev Commun. 2018, 28, 41–43. [Google Scholar] [CrossRef]
- Kumar, D.; Hashmi, S.A. Ion Transport and Ion–Filler—Polymer Interaction in Poly(Methyl Methacrylate)-Based, Sodium Ion Conducting, Gel Polymer Electrolytes Dispersed with Silica Nanoparticles. J. Power Sources 2010, 195, 5101–5108. [Google Scholar] [CrossRef]
- Kumar, D.; Suleman, M.; Hashmi, S.A. Studies on Poly(Vinylidene Fluoride-Co-Hexafluoropropylene) Based Gel Electrolyte Nanocomposite for Sodium–Sulfur Batteries. Solid State Ion. 2011, 202, 45–53. [Google Scholar] [CrossRef]
- Lee, Y.-S.; Shin, W.-K.; Kim, J.S.; Kim, D.-W. High Performance Composite Polymer Electrolytes for Lithium—Ion Polymer Cells Composed of a Graphite Negative Electrode and LiFePO4 Positive Electrode. RSC Adv. 2015, 5, 18359–18366. [Google Scholar] [CrossRef]
- Chernyak, A.V.; Yudina, A.V.; Yarmolenko, O.V.; Volkov, V.I. NMR Study of the Polyethylene Glycol Diacrylate-LiBF4-1-Butyl-3-Methylimidazolium Tetrafluoroborate-Propylene/Ethylene Carbonate Electrolyte System. Russ. J. Electrochem. 2015, 51, 478–482. [Google Scholar] [CrossRef]
- Suh, K.-J.; Hong, Y.-S.; Skirda, V.D.; Volkov, V.I.; Lee, C.-Y.J.; Lee, C.-H. Water Self-Diffusion Behavior in Yeast Cells Studied by Pulsed Field Gradient NMR. Biophys. Chem. 2003, 104, 121–130. [Google Scholar] [CrossRef] [PubMed]
- Hayamizu, K.; Aihara, Y. Ion and Solvent Diffusion and Ion Conduction of PC-DEC and PC-DME Binary Solvent Electrolytes of LiN(SO2CF3)2. Electrochim. Acta 2004, 49, 3397–3402. [Google Scholar] [CrossRef]
- Slesarenko, A.; Yakuschenko, I.K.; Ramezankhani, V.; Sivasankaran, V.; Romanyuk, O.; Mumyatov, A.V.; Zhidkov, I.; Tsarev, S.; Kurmaev, E.Z.; Shestakov, A.F.; et al. New Tetraazapentacene—Based Redox—Active Material as a Promising High—Capacity Organic Cathode for Lithium and Potassium Batteries. J. Pow. Sources 2019, 435, 226724. [Google Scholar] [CrossRef]
- Perdew, J.P.; Burke, K.; Ernzerhof, M. Generalized Gradient Approximation Made Simple. Phys. Rev. Lett. 1996, 77, 3865–3868. [Google Scholar] [CrossRef]
- Stevens, W.J.; Basch, H.; Krauss, M. Compact Effective Potentials and Efficient Shared-exponent Basis Sets for the First- and Second-row Atoms. J. Chem. Phys. 1984, 81, 6026–6033. [Google Scholar] [CrossRef]
- Laikov, D.N. A New Parametrizable Model of Molecular Electronic Structure. J. Chem. Phys. 2011, 135, 134120. [Google Scholar] [CrossRef]
- Laikov, D.N. Fast Evaluation of Density Functional Exchange-Correlation Terms Using the Expansion of the Electron Density in Auxiliary Basis Sets. Chem. Phys. Lett. 1997, 281, 151–156. [Google Scholar] [CrossRef]
- Yudina, A.V.; Baymuratova, G.R.; Tulibaeva, G.Z.; Litvinov, A.L.; Shestakov, A.F.; Yarmolenko, O.V. Conductivity Increase Effect in Nanocomposite Polymer Gel Electrolytes: Manifestation in the IR Spectra. Russ. Chem. Bull. 2020, 69, 1455–1462. [Google Scholar] [CrossRef]
- Chernyak, A.V.; Slesarenko, N.A.; Slesarenko, A.A.; Baymuratova, G.R.; Tulibaeva, G.Z.; Yudina, A.V.; Volkov, V.I.; Shestakov, A.F.; Yarmolenko, O.V. Effect of the Solvate Environment of Lithium Cations on the Resistance of the Polymer Electrolyte/Electrode Interface in a Solid-State Lithium Battery. Membranes 2022, 12, 1111. [Google Scholar] [CrossRef]
- Kasprzak, D.; Galiński, M. Biopolymer-Based Gel Electrolytes with an Ionic Liquid for High-Voltage Electrochemical Capacitors. Electrochem. Commun. 2022, 138, 107282. [Google Scholar] [CrossRef]
- Kim, J.; Kim, Y.; Yoo, J.; Kwon, G.; Ko, Y.; Kang, K. Organic Batteries for a Greener Rechargeable World. Nat. Rev. Mater. 2022, 8, 54–70. [Google Scholar] [CrossRef]
- Zhu, W.; Huang, Y.; Jiang, B.; Xiao, R. A Metal-Free Ionic Liquid Dual-Ion Battery Based on the Reversible Interaction of 1-Butyl-1-Methylpyrrolidinium Cations with 1,4,5,8-Naphthalenetetracarboxylic Dianhydride. J. Mol. Liq. 2021, 339, 116789. [Google Scholar] [CrossRef]
- Huang, Y.; Xiao, R.; Ma, Z.; Zhu, W. Developing Dual-Graphite Batteries with Pure 1-Ethyl-3-methylimidazolium Trifluoromethanesulfonate Ionic Liquid as the Electrolyte. Chem. Electro. Chem. 2019, 6, 4681–4688. [Google Scholar] [CrossRef]
- Zeng, Y.; Wang, K.; Ke, X.; Tan, X.; Jiang, B.; Zhu, W.; Xiao, R. Study on Ionic Liquid-Based Gel Polymer Electrolytes for Dual-Graphite Battery Systems. Ionics 2023, 29, 1381–1393. [Google Scholar] [CrossRef]
- Chernyak, A.V.; Berezin, M.P.; Slesarenko, N.A.; Zabrodin, V.A.; Volkov, V.I.; Yudina, A.V.; Shuvalova, N.I.; Yarmolenko, O.V. Influence of the Reticular Polymeric Gel—Electrolyte Structure on Ionic and Molecular Mobility of an Electrolyte System Salt—Ionic Liquid: LiBF4—1-Ethyl-3-Methylimidazolium Tetrafluoroborate. Russ. Chem. Bull. 2016, 65, 2053–2058. [Google Scholar] [CrossRef]
- Yudina, A.V.; Berezin, M.P.; Baymuratova, G.R.; Shuvalova, N.I.; Yarmolenko, O.V. Specific Features of the Synthesis and the Physicochemical Properties of Nanocomposite Polymer Electrolytes Based on Poly(Ethylene Glycol) Diacrylate with the Introduction of SiO2. Russ. Chem. Bull. 2017, 66, 1278–1283. [Google Scholar] [CrossRef]


| No. | PEGDA, mol | LiBF4, mol | EMIBF4, mol | EC, mol | SiO2, wt.% | PB, wt.% |
|---|---|---|---|---|---|---|
| NPE0 | 1 | 1 | 6 | 3 | 0 | 1 |
| NPE1 | 1 | 1 | 0 | 3 | 2 | 1 |
| NPE2 | 1 | 1 | 2 | 3 | 2 | 1 |
| NPE3 | 1 | 1 | 4 | 3 | 2 | 1 |
| NPE4 | 1 | 1 | 6 | 3 | 2 | 1 |
| NPE5 | 1 | 1 | 6 | 3 | 6 | 1 |
| Sample | T01, °C | Tg1, °C | ∆T1, °C | Tg2, °C | ∆T2, °C |
|---|---|---|---|---|---|
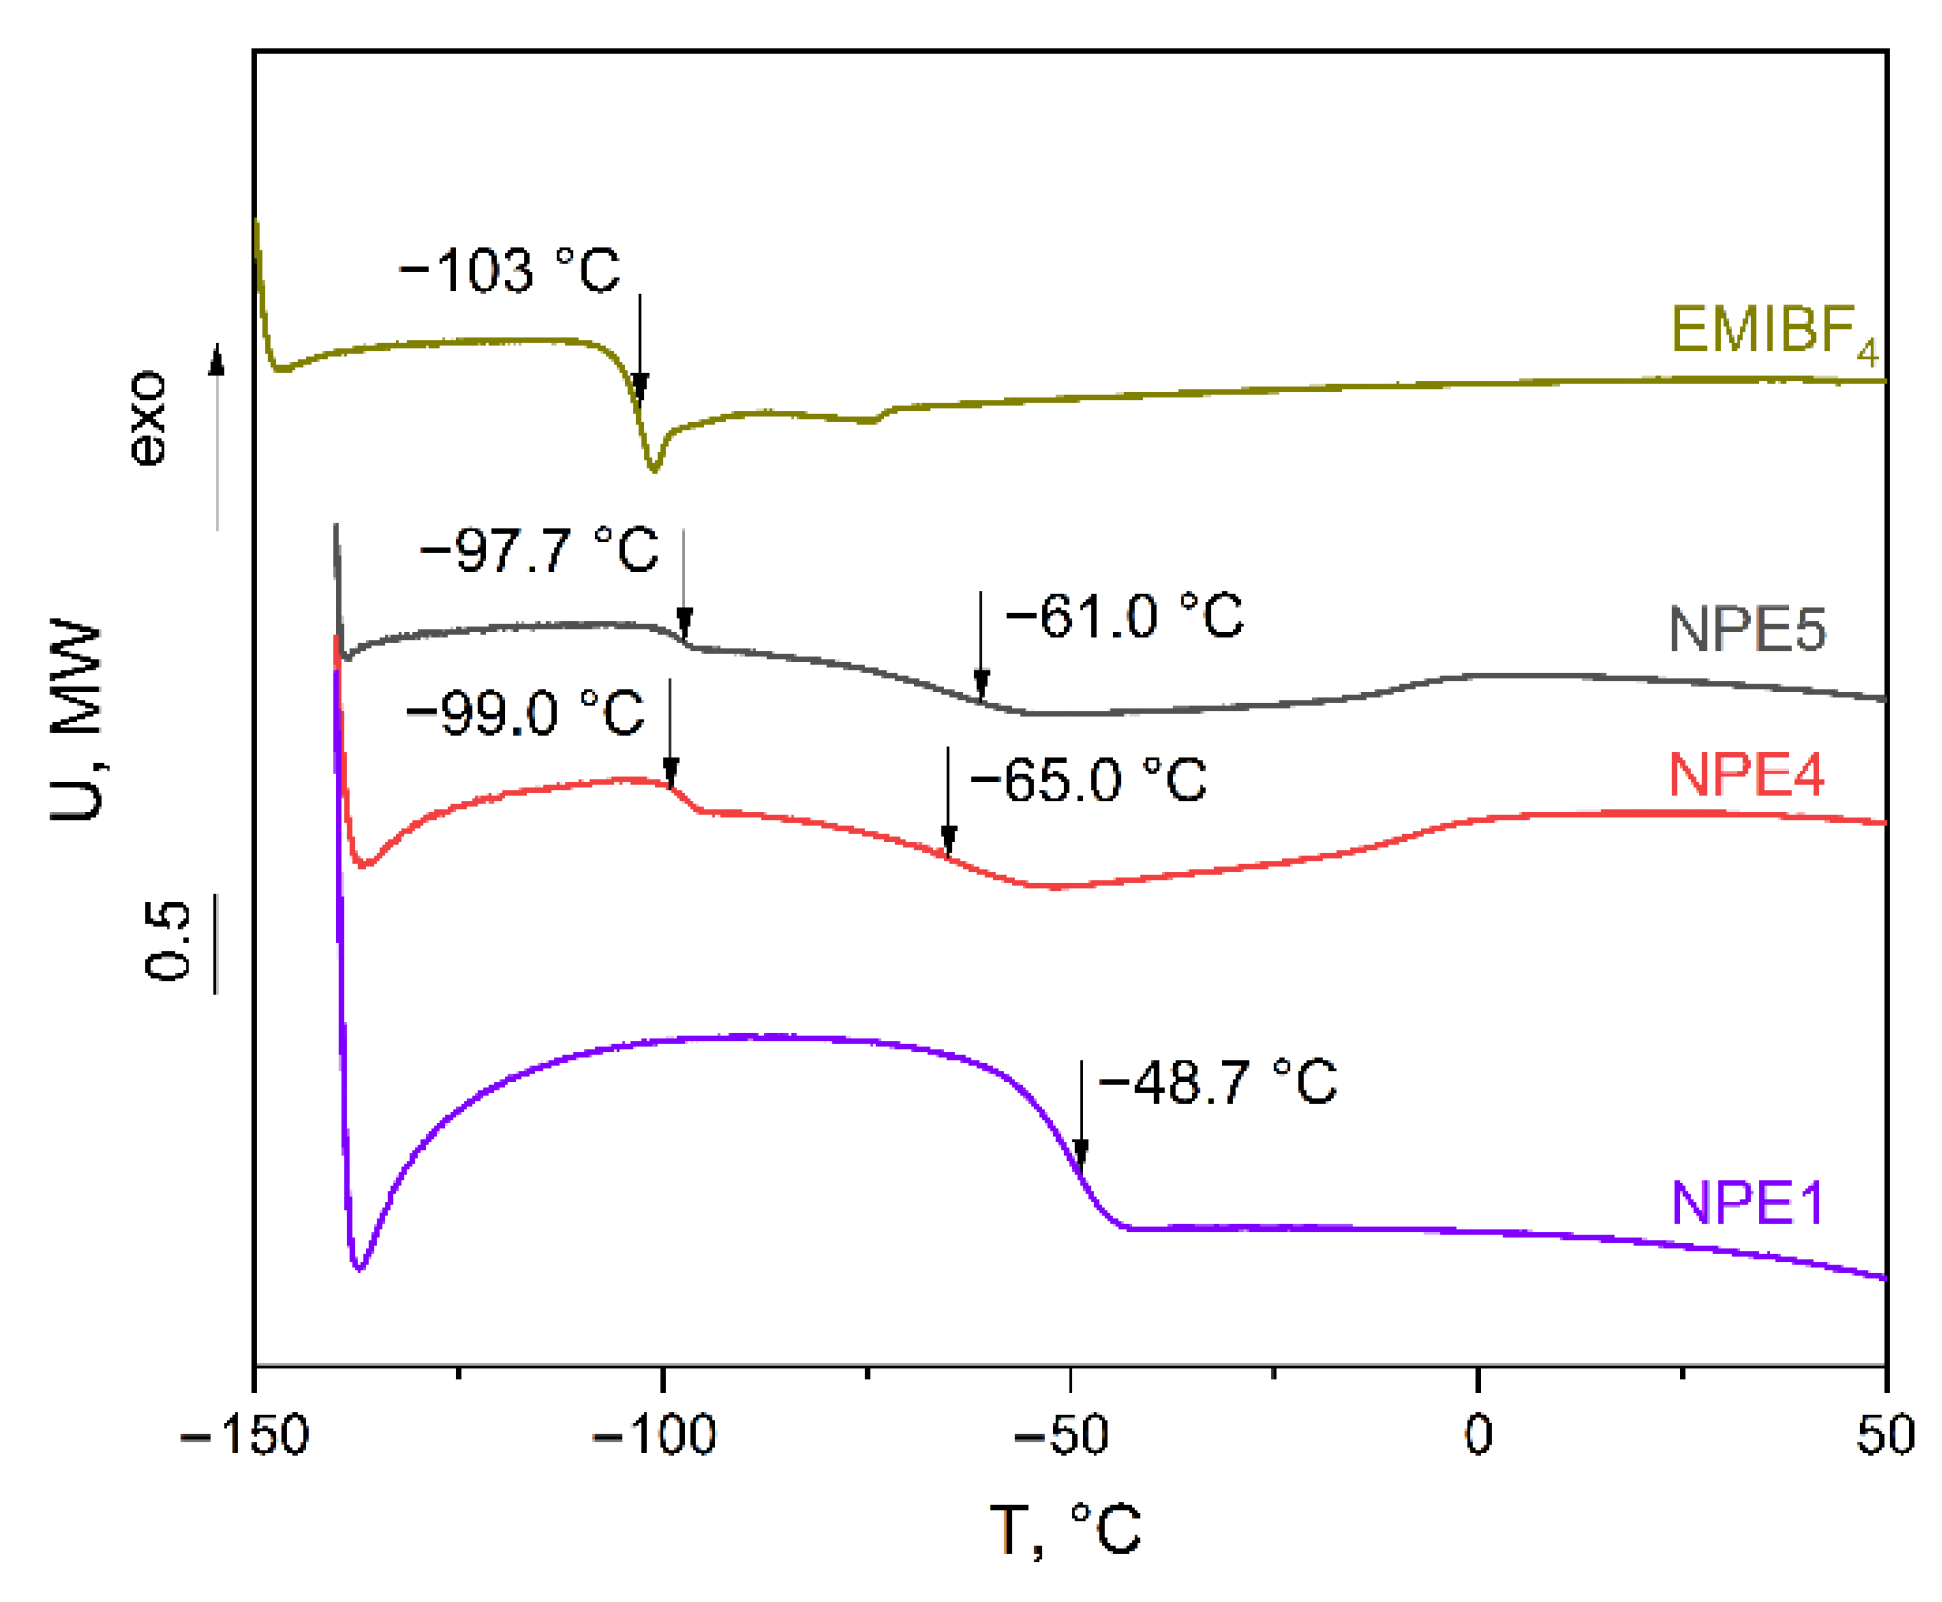
| EMIBF4 | − | − | − | −103.0 | 3.0 |
| NPE0 | −78.0 | −61.5 | 32.9 | −102.3 | 4.3 |
| NPE1 | −54.5 | −48.7 | 9.57 | − | − |
| NPE2 | −64.5 | −56.2 | 12.5 | −98.2 | 4.2 |
| NPE3 | −68.9 | −57.9 | 18.5 | −98.3 | 4.0 |
| NPE4 | −72.9 | −65.0 | 17.9 | −99.0 | 3.9 |
| NPE5 | −74.5 | −61.0 | 16.2 | −97.7 | 3.2 |
| Ds, m2 s−1 | Ea, kJ mol−1 | |||
|---|---|---|---|---|
| EC | EMIBF4 | EC | EMIBF4 | |
| NPE1 | 3.99 × 10⁻¹² | — | 42.5 | — |
| NPE2 | 8.52 × 10⁻¹² | 4.33 × 10⁻¹² | 36.1 | 37.2 |
| NPE3 | 1.70 × 10⁻¹¹ | 9.99 × 10⁻¹² | 30.0 | 29.9 |
| NPE4 | 2.62 × 10⁻¹¹ | 1.62 × 10⁻¹¹ | 31.6 | 30.8 |
| NPE5 | 2.70 × 10⁻¹¹ | 1.70 × 10⁻¹¹ | 29.2 | 28.3 |
| EMIBF4 | — | 5.15 × 10⁻¹¹ | — | 20.9 |
| Ds, m2 s−1 | Ea, kJ mol−1 | |||
|---|---|---|---|---|
| 7Li | 19F (LiBF4 + EMIBF4) | 7Li | 19F (LiBF4 + EMIBF4) | |
| NPE1 | 1.15 × 10⁻¹³ | 1.42 × 10⁻¹² | 51.6 | 37.5 |
| NPE2 | 3.19 × 10⁻¹³ | 3.41 × 10⁻¹² | 44.5 | 33.2 |
| NPE3 | 7.26 × 10⁻¹³ | 6.85 × 10⁻¹² | 42.6 | 29.1 |
| NPE4 | 1.47 × 10⁻¹² | 1.24 × 10⁻¹¹ | 37.1 | 27.1 |
| NPE5 | 1.90 × 10⁻¹² | 1.30 × 10⁻¹¹ | 35.8 | 27.6 |
| EMIBF4 | — | 3.90 × 10⁻¹¹ | — | 27.0 |
| No. | σ, mS cm–1 (25 °C) | Ea, kJ mol−1 | |
|---|---|---|---|
| −40 ÷ 15 °C | 25 ÷ 100 °C | ||
| NPE1 | 0.03 | 37.8 ± 2.4 | 31.1 ± 1.6 |
| NPE2 | 0.8 | 38.0 ± 0.3 | 24.5 ± 2.0 |
| NPE3 | 1.8 | 33.2 ± 1.6 | 18.6 ± 0.3 |
| NPE4 | 5.0 | 24.1 ± 1.1 | 14.0 ± 1.4 |
| NPE5 | 6.2 | 23.5 ± 0.9 | 13.7 ± 1.4 |
Disclaimer/Publisher’s Note: The statements, opinions and data contained in all publications are solely those of the individual author(s) and contributor(s) and not of MDPI and/or the editor(s). MDPI and/or the editor(s) disclaim responsibility for any injury to people or property resulting from any ideas, methods, instructions or products referred to in the content. |
© 2023 by the authors. Licensee MDPI, Basel, Switzerland. This article is an open access article distributed under the terms and conditions of the Creative Commons Attribution (CC BY) license (https://creativecommons.org/licenses/by/4.0/).
Share and Cite
Khatmullina, K.G.; Slesarenko, N.A.; Chernyak, A.V.; Baymuratova, G.R.; Yudina, A.V.; Berezin, M.P.; Tulibaeva, G.Z.; Slesarenko, A.A.; Shestakov, A.F.; Yarmolenko, O.V. New Network Polymer Electrolytes Based on Ionic Liquid and SiO2 Nanoparticles for Energy Storage Systems. Membranes 2023, 13, 548. https://doi.org/10.3390/membranes13060548
Khatmullina KG, Slesarenko NA, Chernyak AV, Baymuratova GR, Yudina AV, Berezin MP, Tulibaeva GZ, Slesarenko AA, Shestakov AF, Yarmolenko OV. New Network Polymer Electrolytes Based on Ionic Liquid and SiO2 Nanoparticles for Energy Storage Systems. Membranes. 2023; 13(6):548. https://doi.org/10.3390/membranes13060548
Chicago/Turabian StyleKhatmullina, Kyunsylu G., Nikita A. Slesarenko, Alexander V. Chernyak, Guzaliya R. Baymuratova, Alena V. Yudina, Mikhail P. Berezin, Galiya Z. Tulibaeva, Anna A. Slesarenko, Alexander F. Shestakov, and Olga V. Yarmolenko. 2023. "New Network Polymer Electrolytes Based on Ionic Liquid and SiO2 Nanoparticles for Energy Storage Systems" Membranes 13, no. 6: 548. https://doi.org/10.3390/membranes13060548