

Study on the Treatment of Refined Sugar Wastewater by Electrodialysis Coupled with Upflow Anaerobic Sludge Blanket and Membrane Bioreactor

Abstract
:1. Introduction
2. Experiment
2.1. Wastewater
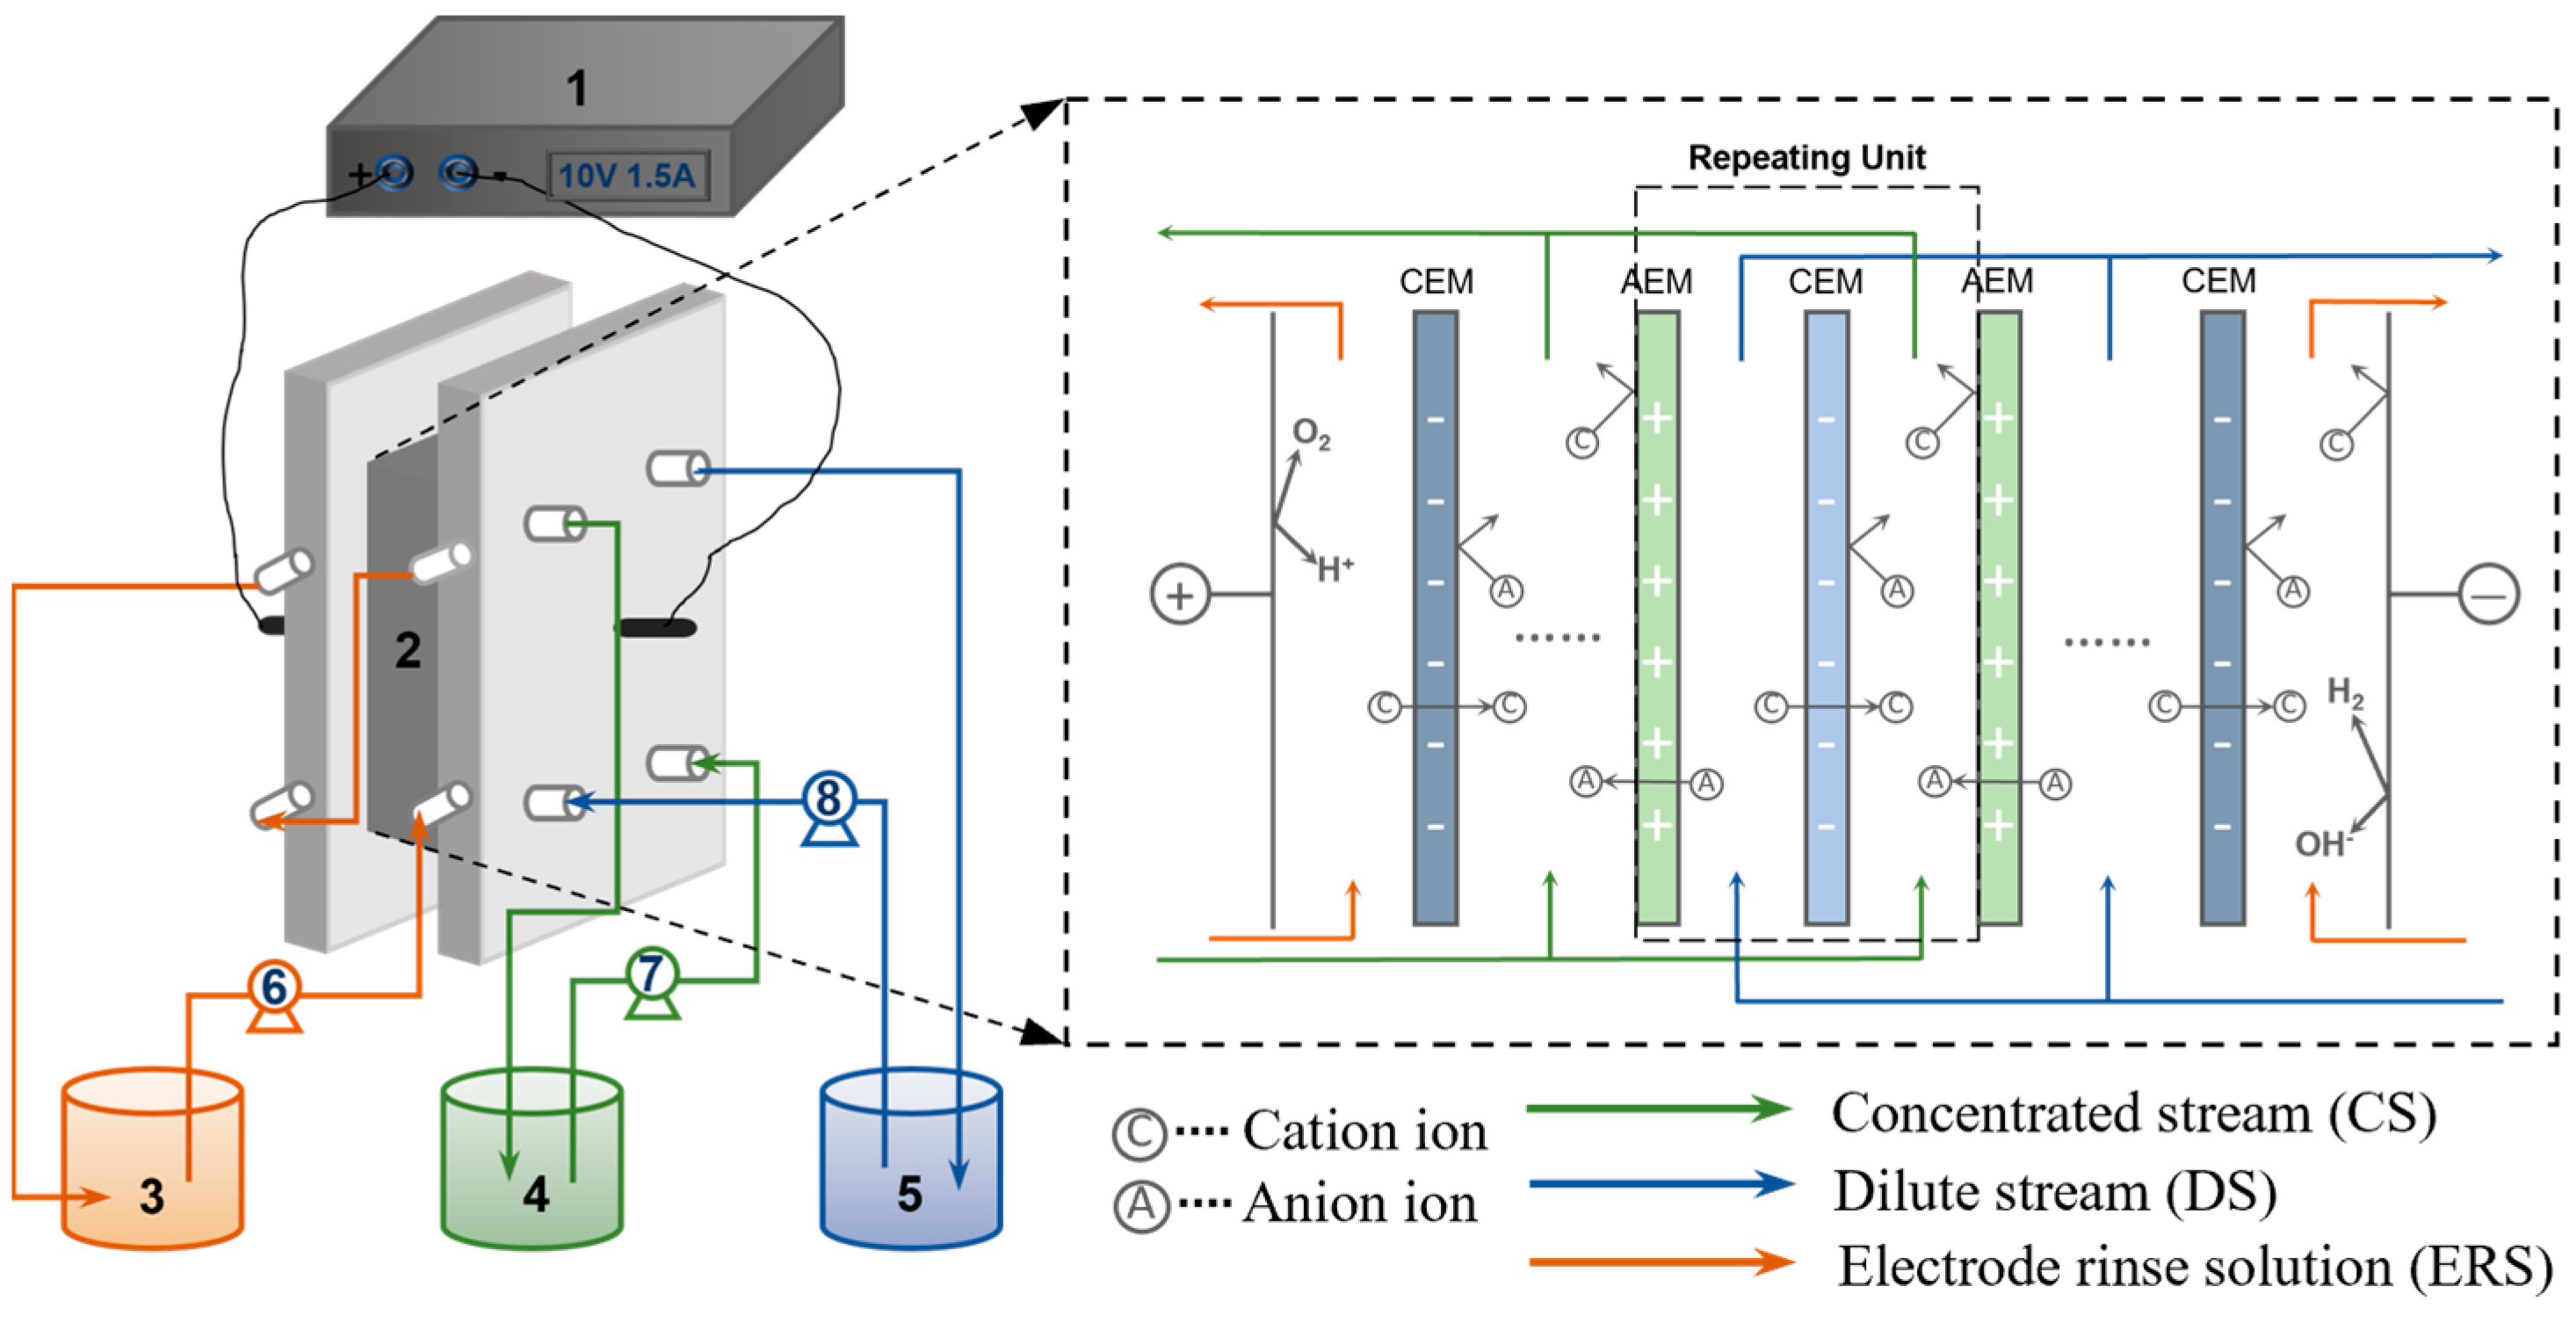
2.2. ED Setup
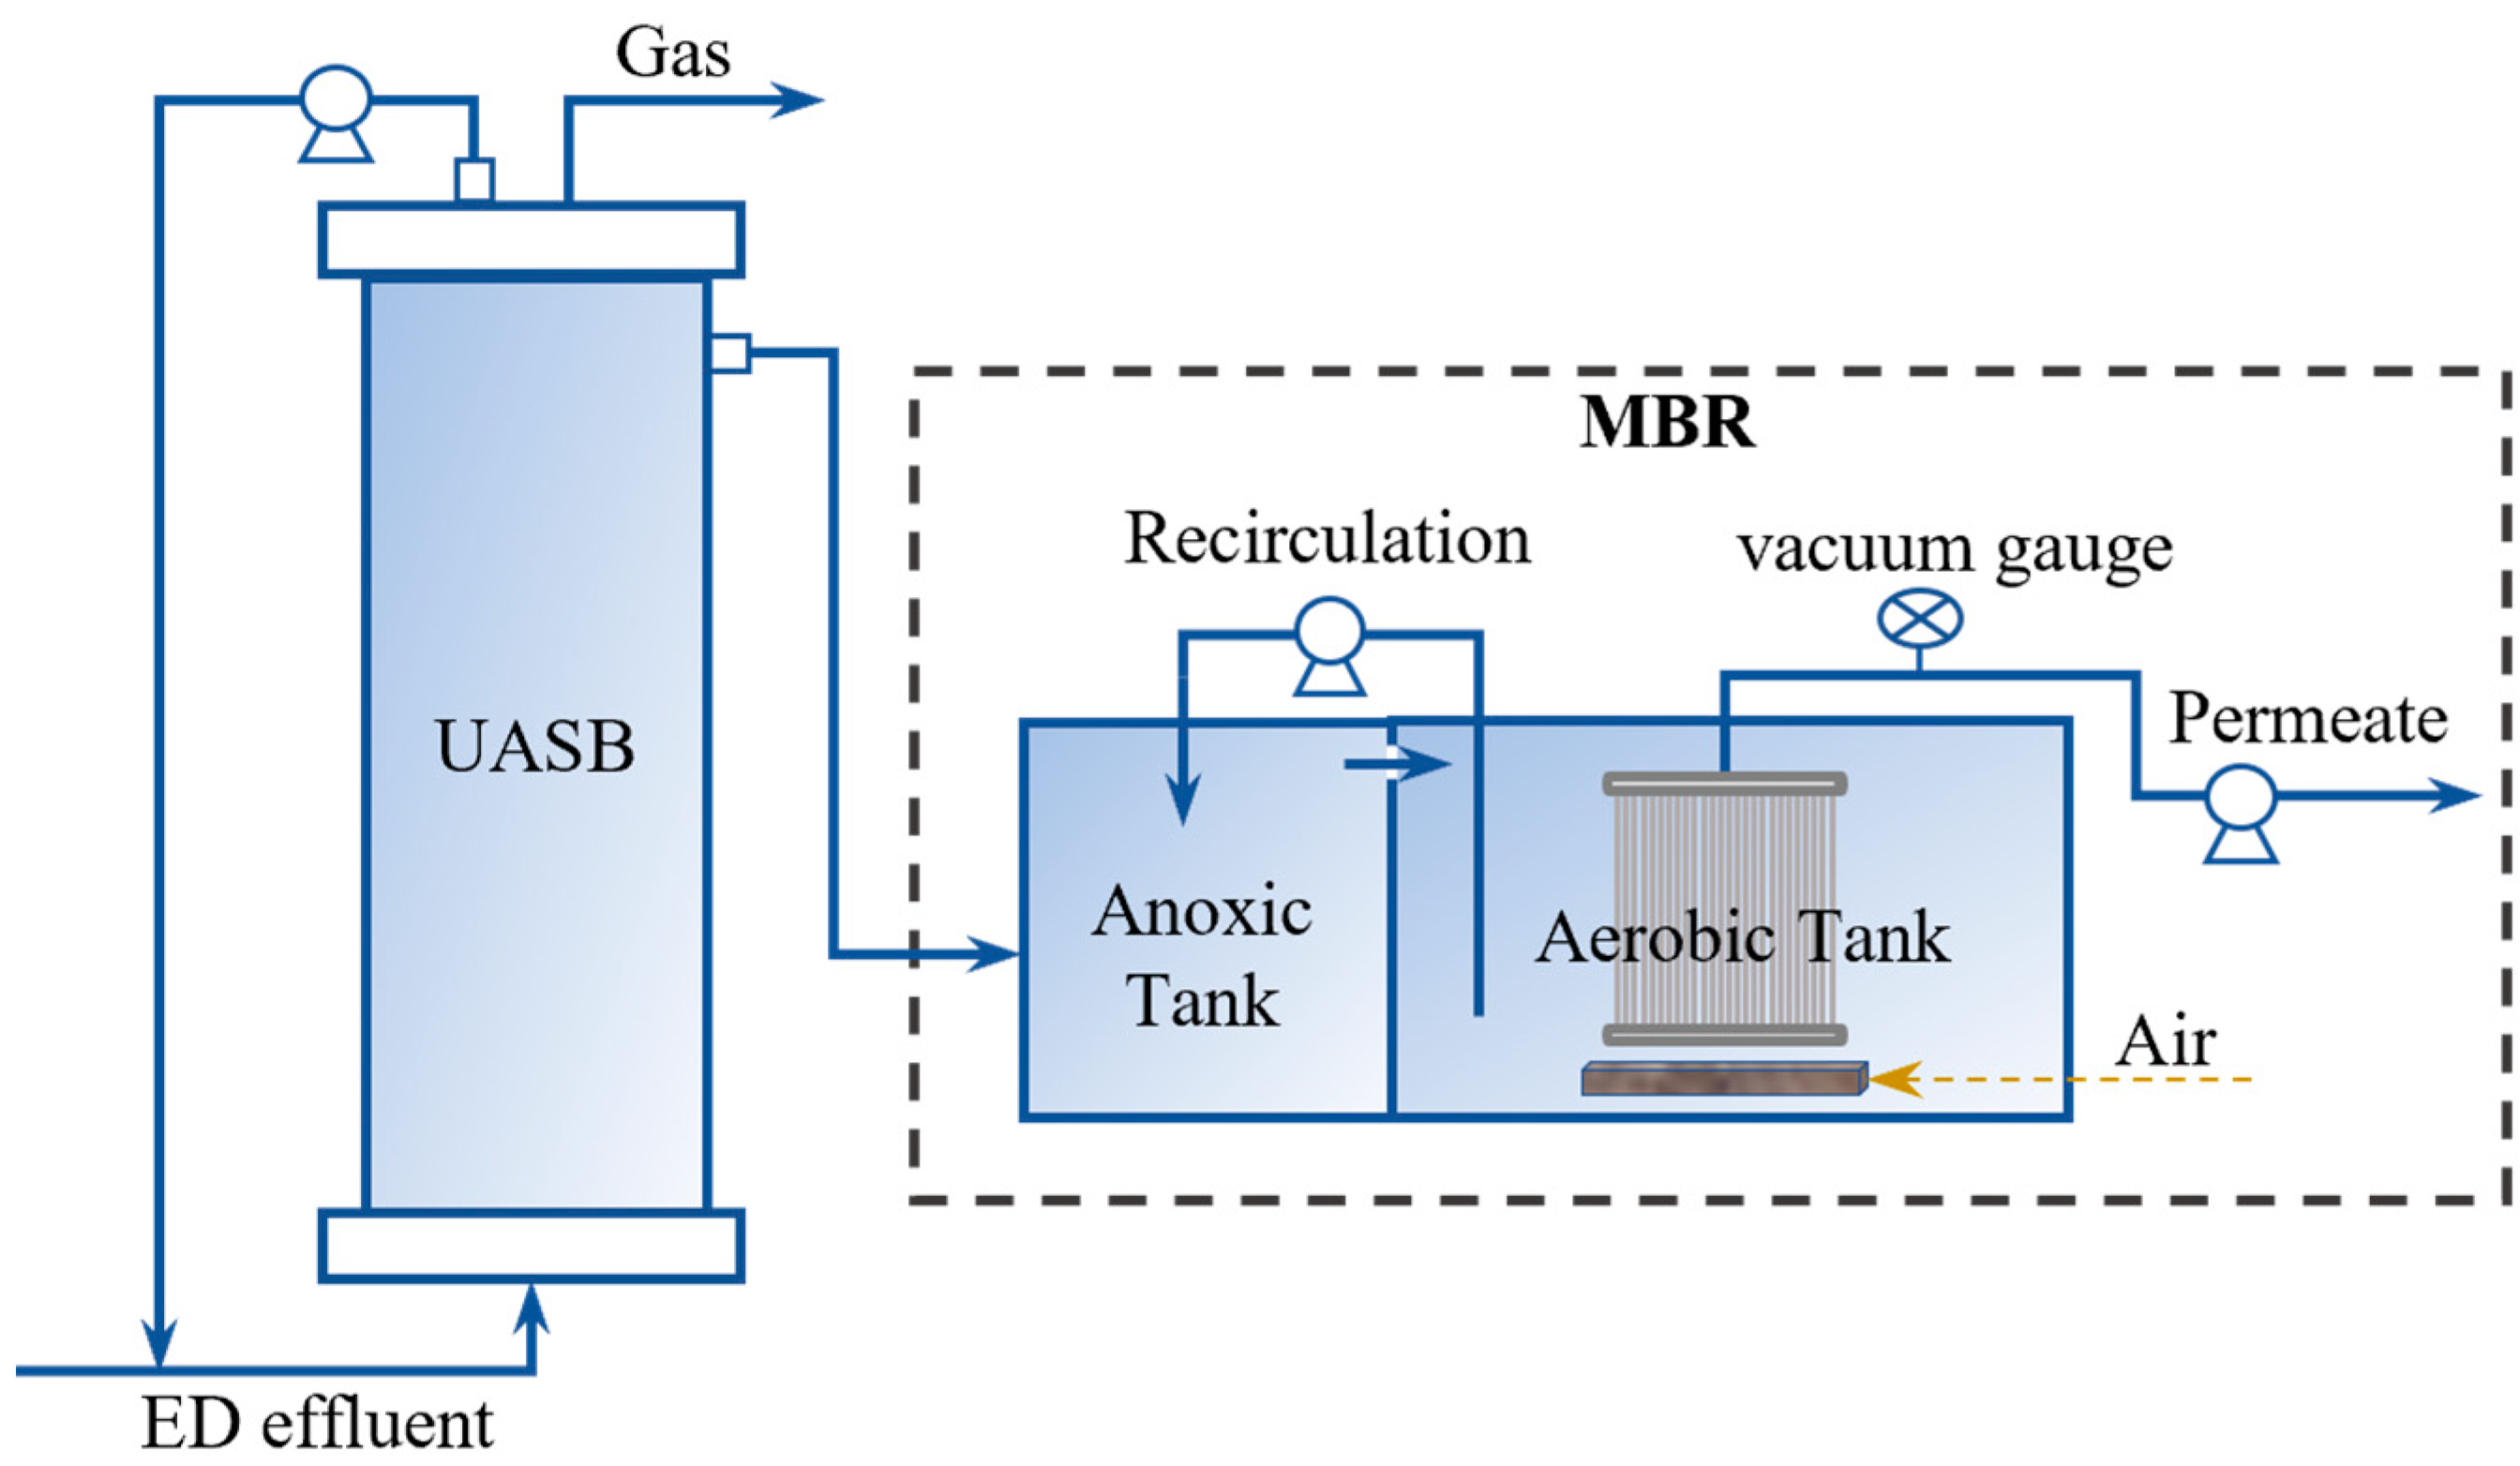
2.3. UASB and MBR System
2.4. Analytical Methods
2.5. Data Analysis
3. Results and Discussion
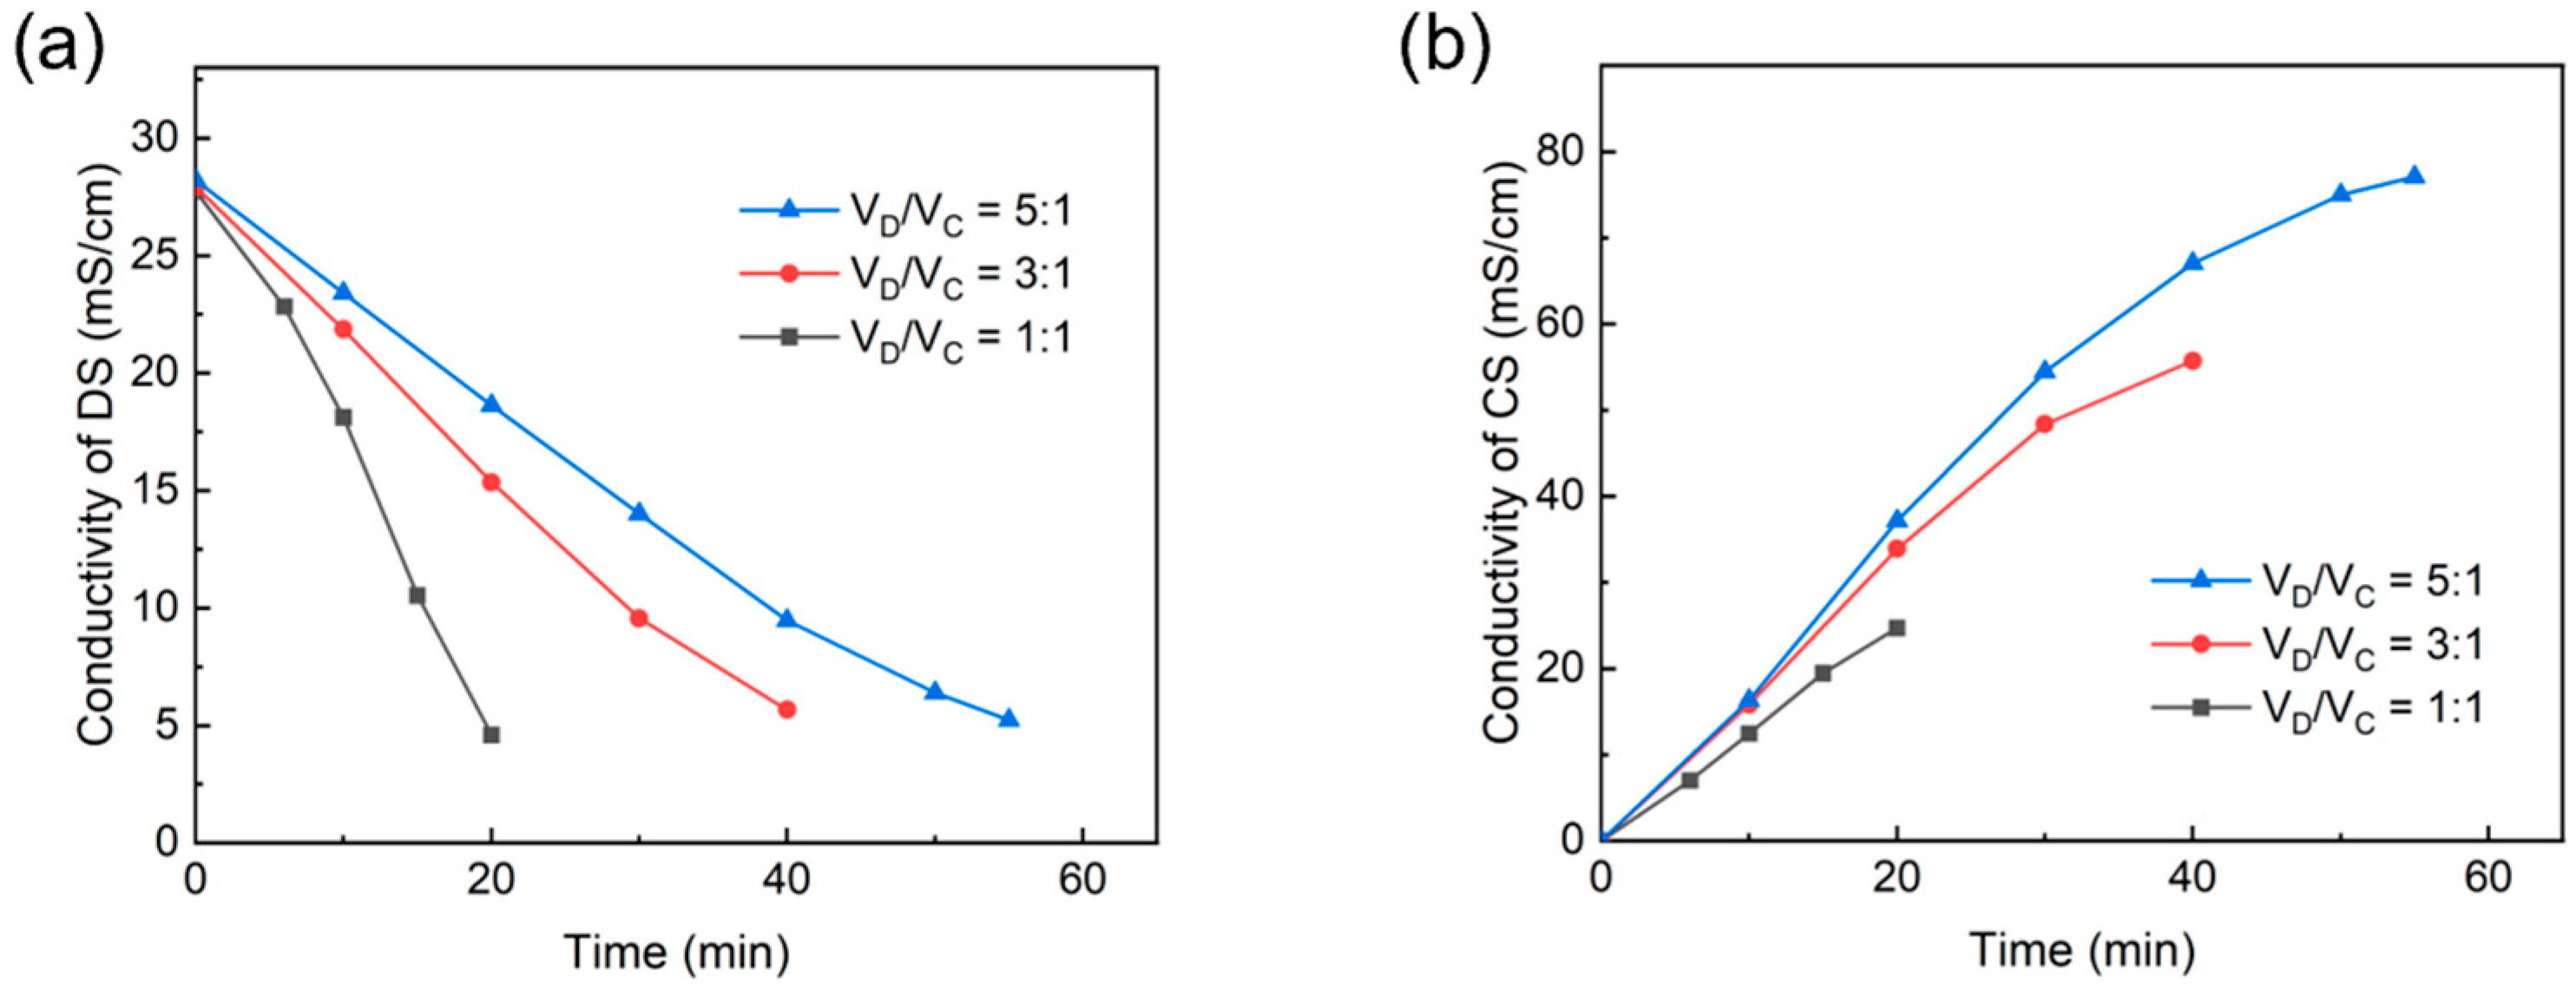
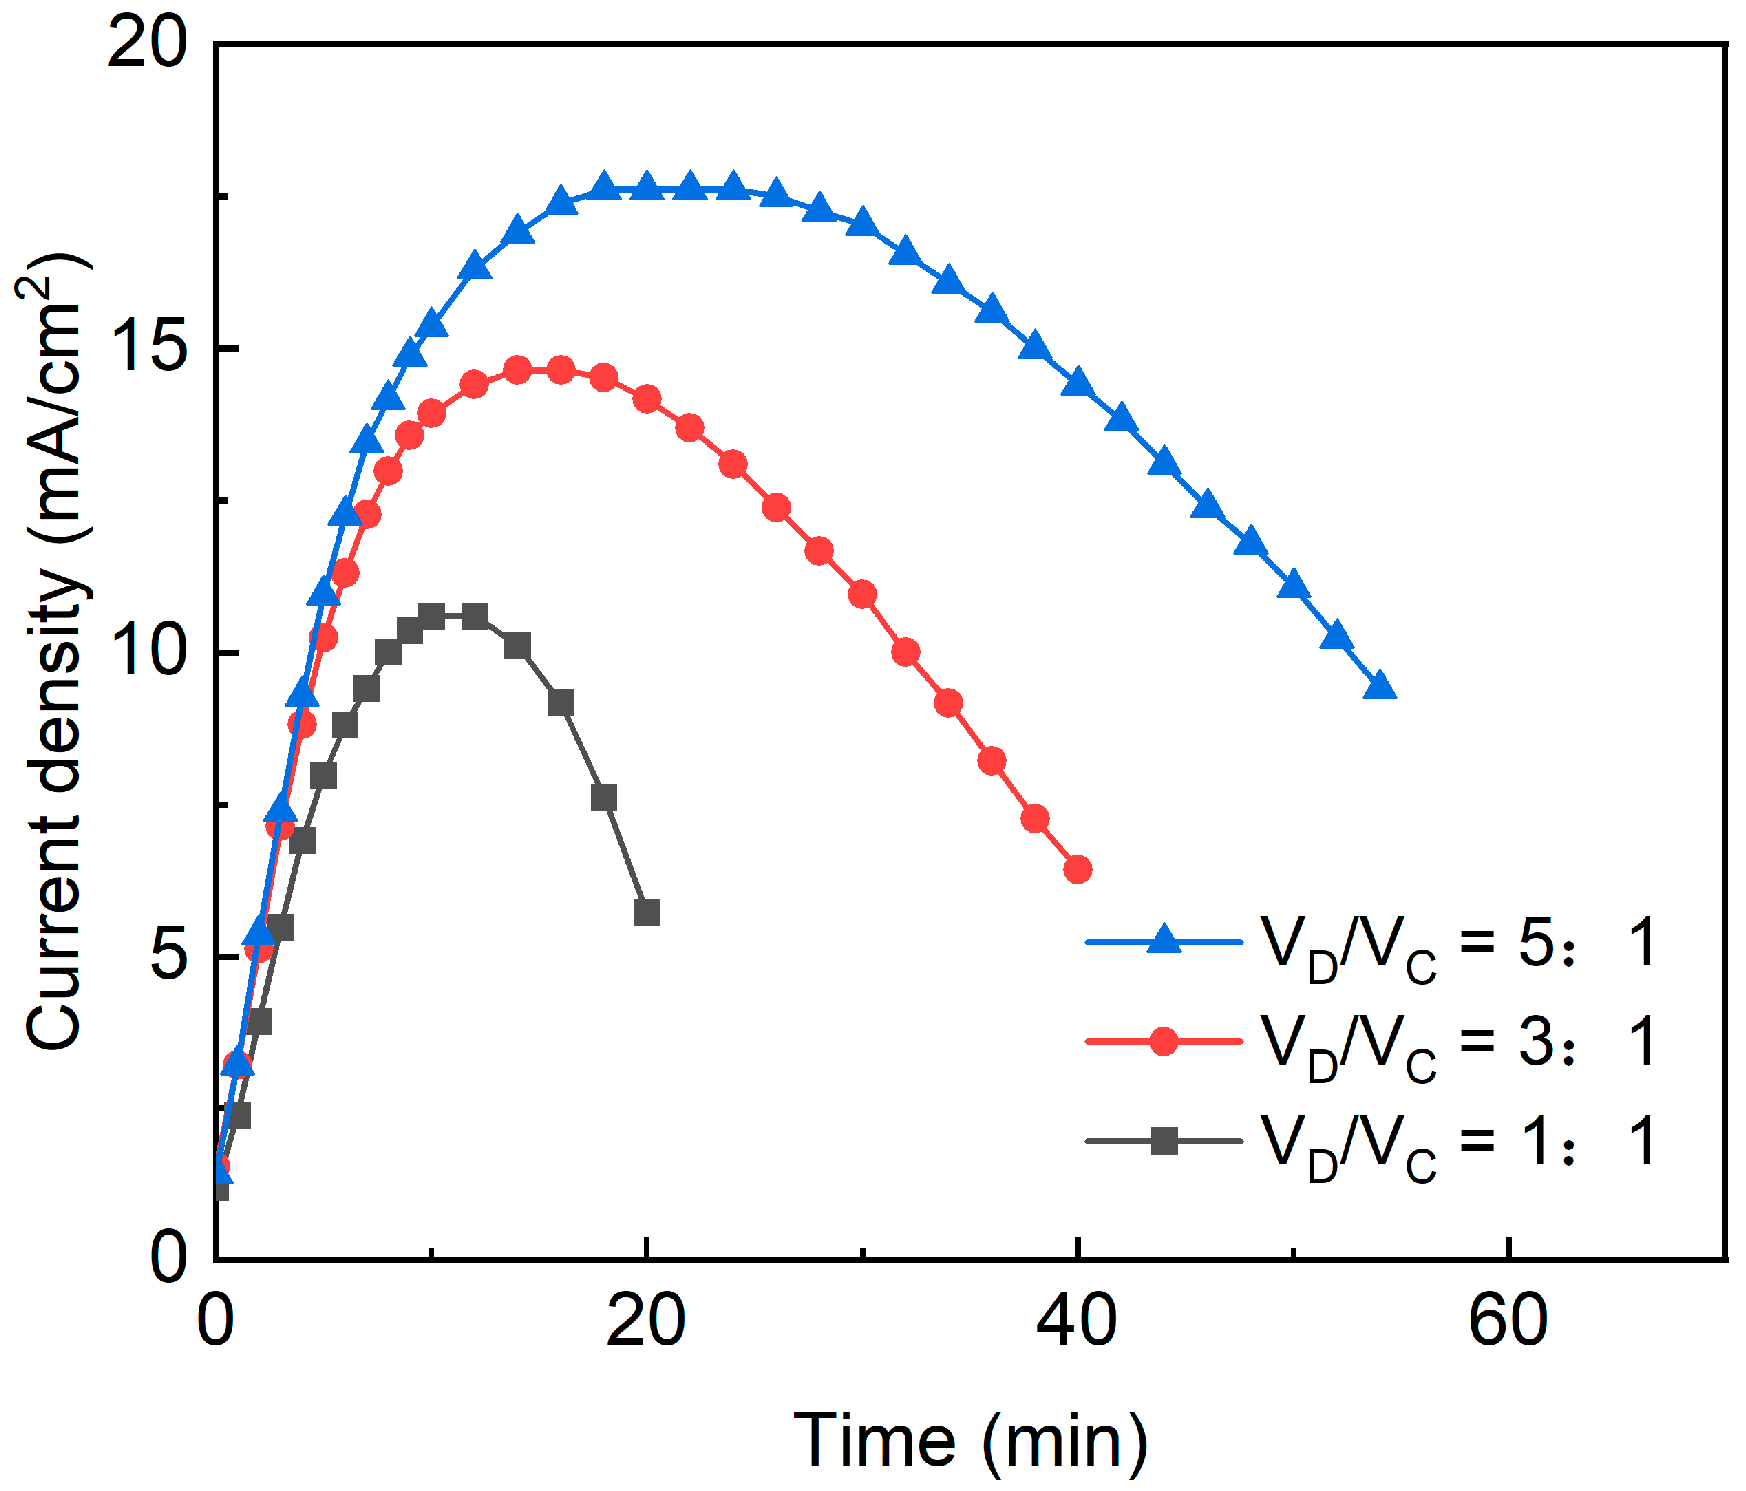
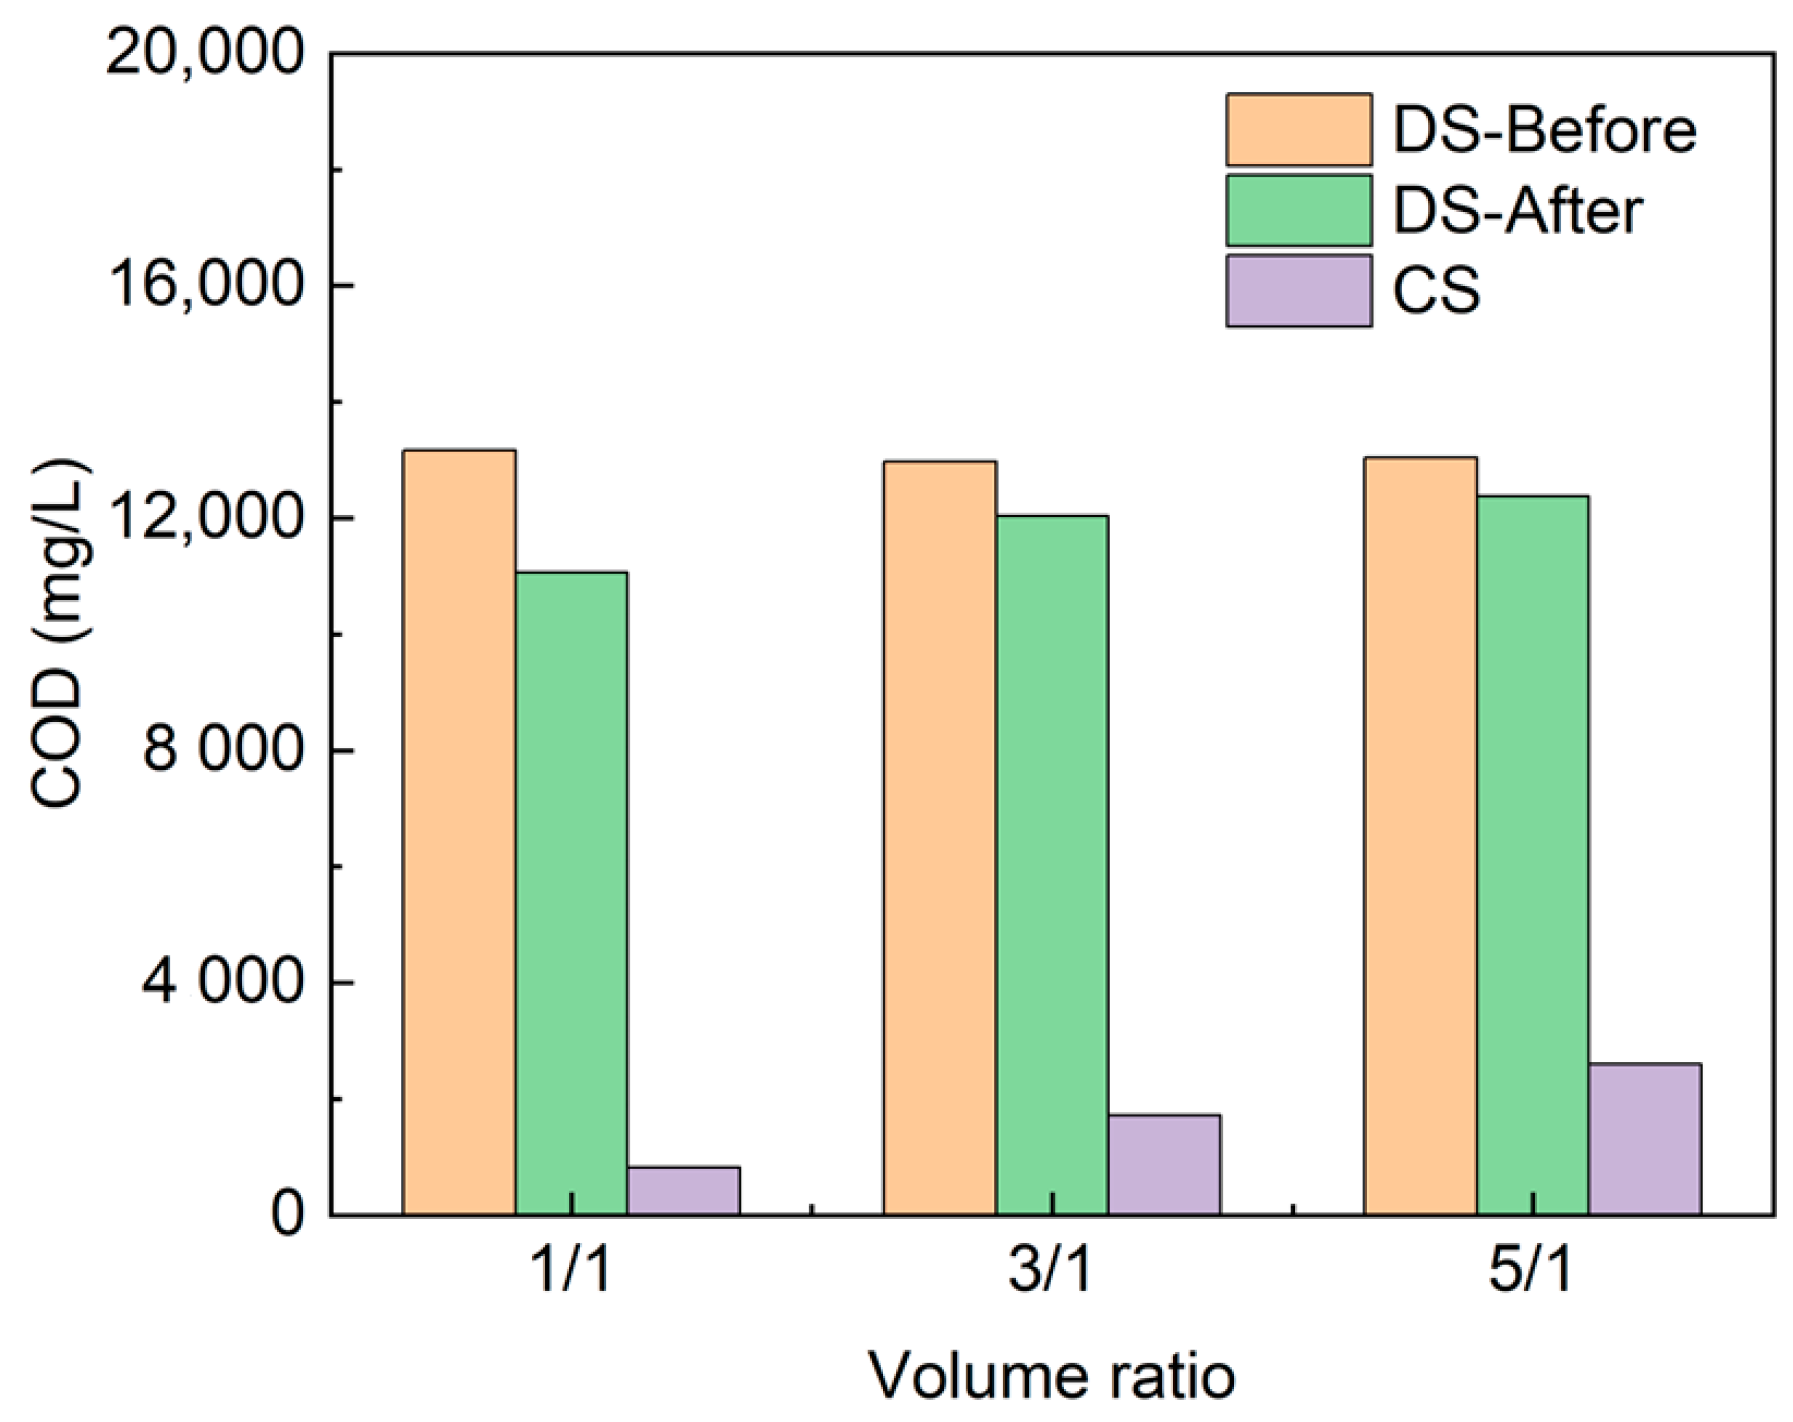
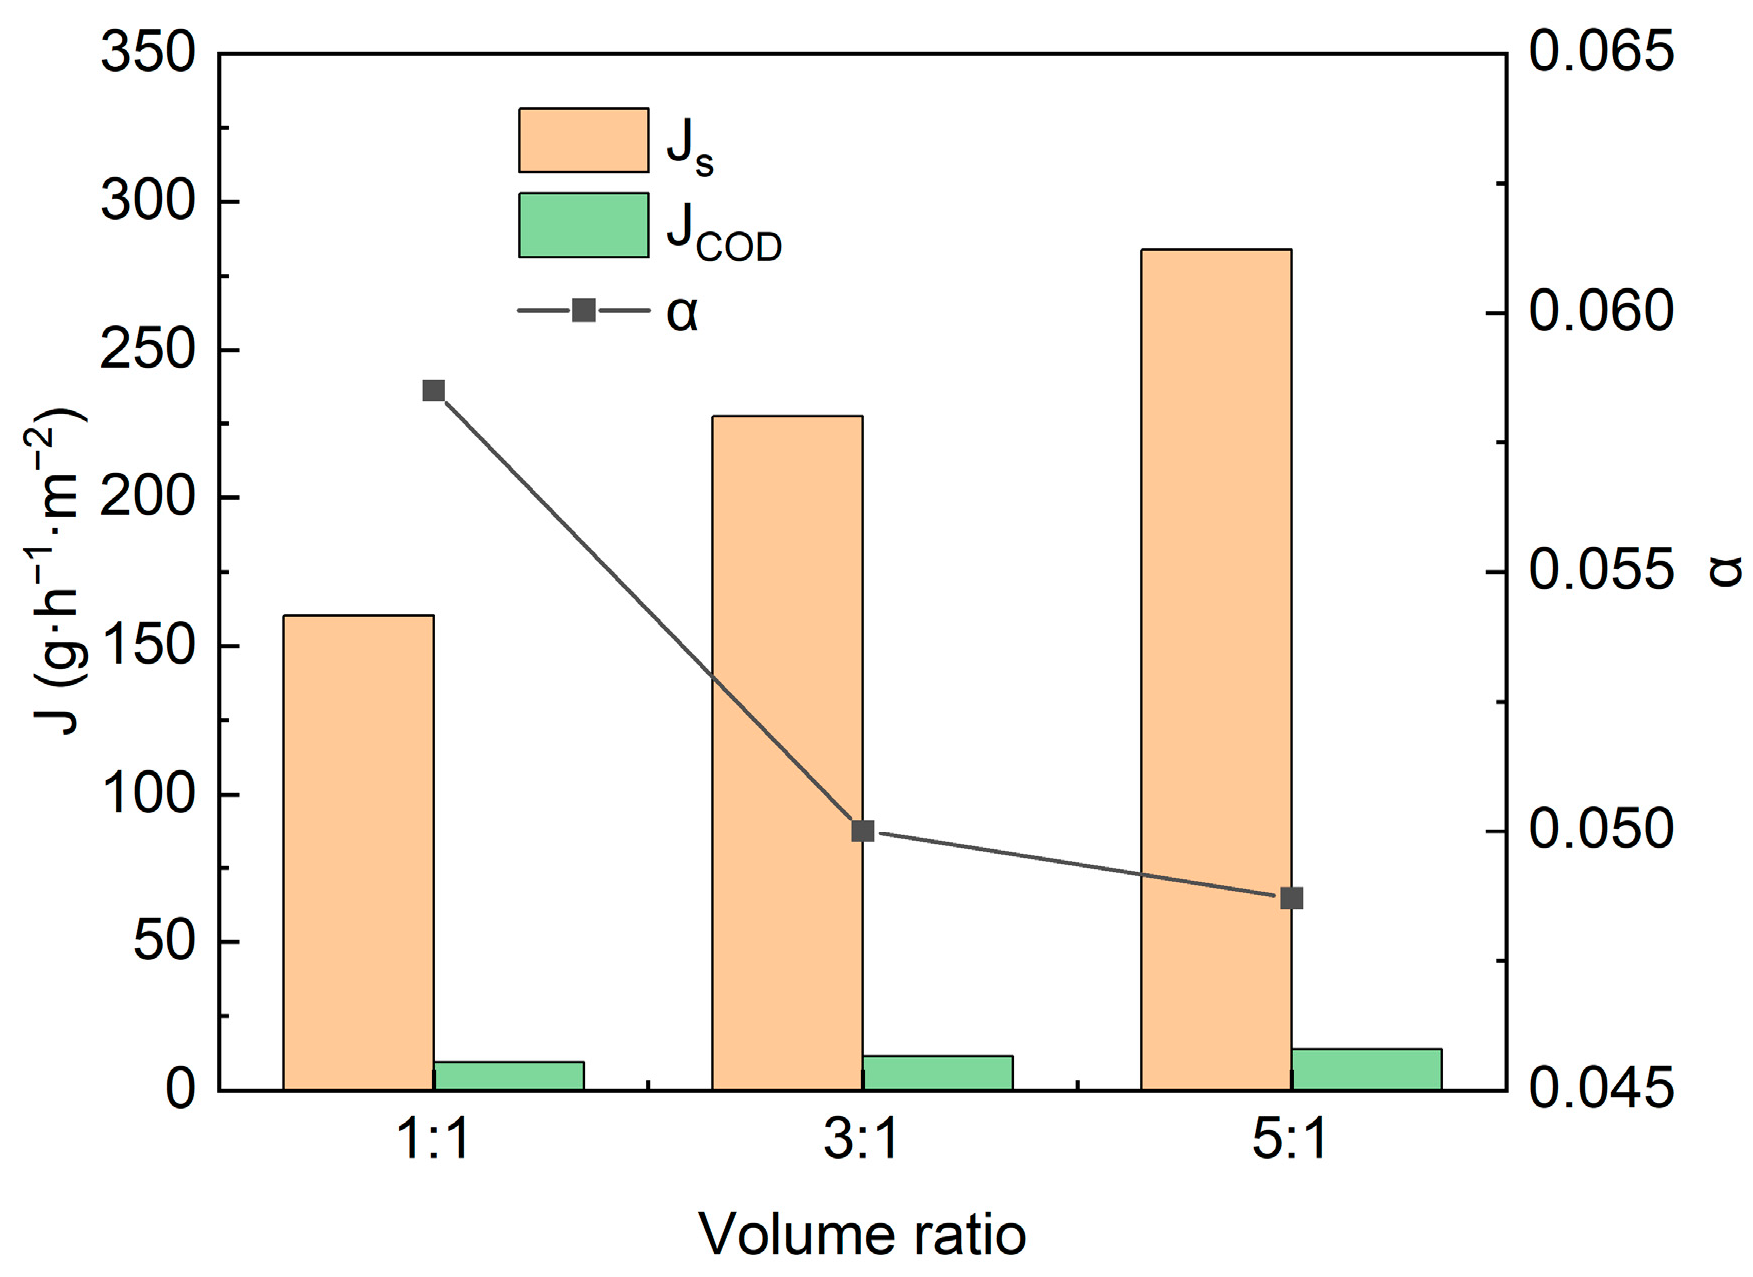
3.1. Batch Experiments of ED
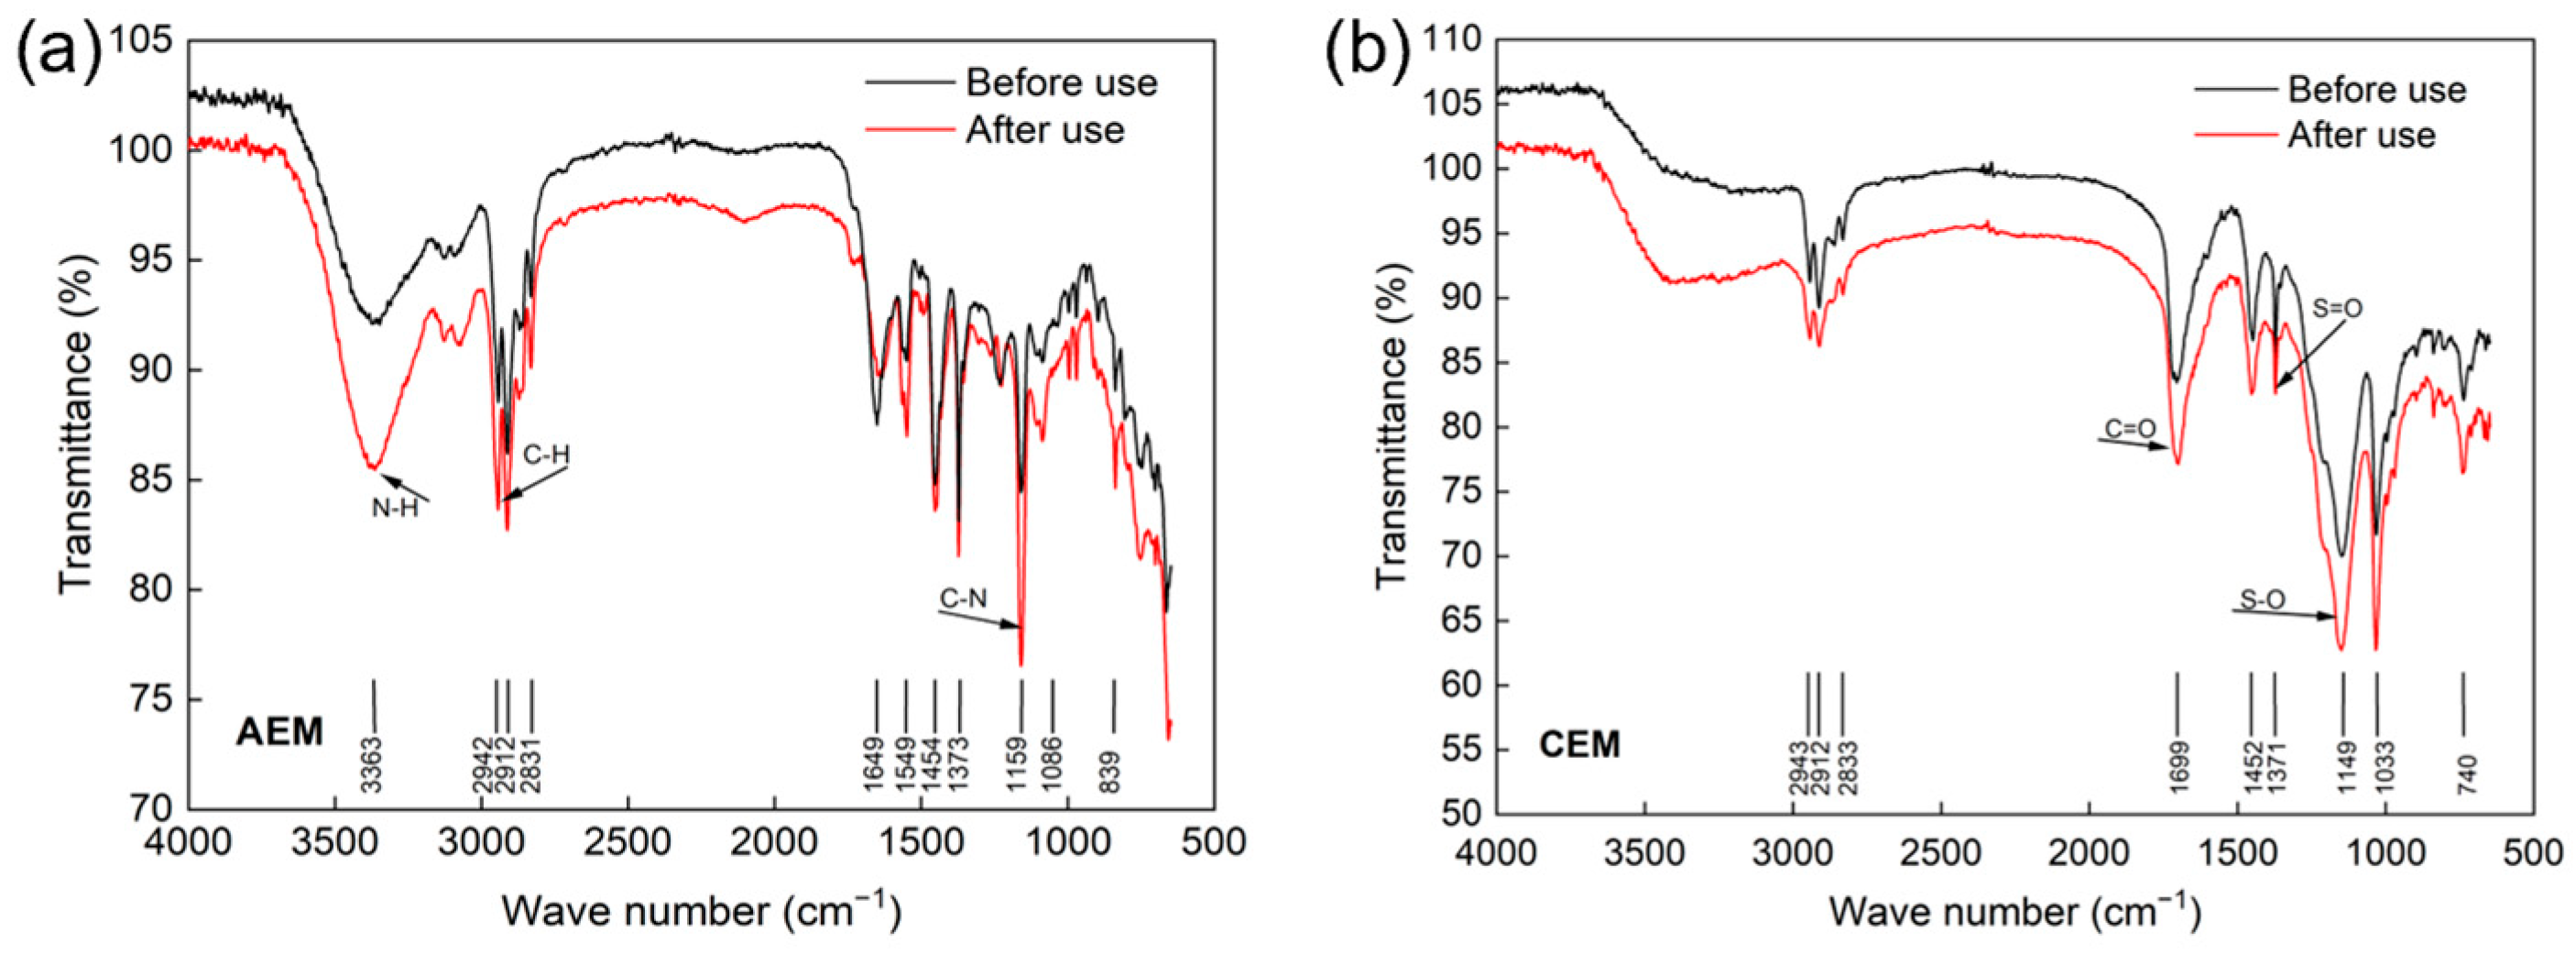
3.2. Changes in the Properties of IEMs
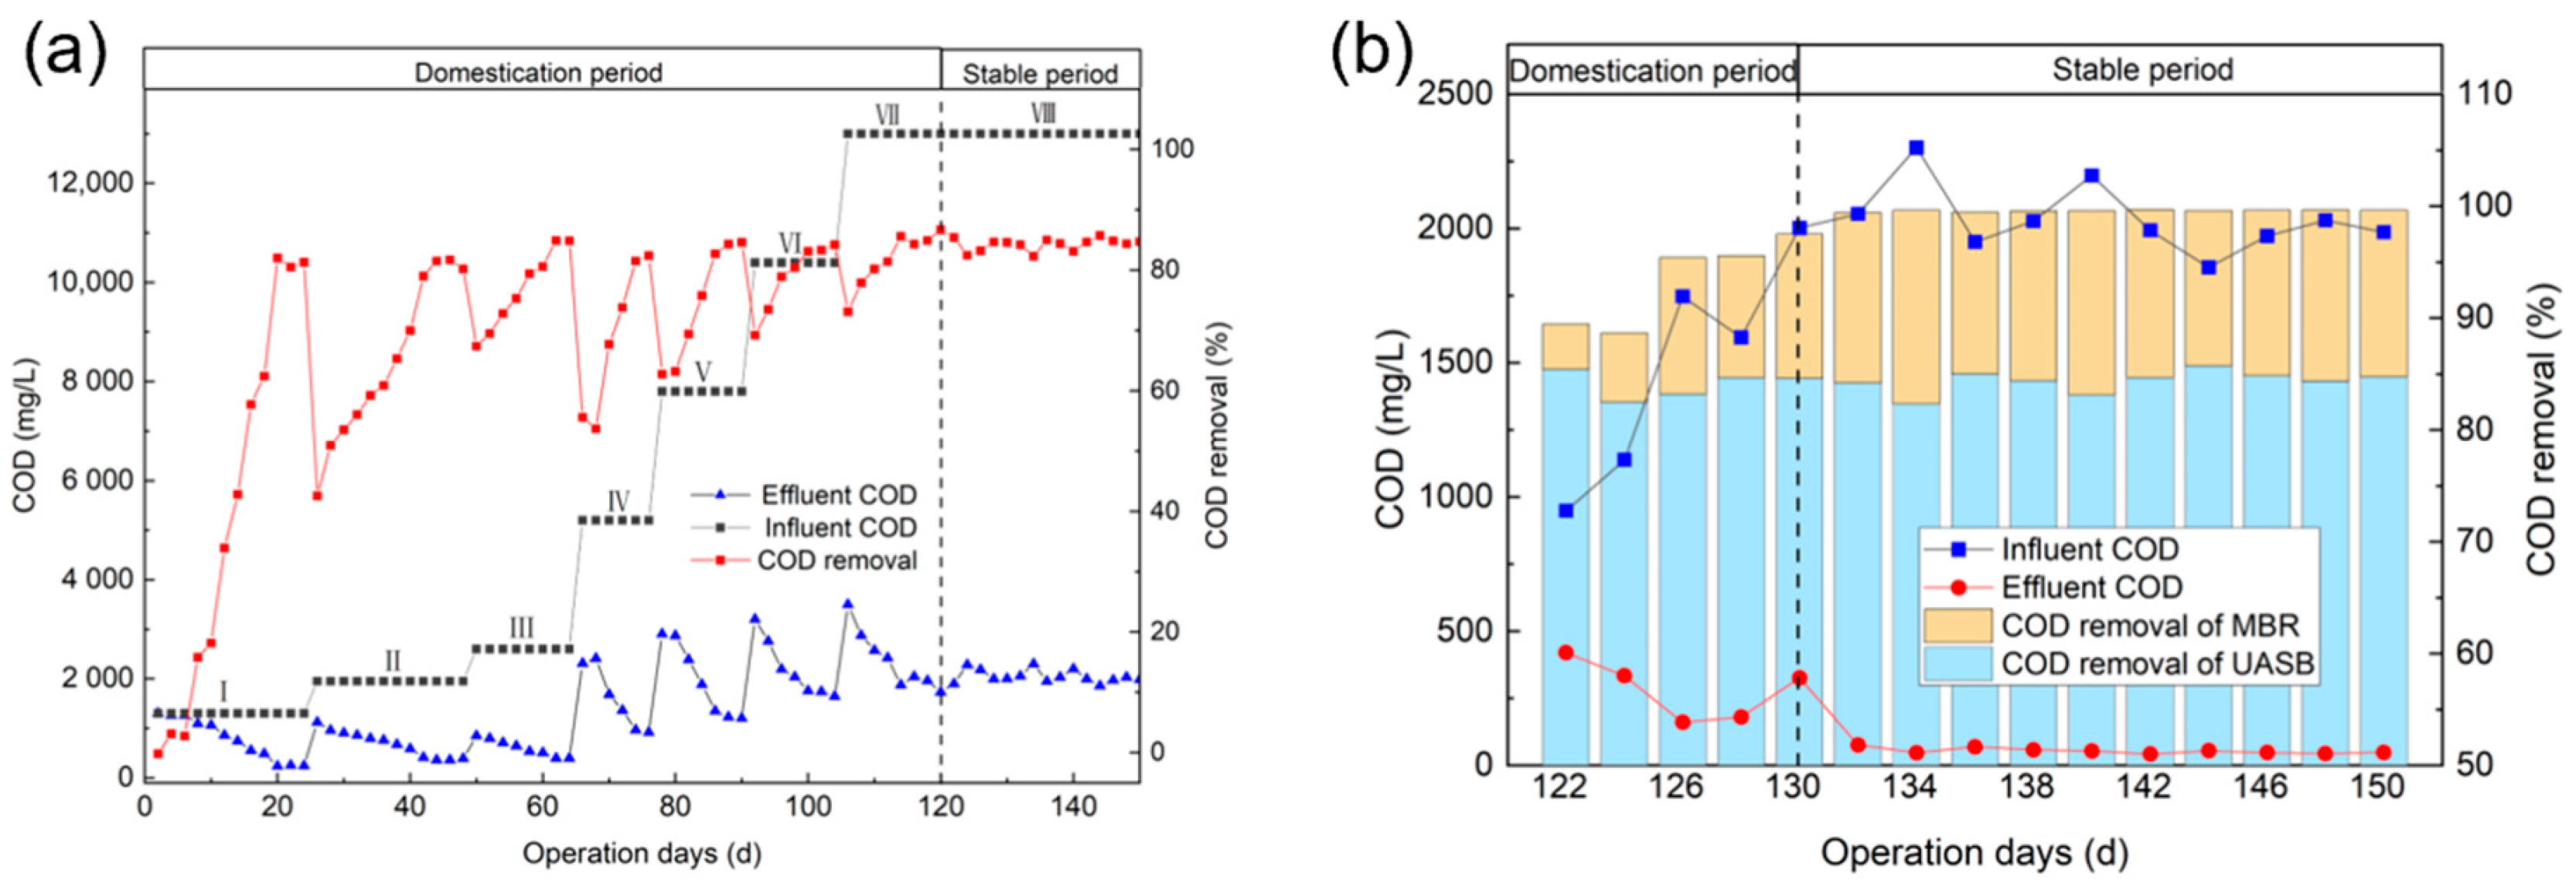
3.3. Biodegradation of ED Dilute Stream Effluent
4. Conclusions
Author Contributions
Funding
Data Availability Statement
Conflicts of Interest
Abbreviations
| AEM | Anion Exchange Membrane |
| CEM | Cation Exchange Membrane |
| COD | Chemical Oxygen Demand |
| CS | Concentrated Stream |
| DO | Dissolved Oxygen |
| DS | Dilute Stream |
| ED | Electrodialysis |
| ERS | Electrode Rinse Solution |
| HRT | Hydraulic Retention Time |
| IEC | Ion Exchange Capacity |
| IEMs | Ion Exchange Membranes |
| MBR | Membrane Bioreactor |
| OLR | Organic Loading Rate |
| PVDF | Polyvinylidene Fluoride |
| RSW | Refined Sugar Wastewater |
| TMP | Transmembrane Pressure |
| UASB | Upflow Anaerobic Sludge Blanket |
References
- Fito, J.; Tefera, N.; Van Hulle, S.W.H. Sugarcane biorefineries wastewater: Bioremediation technologies for environmental sustainability. Chem. Biol. Technol. Agric. 2019, 6, 6. [Google Scholar] [CrossRef]
- Sahu, O.P.; Chaudhari, P.K. The Characteristics, Effects, and Treatment of Wastewater in Sugarcane Industry. Water Qual. Expo. Health 2015, 7, 435–444. [Google Scholar] [CrossRef]
- Nawaz, M.Z.; Bilal, M.; Tariq, A.; Iqbal, H.M.N.; Alghamdi, H.A.; Cheng, H.R. Bio-purification of sugar industry wastewater and production of high-value industrial products with a zero-waste concept. Crit. Rev. Food Sci. 2021, 61, 3537–3554. [Google Scholar] [CrossRef]
- Güven, G.; Perendeci, A.; Tanyolaç, A. Electrochemical treatment of simulated beet sugar factory wastewater. Chem. Eng. J. 2009, 151, 149–159. [Google Scholar] [CrossRef]
- Gondudey, S.; Chaudhari, P.K. Treatment of Sugar Industry Effluent Through SBR Followed by Electrocoagulation. Sugar Tech. 2019, 22, 303–310. [Google Scholar] [CrossRef]
- Sahu, O. Catalytic thermal pre-treatments of sugar industry wastewater with metal oxides: Thermal treatment. Exp. Therm. Fluid Sci. 2017, 85, 379–387. [Google Scholar] [CrossRef]
- Satyawali, Y.; Balakrishnan, M. Removal of color from biomethanated distillery spentwash by treatment with activated carbons. Bioresour. Technol. 2007, 98, 2629–2635. [Google Scholar] [CrossRef]
- Hajiagha, A.A.; Zaeimdar, M.; Jozi, S.A.; Sadjadi, N.; Ghadi, A. Combination of Chemical Coagulation and Photo-Fenton Oxidation Process for the Treatment of Beet Sugar Industry Wastewater: Optimization of Process Conditions by Response Surface Methodology. Ozone Sci. Eng. 2018, 41, 265–273. [Google Scholar] [CrossRef]
- Lefebvre, O.; Moletta, R. Treatment of organic pollution in industrial saline wastewater: A literature review. Water Res. 2006, 40, 3671–3682. [Google Scholar] [CrossRef]
- Chen, Y.; He, H.; Liu, H.; Li, H.; Zeng, G.; Xia, X.; Yang, C. Effect of salinity on removal performance and activated sludge characteristics in sequencing batch reactors. Bioresour. Technol. 2018, 249, 890–899. [Google Scholar] [CrossRef]
- Gurreri, L.; Tamburini, A.; Cipollina, A.; Micale, G. Electrodialysis Applications in Wastewater Treatment for Environmental Protection and Resources Recovery: A Systematic Review on Progress and Perspectives. Membranes 2020, 10, 146. [Google Scholar] [CrossRef] [PubMed]
- Min, K.J.; Kim, J.H.; Park, K.Y. Characteristics of heavy metal separation and determination of limiting current density in a pilot-scale electrodialysis process for plating wastewater treatment. Sci. Total Environ. 2021, 757, 143762. [Google Scholar] [CrossRef] [PubMed]
- He, K.; Liu, D.Q.; Zhang, H.; Zhang, S.H. Application of homogeneous membrane electrodialysis in the treatment of high-salt organic wastewater. IOP Conf. Ser. Earth Environ. Sci. 2019, 227, 062043. [Google Scholar] [CrossRef]
- Al-Amshawee, S.; Yunus, M.Y.B.M.; Azoddein, A.A.M.; Hassell, D.G.; Dakhil, I.H.; Hasan, H.A. Electrodialysis desalination for water and wastewater: A review. Chem. Eng. J. 2020, 380, 122231. [Google Scholar] [CrossRef]
- Chen, G.Q.; Eschbach, F.I.I.; Weeks, M.; Gras, S.L.; Kentish, S.E. Removal of lactic acid from acid whey using electrodialysis. Sep. Purif. Technol. 2016, 158, 230–237. [Google Scholar] [CrossRef]
- Dufton, G.; Mikhaylin, S.; Gaaloul, S.; Bazinet, L. Positive Impact of Pulsed Electric Field on Lactic Acid Removal, Demineralization and Membrane Scaling during Acid Whey Electrodialysis. Int. J. Mol. Sci. 2019, 20, 797. [Google Scholar] [CrossRef]
- Myronchuk, V.; Zmievskii, Y.; Dzyazko, Y.; Rozhdestvenska, L.; Zakharov, V. Whey desalination using polymer and inorganic membranes: Operation conditions. Acta Period. Technol. 2018, 2018, 103–115. [Google Scholar] [CrossRef]
- Walker, W.S.; Kim, Y.; Lawler, D.F. Treatment of model inland brackish groundwater reverse osmosis concentrate with electrodialysis—Part I: Sensitivity to superficial velocity. Desalination 2014, 344, 152–162. [Google Scholar] [CrossRef]
- Mohammadi, R.; Ramasamy, D.L.; Sillanpää, M. Enhancement of nitrate removal and recovery from municipal wastewater through single- and multi-batch electrodialysis: Process optimisation and energy consumption. Desalination 2021, 498, 114726. [Google Scholar] [CrossRef]
- Ahdab, Y.D.; Schücking, G.; Rehman, D.; Lienhard, J.H. Treatment of greenhouse wastewater for reuse or disposal using monovalent selective electrodialysis. Desalination 2021, 507, 115037. [Google Scholar] [CrossRef]
- Luiz, A.; McClure, D.D.; Lim, K.; Leslie, G.; Coster, H.G.L.; Barton, G.W.; Kavanagh, J.M. Potential upgrading of bio-refinery streams by electrodialysis. Desalination 2017, 415, 20–28. [Google Scholar] [CrossRef]
- Goodwin, J.A.S.; Finlayson, J.M.; Low, E.W. A further study of the anaerobic biotreatment of malt whisky distillery pot ale using an UASB system. Bioresour. Technol. 2001, 78, 155–160. [Google Scholar] [CrossRef]
- Cheng, C.L.; Yang, Z.J.; Pan, J.F.; Tong, B.; Xu, T.W. Facile and cost effective PVA based hybrid membrane fabrication for acid recovery. Sep. Purif. Technol. 2014, 136, 250–257. [Google Scholar] [CrossRef]
- Fito, J.; Tefera, N.; Kloos, H.; Van Hulle, S.W.H. Physicochemical Properties of the Sugar Industry and Ethanol Distillery Wastewater and Their Impact on the Environment. Sugar Tech. 2019, 21, 265–277. [Google Scholar] [CrossRef]
- Li, Z.; Li, R.; Zhong, Z.; Zhou, M.; Chen, M.; Xing, W. Acid precipitation coupled electrodialysis to improve separation of chloride and organics in pulping crystallization mother liquor. Chin. J. Chem. Eng. 2019, 27, 2917–2924. [Google Scholar] [CrossRef]
- Foo, K.; Liang, Y.Y.; Tan, C.K.; Fimbres Weihs, G.A. Coupled effects of circular and elliptical feed spacers under forced-slip on viscous dissipation and mass transfer enhancement based on CFD. J. Membr. Sci. 2021, 637, 119599. [Google Scholar] [CrossRef]
- Uzdenova, A.; Kovalenko, A.; Prosviryakov, E.; Urtenov, M. Mathematical Modeling of the Influence of the Karman Vortex Street on Mass Transfer in Electromembrane Systems. Membranes 2023, 13, 394. [Google Scholar] [CrossRef]
- Lee, H.J.; Oh, S.J.; Moon, S.H. Recovery of ammonium sulfate from fermentation waste by electrodialysis. Water Res. 2003, 37, 1091–1099. [Google Scholar] [CrossRef]
- GB 21909-2008; Discharge Standard for Water Pollutants for Sugar Industry. 2008. Available online: https://english.mee.gov.cn/Resources/standards/water_environment/Discharge_standard/200811/t20081103_130769.shtml (accessed on 13 May 2023). (In Chinese)


| Parameter | pH | Conductivity (mS·cm−1) | COD (g·L−1) | NH4-N (mg·L−1) | Color (PCU) | Turbidity (NTU) | Suspended Solids (mg·L−1) |
|---|---|---|---|---|---|---|---|
| Raw wastewater | 6.8–7.2 | 28–30 | 20–22 | 20–24 | 8700–8800 | 1600–1700 | 480–520 |
| Filtrate | 6.8–7.2 | 27–29 | 12–14 | 15–18 | 850–900 | 7–9 | 1–2 |
| Performance | CEM | AEM |
|---|---|---|
| Ion exchange capacity/mmol·g−1 | 0.90~1.10 | 0.90~1.10 |
| Area electric resistance/Ω·cm² | ≤4.50 | ≤5.00 |
| Thickness (wet)/μm | 40~50 | 40~50 |
| Uptake in H2O at 25 °C/wt% | 15~20 | 15~20 |
| Transport number | ≥0.98 | ≥0.98 |
| Stability/ph | 1~12 | 0~14 |
| Temperature/°C | 15~40 | 15~40 |
| Volume Ratio | 1:1 | 3:1 | 5:1 |
|---|---|---|---|
| /A | 0.6830 | 0.9456 | 1.1900 |
| η/% b | 92.13 | 93.34 | 92.51 |
| E/(kW·h·m−3) a | 7.34 | 6.93 | 7.22 |
| Performance | AEM | CEM | ||
|---|---|---|---|---|
| Before | After | Before | After | |
| IEC (mmol·g−1) | 2.28 | 1.83 | 2.19 | 2.13 |
| Rm (Ω·m−2) | 1.05 | 1.37 | 1.06 | 1.21 |
| ṫ | 0.92 | 0.92 | 0.93 | 0.92 |
| Phase | Dilution Ratio | Operation Periods | Organic Loading Rate (kgCOD·m−3·d−1) | HRT of UASB/d |
|---|---|---|---|---|
| 1 | 10% | Days 1 to 24 | 0.65 | 2 |
| 2 | 15% | Days 25 to 48 | 0.98 | 2 |
| 3 | 20% | Days 49 to 64 | 1.3 | 2 |
| 4 | 40% | Days 65 to 76 | 2.6 | 2 |
| 5 | 60% | Days 77 to 90 | 3.9 | 2 |
| 6 | 80% | Days 91 to 104 | 5.4 | 2 |
| 7 | 100% | Days 105 to 120 | 6.5 | 2 |
| 8 | 100% | Days 121 to 150 | 6.5 | 2 |
Disclaimer/Publisher’s Note: The statements, opinions and data contained in all publications are solely those of the individual author(s) and contributor(s) and not of MDPI and/or the editor(s). MDPI and/or the editor(s) disclaim responsibility for any injury to people or property resulting from any ideas, methods, instructions or products referred to in the content. |
© 2023 by the authors. Licensee MDPI, Basel, Switzerland. This article is an open access article distributed under the terms and conditions of the Creative Commons Attribution (CC BY) license (https://creativecommons.org/licenses/by/4.0/).
Share and Cite
Xu, S.; Zhao, H.; Xie, L.; Wang, K.; Zhang, W. Study on the Treatment of Refined Sugar Wastewater by Electrodialysis Coupled with Upflow Anaerobic Sludge Blanket and Membrane Bioreactor. Membranes 2023, 13, 527. https://doi.org/10.3390/membranes13050527
Xu S, Zhao H, Xie L, Wang K, Zhang W. Study on the Treatment of Refined Sugar Wastewater by Electrodialysis Coupled with Upflow Anaerobic Sludge Blanket and Membrane Bioreactor. Membranes. 2023; 13(5):527. https://doi.org/10.3390/membranes13050527
Chicago/Turabian StyleXu, Shichang, Han Zhao, Lixin Xie, Keqiang Wang, and Wen Zhang. 2023. "Study on the Treatment of Refined Sugar Wastewater by Electrodialysis Coupled with Upflow Anaerobic Sludge Blanket and Membrane Bioreactor" Membranes 13, no. 5: 527. https://doi.org/10.3390/membranes13050527