

Self-Standing, Ultrasonic Spray-Deposited Membranes for Fuel Cells
 , ,
, ,  , ,
, , 
Abstract
:1. Introduction
2. Materials and Methods
2.1. Chemicals and Materials
2.2. Fabrication Techniques
2.3. Characterization Methods
3. Results and Discussion
4. Conclusions
Author Contributions
Funding
Institutional Review Board Statement
Data Availability Statement
Acknowledgments
Conflicts of Interest
References
- Beuscher, U.; Cleghorn, S.J.C.; Johnson, W.B. Challenges for Pem Fuel Cell Membranes. Int. J. Energy Res. 2005, 29, 1103–1112. [Google Scholar] [CrossRef]
- Sadeghi Alavijeh, A.; Goulet, M.A.; Khorasany, R.M.H.; Ghataurah, J.; Lim, C.; Lauritzen, M.; Kjeang, E.; Wang, G.G.; Rajapakse, R.K.N.D. Decay in Mechanical Properties of Catalyst Coated Membranes Subjected to Combined Chemical and Mechanical Membrane Degradation. Fuel Cells 2015, 15, 204–213. [Google Scholar] [CrossRef]
- Yang, B.; Manthiram, A. Multilayered Membranes with Suppressed Fuel Crossover for Direct Methanol Fuel Cells. Electrochem. Commun. 2004, 6, 231–236. [Google Scholar] [CrossRef]
- Wilson, M.S.; Gottesfeld, S. Thin-Film Catalyst Layers for Polymer Electrolyte Fuel Cell Electrodes. J. Appl. Electrochem. 1992, 22, 1–7. [Google Scholar] [CrossRef]
- Tang, H.; Wang, S.; Pan, M.; Jiang, S.P.; Ruan, Y. Performance of Direct Methanol Fuel Cells Prepared by Hot-Pressed Mea and Catalyst-Coated Membrane (Ccm). Electrochim. Acta 2007, 52, 3714–3718. [Google Scholar] [CrossRef]
- Chen, J.; Liu, H.; Huang, Y.A.; Yin, Z. High-Rate Roll-to-Roll Stack and Lamination of Multilayer Structured Membrane Electrode Assembly. J. Manuf. Process. 2016, 23, 175–182. [Google Scholar] [CrossRef]
- Saha, M.S.; Paul, D.K.; Peppley, B.A.; Karan, K. Fabrication of Catalyst-Coated Membrane by Modified Decal Transfer Technique. Electrochem. Commun. 2010, 12, 410–413. [Google Scholar] [CrossRef]
- Millington, B.; Whipple, V.; Pollet, B.G. A Novel Method for Preparing Proton Exchange Membrane Fuel Cell Electrodes by the Ultrasonic-Spray Technique. J. Power Sources 2011, 196, 8500–8508. [Google Scholar] [CrossRef]
- Huang, D.C.; Yu, P.J.; Liu, F.J.; Huang, S.L.; Hsueh, K.L.; Chen, Y.C.; Wu, C.H.; Chang, W.C.; Tsau, F.H. Effect of Dispersion Solvent in Catalyst Ink on Proton Exchange Membrane Fuel Cell Performance. Int. J. Electrochem. Sci. 2011, 6, 2551–2565. [Google Scholar]
- Wippermann, K.; Elze, R.; Wannek, C.; Echsler, H.; Stolten, D. Influence of the Ionomer Type in Direct Methanol Fuel Cell (Dmfc) Anode Catalyst Layers on the Properties of Primary and Secondary Pores. J. Power Sources 2013, 228, 57–67. [Google Scholar] [CrossRef]
- Reshetenko, T.V.; Kim, H.T.; Krewer, U.; Kweon, H.J. The Effect of the Anode Loading and Method of Mea Fabrication on Dmfc Performance. Fuel Cells 2007, 7, 238–245. [Google Scholar] [CrossRef]
- Thanasilp, S.; Hunsom, M. Effect of Mea Fabrication Techniques on the Cell Performance of Pt–Pd/C Electrocatalyst for Oxygen Reduction in Pem Fuel Cell. Fuel 2010, 89, 3847–3852. [Google Scholar] [CrossRef]
- Sun, L.; Ran, R.; Shao, Z. Fabrication and Evolution of Catalyst-Coated Membranes by Direct Spray Deposition of Catalyst Ink onto Nafion Membrane at High Temperature. Int. J. Hydrogen Energy 2010, 35, 2921–2925. [Google Scholar] [CrossRef]
- Engle, R. Maximizing the Use of Platinum Catalyst by Ultrasonic Spray Application. J. Fuel Cell Sci. Technol. 2012, 9, 014501. [Google Scholar] [CrossRef]
- Shi, Y.; Lu, Z.; Guo, L.; Yan, C. Fabrication of Membrane Electrode Assemblies by Direct Spray Catalyst on Water Swollen Nafion Membrane for Pem Water Electrolysis. Int. J. Hydrogen Energy 2017, 42, 26183–26191. [Google Scholar] [CrossRef]
- Park, I.-S.; Li, W.; Manthiram, A. Fabrication of Catalyst-Coated Membrane-Electrode Assemblies by Doctor Blade Method and Their Performance in Fuel Cells. J. Power Sources 2010, 195, 7078–7082. [Google Scholar] [CrossRef]
- Klingele, M.; Breitwieser, M.; Zengerle, R.; Thiele, S. Direct Deposition of Proton Exchange Membranes Enabling High Performance Hydrogen Fuel Cells. J. Mater. Chem. A 2015, 3, 11239–11245. [Google Scholar] [CrossRef]
- Klingele, M.; Britton, B.; Breitwieser, M.; Vierrath, S.; Zengerle, R.; Holdcroft, S.; Thiele, S. A Completely Spray-Coated Membrane Electrode Assembly. Electrochem. Commun. 2016, 70, 65–68. [Google Scholar] [CrossRef]
- Bayer, T.; Pham, H.C.; Sasaki, K.; Lyth, S.M. Spray Deposition of Nafion Membranes: Electrode-Supported Fuel Cells. J. Power Sources 2016, 327, 319–326. [Google Scholar] [CrossRef]
- Stähler, M.; Stähler, A.; Scheepers, F.; Carmo, M.; Stolten, D. A Completely Slot Die Coated Membrane Electrode Assembly. Int. J. Hydrogen Energy 2019, 44, 7053–7058. [Google Scholar] [CrossRef]
- Hensley, J.E.; Way, J.D.; Dec, S.F.; Abney, K.D. The Effects of Thermal Annealing on Commercial Nafion® Membranes. J. Membr. Sci. 2007, 298, 190–201. [Google Scholar] [CrossRef]
- Gebel, G.; Aldebert, P.; Pineri, M. Structure and Related Properties of Solution-Cast Perfluorosulfonated Ionomer Films. Macromolecules 1987, 20, 1425–1428. [Google Scholar] [CrossRef]
- Dimitrova, P.; Friedrich, K.A.; Stimming, U.; Vogt, B. Modified Nafion®-Based Membranes for Use in Direct Methanol Fuel Cells. Solid State Ion. 2002, 150, 115–122. [Google Scholar] [CrossRef]
- Moore, R.B.; Martin, C.R. Procedure for Preparing Solution-Cast Perfluorosulfonate Ionomer Films and Membranes. Anal. Chem. 1986, 58, 2569–2570. [Google Scholar] [CrossRef]
- Tarokh, A.; Karan, K.; Ponnurangam, S. Atomistic Md Study of Nafion Dispersions: Role of Solvent and Counterion in the Aggregate Structure, Ionic Clustering, and Acid Dissociation. Macromolecules 2020, 53, 288–301. [Google Scholar] [CrossRef]
- Kim, Y.S.; Welch, C.F.; Hjelm, R.P.; Mack, N.H.; Labouriau, A.; Orler, E.B. Origin of Toughness in Dispersion-Cast Nafion Membranes. Macromolecules 2015, 48, 2161–2172. [Google Scholar] [CrossRef]
- Ahrenstorf, K.; Albrecht, O.; Heller, H.; Kornowski, A.; Görlitz, D.; Weller, H. Colloidal Synthesis of NixPt1−X Nanoparticles with Tuneable Composition and Size. Small 2007, 3, 271–274. [Google Scholar] [CrossRef]
- Karaca, A.; Glüsen, A.; Wippermann, K.; Mauger, S.; Yang-Neyerlin, A.C.; Woderich, S.; Gimmler, C.; Müller, M.; Bender, G.; Weller, H.; et al. Oxygen Reduction at PtNi Alloys in Direct Methanol Fuel Cells-Electrode Development and Characterization. Energies 2023, 16, 1115. [Google Scholar] [CrossRef]
- Yuan, J.; Zhou, G.; Pu, H. Preparation and Properties of Nafion®/Hollow Silica Spheres Composite Membranes. J. Membr. Sci. 2008, 325, 742–748. [Google Scholar] [CrossRef]
- Wu, X. General Equivalent Circuits for Faradaic Electrode Processes under Electrochemical Reaction Control. J. Electrochem. Soc. 1999, 146, 1847. [Google Scholar] [CrossRef]
- Nafion™ Sulfonic Membranes. Available online: https://www.nafion.com/en/products/sulfonic-membranes (accessed on 6 April 2023).
- Cheng, X.; Zhang, J.; Tang, Y.; Song, C.; Shen, J.; Song, D.; Zhang, J. Hydrogen Crossover in High-Temperature Pem Fuel Cells. J. Power Sources 2007, 167, 25–31. [Google Scholar] [CrossRef]
- Schiller, C.A.; Richter, F.; Gülzow, E.; Wagner, N. Validation and Evaluation of Electrochemical Impedance Spectra of Systems with States That Change with Time. PCCP 2001, 3, 374–378. [Google Scholar] [CrossRef]
- Slade, R.; Varcoe, J. Investigations of Conductivity in Fep-Based Radiation-Grafted Alkaline Anion-Exchange Membranes. Solid State Ion. 2005, 176, 585–597. [Google Scholar] [CrossRef]
- Holzapfel, P.; Bühler, M.; Van Pham, C.; Hegge, F.; Böhm, T.; McLaughlin, D.; Breitwieser, M.; Thiele, S. Directly Coated Membrane Electrode Assemblies for Proton Exchange Membrane Water Electrolysis. Electrochem. Commun. 2020, 110, 106640. [Google Scholar] [CrossRef]
- Luan, Y.; Zhang, Y.; Zhang, H.; Li, L.; Li, H.; Liu, Y. Annealing Effect of Perfluorosulfonated Ionomer Membranes on Proton Conductivity and Methanol Permeability. J. Appl. Polym. Sci. 2008, 107, 396–402. [Google Scholar] [CrossRef]
- Jung, H.-Y.; Kim, J.W. Role of the Glass Transition Temperature of Nafion 117 Membrane in the Preparation of the Membrane Electrode Assembly in a Direct Methanol Fuel Cell (Dmfc). Int. J. Hydrogen Energy 2012, 37, 12580–12585. [Google Scholar] [CrossRef]
- Page, K.A.; Cable, K.M.; Moore, R.B. Molecular Origins of the Thermal Transitions and Dynamic Mechanical Relaxations in Perfluorosulfonate Ionomers. Macromolecules 2005, 38, 6472–6484. [Google Scholar] [CrossRef]
- Collette, F.M.; Thominette, F.; Mendil-Jakani, H.; Gebel, G. Structure and Transport Properties of Solution-Cast Nafion® Membranes Subjected to Hygrothermal Aging. J. Membr. Sci. 2013, 435, 242–252. [Google Scholar] [CrossRef]
- Hongsirikarn, K.; Goodwin, J.G.; Greenway, S.; Creager, S. Influence of Ammonia on the Conductivity of Nafion Membranes. J. Power Sources 2010, 195, 30–38. [Google Scholar] [CrossRef]
- Watts, J.C.; Larson, P.A. Dimethylacetamide. In Kirk-Othmer Encyclopedia of Chemical Technology; John Wiley & Sons, Inc.: Chichester, UK, 2002. [Google Scholar]
- Comins, D.L.; Joseph, S.P. N,N-Dimethylformamide. In Encyclopedia of Reagents for Organic Synthesis; John Wiley & Sons, Ltd.: Chichester, UK, 2001; Volume 71 II, pp. 545–574. [Google Scholar]
- Krapcho, A.P.; Porcheddu, A.; Giacomelli, G. Dimethyl Sulfoxide. In Encyclopedia of Reagents for Organic Synthesis; John Wiley & Sons, Ltd.: Chichester, UK, 2004; Volume 42, pp. 825–830. [Google Scholar]


| Membrane Type | Ohmic Resistance R ± Standard Deviation σ/Ω cm2 |
|---|---|
| Nafion 115 | 0.21 ± 0.01 |
| M(110) | 0.18 ± 0.02 |
| M(135) | 0.16 ± 0.02 |
| M(165) | 0.18 ± 0.02 |
| M(195) | 0.18 ± 0.01 |
| M(DMSO) | 0.23 ± 0.04 |
| M(DMAc) | 0.30 ± 0.02 |
| M(DMF) | 2.18 ± 0.08 |
| Membrane Type | Ohmic Resistance R ± Standard Deviation σ/Ω cm2 |
|---|---|
| Nafion 115 | 0.12 ± 0.01 |
| M(110) | 0.10 ± 0.02 |
| M(135) | 0.08 ± 0.02 |
| M(165) | 0.10 ± 0.02 |
| M(195) | 0.10 ± 0.01 |
| M(DMSO) | 0.15 ± 0.04 |
| M(DMAc) | 0.22 ± 0.02 |
| M(DMF) | 2.10 ± 0.08 |
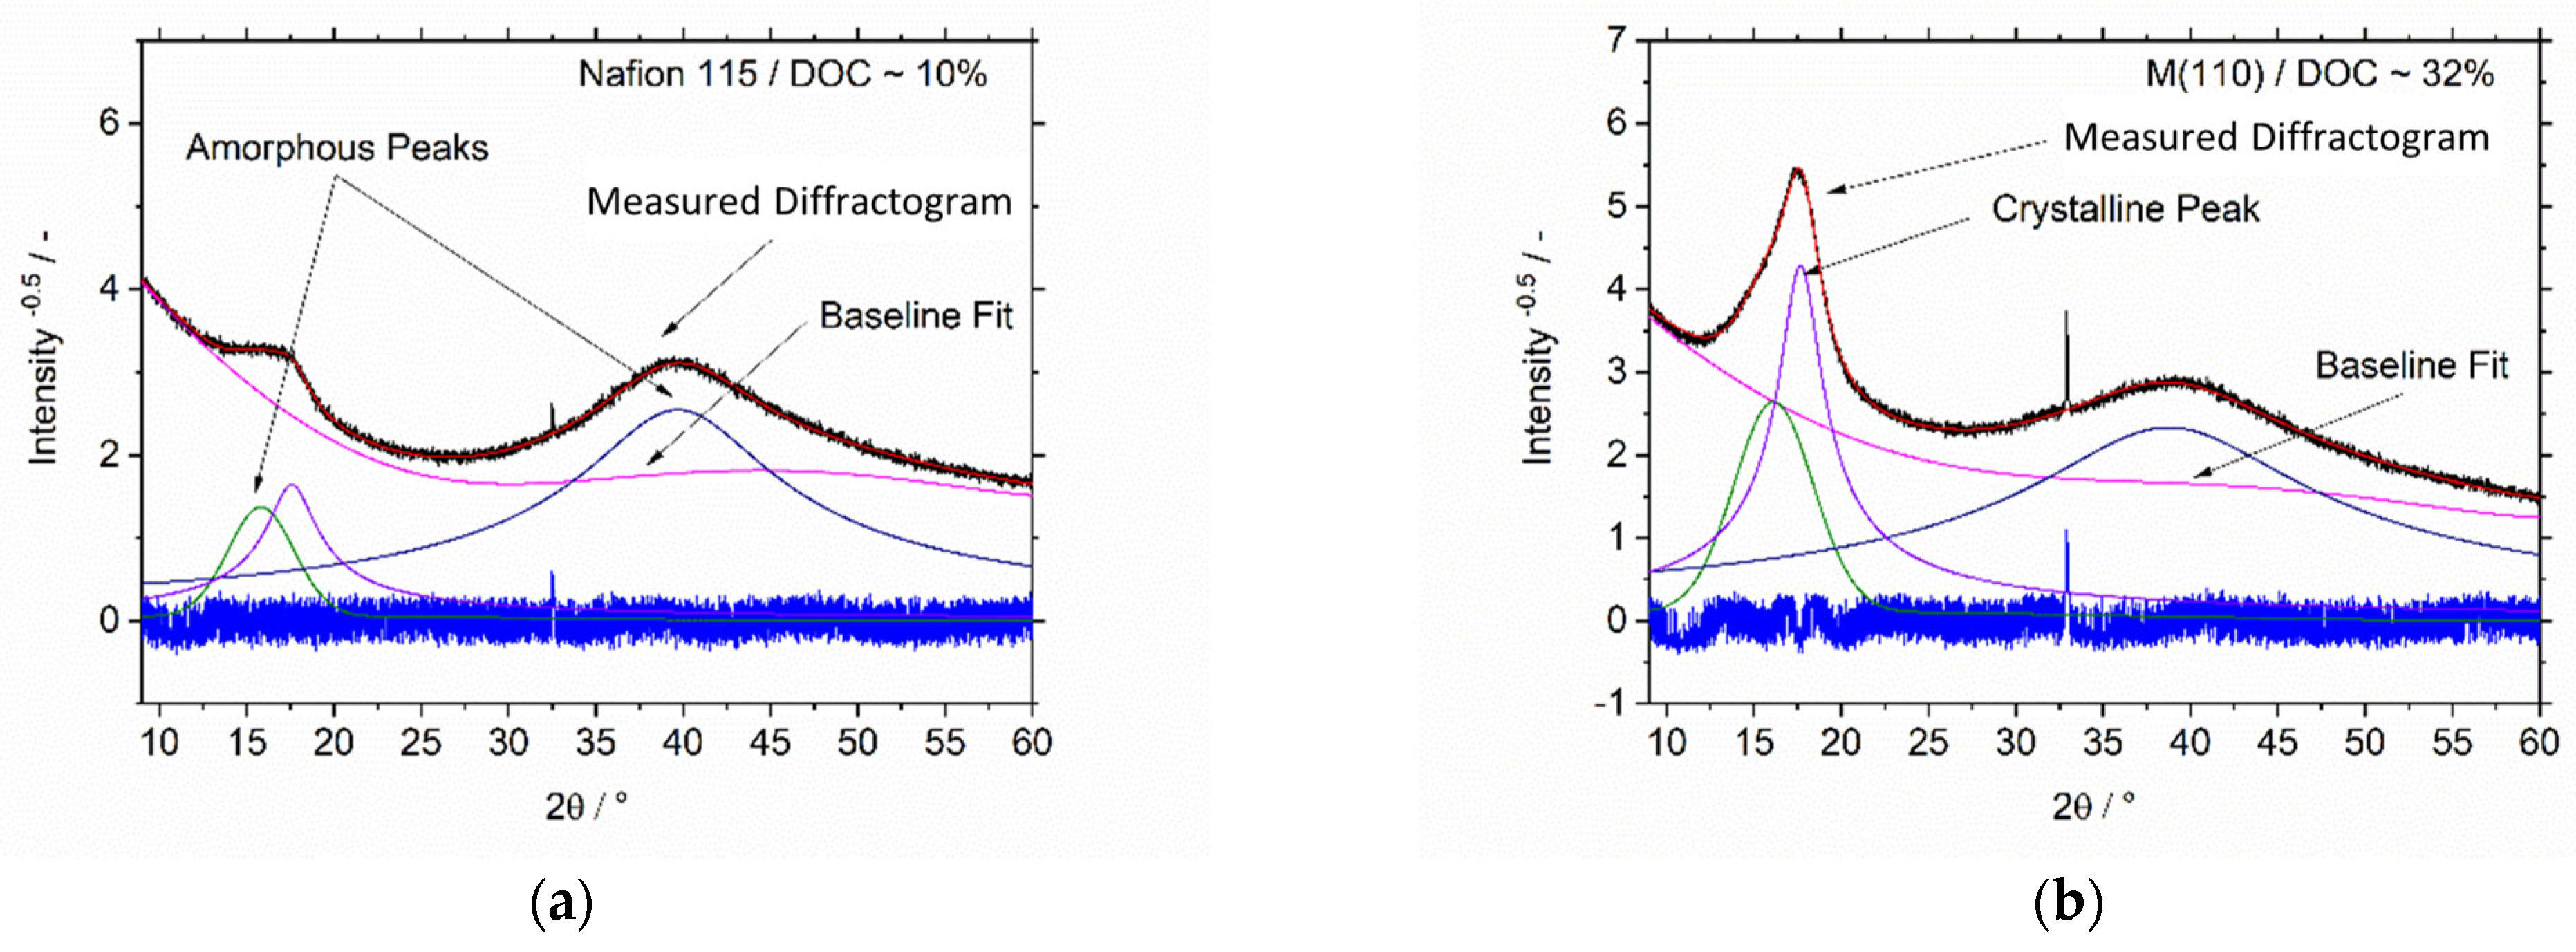
| Membrane Type | Degree of Crystallinity/% |
|---|---|
| Nafion 115 | 10 |
| Commercial PTFE | 33 |
| M(110) | 33 |
| M(135) | 34 |
| M(165) | 31 |
| M(195) | 23 |
| Membrane Type | Degree of Crystallinity/% |
|---|---|
| Nafion 115 | 10 |
| Commercial PTFE | 33 |
| M(DMSO) | 36 |
| M(DMAc) | 33 |
| M(DMF) | 44 |
| Solvent | Reaction |
|---|---|
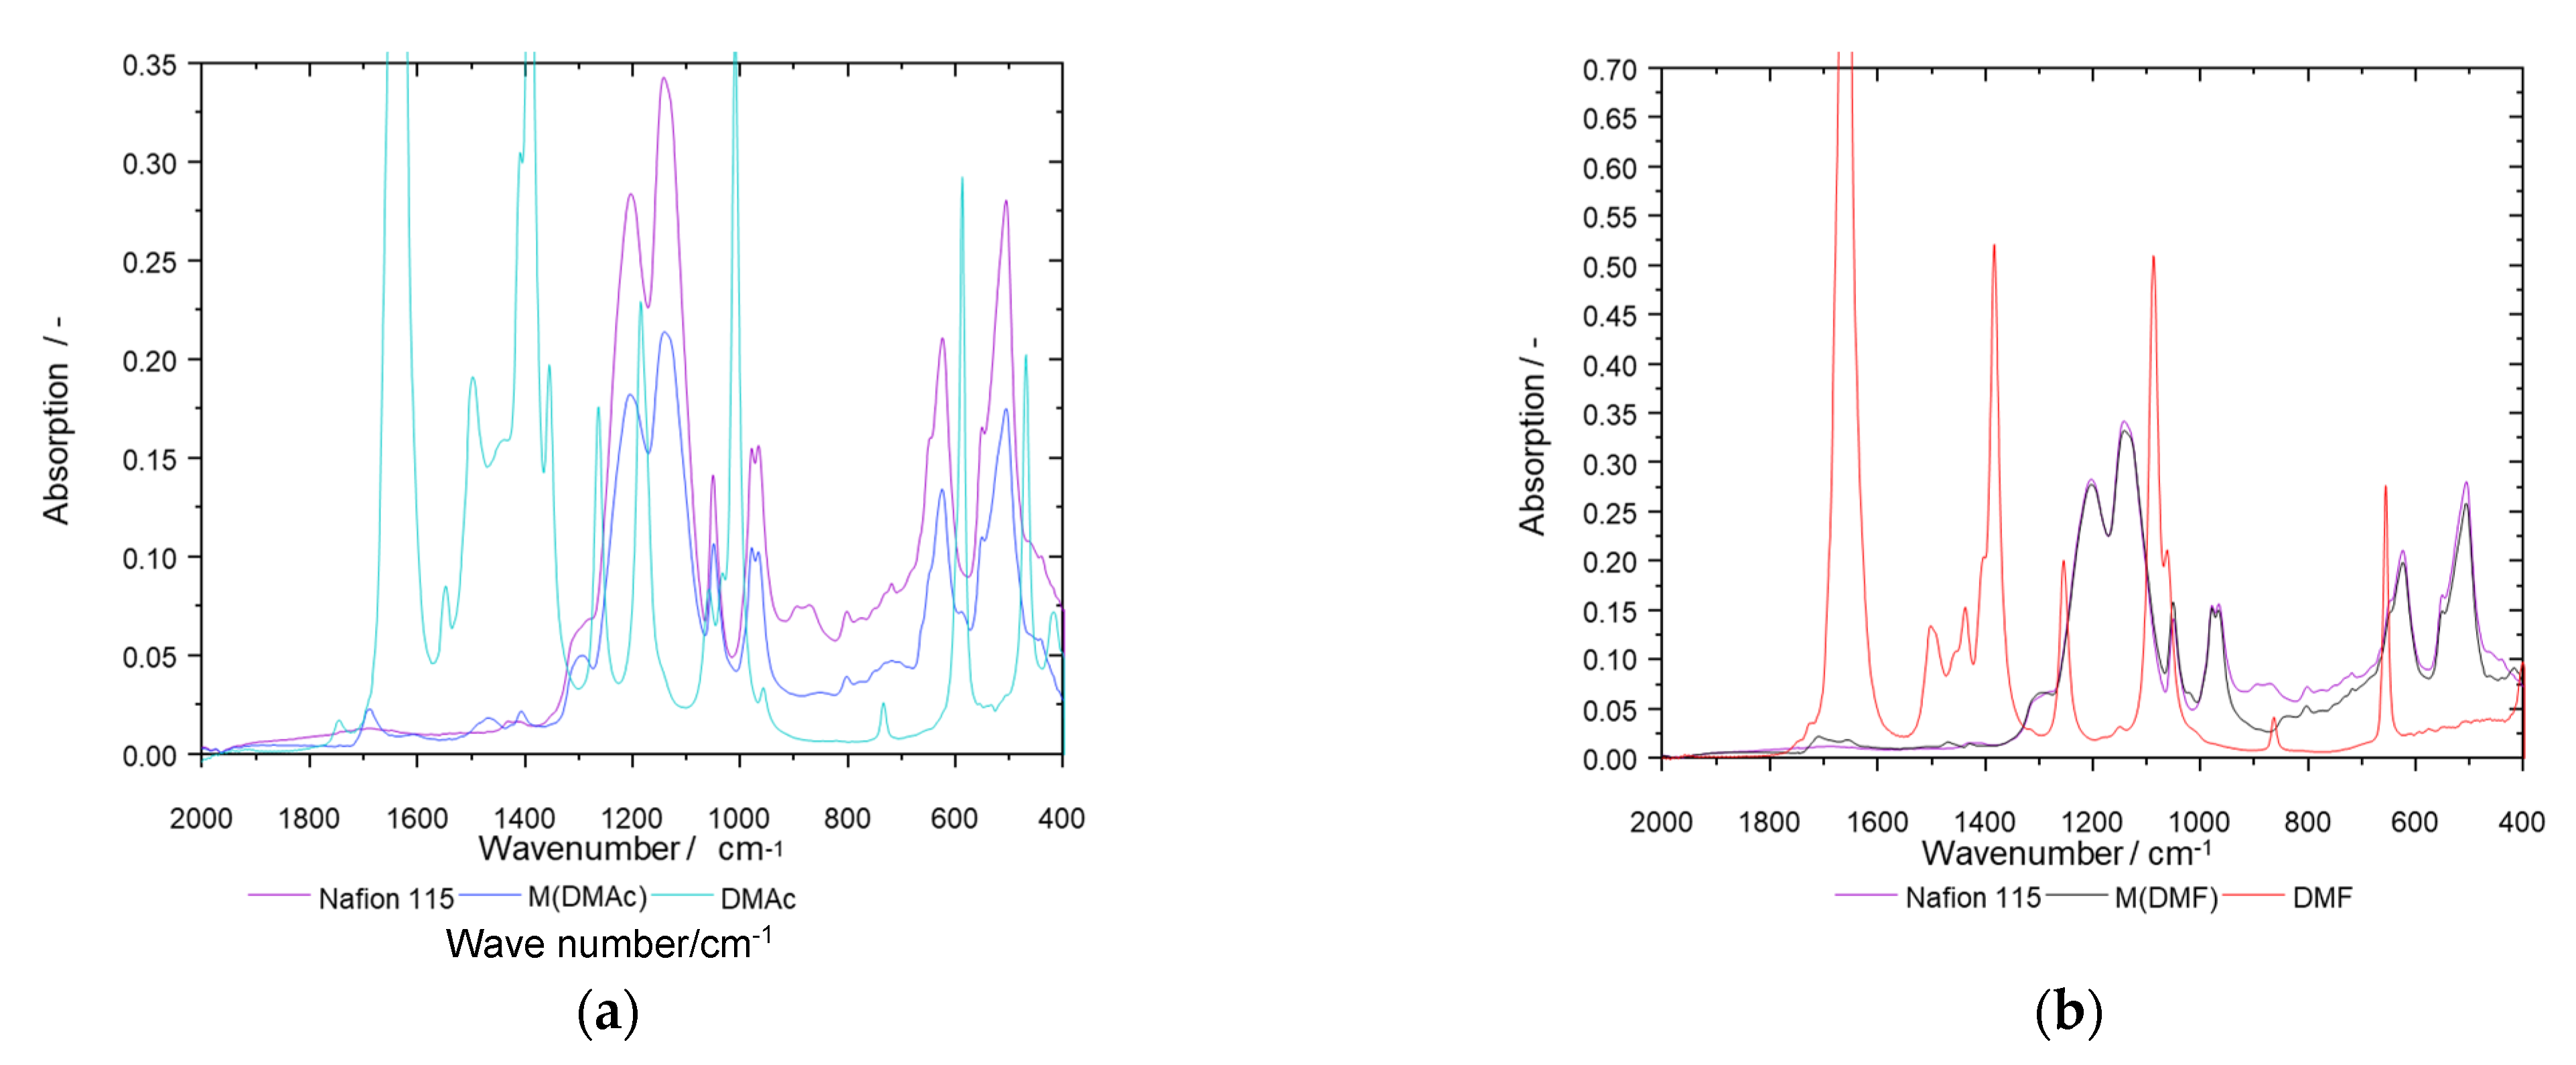
| Dimethylacetamide (DMAc) [41] | It is reported that DMAc, under strong acidic conditions, undergoes hydrolysis, releasing acetic acid and dimethylamine. Alternatively, it can undergo alcoholysis under acidic conditions, whereby an acetic ester and dimethylamine are released. A dimethylamine-based Nafion salt would have much lower conductivities. |
| Dimethylformamide (DMF) [42] | DMF can decompose into carbon monoxide and dimethylamine at its boiling point (153 °C). This temperature was not reached during membrane manufacturing. Nevertheless, decomposition can be catalyzed under acidic conditions. |
| Dimethyl sulfoxide (DMSO) [43] | DMSO can undergo a disproportionation reaction to dimethyl sulfide and dimethyl sulfone at 90 °C. To us, it is not clear what could potentially happen after this step to cause membranes to have such a high ohmic resistance and the resulting CCM to perform poorly. |
Disclaimer/Publisher’s Note: The statements, opinions and data contained in all publications are solely those of the individual author(s) and contributor(s) and not of MDPI and/or the editor(s). MDPI and/or the editor(s) disclaim responsibility for any injury to people or property resulting from any ideas, methods, instructions or products referred to in the content. |
© 2023 by the authors. Licensee MDPI, Basel, Switzerland. This article is an open access article distributed under the terms and conditions of the Creative Commons Attribution (CC BY) license (https://creativecommons.org/licenses/by/4.0/).
Share and Cite
Karaca, A.; Galkina, I.; Sohn, Y.J.; Wippermann, K.; Scheepers, F.; Glüsen, A.; Shviro, M.; Müller, M.; Carmo, M.; Stolten, D. Self-Standing, Ultrasonic Spray-Deposited Membranes for Fuel Cells. Membranes 2023, 13, 522. https://doi.org/10.3390/membranes13050522
Karaca A, Galkina I, Sohn YJ, Wippermann K, Scheepers F, Glüsen A, Shviro M, Müller M, Carmo M, Stolten D. Self-Standing, Ultrasonic Spray-Deposited Membranes for Fuel Cells. Membranes. 2023; 13(5):522. https://doi.org/10.3390/membranes13050522
Chicago/Turabian StyleKaraca, Ali, Irina Galkina, Yoo Jung Sohn, Klaus Wippermann, Fabian Scheepers, Andreas Glüsen, Meital Shviro, Martin Müller, Marcelo Carmo, and Detlef Stolten. 2023. "Self-Standing, Ultrasonic Spray-Deposited Membranes for Fuel Cells" Membranes 13, no. 5: 522. https://doi.org/10.3390/membranes13050522