
Optimization and Evaluation for the Capacitive Deionization Process of Wastewater Reuse in Combined Cycle Power Plants


Abstract
:1. Introduction
2. Materials and Methods
2.1. Materials
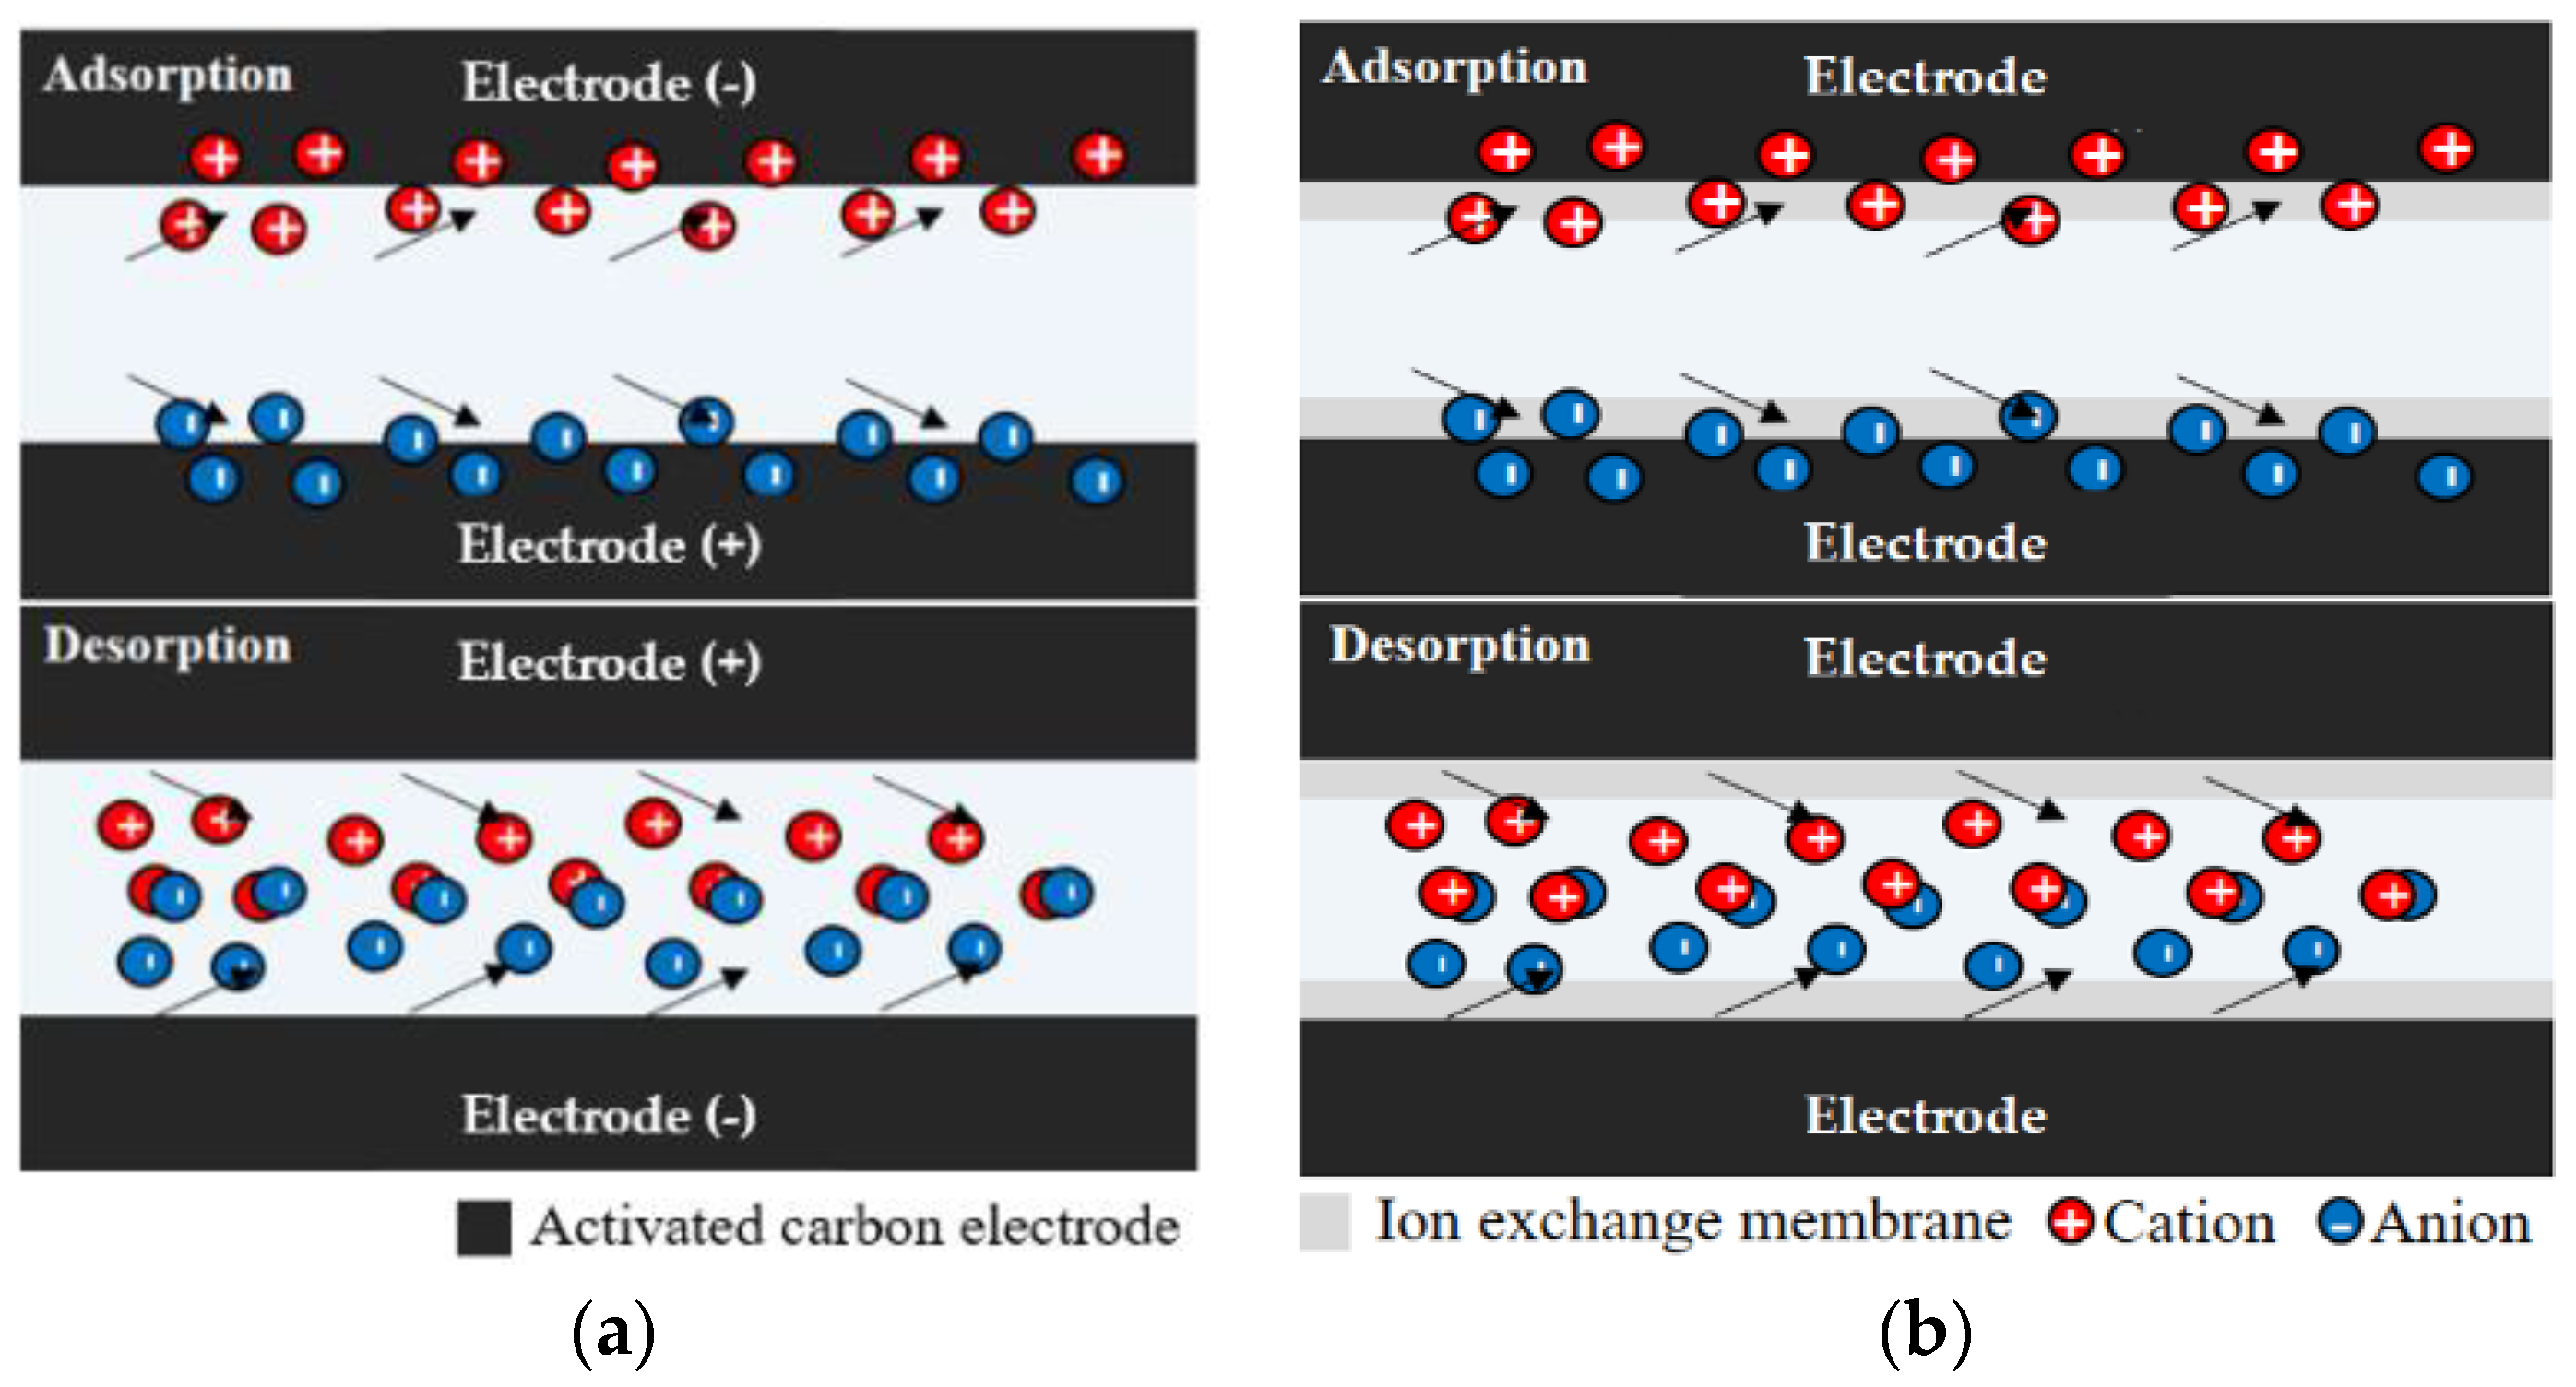
2.1.1. Principle of CDI
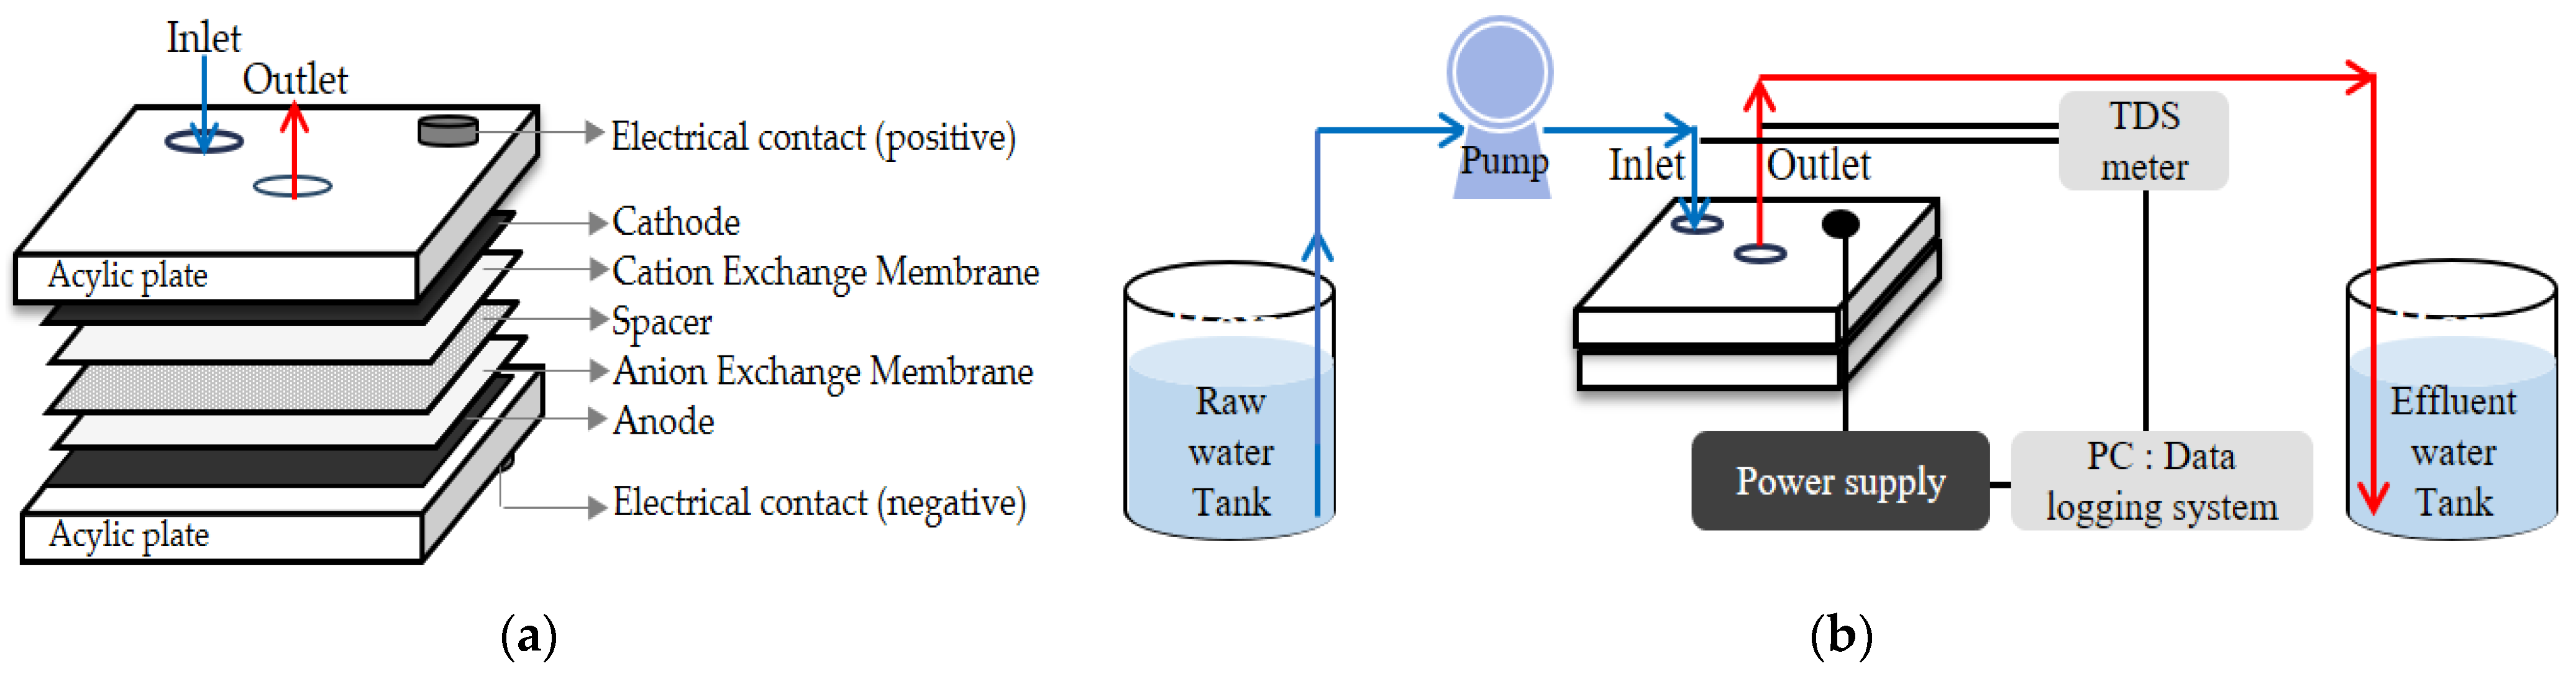
2.1.2. CDI Module
2.1.3. Experimental Setup
2.1.4. Feed Solution
2.2. Methods
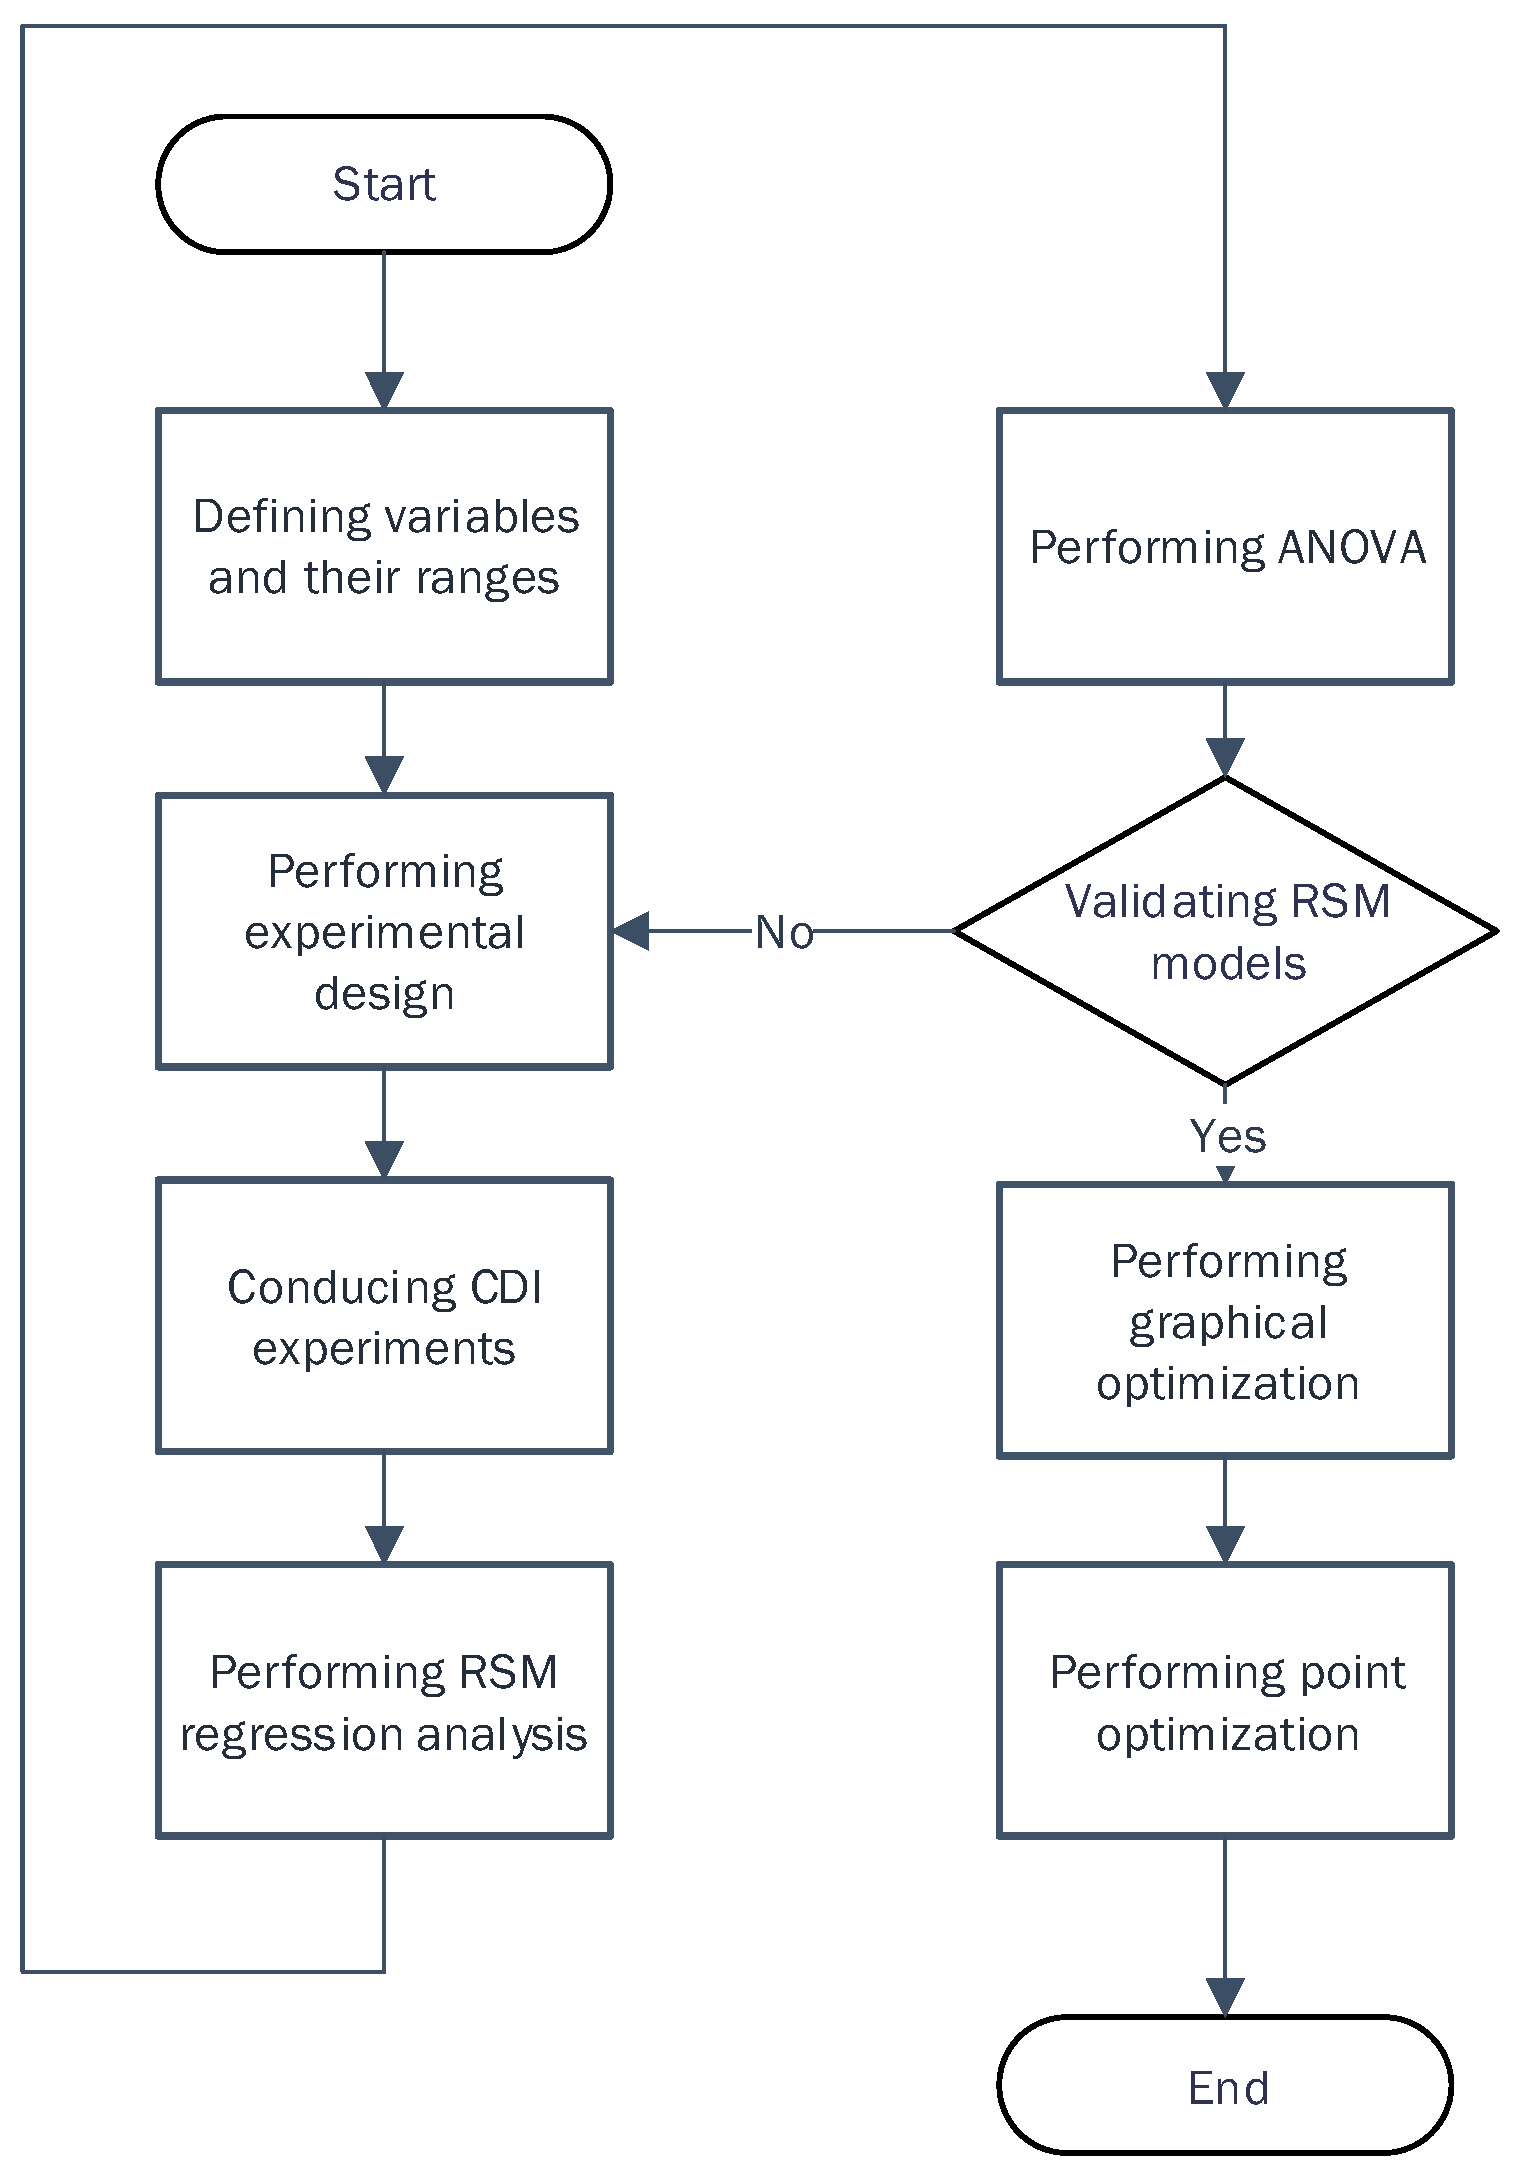
2.2.1. Application of RSM
2.2.2. Field Emission Scanning Electron Microscopy (FE-SEM) and Energy Dispersive X-ray Spectrometer (EDS) Analysis
2.2.3. X-ray Photoelectron Spectrometer (XPS) Analysis
2.2.4. Sample Analysis
3. Results and Discussion
3.1. Effects of Operating Variables
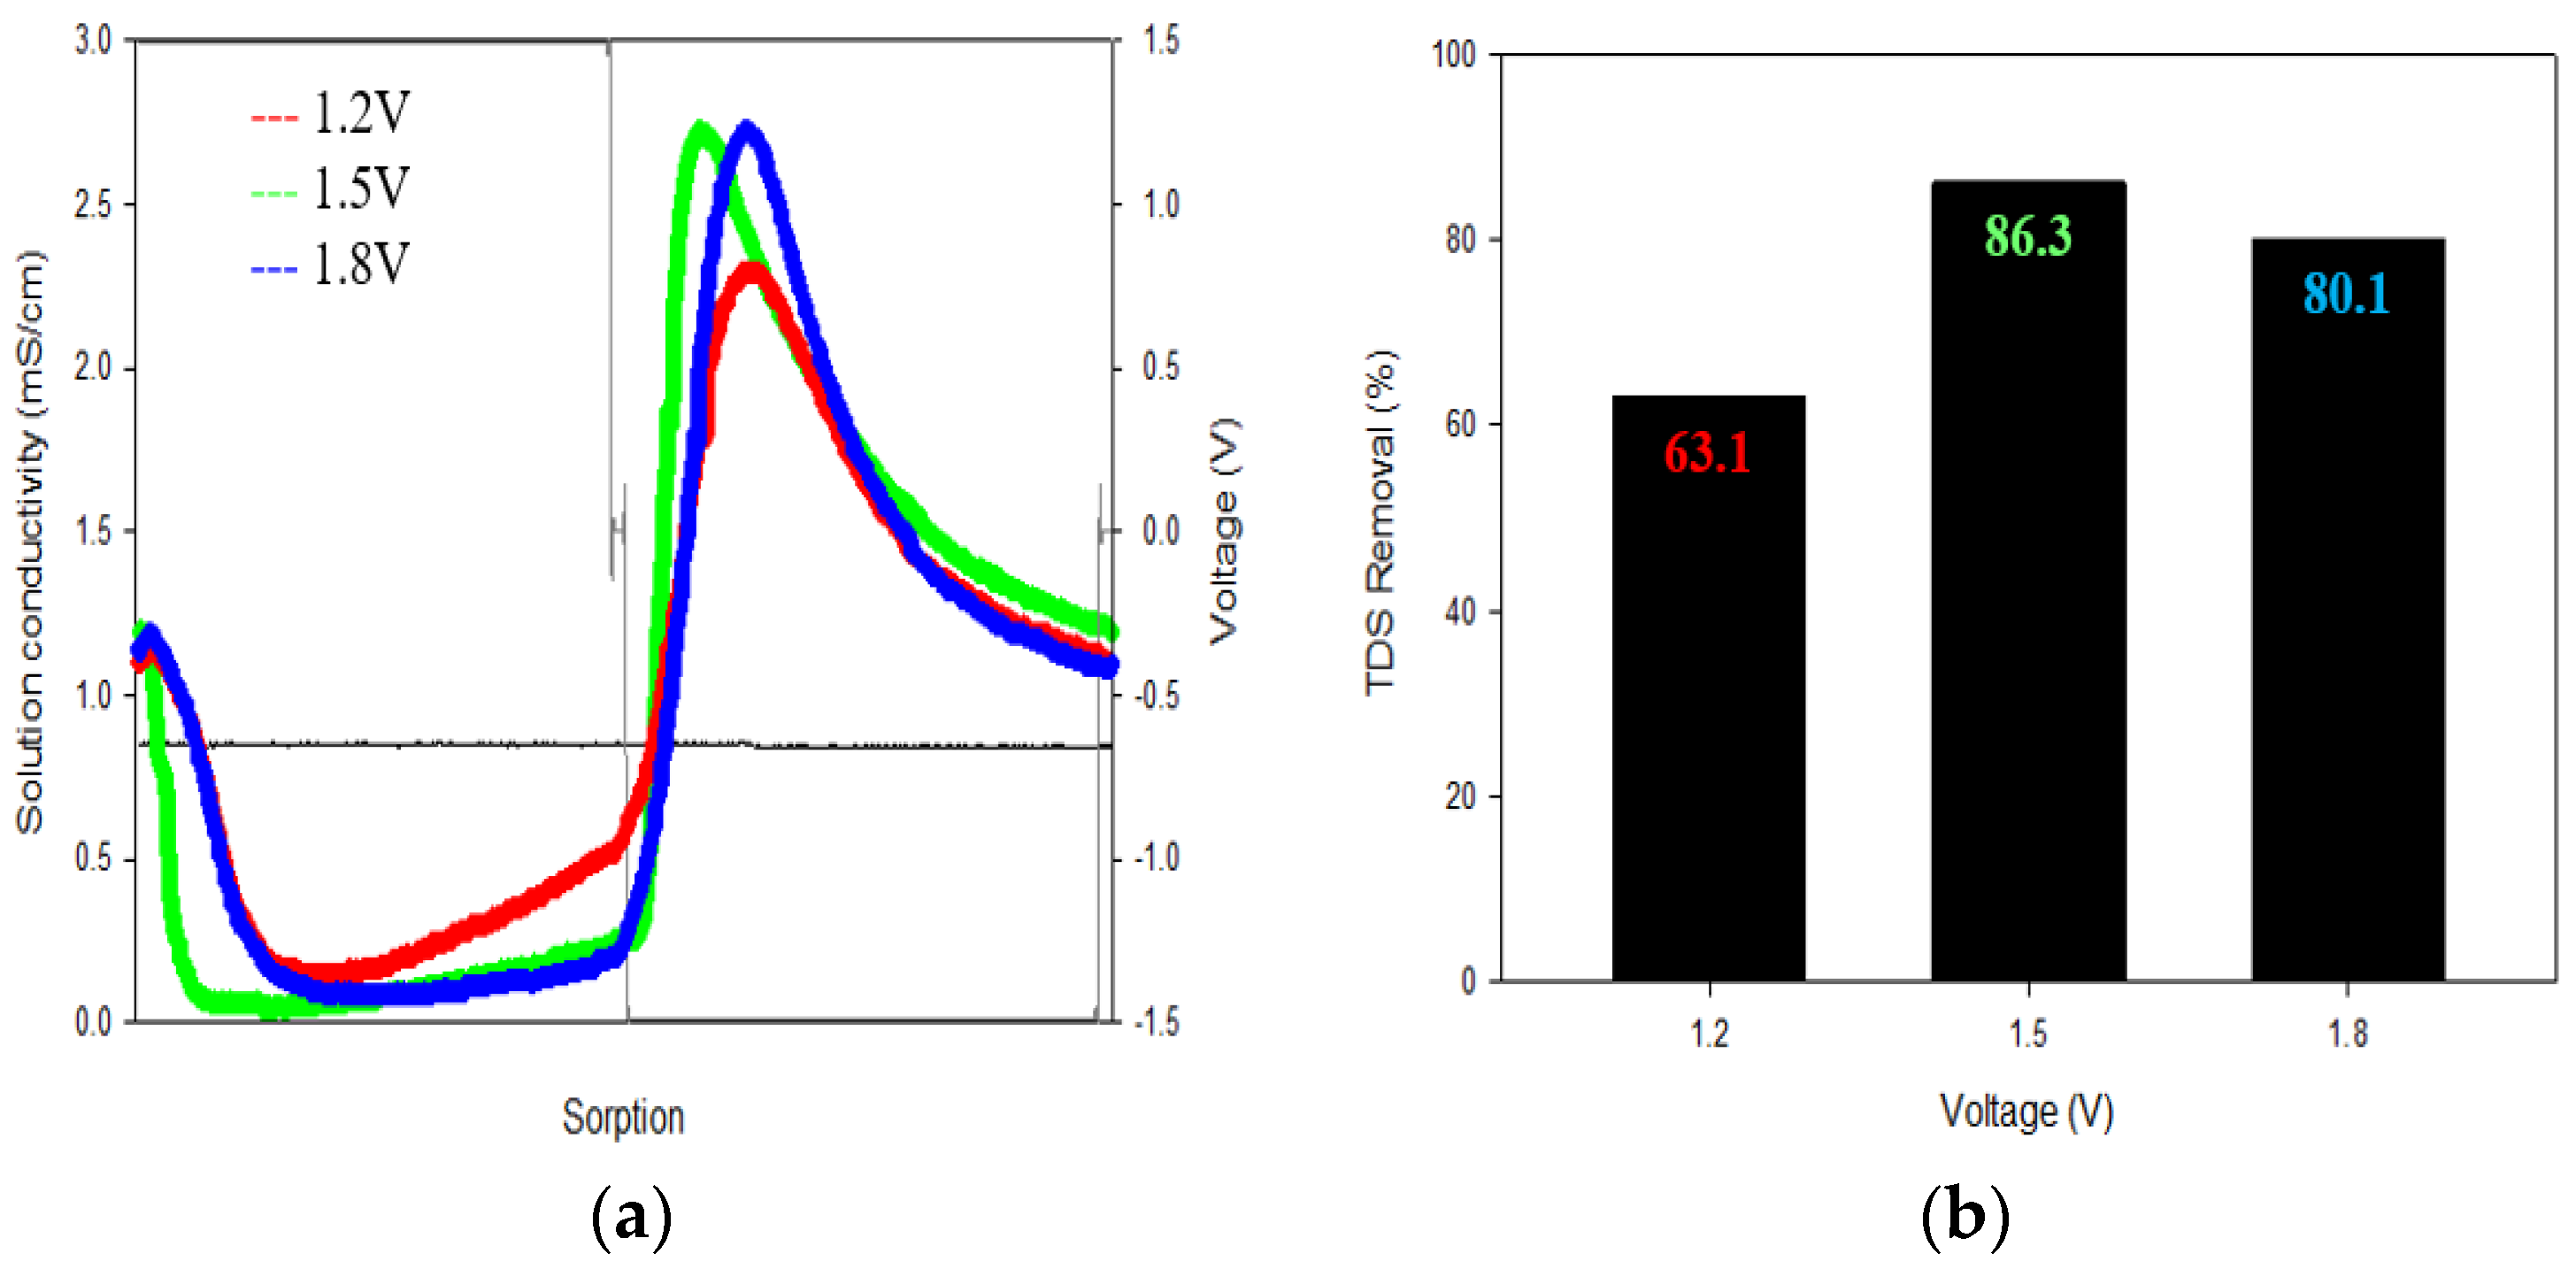
3.1.1. Voltage
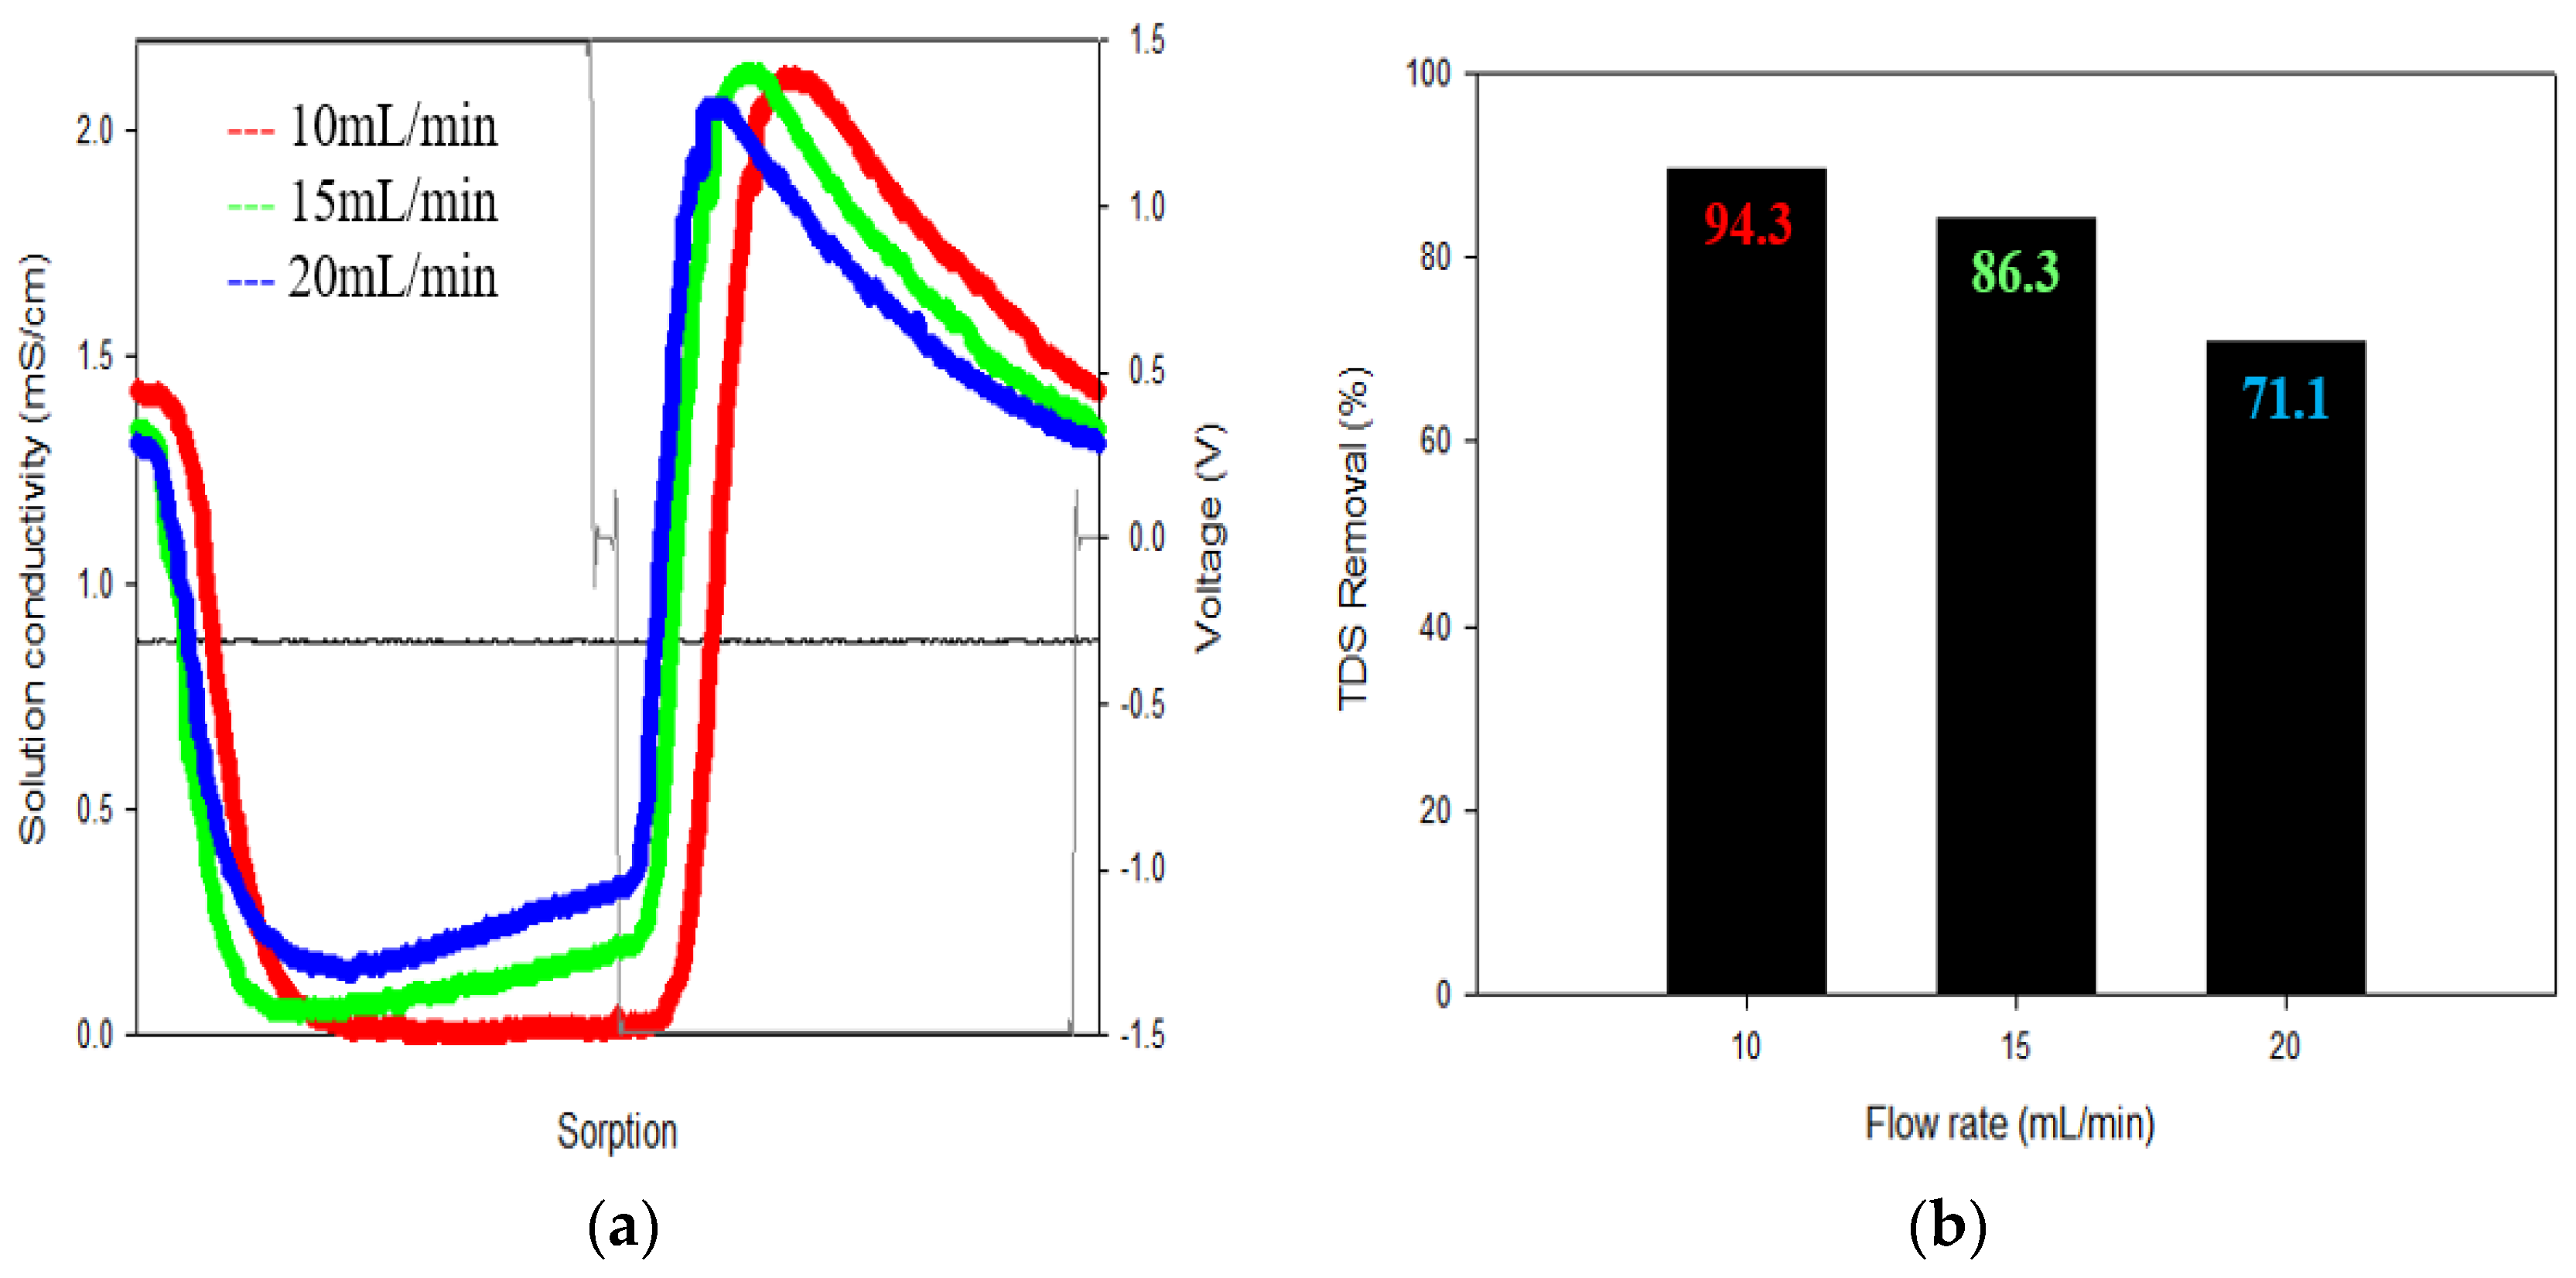
3.1.2. Flow Rate
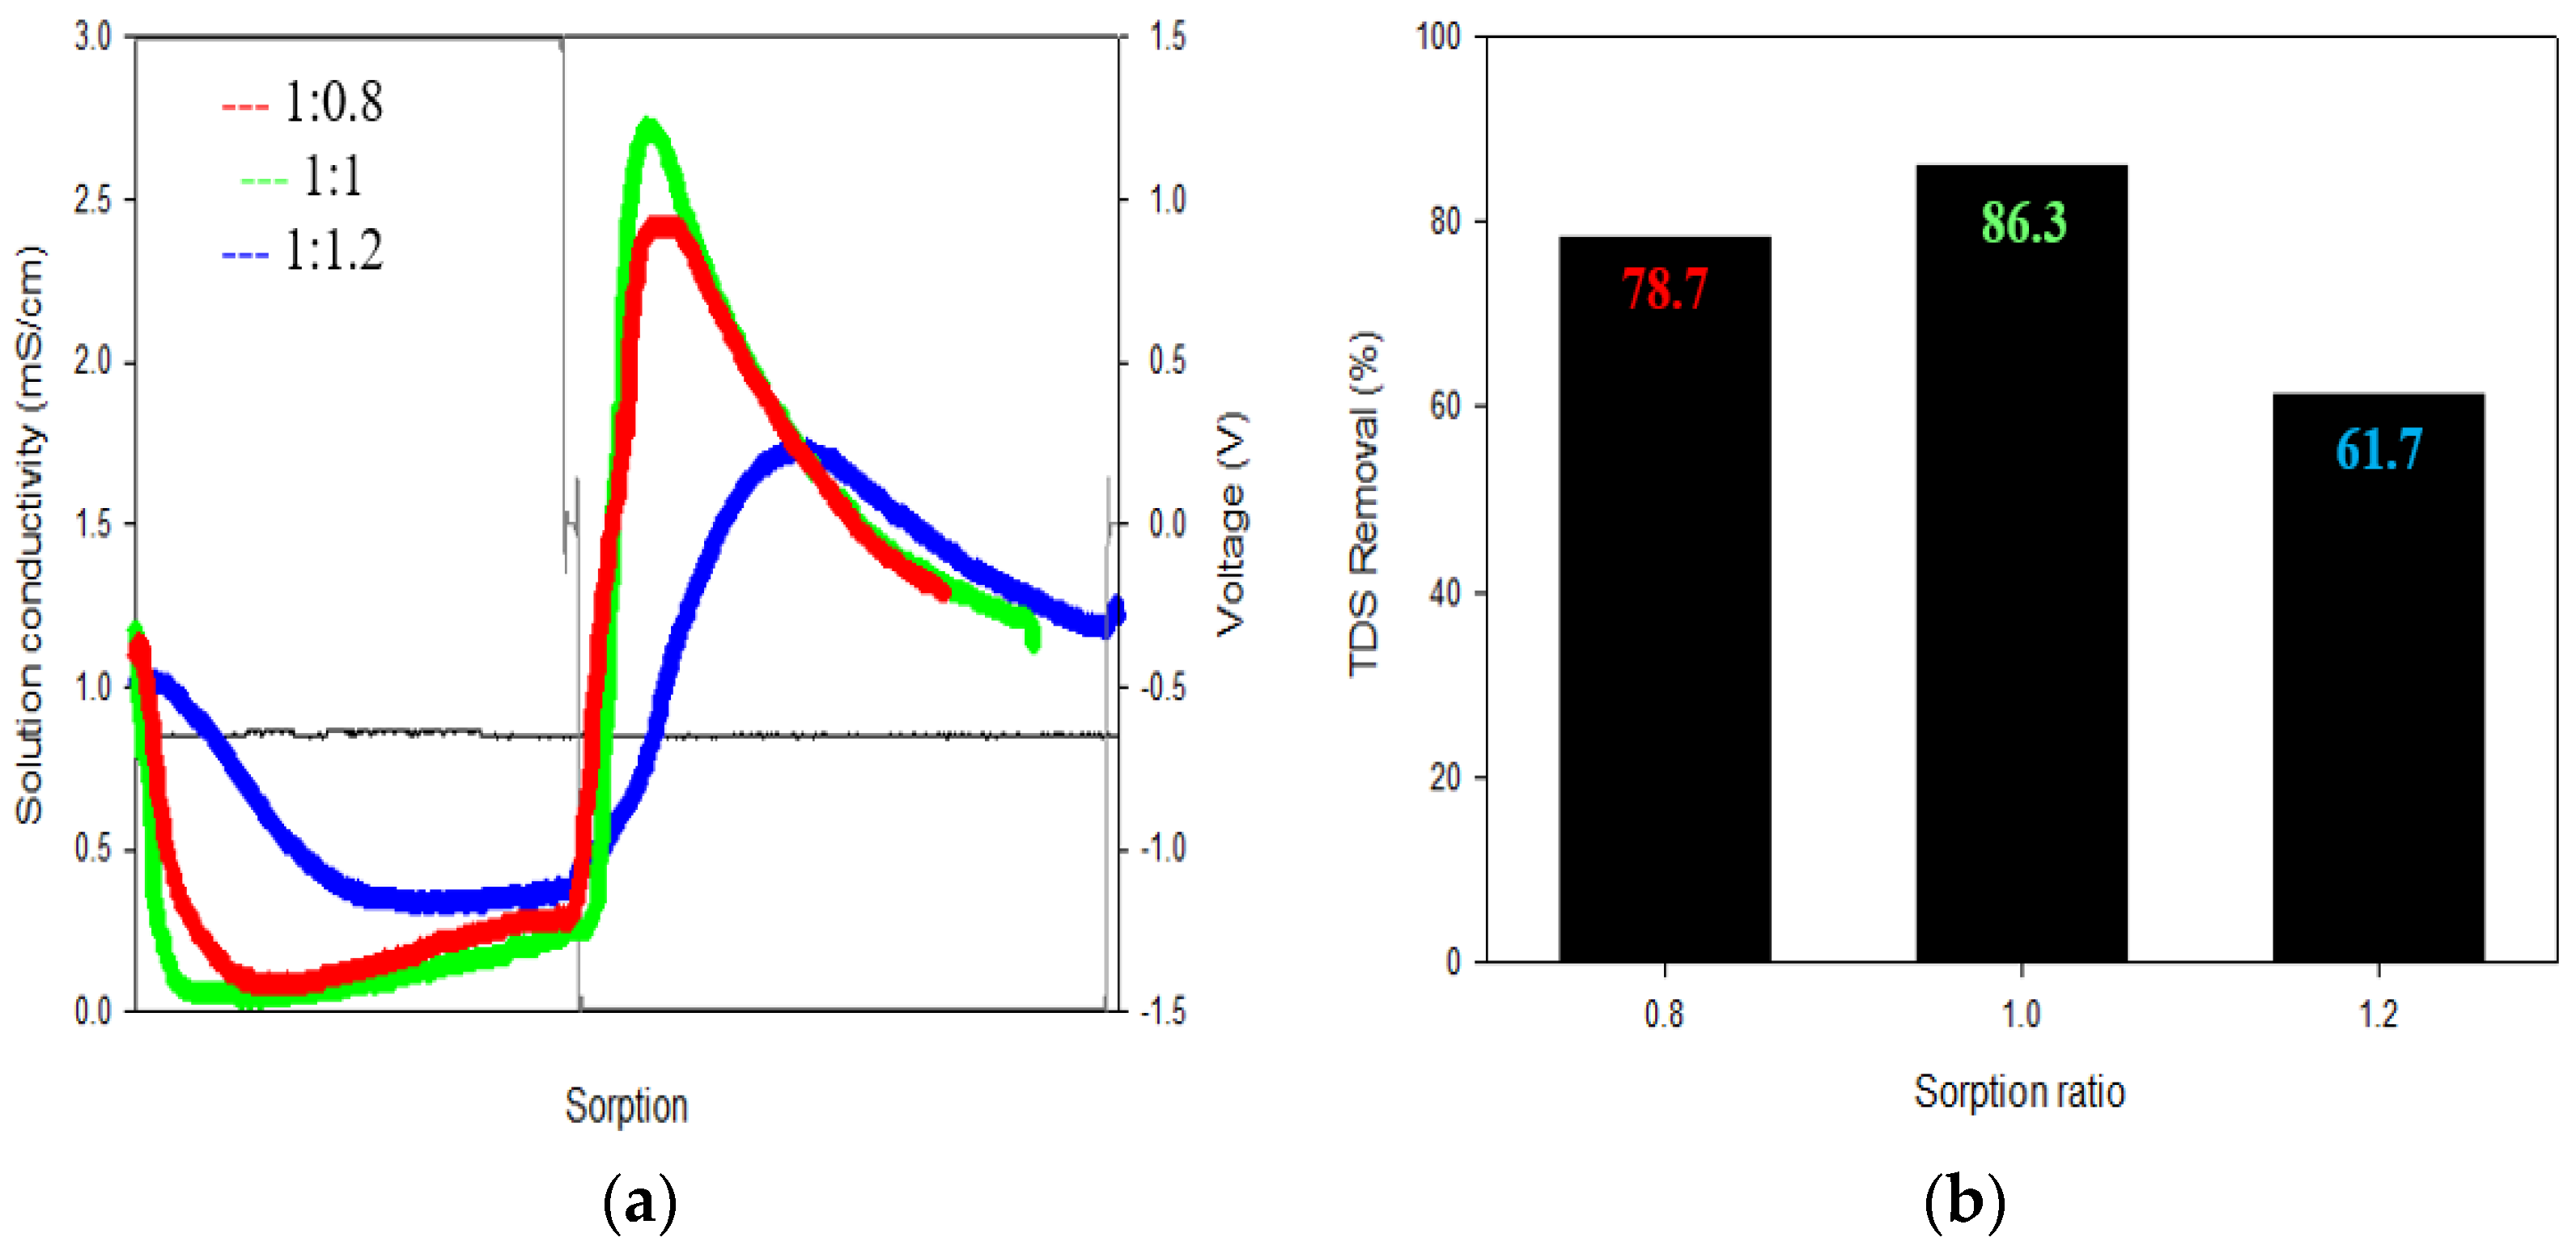
3.1.3. Ratio of Sorption Time
3.2. Optimization of Capacitive Deionization in CCP under RSM
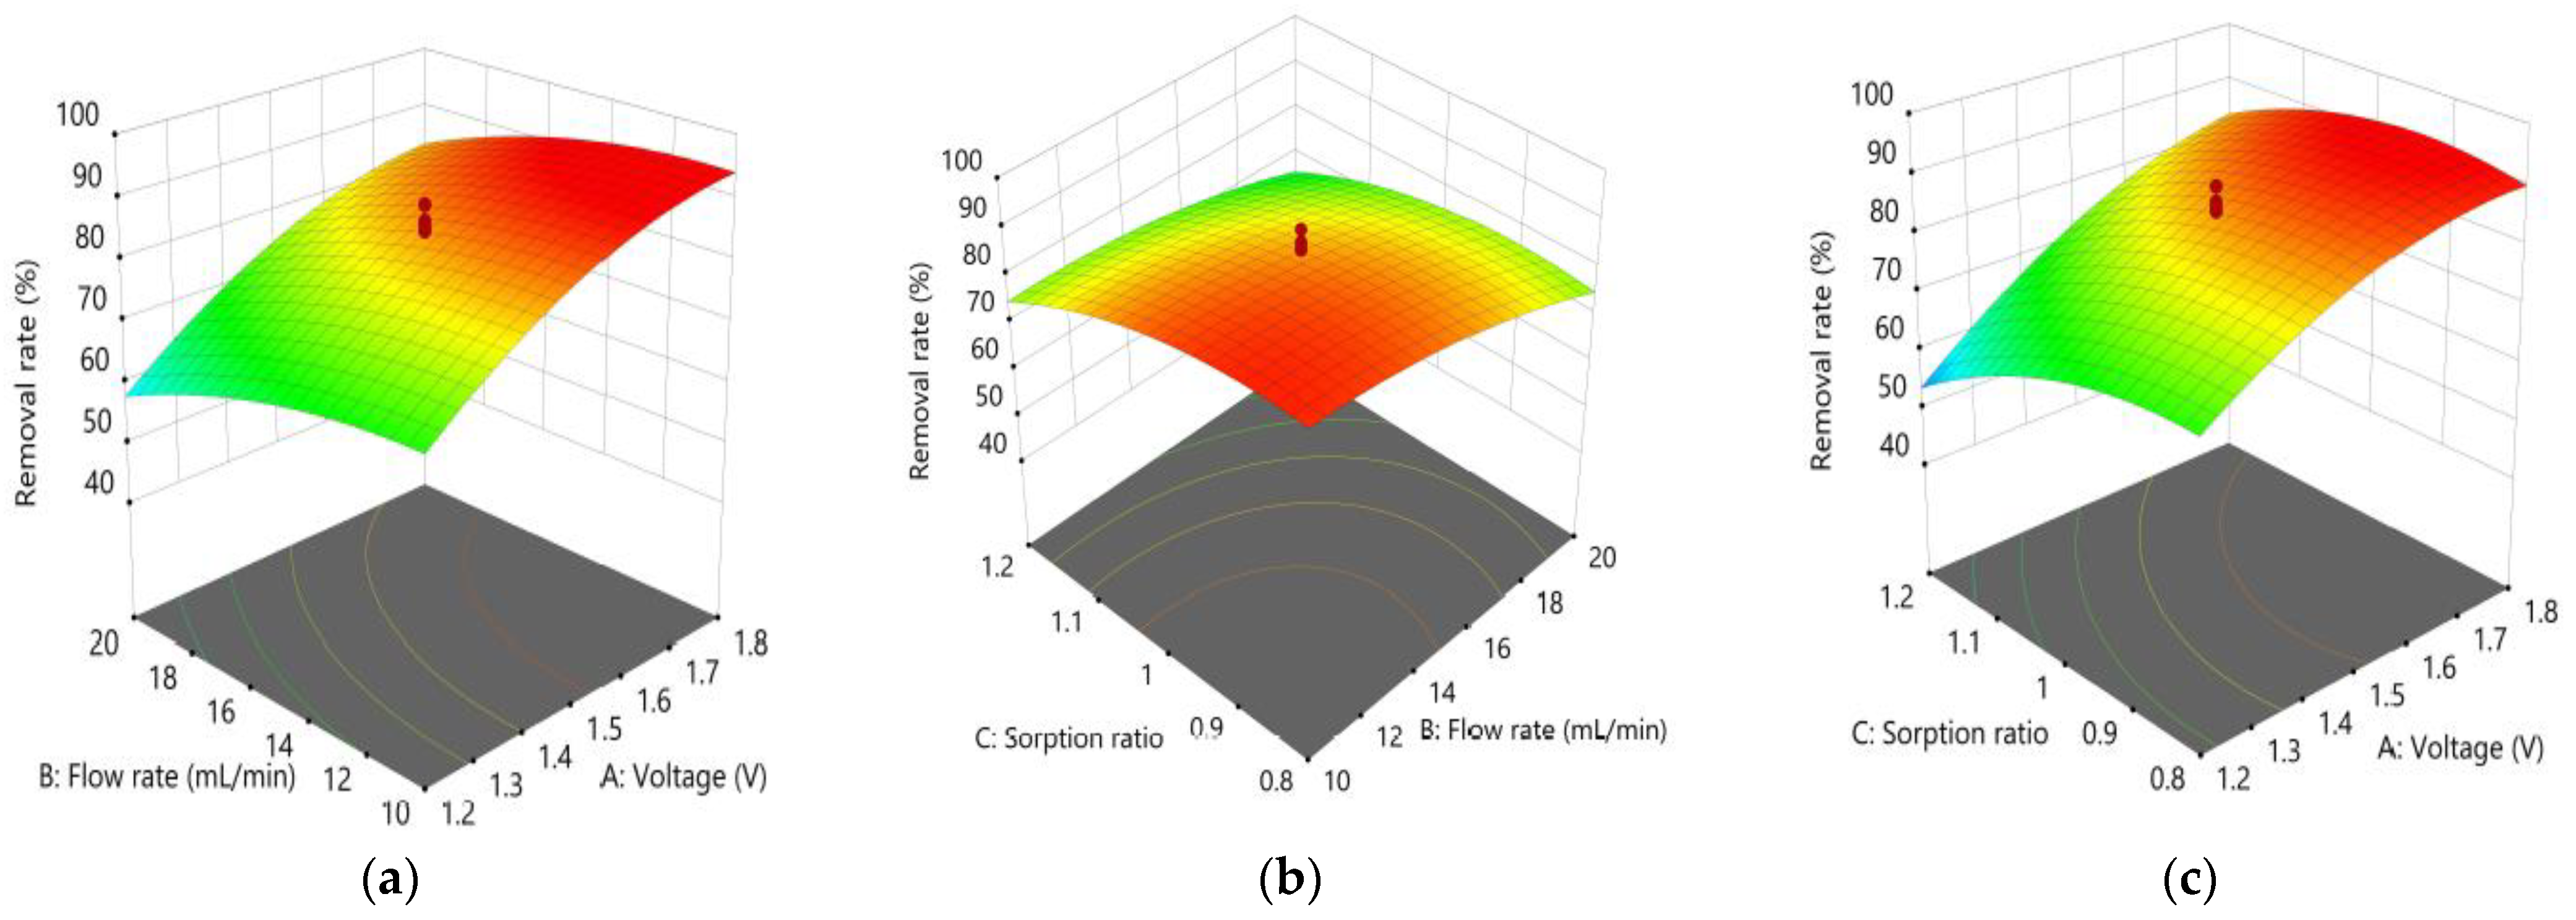
3.2.1. TDS Removal
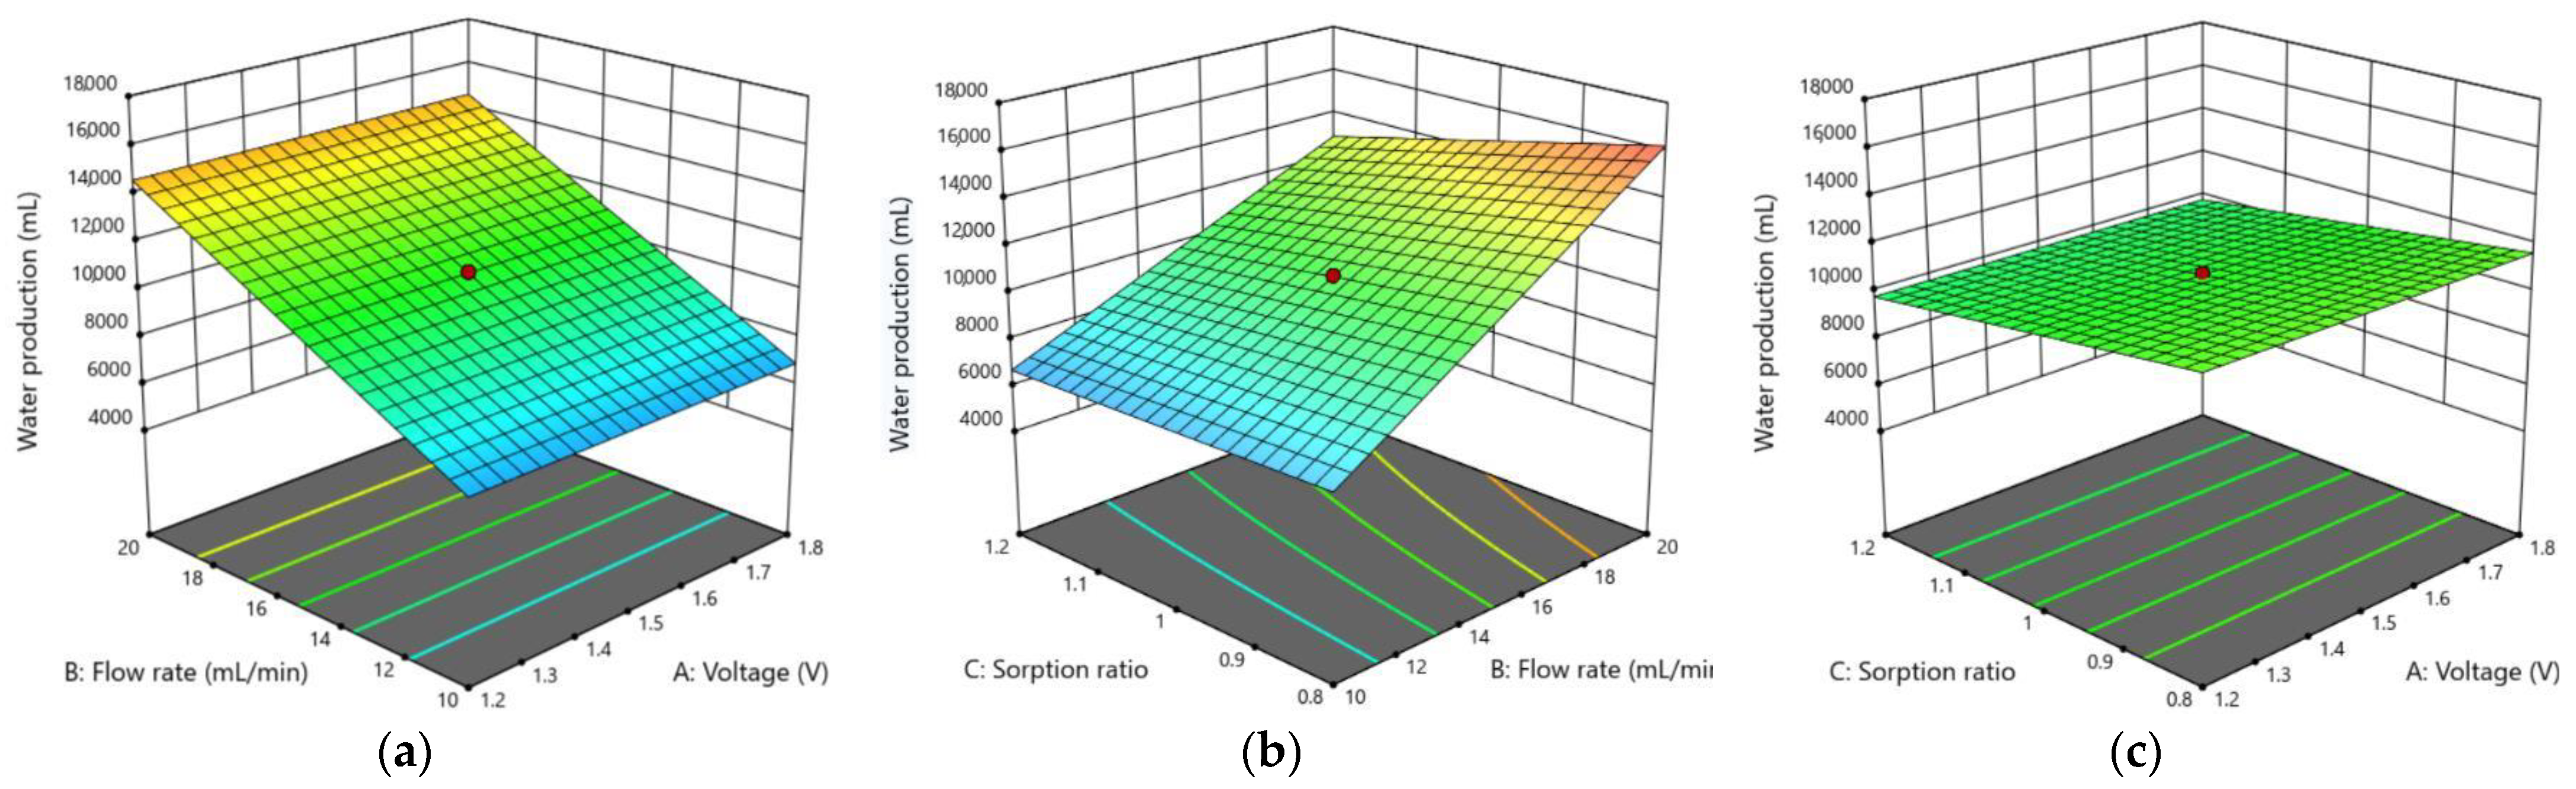
3.2.2. Water Production
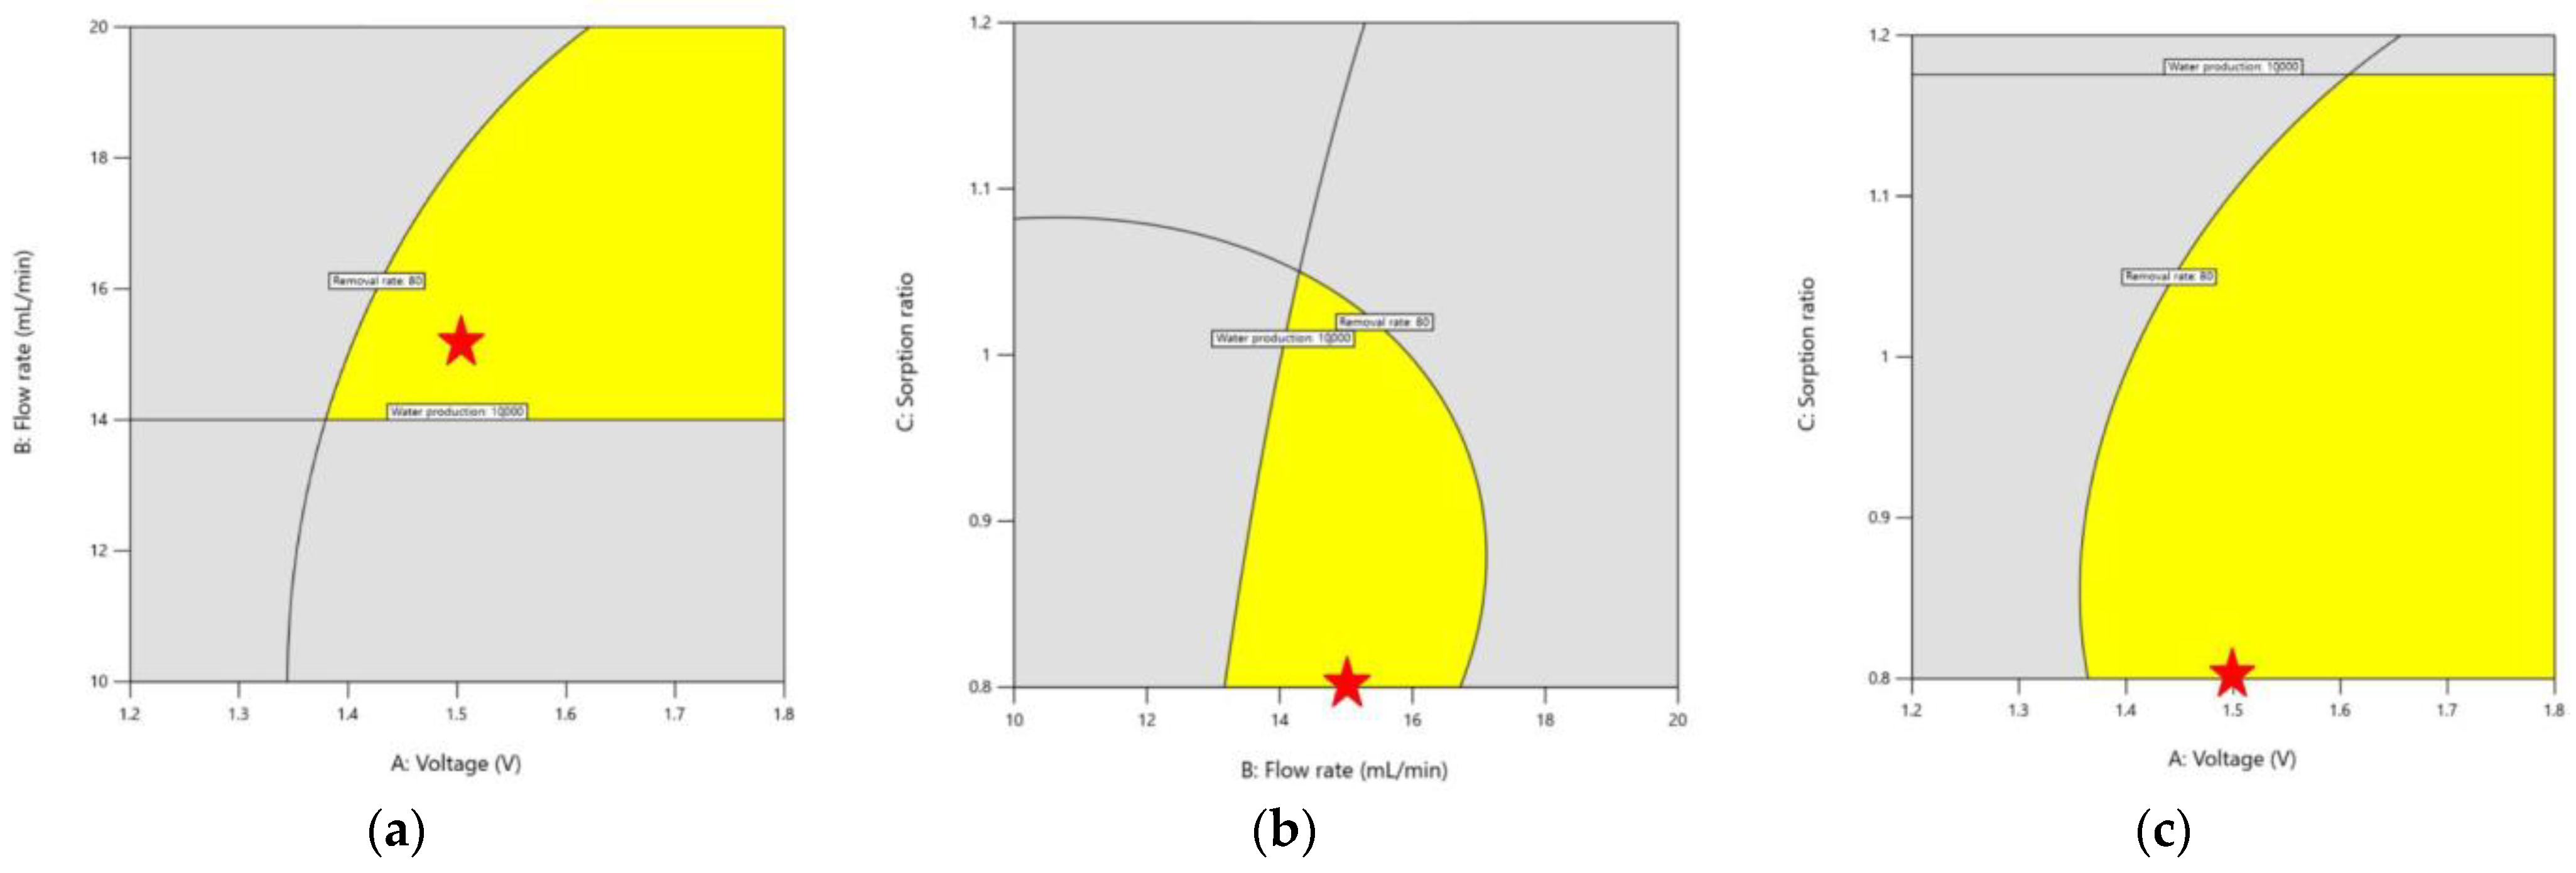
3.2.3. Graphical Optimization
3.2.4. Results of Product Water Quality Analysis
3.3. Long-Term Operation of CDI
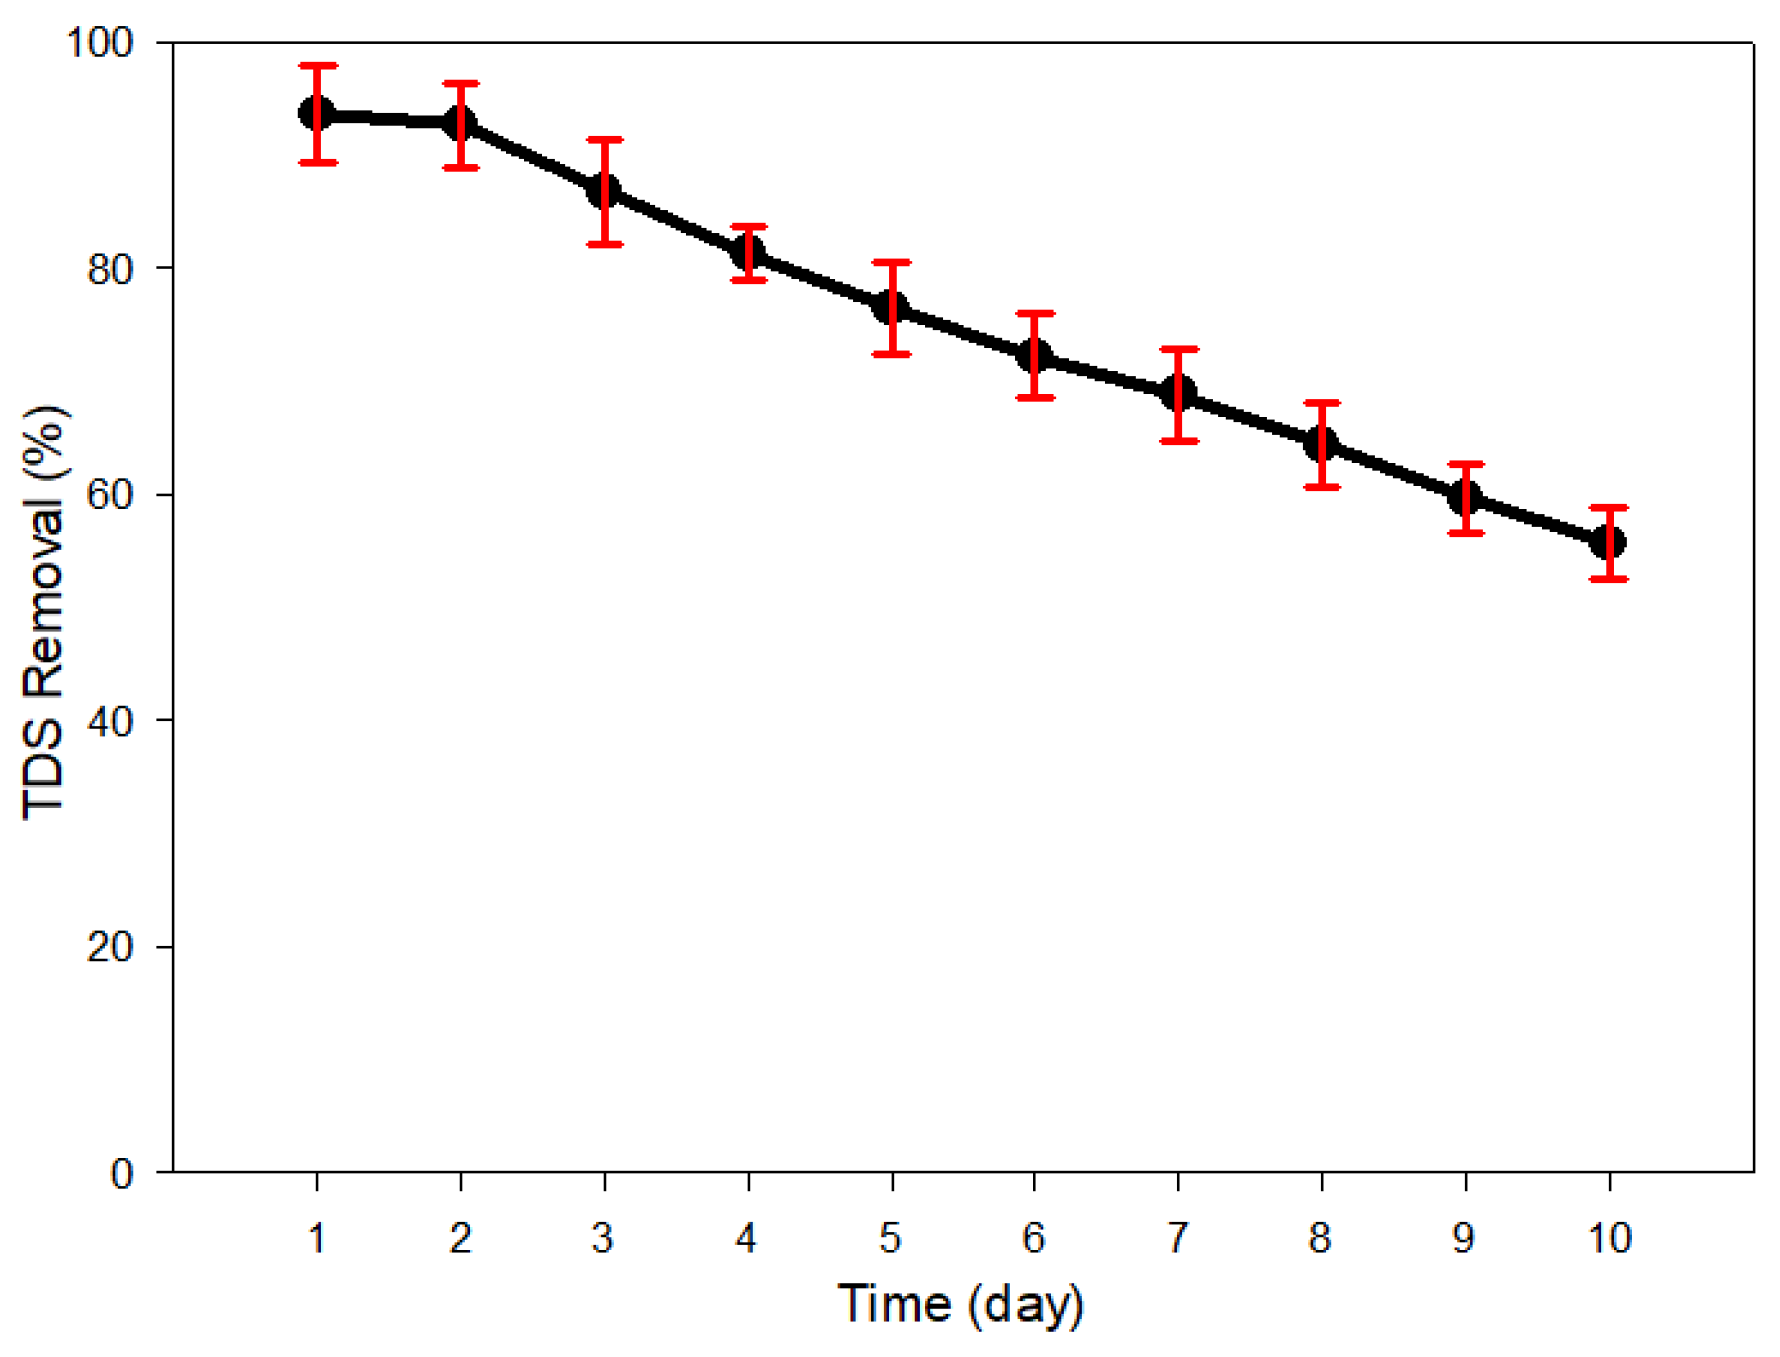
3.3.1. Reduction in TDS Removal and Energy Consumption
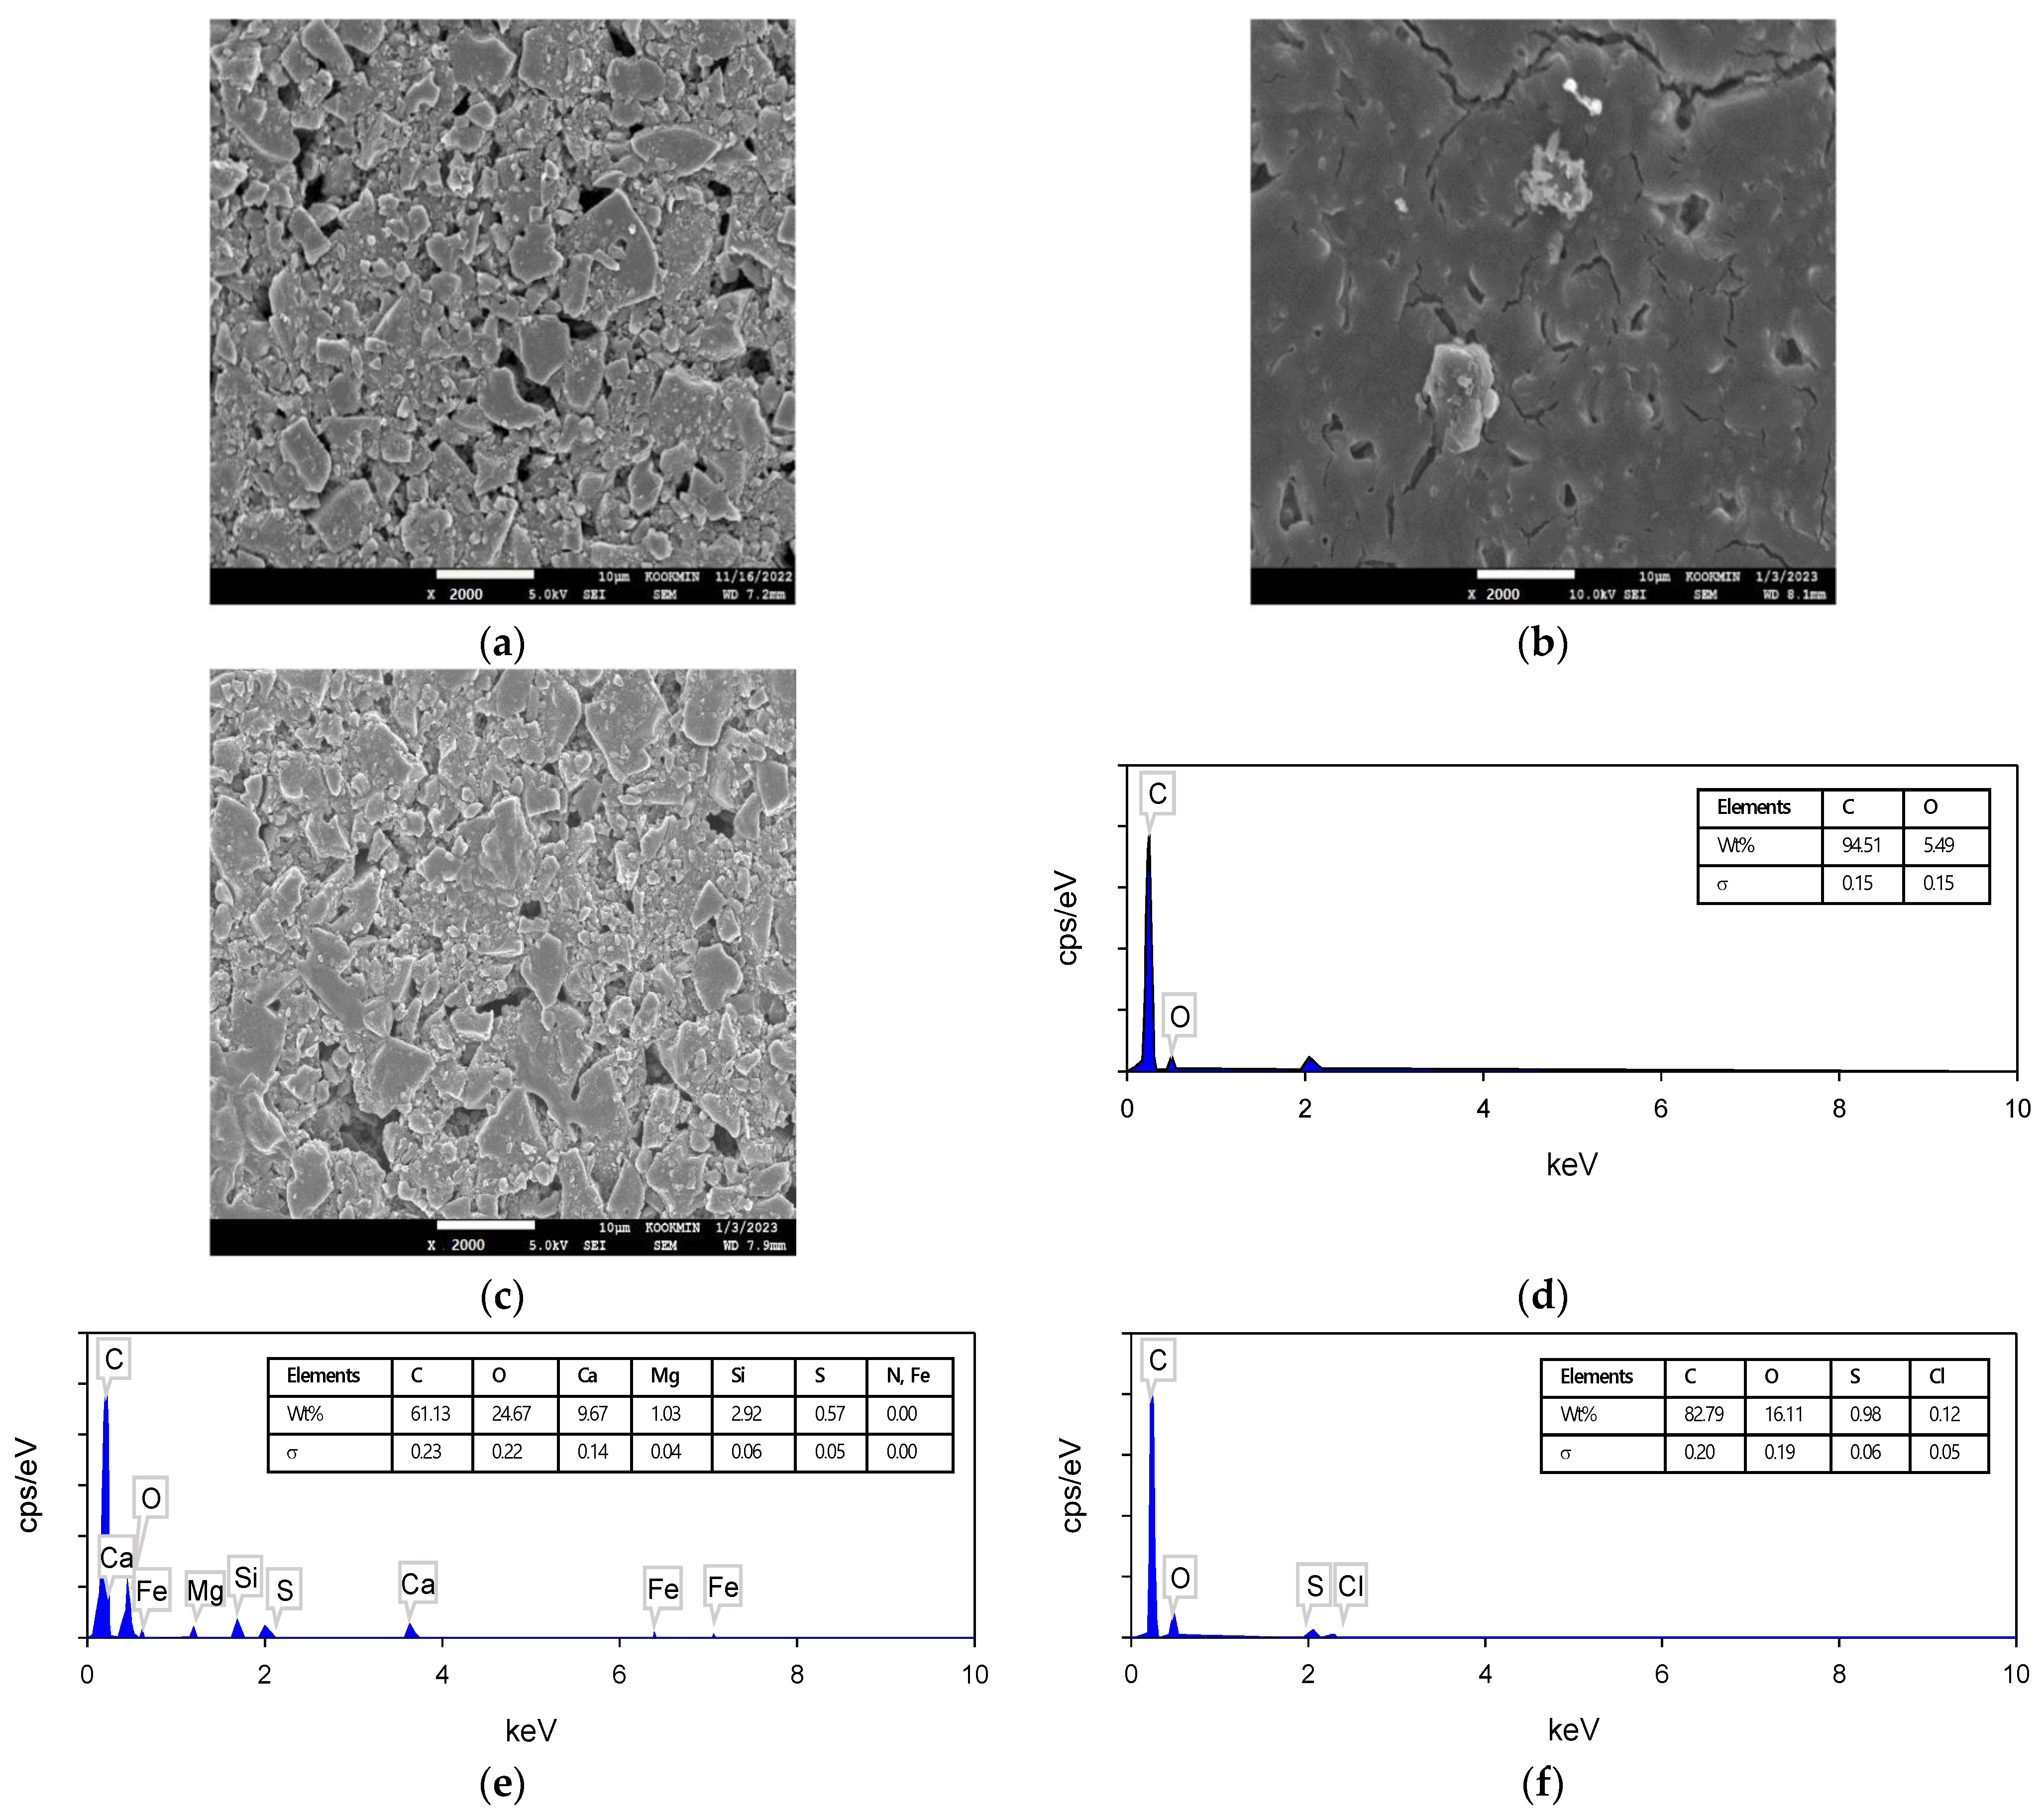
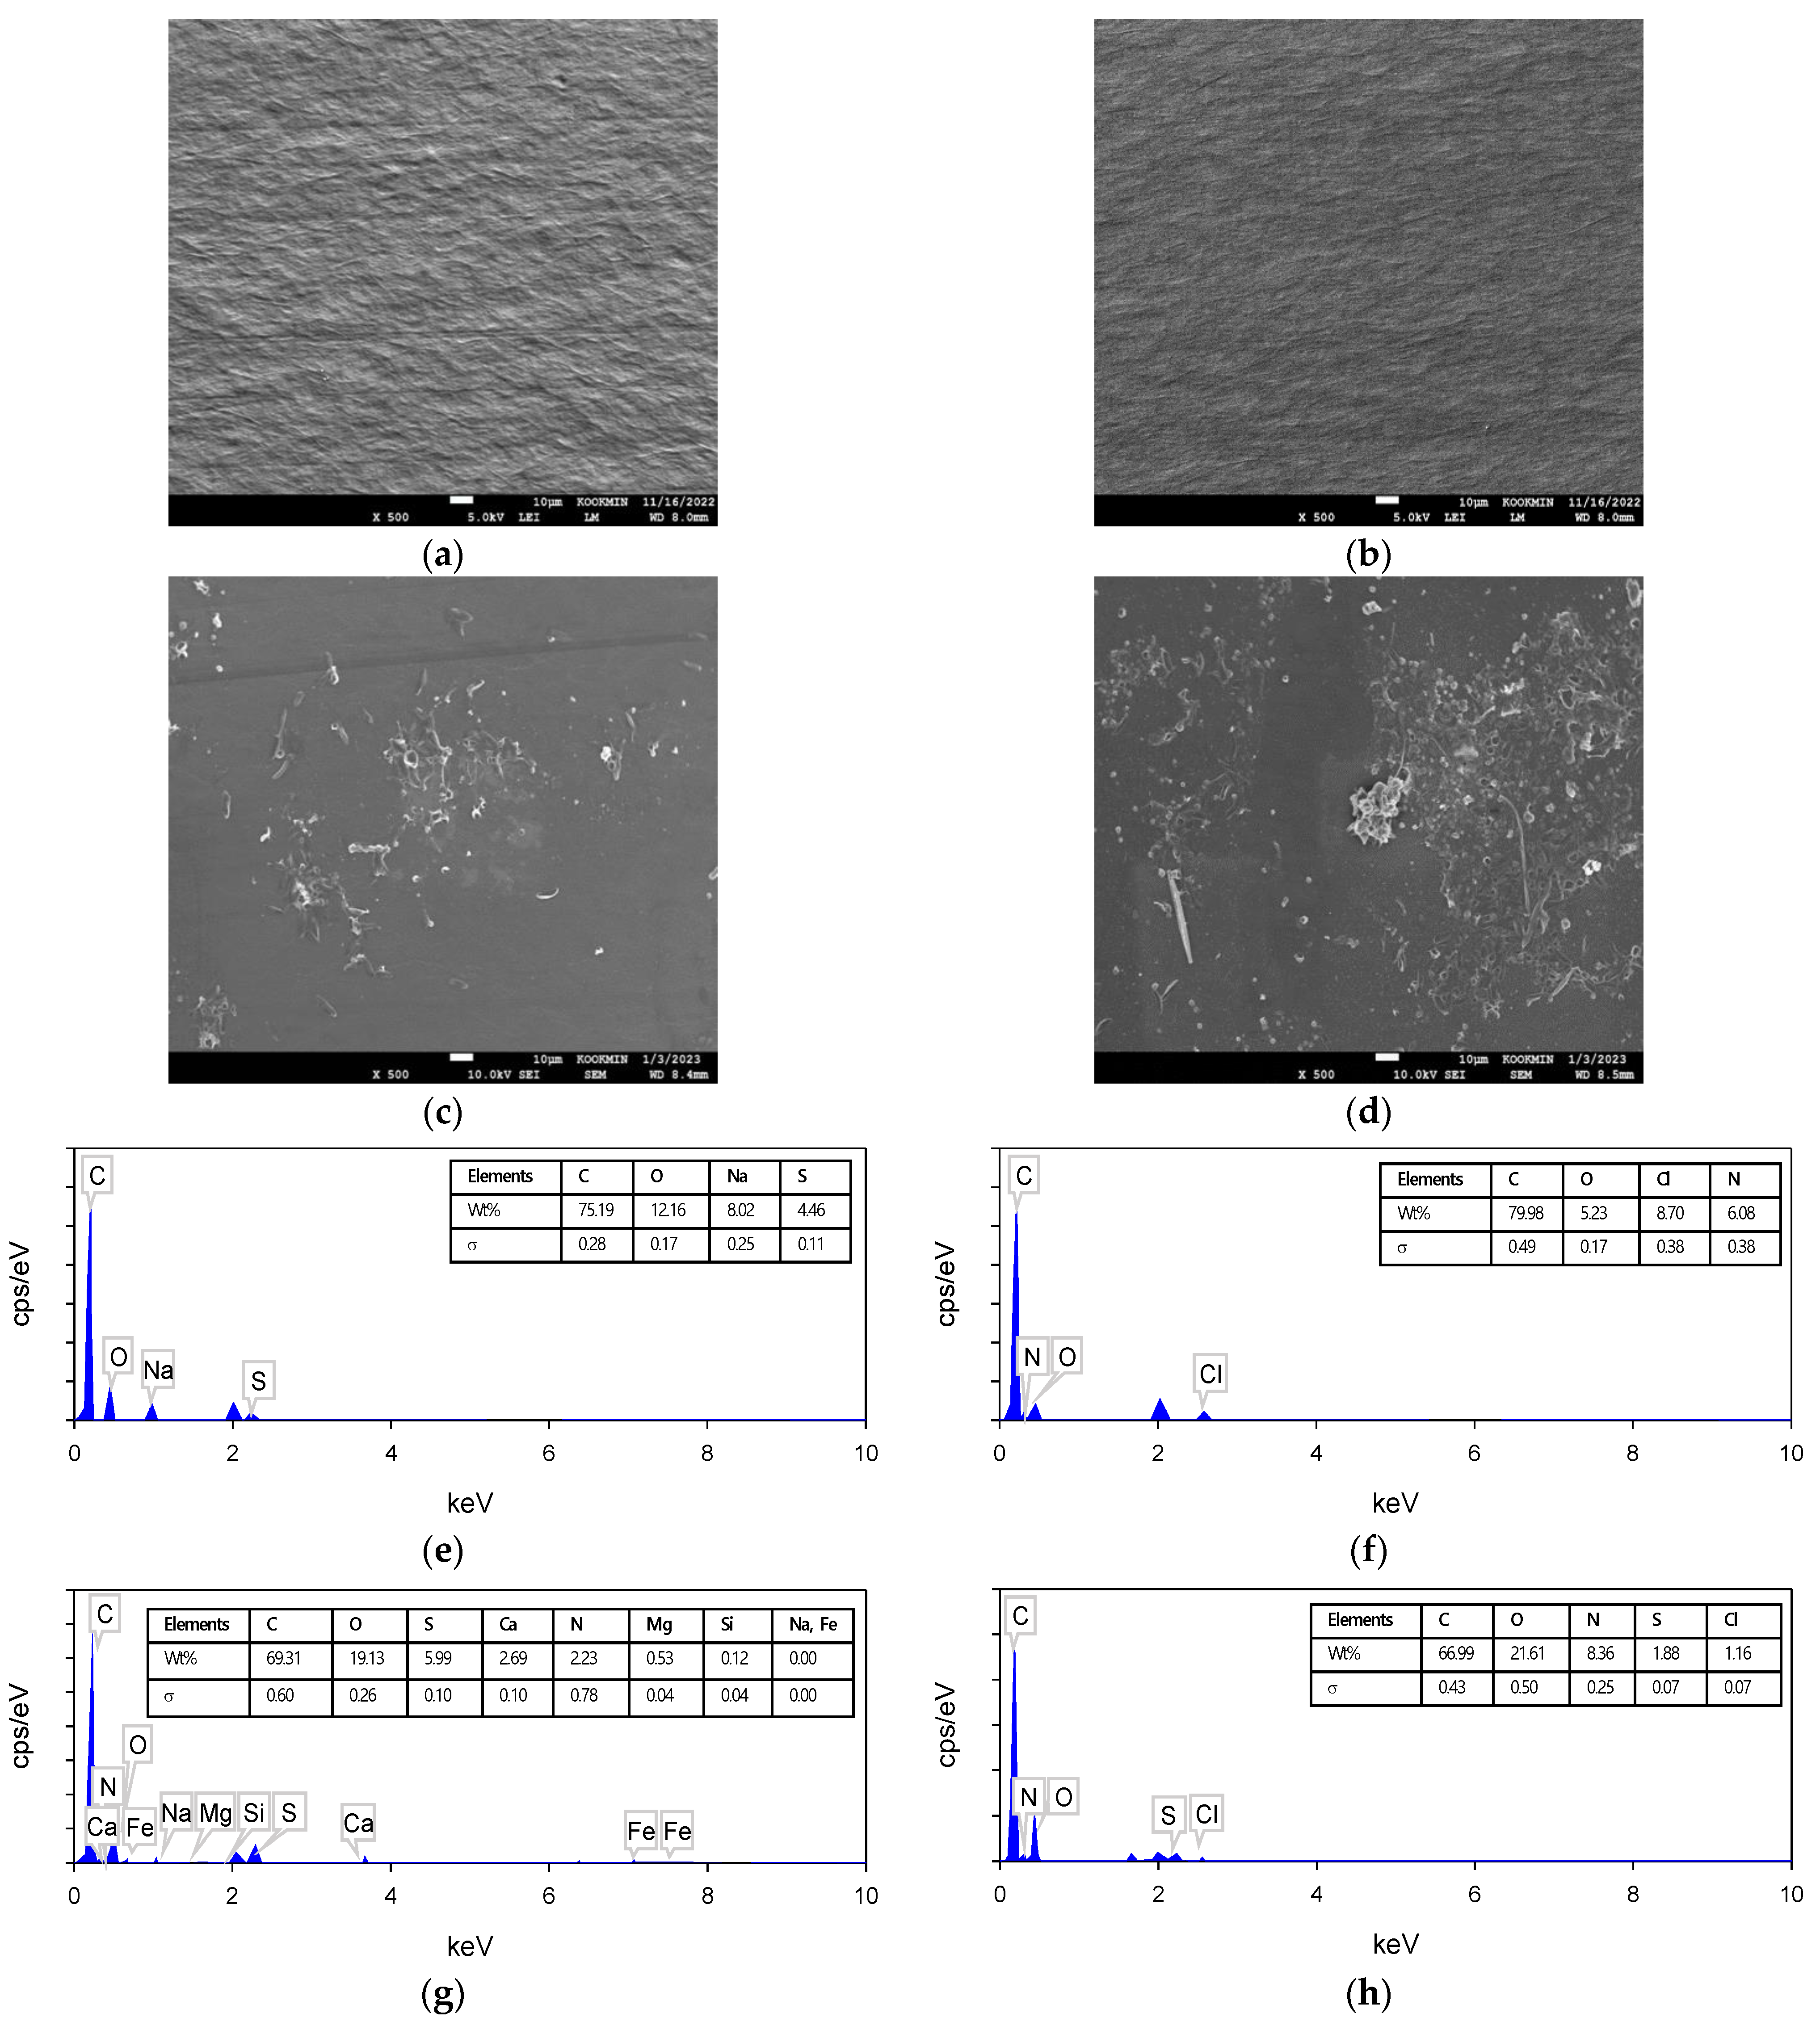
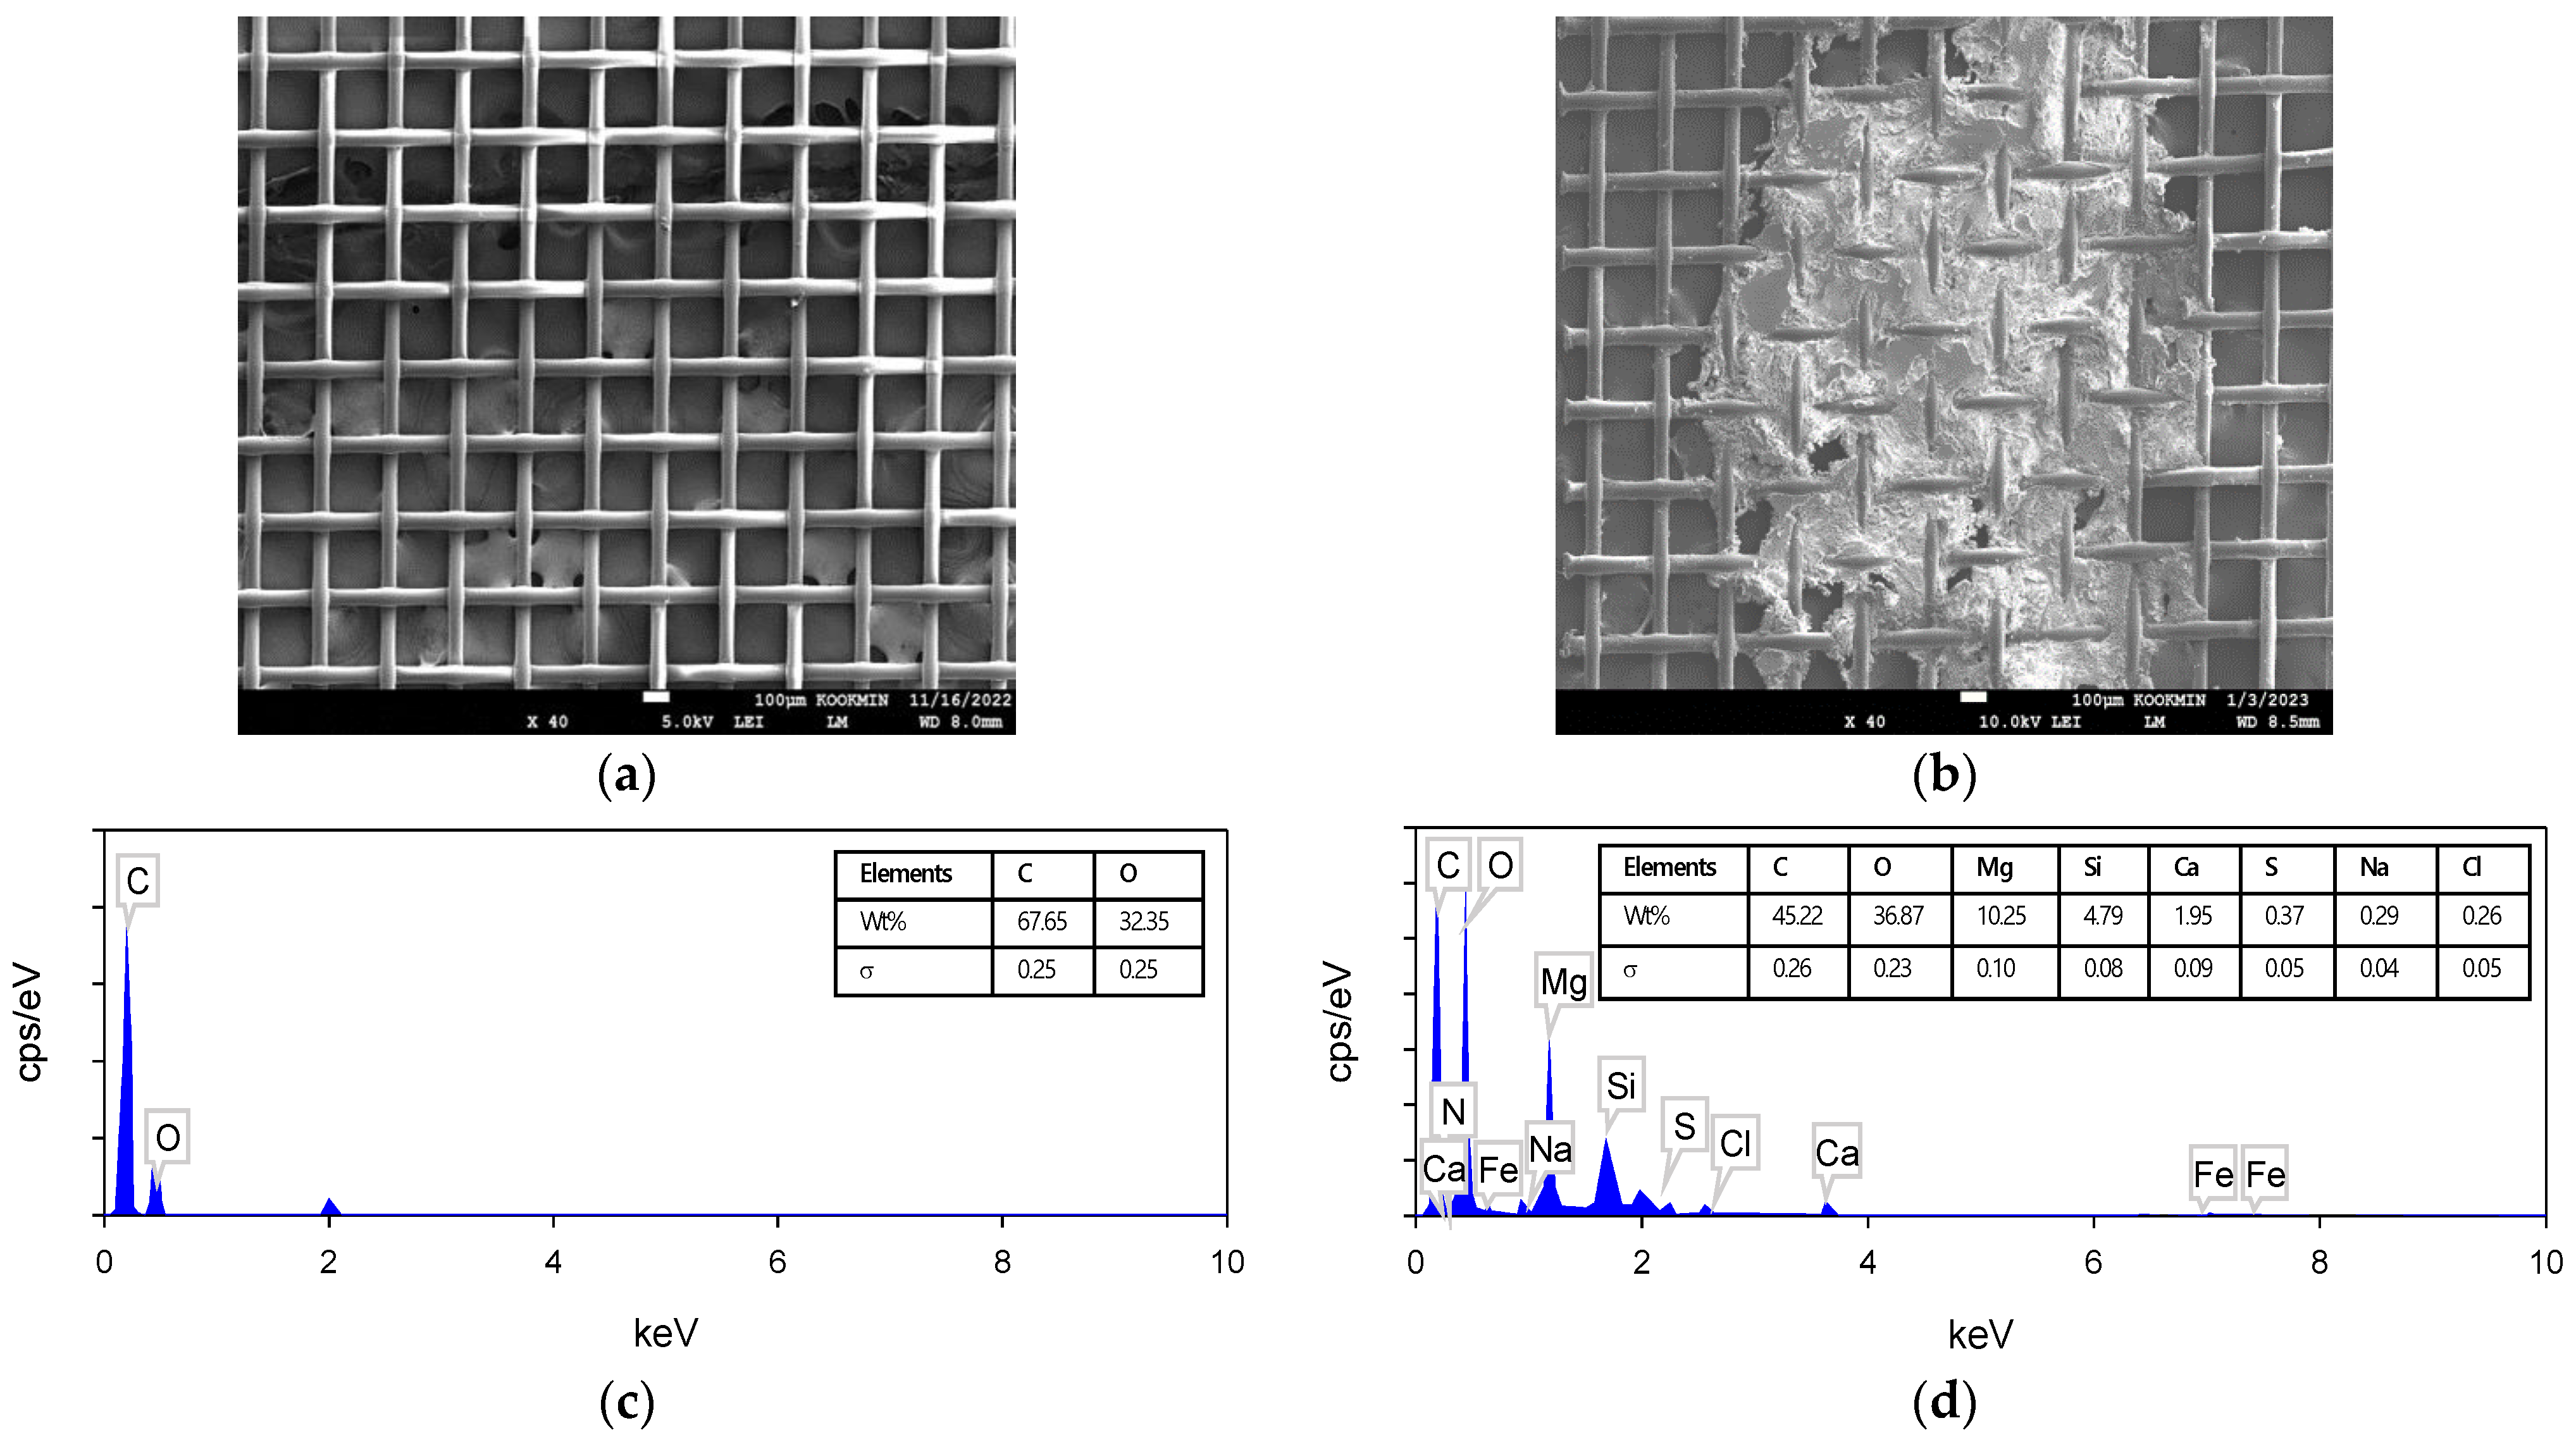
3.3.2. Results of SEM–EDS Analysis
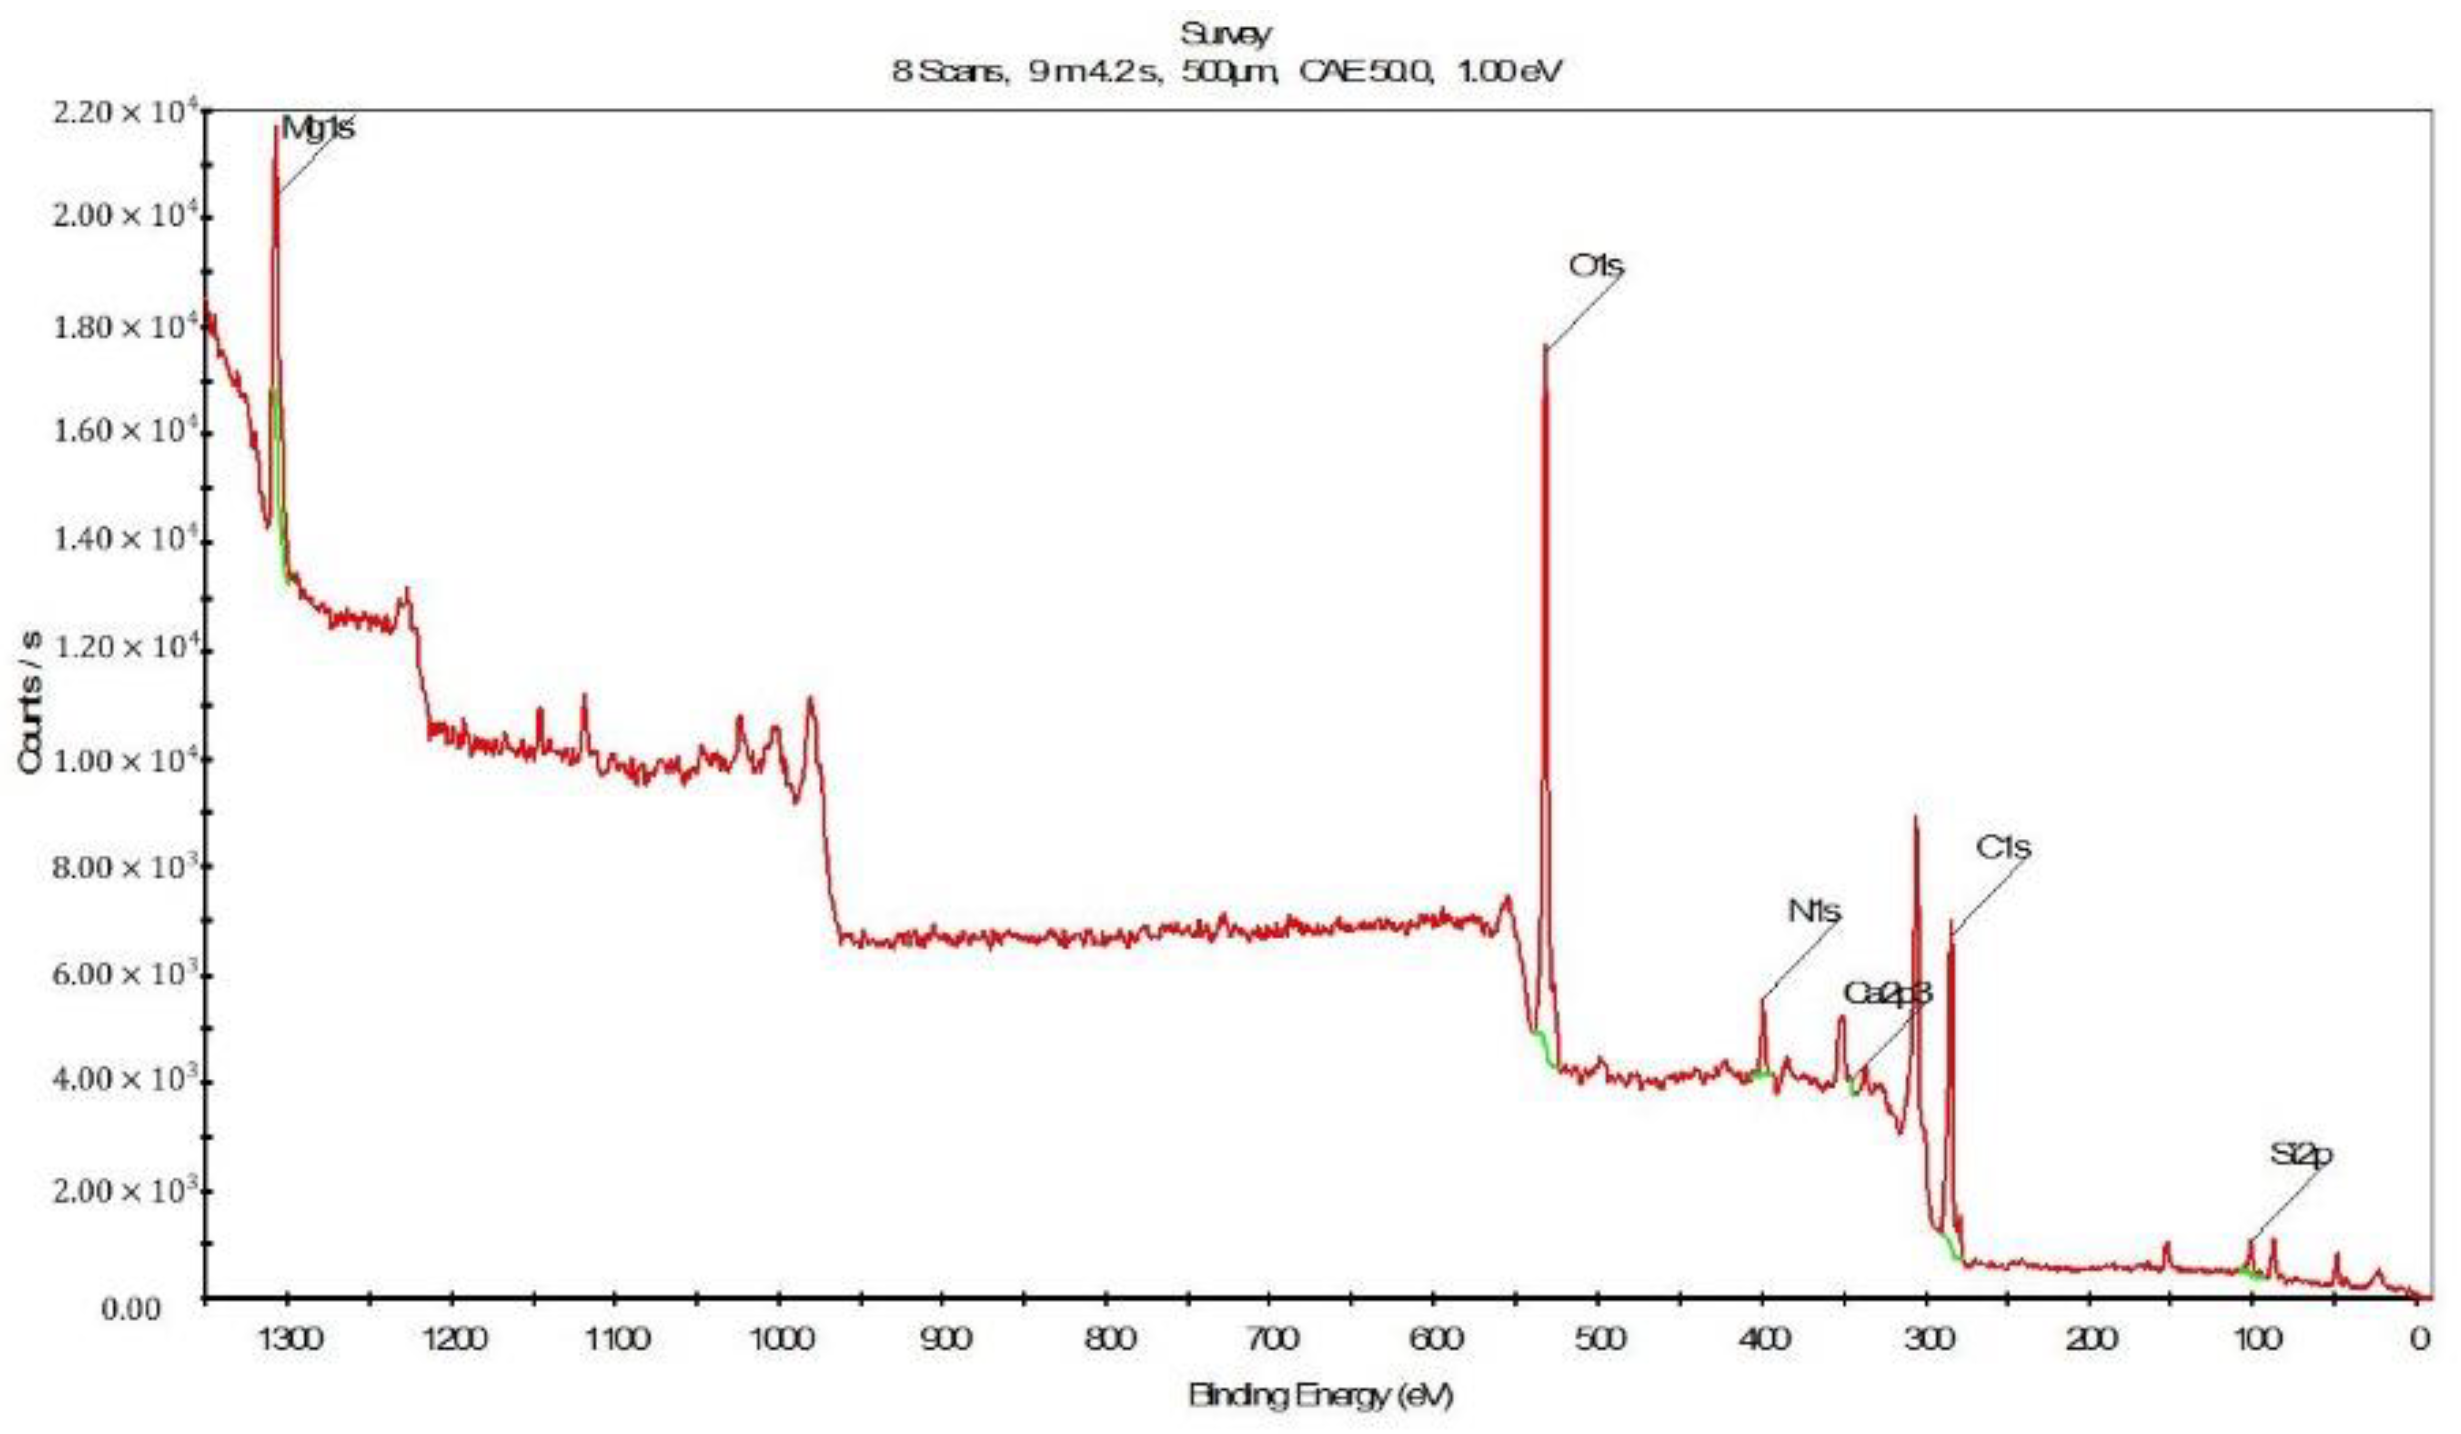
3.3.3. Results of XPS Analysis
3.4. Cleaning
4. Conclusions
Author Contributions
Funding
Institutional Review Board Statement
Informed Consent Statement
Data Availability Statement
Conflicts of Interest
References
- Pakzadeh, B. Wastewater Reuse in Combined Cycle Power Plants. February 2018. Available online: https://midwestawma.org/wp-content/uploads/2018/02/2018Conference/2018Day2/WastewaterReuseCCPlants.pdf (accessed on 30 April 2020).
- Polyzakis, A.; Koroneos, C.; Xydis, G. Optimum gas turbine cycle for combined cycle power plant. Energy Convers. Manag. 2008, 49, 551–563. [Google Scholar] [CrossRef]
- Poullikkas, A. An overview of current and future sustainable gas turbine technologies. Renew. Sustain. Energy Rev. 2005, 9, 409–443. [Google Scholar] [CrossRef]
- Wang, J.; Qu, D.; Tie, M.; Ren, H.; Peng, X.; Luan, Z. Effect of Coagulation Pretreatment on Membrane Distillation Process for Desalination of Recirculating Cooling Water. Sep. Purif. Technol. 2008, 64, 108–115. [Google Scholar] [CrossRef]
- Koeman-Stein, N.E.; Creusen, R.; Zijlstra, M.; Groot, C.; Broek, W.B. Membrane distillation of industrial cooling tower blowdown water. Water Resour. Ind. 2016, 14, 11–17. [Google Scholar] [CrossRef] [Green Version]
- Altman, S.J.; Jensen, R.; Cappelle, M.; Sanchez, A.; Everett, R.; Anderson, H.L.; McGrath, L. Membrane treatment of side-stream cooling tower water for reduction of water usage. Desalination 2012, 285, 177–183. [Google Scholar] [CrossRef]
- Han, X.; Zhang, D.; Yan, J.; Zhao, S.; Liu, J. Process development of flue gas desulphurization wastewater treatment in coal-fired power plants towards zero liquid discharge: Energetic, economic and environmental analyses. J. Clean. Prod. 2020, 261, 121144. [Google Scholar] [CrossRef]
- Clark, K. Wastewater Treatment Issues for Combined Cycly Plants. Power Engineering. 14 April 2014. Available online: https://www.power-eng.com/emissions/policy-regulations/wastewater-treatment-issues-for-combined-cycle-plants/#gref (accessed on 30 April 2020).
- Tong, T.; Elimelech, M. The global rise of zero liquid discharge for wastewater management: Drivers, technologies, and future directions. Environ. Sci. Technol. 2016, 50, 6846–6855. [Google Scholar] [CrossRef]
- Panagopoulos, A.; Haralambous, K.-J. Minimal Liquid Discharge (MLD) and Zero Liquid Discharge (ZLD) strategies for wastewater management and resource recovery—Analysis, challenges and prospects. J. Environ. Chem. Eng. 2020, 8, 104418. [Google Scholar] [CrossRef]
- Yaqub, M.; Lee, W. Zero-liquid discharge (ZLD) technology for resource recovery from wastewater: A review. Sci. Total Environ. 2019, 681, 551–563. [Google Scholar] [CrossRef]
- Choi, Y.-I.; Jung, J.-H.; Jung, B.-G. Application Study of BIRM-UF-RO System for Industrial Water Reuse in Wastewater Treatment Plant. J. Korean Soc. Environ. Technol. 2020, 21, 196–204. [Google Scholar] [CrossRef]
- Park, Y.-M.; Park, C.-H. Evaluation of Pressured UF Membrane in UF/RO Process for Wastewater Reuse. J. Korean Soc. Urban Environ. 2019, 19, 65–75. [Google Scholar] [CrossRef]
- Bae, J.-H.; Park, H.-S.; Kyung, D. A Study on the Method and Verification of Wastewater Treatment and Reuse Water Production in a Power Plant. J. Korea Acad. Ind. Coop. Soc. 2022, 23, 325–333. [Google Scholar]
- Oren, Y. Capacitive deionization (CDI) for desalination and water treatment—Past, present and future. A review. Desalination 2008, 228, 10–29. [Google Scholar] [CrossRef]
- Tsai, J.-H.; Macedonio, F.; Drioli, E.; Girono, L.; Chou, C.Y.; Hu, F.C.; Tung, K.L. Membrane-based zero liquid discharge: Myth or reality? J. Taiwan Inst. Chem. Eng. 2017, 80, 192–202. [Google Scholar] [CrossRef]
- Oren, Y.; Korngold, E.; Daltrophe, N.; Messalem, R.; Volkman, Y.; Aronov, L. Pilot studies on high recovery BWRO-EDR for near zero liquid discharge approach. Desalination 2010, 261, 321–330. [Google Scholar] [CrossRef]
- Xu, Y.; Sun, Y.; Ma, Z.; Wang, R.; Wang, J.; Wang, L.; Gao, X.; Gao, J. Response surface modeling and optimization of electrodialysis for reclamation of RO concentrates in coal-fired power plants. Sep. Sci. Technol. 2020, 55, 2593–2603. [Google Scholar] [CrossRef]
- Loganathan, K.; Chelme-Ayala, P.; El-Din, M. Treatment of basal water using a hybrid electrodialysis reversal—Reverse osmosis system combined with a low-temperature crystallizer for near-zero liquid discharge. Desalination 2015, 363, 92–98. [Google Scholar] [CrossRef]
- Bond, R.; Batchelor, B.; Davis, T.; Klayman, B. Zero liquid discharge desalination of brackish water with an innovative form of electrodialysis: Electrodialysis metathesis. Fla. Water Resour. J. 2011, 7, 63. [Google Scholar]
- Anderson, M.A.; Cudero, A.; Palma, J. Capacitive deionization as an electrochemical means of saving energy and delivering clean water. Comparison to present desalination practices: Will it compete? Electrochim. Acta 2010, 55, 3845–3856. [Google Scholar] [CrossRef]
- Liu, E.; Lee, L.Y.; Ong, S.; Ng, H.Y. Treatment of industrial brine using Capacitive Deionization (CDI) towards zero liquid discharge—Challenges and optimization. Water Res. 2020, 183, 116059. [Google Scholar] [CrossRef]
- Gamaethiralalage, J.; Singh, K.; Sahin, S.; Yoon, J.; Elimelech, M.; Suss, M.E.; De Smet, L.C.P.M. Recent advances in ion selectivity with capacitive deionization. Energy Environ. Sci. 2021, 14, 1095–1120. [Google Scholar] [CrossRef]
- Guyes, E.N.; Shocron, A.N.; Chen, Y.; Diesendruck, C.E.; Suss, M.E. Long-lasting, monovalent-selective capacitive deionization electrodes. Npj Clean Water 2021, 4, 22. [Google Scholar] [CrossRef]
- Luong, V.T.; Kurtz, E.E.C.; Hellriegel, U.; Dinh, D.N.; Tran, H.; Figoli, A.; Bartolo, G.; Tran, L.; Hoinkis, J. Modular desalination concept with low-pressure reverse osmosis and capacitive deionization: Performance study of a pilot plant in Vietnam in comparison to seawater reverse osmosis. J. Environ. Manag. 2022, 329, 117078. [Google Scholar] [CrossRef]
- Pan, S.Y.; Haddad, A.Z.; Kumar, A.; Wang, S.-W. Brackish water desalination using reverse osmosis and capacitive deionization at the water-energy nexus. Water Res. 2020, 183, 116064. [Google Scholar] [CrossRef]
- Lee, L.Y.; Yoke, L.; Ng, H.Y.; Ong, S.L.; Tao, G.; Kekre, K.; Viswanath, B.; Lay, W.; Seah, H. Integrated pretreatment with capacitive deionization for reverse osmosis reject recovery from water reclamation plant. Water Res. 2009, 43, 4769–4777. [Google Scholar] [CrossRef]
- Choi, J.; Dorji, P.; Shon, H.K.; Hong, S. Applications of capacitive deionization: Desalination, softening, selective removal, and energy efficiency. Desalination 2019, 449, 118–130. [Google Scholar] [CrossRef]
- Rusydi, A.F. Correlation between Conductivity and Total Dissolved Solid in Various Type of Water: A Review. In IOP Conference Series: Earth and Environmental Science; IOP Publishing: Bristol, UK, 2018. [Google Scholar]
- Huyskens, C.; Helsen, J.; De Haan, A. Capacitive deionization for water treatment: Screening of key performance parameters and comparison of performance for different ions. Desalination 2013, 328, 8–16. [Google Scholar] [CrossRef]
- Luciano, M.A.; Ribeiro, H.; Bruch, G.E.; Silva, G.G. Efficiency of capacitive deionization using carbon materials based electrodes for water desalination. J. Electroanal. Chem. 2020, 859, 113840. [Google Scholar] [CrossRef]
- Tang, W.; Kovalsky, P.; Cao, B.; Waite, T.D. Investigation of fluoride removal from low-salinity groundwater by single-pass constant-voltage capacitive deionization. Water Res. 2016, 99, 112–121. [Google Scholar] [CrossRef]
- Zhao, X.; Wei, H.; Zhao, H.; Wang, Y.; Tang, N. Electrode materials for capacitive deionization: A review. J. Electroanal. Chem. 2020, 873, 114416. [Google Scholar] [CrossRef]
- Uwayid, R.; Seraphim, N.M.; Guyes, E.N.; Eisenberg, D.; Suss, M.E. Characterizing and mitigating the degradation of oxidized cathodes during capacitive deionization cycling. Carbon 2021, 173, 1105–1114. [Google Scholar] [CrossRef]
- Algurainy, Y.; Call, D.F. Improving long-term anode stability in capacitive deionization using asymmetric electrode mass ratios. ACS EST Eng. 2021, 2, 129–139. [Google Scholar] [CrossRef]
- Chai, S.; Xi, J.; Chen, L.; He, W.; Shen, J.; Gong, H. Selective Ion Removal by Capacitive Deionization (CDI)-Based Technologies. Processes 2022, 10, 1075. [Google Scholar] [CrossRef]
- Nguyen, T.V.T.; Huynh, N.T.; Vu, N.C.; Kieu, V.N.; Huang, S.C. Optimizing compliant gripper mechanism design by employing an effective bi-algorithm: Fuzzy logic and ANFIS. Microsyst. Technol. 2021, 27, 3389–3412. [Google Scholar] [CrossRef]
- Wang, R.; Yu, Y.; Chen, Y.; Pan, Z.; Li, X.; Tan, Z.; Zhang, J. Model construction and application for effluent prediction in wastewater treatment plant: Data processing method optimization and process parameters integration. J. Environ. Manag. 2022, 302, 114020. [Google Scholar] [CrossRef]
- Niu, G.; Li, X.; He, X.; Zhao, Y.; Yi, X.; Chen, C.; Xujun, L.; Ying, G.; Huang, M. Dynamic optimization of wastewater treatment process based on novel multi-objective ant lion optimization and deep learning algorithm. J. Clean. Prod. 2022, 345, 131140. [Google Scholar] [CrossRef]
- Hakanen, J.; Miettinen, K.; Sahlstedt, K. Wastewater treatment: New insight provided by interactive multiobjective optimization. Decis. Support Syst. 2011, 51, 328–337. [Google Scholar] [CrossRef]
- Yao, J.; Mei, Y.; Jiang, J.; Xia, G.; Chen, J. Process optimization of electrochemical treatment of COD and total nitrogen containing wastewater. Int. J. Environ. Res. Public Health 2022, 19, 850. [Google Scholar] [CrossRef]
- Wang, C.-N.; Yang, F.-C.; Nguyen, V.T.T.; Nguyen, Q.M.; Huynh, N.T.; Huynh, T.T. Optimal Design for Compliant Mechanism Flexure Hinges: Bridge-Type. Micromachines 2021, 12, 1304. [Google Scholar] [CrossRef]
- Wang, C.-N.; Yang, F.-C.; Nguyen, V.T.T.; Vo, N.T.M. CFD Analysis and Optimum Design for a Centrifugal Pump Using an Effectively Artificial Intelligent Algorithm. Micromachines 2022, 13, 1208. [Google Scholar] [CrossRef]
- Khuri, A.I.; Mukhopadhyay, S. Response surface methodology. Wiley Interdiscip. Rev. Comput. Stat. 2010, 2, 128–149. [Google Scholar] [CrossRef]
- Bashir, M.J.; Amr, S.A.; Aziz, S.Q.; Ng, C.A. Wastewater treatment processes optimization using response surface methodology (RSM) compared with conventional methods: Review and comparative study. Middle-East J. Sci. Res. 2015, 23, 244–252. [Google Scholar]
- Ahmed, M.; Giwa, A.; Hasan, S. Chapter 26—Challenges and Opportunities of Graphene-Based Materials in Current Desalination and Water Purification Technologies. In Nanoscale Materials in Water Purification; Thomas, S., Ed.; Elsevier: Geneva, Switzerland, 2019; pp. 735–758. [Google Scholar]
- Gupta, S.S.; Islam, M.; Pradeep, T. Chapter 7—Capacitive Deionization (CDI): An Alternative Cost-Efficient Desalination Technique. In Advances in Water Purification Techniques; Ahuja, S., Ed.; Elsevier: Geneva, Switzerland, 2019; pp. 165–202. [Google Scholar]
- Khan, Q.; Maraqa, M.; Mohamed, A.-M. Chapter 17—Inland desalination: Techniques, brine management, and environmental concerns. In Pollution Assessment for Sustainable Practices in Applied Sciences and Engineering; Mohamed, A.-M.O., Paleologos, E.K., Howari, F.M., Eds.; Butterworth-Heinemann: Oxford, UK, 2021; pp. 871–918. [Google Scholar]
- Rabiee, H.; Khalilpour, K.R.; Betts, J.M.; Tapper, N. Chapter 13—Energy-Water Nexus: Renewable-Integrated Hybridized Desalination Systems. In Polygeneration with Polystorage for Chemical and Energy Hubs; Khalilpour, K.R., Ed.; Academic Press: Cambridge, MA, USA, 2019; pp. 409–458. [Google Scholar]
- Sillanpää, M.; Shestakova, M. Chapter 3—Emerging and Combined Electrochemical Methods. In Electrochemical Water Treatment Methods; Sillanpää, M., Shestakova, M., Eds.; Butterworth-Heinemann: Oxford, UK, 2017; pp. 131–225. [Google Scholar]
- Porada, S.; Zhao, R.; Wal, A.; Presser, V.; Biesheuvel, P.M. Review on the science and technology of water desalination by capacitive deionization. Prog. Mater. Sci. 2013, 58, 1388–1442. [Google Scholar] [CrossRef] [Green Version]
- Woo, Y.C.; Kim, S.H.; Shon, H.K.; Tijing, L.D. Introduction: Membrane Desalination Today, Past, and Future. In Current Trends and Future Developments on (Bio-) Membranes; Basile, A., Inamuddin Curcio, E., Eds.; Elsevier: Geneva, Switzerland, 2019; pp. xxv–xlvi. [Google Scholar]
- Zhao, R.; Biesheuvel, P.M.; Miedema, H.; Bruning, H.; Wal, A. Charge efficiency: A functional tool to probe the double-layer structure inside of porous electrodes and application in the modeling of capacitive deionization. J. Phys. Chem. Lett. 2010, 1, 205–210. [Google Scholar] [CrossRef]
- Biesheuvel, P.; Van der Wal, A. Membrane capacitive deionization. J. Membr. Sci. 2010, 346, 256–262. [Google Scholar] [CrossRef]
- Lee, J.-B.; Park, K.-K.; Eum, H.-M.; Lee, C.-W. Desalination of a thermal power plant wastewater by membrane capacitive deionization. Desalination 2006, 196, 125–134. [Google Scholar] [CrossRef]
- Ahmadi, M.; Vahabzadeh, F.; Bonakdarpour, B.; Mofarrah, E.; Mehranian, M. Application of the central composite design and response surface methodology to the advanced treatment of olive oil processing wastewater using Fenton’s peroxidation. J. Hazard. Mater. 2005, 123, 187–195. [Google Scholar] [CrossRef]
- Asadi, N.; Zilouei, H. Optimization of organosolv pretreatment of rice straw for enhanced biohydrogen production using Enterobacter aerogenes. Bioresour. Technol. 2017, 227, 335–344. [Google Scholar] [CrossRef]
- Wikipedia, Central Composite Design. Available online: https://en.wikipedia.org/wiki/Central_composite_design (accessed on 30 April 2020).
- Hassanvand, A.; Chen, G.Q.; Webley, P.A.; Kentish, S.E. An investigation of the impact of fouling agents in capacitive and membrane capacitive deionisation. Desalination 2019, 457, 96–102. [Google Scholar] [CrossRef]
- Hawks, S.A.; Ramachandra, A.; Porada, S.; Campbell, P.G.; Suss, M.E.; Biesheuvel, P.M.; Santiago, J.G.; Stadermann, M. Performance metrics for the objective assessment of capacitive deionization systems. Water Res. 2019, 152, 126–137. [Google Scholar] [CrossRef]
- Falsafi, S.R.; Rostamabadi, H.; Assadpour, E.; Jafari, S.D. Morphology and microstructural analysis of bioactive-loaded micro/nanocarriers via microscopy techniques; CLSM/SEM/TEM/AFM. Adv. Colloid Interface Sci. 2020, 280, 102166. [Google Scholar] [CrossRef]
- Kleiner, F.; Robler, C.; Vogt, F.; Osburg, A.; Ludwig, H.M. Reconstruction of calcium silicate hydrates using multiple 2D and 3D imaging techniques: Light microscopy, mu-CT, SEM, FIB-nT combined with EDX. J. Microsc. 2022, 286, 102–107. [Google Scholar] [CrossRef]
- Liu, J.; Liu, M.; Chen, S.; Wang, B.; Chen, J.; Yang, D.P.; Zhang, S.; Du, W. Conversion of Au (III)-polluted waste eggshell into functional CaO/Au nanocatalyst for biodiesel production. Green Energy Environ. 2022, 7, 352–359. [Google Scholar] [CrossRef]
- Xu, P.; Drewes, J.; Heil, D.; Wang, G. Treatment of brackish produced water using carbon aerogel-based capacitive deionization technology. Water Res. 2008, 42, 2605–2617. [Google Scholar] [CrossRef]
- Xu, T. Ion exchange membranes: State of their development and perspective. J. Membr. Sci. 2005, 263, 1–29. [Google Scholar] [CrossRef]


| Material | Standard | Capacity | |
|---|---|---|---|
| Electrode | Activated Carbon, Graphite | W100 × L100 × T0.6 mm3 | 16 mg/g or more |
| CEM | Polyethylene | W100 × L100 × T0.015 mm3 | 1.6 meq/g or more (Sheet resistance: 0.5 Ω cm2 or under) |
| AEM | Polyethylene | W100 × L100 × T0.015 mm3 | 1.7 meq/g or more (Sheet resistance: 0.3 Ω cm2 or under) |
| Spacer | Polyethylene terephthalate | W110 × L110 × T0.01 mm3 | - |
| Items | Unit | Feed Conditions | Standard to Discharge | Target to Removal Rate (%) | ||
|---|---|---|---|---|---|---|
| F1 | F2 | F1 | F2 | |||
| pH | - | 8.29 | 7.3 | 6~8 | - | - |
| Conductivity | μS/cm | 2402 | 1055 | <500:reuse | 79.17 | 52.61 |
| TOC | mg/L | 3.2 | 8.7 | <25 | - | - |
| Cl− | mg/L | 145 | 123 | < 7 | 95.17 | 94.31 |
| Alkalinity (as CaCO3) | mg/L | 105 | 77 | <10 | 90.48 | 87.01 |
| Hardness (as CaCO3) | mg/L | 267 | 285 | <10 | 96.25 | 96.49 |
| NTU | 0.12 | 0.94 | <2 | - | - | |
| Fe | mg/L | 0.017 | 0.601 | <0.05 | - | 91.68 |
| NH4+ | mg/L | 0.03 | 0.1 | - | 70.00 | |
| SO42− | mg/L | 85 | 74 | 90.59 | 89.19 | |
| Name | Units | Type | Values |
|---|---|---|---|
| Voltage | V | Factor | 1.2, 1.5, 1.8 |
| Flow rate | mL/min | Factor | 10, 15, 20 |
| Sorption ratio (ad:de) | - | Factor | 1.0:0.8, 1.0:1.0, 1.0:1.2 |
| TDS Removal rate | % | Response | |
| Water Production | mL | Response |
| Std | Run | Factor 1 | Factor 2 | Factor 3 | Response 1 | Response 2 |
|---|---|---|---|---|---|---|
| X1: Voltage (V) | X2: Flow Rate (mL/min) | X3: Sorption Ratio | Y1: TDS Removal (%) | Y2: Water Production (mL) | ||
| 3 | 1 | 1.2 | 20 | 0.8 | 57.47 | 16,000 |
| 12 | 2 | 1.5 | 15 | 1 | 88.91 | 10,800 |
| 11 | 3 | 1.5 | 15 | 1 | 85.24 | 10,800 |
| 9 | 4 | 1.5 | 15 | 1 | 84.78 | 10,800 |
| 10 | 5 | 1.5 | 15 | 1 | 86.31 | 10,800 |
| 5 | 6 | 1.2 | 10 | 1.2 | 56.17 | 6550 |
| 6 | 7 | 1.8 | 10 | 1.2 | 89.41 | 6550 |
| 13 | 8 | 1.5 | 15 | 1 | 85.44 | 10,800 |
| 8 | 9 | 1.8 | 20 | 1.2 | 79.04 | 13,100 |
| 7 | 10 | 1.2 | 20 | 1.2 | 49.87 | 13,100 |
| 4 | 11 | 1.8 | 20 | 0.8 | 81.53 | 16,000 |
| 2 | 12 | 1.8 | 10 | 0.8 | 91.23 | 6550 |
| 1 | 13 | 1.2 | 10 | 0.8 | 75.37 | 6550 |
| 19 | 14 | 1.2 | 15 | 1.4 | 47.60 | 9000 |
| 17 | 15 | 1.5 | 23 | 1 | 64.83 | 16,560 |
| 20 | 16 | 1.5 | 15 | 1 | 80.19 | 10,800 |
| 21 | 17 | 1.5 | 15 | 1 | 80.44 | 10,800 |
| 14 | 18 | 1 | 15 | 1 | 49.99 | 10,800 |
| 18 | 19 | 1.5 | 15 | 0.6 | 79.47 | 13,500 |
| 15 | 20 | 2 | 15 | 1 | 88.32 | 10,800 |
| 16 | 21 | 1.5 | 7 | 1 | 84.95 | 5040 |
| Source | Sequential p-Value | Lack of Fit p-Value | Adjusted R2 | Predicted R2 | |
|---|---|---|---|---|---|
| Linear | <0.0001 | 0.0042 | 0.6606 | 0.5631 | |
| 2FI | 0.8076 | 0.0024 | 0.6147 | 0.4262 | |
| Quadratic | <0.0001 | 0.1686 | 0.9263 | 0.7414 | Suggested |
| Cubic | 0.1982 | 0.1903 | 0.9461 | −0.1471 |
| Source | Sequential p-value | Lack of Fit p-value | Adjusted R2 | Predicted R2 | |
|---|---|---|---|---|---|
| Linear | <0.0001 | 0.9659 | 0.9465 | ||
| 2FI | 0.0009 | 0.9867 | 0.9604 | Suggested | |
| Quadratic | 0.4543 | 0.9865 | 0.9397 | ||
| Cubic | 0.0406 | 0.9941 | 0.5363 |
| Source | Sum of Squares | df | Mean Square | F-Value | p-Value | |
|---|---|---|---|---|---|---|
| Model | 4107.27 | 9 | 456.36 | 28.94 | <0.0001 | Significant |
| : Voltage | 2038.05 | 1 | 2038.05 | 129.26 | <0.0001 | |
| : Flow rate | 445.61 | 1 | 445.61 | 28.26 | 0.0002 | |
| : Sorption ratio | 562.28 | 1 | 562.28 | 35.66 | <0.0001 | |
| 2.13 | 1 | 2.13 | 0.1352 | 0.7201 | ||
| 63.23 | 1 | 63.23 | 4.01 | 0.0705 | ||
| 14.93 | 1 | 14.93 | 0.9471 | 0.3514 | ||
| 356.01 | 1 | 356.01 | 22.58 | 0.0006 | ||
| 121.93 | 1 | 121.93 | 7.73 | 0.0179 | ||
| 669.14 | 1 | 669.14 | 42.44 | <0.0001 | ||
| Residual | 173.44 | 11 | 15.77 | |||
| Lack of fit | 114.15 | 5 | 22.83 | 2.31 | 0.1686 | Not significant |
| Pure Error | 59.29 | 6 | 9.88 | |||
| Cor Total | 4280.71 | 20 |
| Source | Sum of Squares | df | Mean Square | F-Value | p-Value | |
|---|---|---|---|---|---|---|
| Model | 2.118 × 10⁸ | 6 | 3.529 × 10⁷ | 248.67 | <0.0001 | Significant |
| : Voltage | 0.0000 | 1 | 0.0000 | 0.0000 | 1.0000 | |
| : Flow rate | 1.939 × 10⁸ | 1 | 1.939 × 10⁸ | 1365.94 | <0.0001 | |
| : Sorption ratio | 1.369 × 10⁷ | 1 | 1.369 × 10⁷ | 96.46 | <0.0001 | |
| 0.0000 | 1 | 0.0000 | 0.0000 | 1.0000 | ||
| 0.0000 | 1 | 0.0000 | 0.0000 | 1.0000 | ||
| 4.205 × 10⁶ | 1 | 4.205 × 10⁶ | 29.63 | <0.0001 | ||
| Residual | 1.987 × 10⁶ | 14 | 1.419 × 10⁵ | |||
| Lack of fit | 1.987 × 10⁶ | 8 | 2.484 × 10⁵ | |||
| Pure Error | 0.0000 | 6 | 0.0000 | |||
| Cor Total | 2.137 × 10⁸ | 20 |
| Items | Unit | Feed Conditions | Standard to Discharge | Product Water Quality of CDI |
|---|---|---|---|---|
| F1 | ||||
| pH | - | 8.29 | 6~8 | 7.1 |
| Conductivity | μS/cm | 2402 | <500:reuse | 329 |
| TOC | mg/L | 3.2 | <25 | 1.5 |
| Cl− | mg/L | 145 | <7 | 13.8 (±1) |
| Alkalinity (as CaCO3) | mg/L | 105 | <10 | 7 (±1) |
| Hardness (as CaCO3) | mg/L | 267 | <10 | 37 (±1) |
| Turbidity | 0.12 | <2 | 0.23 (±1) | |
| Fe | mg/L | 0.017 | <0.05 | 0.019 (±0.005) |
| NH4+ | mg/L | 0.03 | <0.03 | 0.01 (±0.005) |
| SO42− | mg/L | 85 | <8 | 7.7 (±1) |
| Time (day) | Removal (%) | Energy Consumption (kWh/m3) | |||
|---|---|---|---|---|---|
| Average | Maximum | Minimum | No Energy Recovery (η = 0) | 100% Energy Recovery (η = 1) | |
| 1 | 93.65 | 97.27 | 88.64 | 3.51 | 0.62 |
| 2 | 92.72 | 95.73 | 88.27 | 3.38 | 0.46 |
| 3 | 86.77 | 91.45 | 82.15 | 3.13 | 0.37 |
| 4 | 81.27 | 83.73 | 78.91 | 2.88 | 0.31 |
| 5 | 76.44 | 80.82 | 72.64 | 2.68 | 0.27 |
| 6 | 72.20 | 75.82 | 68.36 | 2.55 | 0.27 |
| 7 | 68.82 | 73.36 | 65.36 | 2.41 | 0.25 |
| 8 | 64.41 | 68.73 | 61.18 | 2.28 | 0.23 |
| 9 | 59.66 | 68.18 | 57.00 | 2.09 | 0.20 |
| 10 | 55.70 | 59.45 | 53.18 | 1.93 | 0.18 |
Disclaimer/Publisher’s Note: The statements, opinions and data contained in all publications are solely those of the individual author(s) and contributor(s) and not of MDPI and/or the editor(s). MDPI and/or the editor(s) disclaim responsibility for any injury to people or property resulting from any ideas, methods, instructions or products referred to in the content. |
© 2023 by the authors. Licensee MDPI, Basel, Switzerland. This article is an open access article distributed under the terms and conditions of the Creative Commons Attribution (CC BY) license (https://creativecommons.org/licenses/by/4.0/).
Share and Cite
Kim, Y.; Cho, H.; Choi, Y.; Koo, J.; Lee, S. Optimization and Evaluation for the Capacitive Deionization Process of Wastewater Reuse in Combined Cycle Power Plants. Membranes 2023, 13, 316. https://doi.org/10.3390/membranes13030316
Kim Y, Cho H, Choi Y, Koo J, Lee S. Optimization and Evaluation for the Capacitive Deionization Process of Wastewater Reuse in Combined Cycle Power Plants. Membranes. 2023; 13(3):316. https://doi.org/10.3390/membranes13030316
Chicago/Turabian StyleKim, Yesol, Hyeongrak Cho, Yongjun Choi, Jaewuk Koo, and Sangho Lee. 2023. "Optimization and Evaluation for the Capacitive Deionization Process of Wastewater Reuse in Combined Cycle Power Plants" Membranes 13, no. 3: 316. https://doi.org/10.3390/membranes13030316