Article

Performance of Hypersaline Brine Desalination Using Spiral Wound Membrane: A Parametric Study

1
Faculty of Chemical and Process Engineering Technology, Universiti Malaysia Pahang, Lebuh Persiaran Tun Khalil Yaakob, Kuantan 26300, Malaysia
2
Advanced Membrane Technology Research Centre (AMTEC), Faculty of Chemical and Energy Engineering, Universiti Teknologi Malaysia, Johor Bahru 81310, Malaysia
3
Petroleum and Chemical Engineering Programme Area, Faculty of Engineering, Universiti Teknologi Brunei, Gadong BE1410, Brunei
4
School of Chemical Engineering, Engineering Campus, Universiti Sains Malaysia, Nibong Tebal 14300, Malaysia
*
Author to whom correspondence should be addressed.
Membranes 2023, 13(2), 248; https://doi.org/10.3390/membranes13020248
Submission received: 19 January 2023 / Revised: 14 February 2023 / Accepted: 17 February 2023 / Published: 19 February 2023
(This article belongs to the Special Issue Membrane Materials and Processes for Liquid and Gas Separation)

Abstract

:
Desalination of hypersaline brine is known as one of the methods to cope with the rising global concern on brine disposal in high-salinity water treatment. However, the main problem of hypersaline brine desalination is the high energy usage resulting from the high operating pressure. In this work, we carried out a parametric analysis on a spiral wound membrane (SWM) module to predict the performance of hypersaline brine desalination, in terms of mass transfer and specific energy consumption (SEC). Our analysis shows that at a low inlet pressure of 65 bar, a significantly higher SEC is observed for high feed concentration of brine water compared with seawater (i.e., 0.08 vs. 0.035) due to the very low process recovery ratio (i.e., 1%). Hence, an inlet pressure of at least 75 bar is recommended to minimise energy consumption. A higher feed velocity is also preferred due to its larger productivity when compared with a slightly higher energy requirement. This study found that the SEC reduction is greatly affected by the pressure recovery and the pump efficiencies for brine desalination using SWM, and employing them with high efficiencies (ηR ≥ 95% and ηpump ≥ 50%) can reduce SEC by at least 33% while showing a comparable SEC with SWRO desalination (<5.5 kWh/m3).

1. Introduction

The disposal of hypersaline brine has been a subject of rising environmental concern. This is because an inappropriate handling of brine discharged from seawater/brackish water desalination plants into the environment would inflict a tremendous amount of damage to the surrounding ecosystem as it could disrupt the maritime concentration balance and contaminate the soil [1,2,3,4]. Hence, there is a growing interest in recent years focusing on the coupling of desalination plants with brine management to utilise the high-salinity water while reducing the volume of liquid waste. The ultimate goal of the brine management is to achieve a zero liquid discharge (ZLD) [4,5,6]. When water is removed from the high-salinity feed and only solids are left as the final waste product, this management could reduce the harmful impact of hypersaline brine as well as minimise the risks of contamination on the environment due to the improper disposal of brines and solid waste [5,6,7,8,9].
Desalination of brine water can be carried out using thermal-based or membrane-based methods [1,4,10]. One of the most important thermal-based technologies for brine water treatment is multi-stage flash distillation (MSF) which accounts for about 64% used in thermal desalination [11]. A major challenge for the commonly used thermal-based method is its extremely high energy consumption (i.e., 52–70 kWh/m3) involved in evaporating the high-salinity water and reducing the brine discharge [4,10]. The membrane-based method, on the other hand, has a significantly lower energy consumption of 7–12 kWh/m3 for brine desalination in reverse osmosis (RO) processes [12], despite the fact that RO is still an energy-intensive process for drinking water production.
Nonetheless, it must be pointed out that RO process does not require a phase change of feed stream, which explains the growing interest of the membrane-based method for brine desalination. In order to desalinate the high-salinity brine, the RO membrane module would have to operate at a much higher pressure condition to separate water from the highly concentrated solution [13]. One of the latest approaches to improve the efficiency of hypersaline brine desalination is by employing osmotically assisted reverse osmosis (OARO), which combines both forward osmosis (FO) and RO principles. In OARO, a less concentrated solution is used in the permeate side of RO compared with the feed solution in order to reduce the osmotic pressure differences across the membrane. Thus, a smaller hydraulic pressure can be applied compared with traditional RO which not only allows for the treatment of a high salinity solution but also avoids exceeding the burst pressure of the membrane module [14]. Feed temperature is acknowledged as an important parameter of the design and operation of the RO system. For instance, it was found by Goosen et al. [15] that doubling the feed temperature from 20 °C to 40 °C increases the water flux by 60%. However, the positive effects of increasing feed temperature were found to be more significant for low salinity feed water, compared with high salinity water [16].
Nowadays, the most common membrane module used in desalination is the spiral wound membrane (SWM) module [17] which, to date, can withstand pressure of up to 80 bar [18,19]. The use of higher pressure beyond the practical limit of the conventional SWM module is not possible for the current state-of-the-art techniques due to higher risks of membrane damage and leaking issues associated with the membrane module [20,21,22]. Nevertheless, several studies have reported that this problem could be solved by using high-strength adhesives for gluing the membrane sheets together [21,23] and/or additional sealing techniques of membrane sheets [24,25] to improve module durability. Not only that, the development of high-strength materials and/or more robust module designs would also help to overcome the pressure limit of the conventional SWM module in the future, owing to the extensive progress in current membrane research [4,12,26,27,28,29,30]. Based on this, it is believed that the use of the SWM module with a higher pressure for hypersaline brine desalination may be a reality in the years to come.
In spite of this, no parametric analysis has been carried out to investigate the impact of typical hypersaline brine condition using SWM on the energy consumption. Despite several studies using SWM for predicting the energy consumption, they are restricted to the typical RO feed condition [31,32]. While the traditional high rejection seawater reverse osmosis (SWRO) has a typical water flux of 30–40 L/m2.h using the commercial SWM module (note: membranes were tested based on standard seawater conditions of 32,000 ppm NaCl at 55 bar) [24,33,34,35], the flux performance of hypersaline brine reverse osmosis (HBRO) using the SWM module remains largely unclear.
Hence, this study aims to perform a parametric analysis on hypersaline brine desalination using the module-based model and compare its performance against the conventional SWRO for a full-scale SWM module, in terms of permeate flux, concentration polarisation and energy consumption. The effects of feed conditions, such as inlet operating pressure, feed concentration and inlet velocity on HBRO performance are also evaluated. Given that the energy requirement of brine desalination (7 to 12 kWh/m3 [12]) is significantly higher than those for using SWRO (1.5 to 5.5 kWh/m3 [36]), this means that a substantial reduction of energy for brine water is needed in order to ensure it is practical to be used. For this reason, energy recovery parameters, such as the retentate pressure recovery efficiency (ηR) and pump efficiency (ηpump) are employed as means to reduce energy. Moreover, both parameters have yet to be tested for brine desalination. This is because these parameters directly affect the amount of energy conserved during the pressure recovery process [37], which are beneficial for minimising the energy consumption of the membrane operation. Not only that, it is also important to gain understanding of the degree of energy reduction that can be achieved with respect to the energy recovery parameters used in the process.

2. Methodology

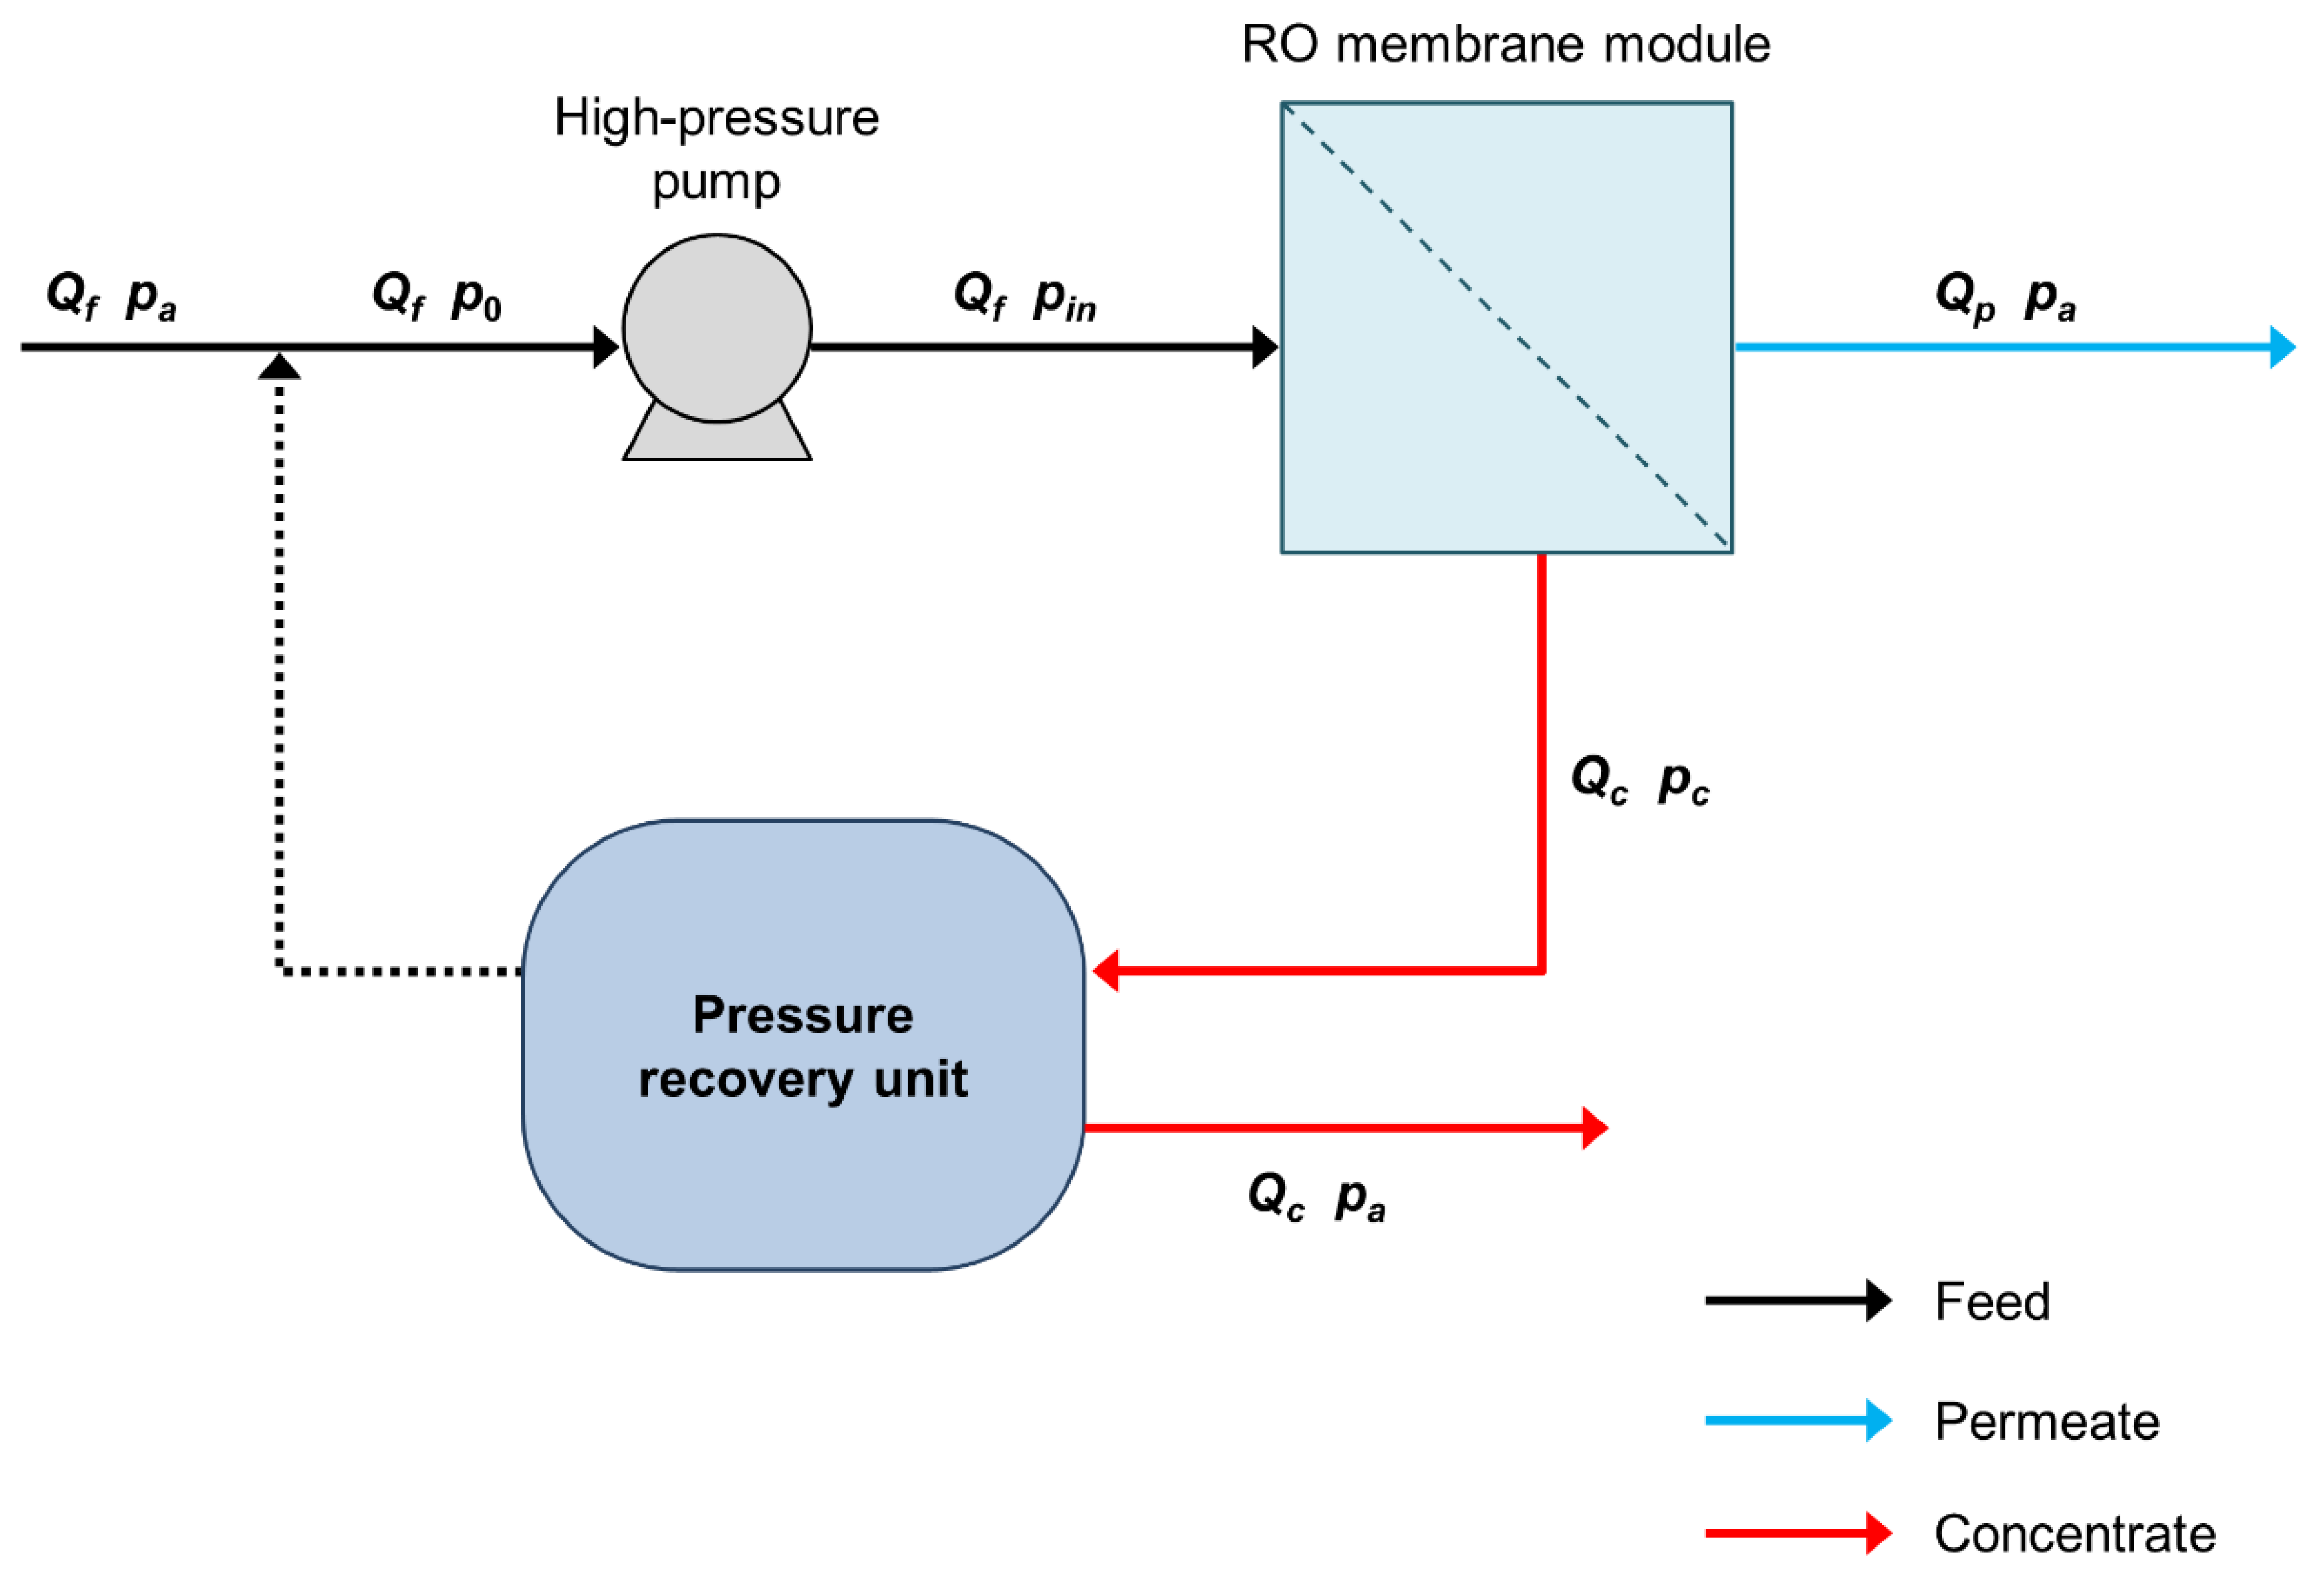
2.1. Module-Scale Analysis

Figure 1 shows the schematic diagram of the typical RO membrane desalination process used for the module-scale analysis. The process is made up of four single-stage module units with each unit consisting of 1 m of membrane length [32,37]. The feed solution, i.e., seawater or hypersaline brine, is pressurised before entering the RO membrane module to produce high-purity water (i.e., permeate), while the rejected solution (i.e., concentrate) is sent through a pressure recovery unit to recover some of the solution pressure. Further, the module is assumed to have a typical ladder-type commercial feed spacers [37].
A multi-scale approach is used in this study in which the correlations for the Sherwood number and friction factor from a small-scale computational fluid dynamic (CFD) analysis are employed to estimate the specific energy consumption (SEC) of the SWM performance. The capability of this method has been proven in the literature [32,38], as it could interplay not only the permeate flux, but also the concentration polarisation (CP) as well as the pressure drop of the entire SWM. The module-scale model solves a series of one-dimensional ordinary differential equations (ODEs) to calculate for the pressure drop and global and salt mass balances along a full-length membrane module, as expressed in the following equations:
d Q d x = A m J ρ L m
d w b d x = A m J ρ Q L m ( w b w p )
d p d x = 2 ρ u e f f 2 d h f g l o b
where Q is the volumetric flow rate, Am is the membrane area, J is the permeate flux, ρ is the density, Lm is the membrane length, p is the pressure, ueff is the effective velocity, dh is the hydraulic diameter, fglob is the Fanning friction factor, wb and wp are the solute mass fraction of feed and permeate, respectively. The permeate flux (J) is calculated based on the well-known Kedem–Katchalsky model [39]:
J = L p ( Δ p t m σ φ R w w )
where Lp is the membrane permeance, Δptm is the transmembrane pressure, σ is the reflection coefficient, φ is the osmotic pressure coefficient, R is the membrane intrinsic rejection and ww is the solute mass fraction near the membrane boundary layer.
The total volumetric permeate flow rate (Qp) can then be calculated by integrating the flux along the membrane module:
Q p = δ c h 0 L m J ρ d x
where δch is the channel width of the membrane module. Further details on the flux calculation can be found elsewhere [37,40] and the solute concentration at the membrane wall (ww) can be calculated using the equation, as follows [40]:
w w = w p + 1 2 σ φ ( Δ p t m k m t L p ) + [ 1 2 σ φ ( Δ p t m k m t L p ) ] 2 + k m t σ φ L p ( w b w p )
where kmt is the mass transfer coefficient.
Equations (1) to (3) are derived from the mass and momentum balances, which can be solved by the Runge–Kutta method. The mass transfer, as well as the pressure drop are calculated based on the correlations for the dependencies of the Sherwood number (Sh) and fglob on the Reynolds number (Reh), as expressed in Equations (7) and (8), respectively. Both equations are developed based on the validated small-scale CFD analysis for the typical RO unit-scale model using a ladder-type spacer [32,37]:
S h = k m t d h D = 2.44 Re h 0.61
f g l o b = d h 2 ρ u e f f 2 Δ p c h L m = 8.76 Re h 0.62
where Sh represents the dimensionless approximation for the mass transfer performance, while the fglob is the proxy measure of pressure loss across the membrane channel.
It is important to note that the mass transfer correlation in Equations (7) is determined considering the impermeable wall condition [37]. Therefore, the mass transfer data must be converted to the case of the permeable wall condition when performing the module-scale analysis. This can be carried out given that the ratio of the volumetric flux to the impermeable mass transfer coefficient (ψ) is not more than 20 [41]. In this case, ψ is below 2 for all case studies considered, hence the correlations can be applied to predict the mass transfer coefficient (kmt,per) under the permeable wall condition [41,42,43,44,45,46].
Note that the module-scale analysis is performed considering only the fluid flow in the membrane feed side of the SWM module, as the pressure drop in the permeate side is often considered negligible due to the very high transmembrane pressure, when compared with the permeate pressure [32,37]. Furthermore, the CP effect could be neglected at the membrane permeate side because of the high intrinsic rejection of the RO membrane. Hence, it is safe to model only the module feed side.

2.2. Analysis of Results

A CP modulus ( γ ) is given, as in Equation (9), to predict the extent of concentration polarisation in the membrane module. In this case, a larger value of γ indicates a higher CP in the membrane channel and vice versa [40,47]:
γ = w w w p w b w p
The area-averaged values of the local variables (ϕ), such as the permeate flux and CP modulus along the membrane module length (Lm) can be calculated, as follows [32,48]:
ϕ ¯ = 1 L m ϕ d x
The performance metric with respect to SEC is calculated based on the total permeate flow rate and pressure drop obtained from the module-scale model as expressed in Equation (11) [49]:
SEC = [ Δ p t m η R ( Δ p t m Δ p c h ) ( 1 R R O ) ] R R O η p u m p
where Δptm is the transmembrane pressure ( Δ p t m = p i n p a ) , ηR is the retentate pressure recovery efficiency, Δpch is the pressure drop in the membrane module, RRO is the recovery ratio of the RO process and ηpump is the pump efficiency. The recovery ratio (RRO) is defined as the ratio of the total permeate flow rate to the feed flow rate (Qp/Qf), while ηR refers to the efficiency of the pressure recovery unit (as in Figure 1) for recovering energy from the retentate pressure exiting from the RO membrane module [37,44]. SEC is widely used to measure the energy requirement of any desalination system and it is generally referred to as the ratio of energy consumed in a RO membrane module to the unit volume of permeate water generated [50,51,52,53]. The details for the derivation of SEC can be found elsewhere [49].

2.3. Comparison between HBRO and SWRO

Table 1 describes the case parameters used for SWRO and HBRO, respectively. A minimum solute feed mass fraction of 0.05 is considered for hypersaline brine (HB) as the high-salinity water has an average total dissolved solid (TDS) greater than 35,000 mg/L of typical seawater [12]. The inlet operating pressure, pin, on the other hand, is varied in the range of 65–80 bar for both SW and HB desalination (Table 1) as the upper limit (80 bar) is the current practical limitation of RO membranes [18,19]. In terms of feed velocities, the range of values selected (as in Table 1) corresponds to a hydraulic Reh of not more than 250 [40,54], which is within the flow velocities used in the RO membranes for the typical channel height considered [32]. The dimensional specifications of the SWM RO module, as well as the base conditions used for the case analysis are summarised in Table 2.

3. Results and Discussion

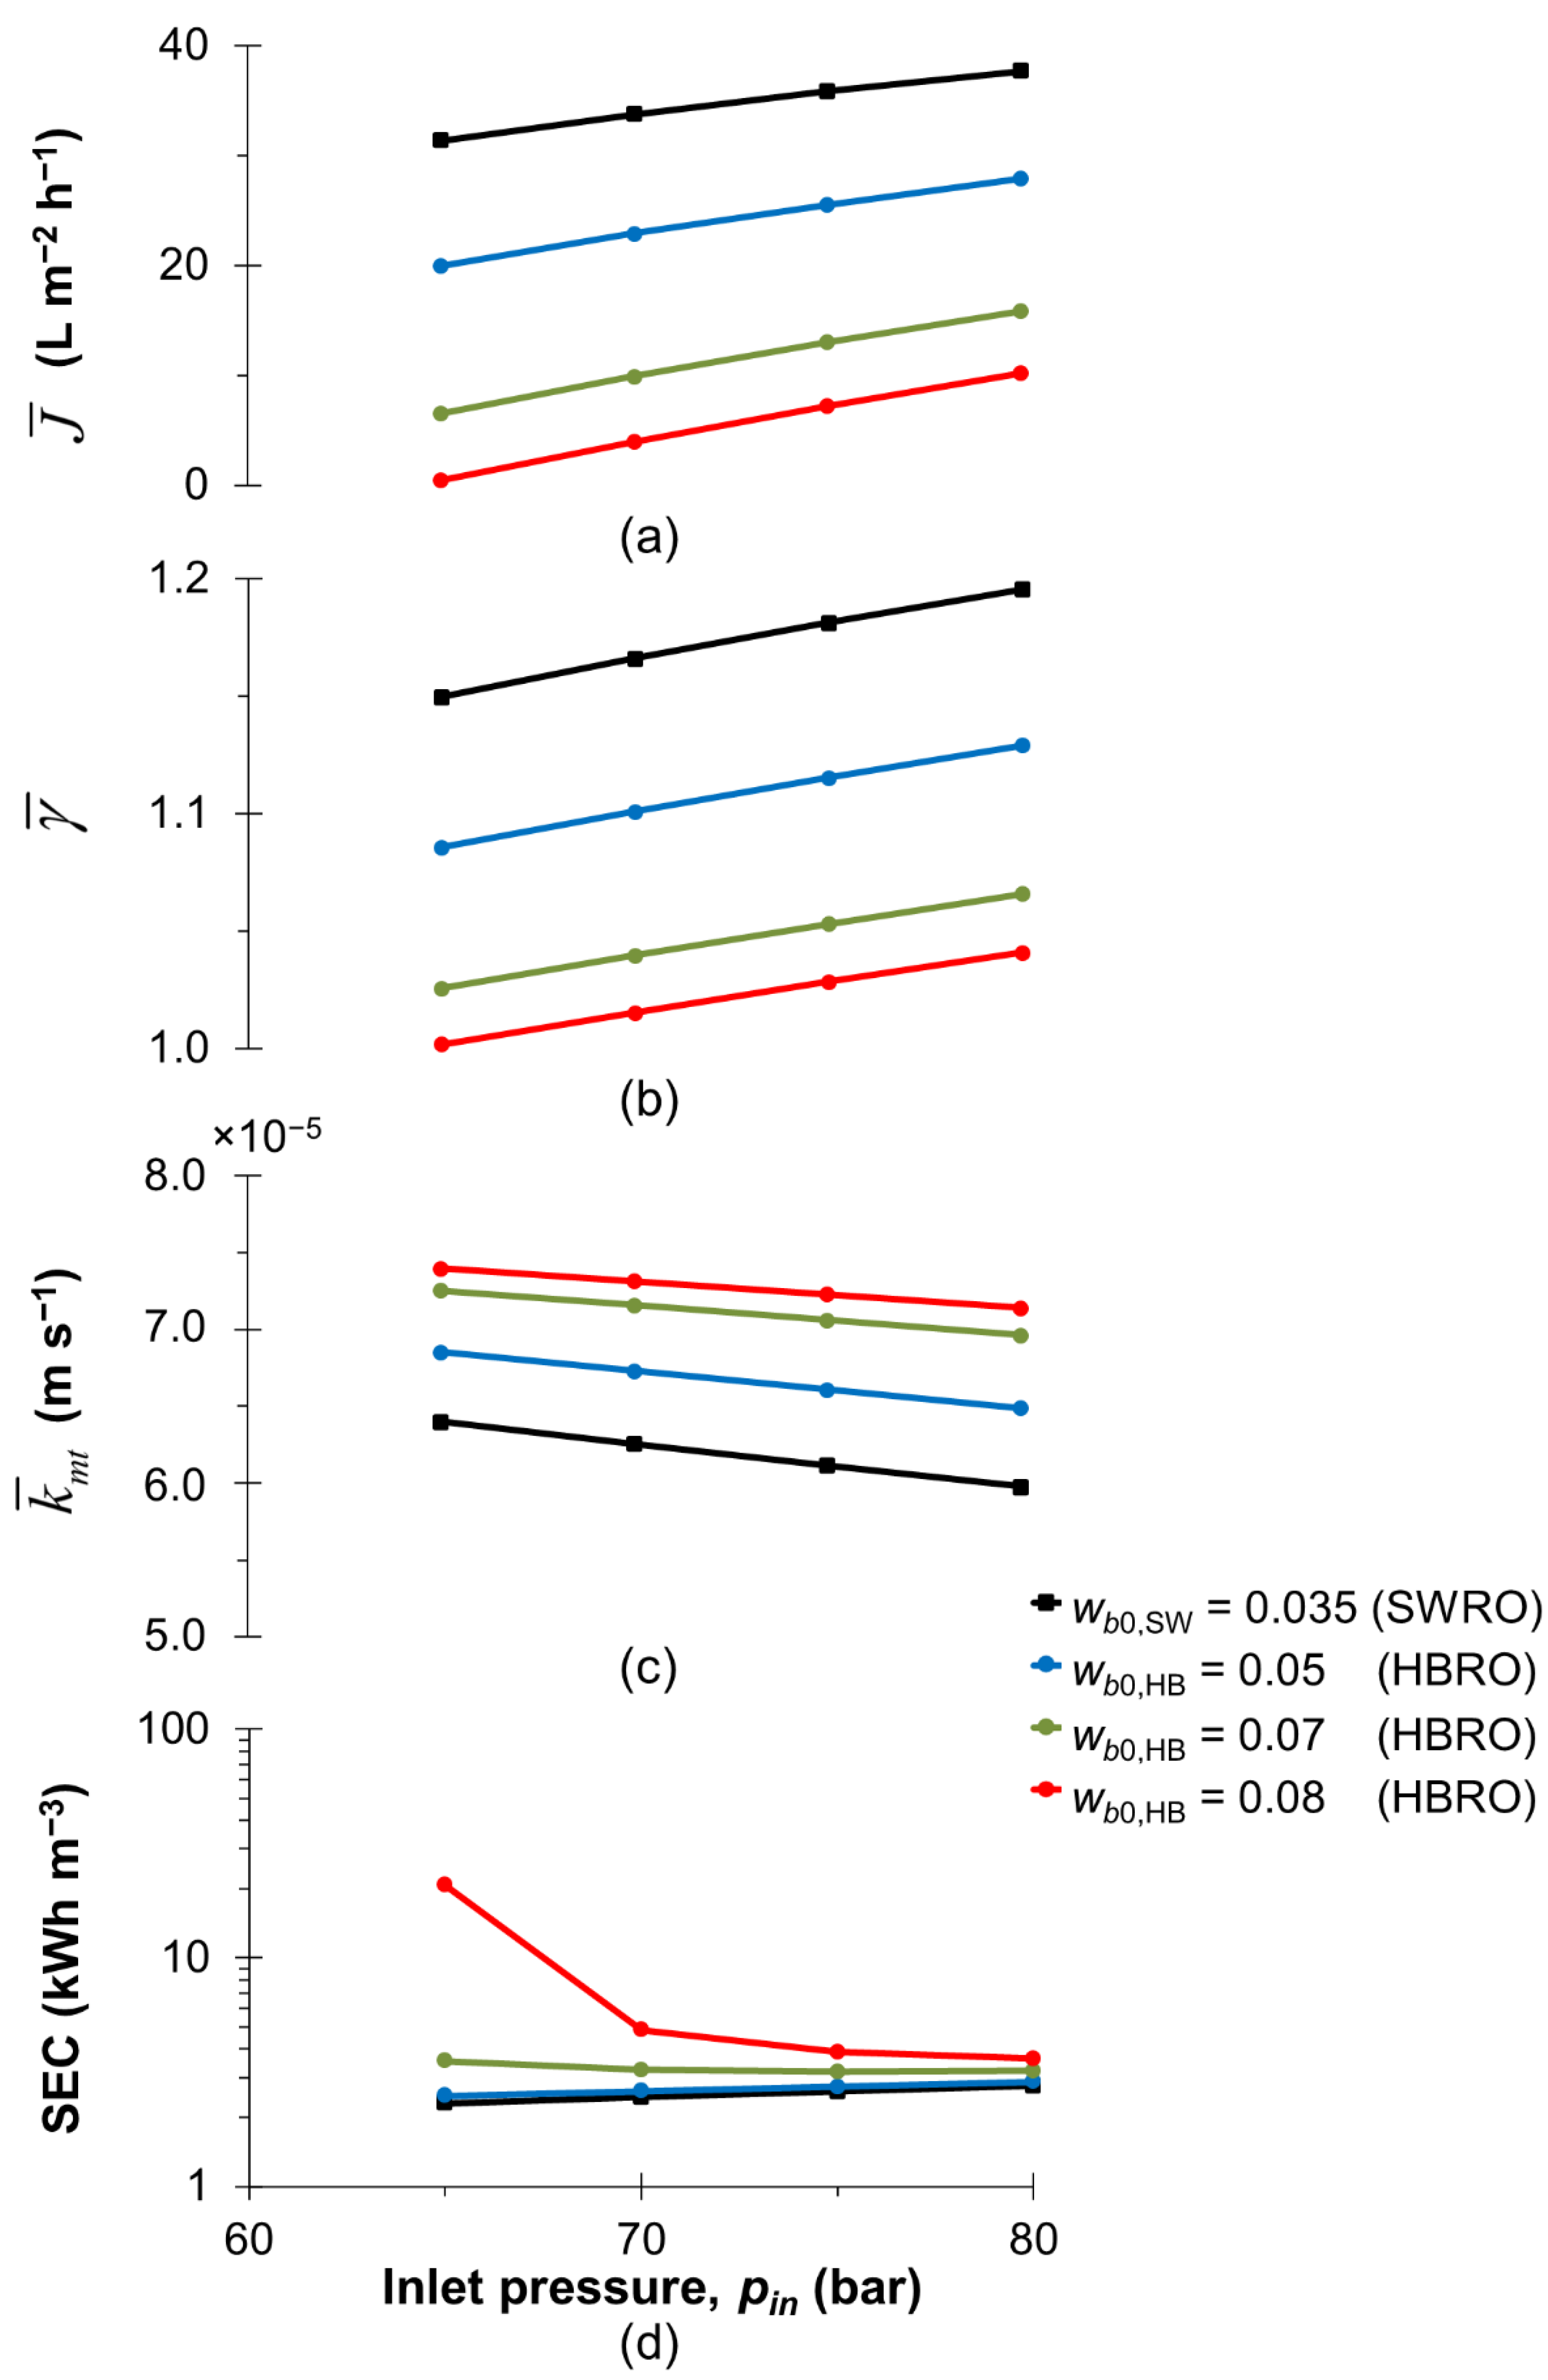
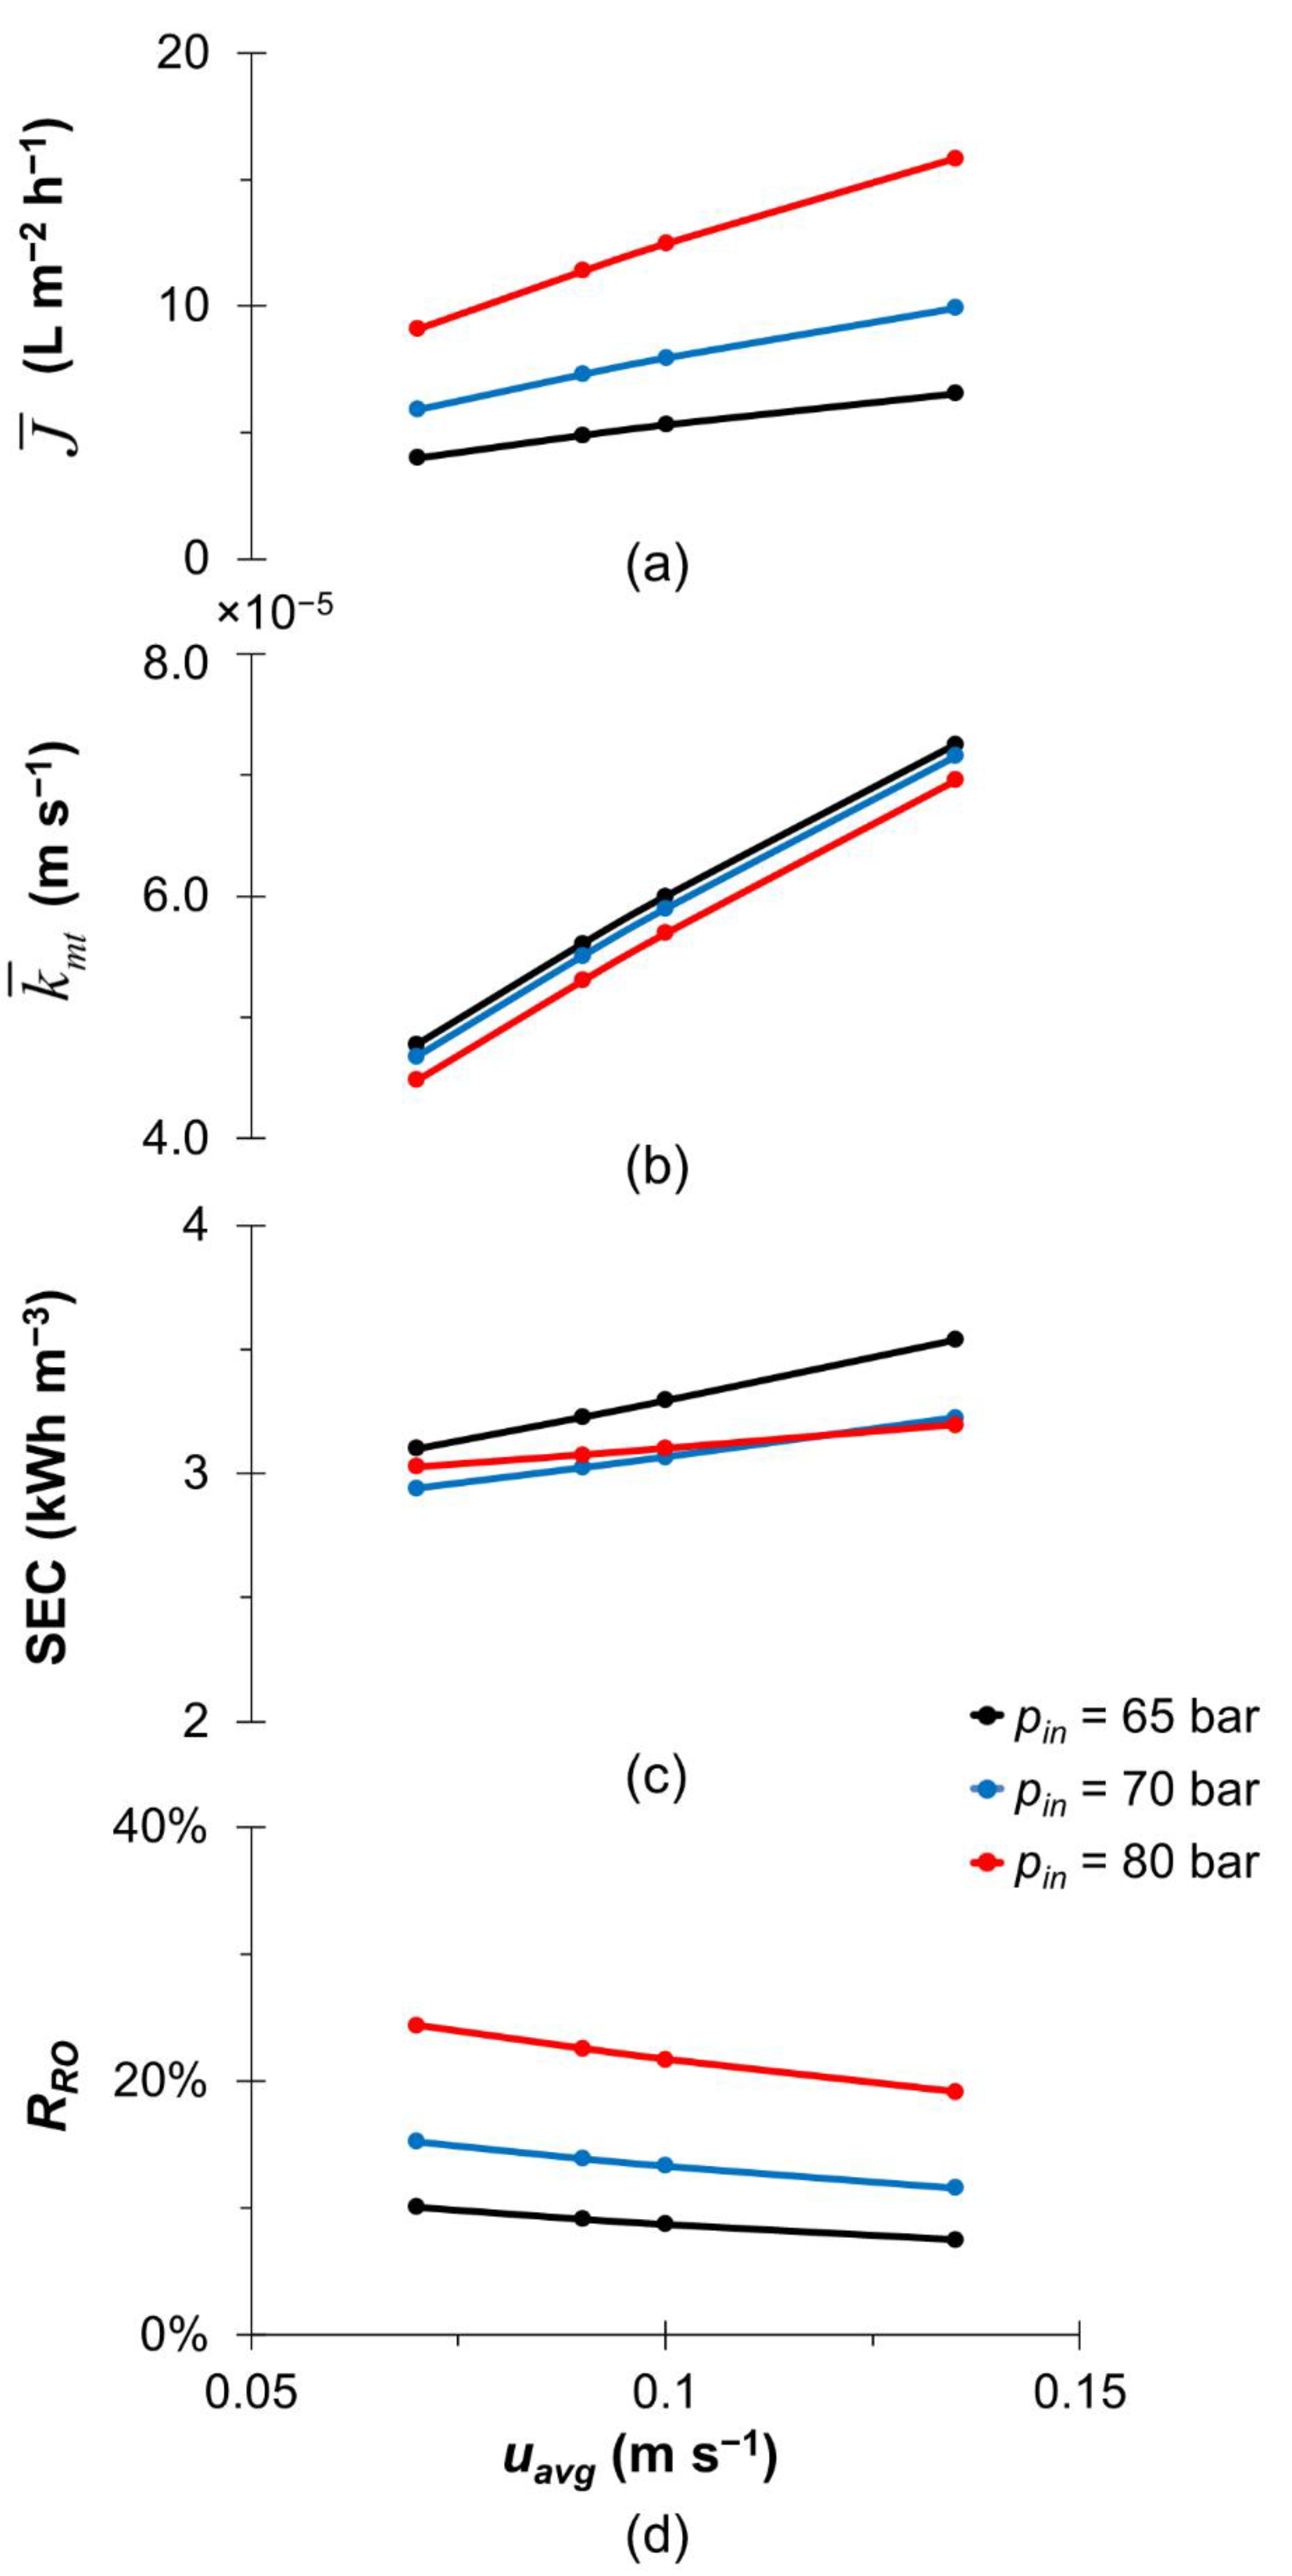
3.1. Effect of the Feed Conditions on HBRO Performance

Figure 2 compares the performance of HBRO with conventional SWRO at different inlet operating pressures (pin) by means of the permeate flux, concentration polarisation, mass transfer coefficient and SEC. It is worth noting that the module-based model is developed based on the validated small-scale CFD analysis of the SWM desalination process using a conventional feed spacer [32,37]. The mass transfer coefficient ( k ¯ m t ) calculated in this study depends not only on the feed condition and properties, but also on the feed spacer geometry. In our simulation study, the mass transfer coefficients calculated (i.e., 6 × 10⁻⁵ to 8 × 10⁻⁵ m/s) agree reasonably with the value obtained in the literature (i.e., 6.61 × 10⁻⁵ m/s [37]) at a similar feed condition for dual-layer feed spacer geometry. Lastly, most of the SEC values calculated for seawater and hypersaline brine desalination in this study are below 3 kWh/m3 and 6 kWh/m3, respectively (see Figure 2 and Figure 3), which agree reasonably with the data reported in the literature (1.5 to 5.5 kWh/m3 for seawater [55] and 7 to 12 kWh/m3 for brine water [12]), thus providing confidence in the prediction of k ¯ m t and SEC in this case.
Compared with the permeate flux obtained for SWRO in the range of 30–40 L/m2.h (as in Figure 2a), HBRO demonstrates a permeate flux of no more than 28 L/m2.h due to a much higher solute concentration of the brine water than seawater. Interestingly, at a low inlet pressure of 65 bar, Figure 2d shows a very high energy requirement of up to 21 kWh/m3 in the case of HBRO for a feed solute mass fraction of 0.08, which is about 2.5 times compared with the SWRO for the feed solute mass fraction of 0.035. This is because, under this condition, the recovery ratio (RRO) obtained is very low (i.e., 1%) to desalinate a very high concentration of brine water (i.e., wb0,HB = 0.08) with a small inlet pressure. This implies that the inlet pressure should be at least 75 bar for the desalination of highly concentrated brine water, in order to significantly reduce the energy consumption. Note that pressure has a direct relationship to SEC while the productivity has a reverse relationship with SEC.
Figure 3 discusses the effect of the inlet velocity (uavg) on the overall performance of hypersaline brine desalination in an SWM module. The range of inlet velocity used in this study is set within 0.135 m/s, as recommended by the SWM manufacturers [56]. Thus, the impact due to an upper limit of feed velocity considered in this work on the membrane is negligible in this case. Figure 3a shows that an increase in the inlet velocity of the feed brine results in a higher flux due to enhanced mass transfer (Figure 3b) [57], for all inlet pressures studied in this work. In terms of energy consumption, the SEC only increases by less than 7.5% as the inlet velocity increases (Figure 3c). This is because, under a constant inlet pressure, an increase in the inlet velocity tends to decrease the recovery ratio (see Figure 3d), leading to a higher SEC. Given that there is only a small increase in SEC (i.e., <7.5%) due to the increase in inlet velocity, it is preferable for hypersaline brine desalination to operate at a high inlet velocity under a constant inlet pressure condition.

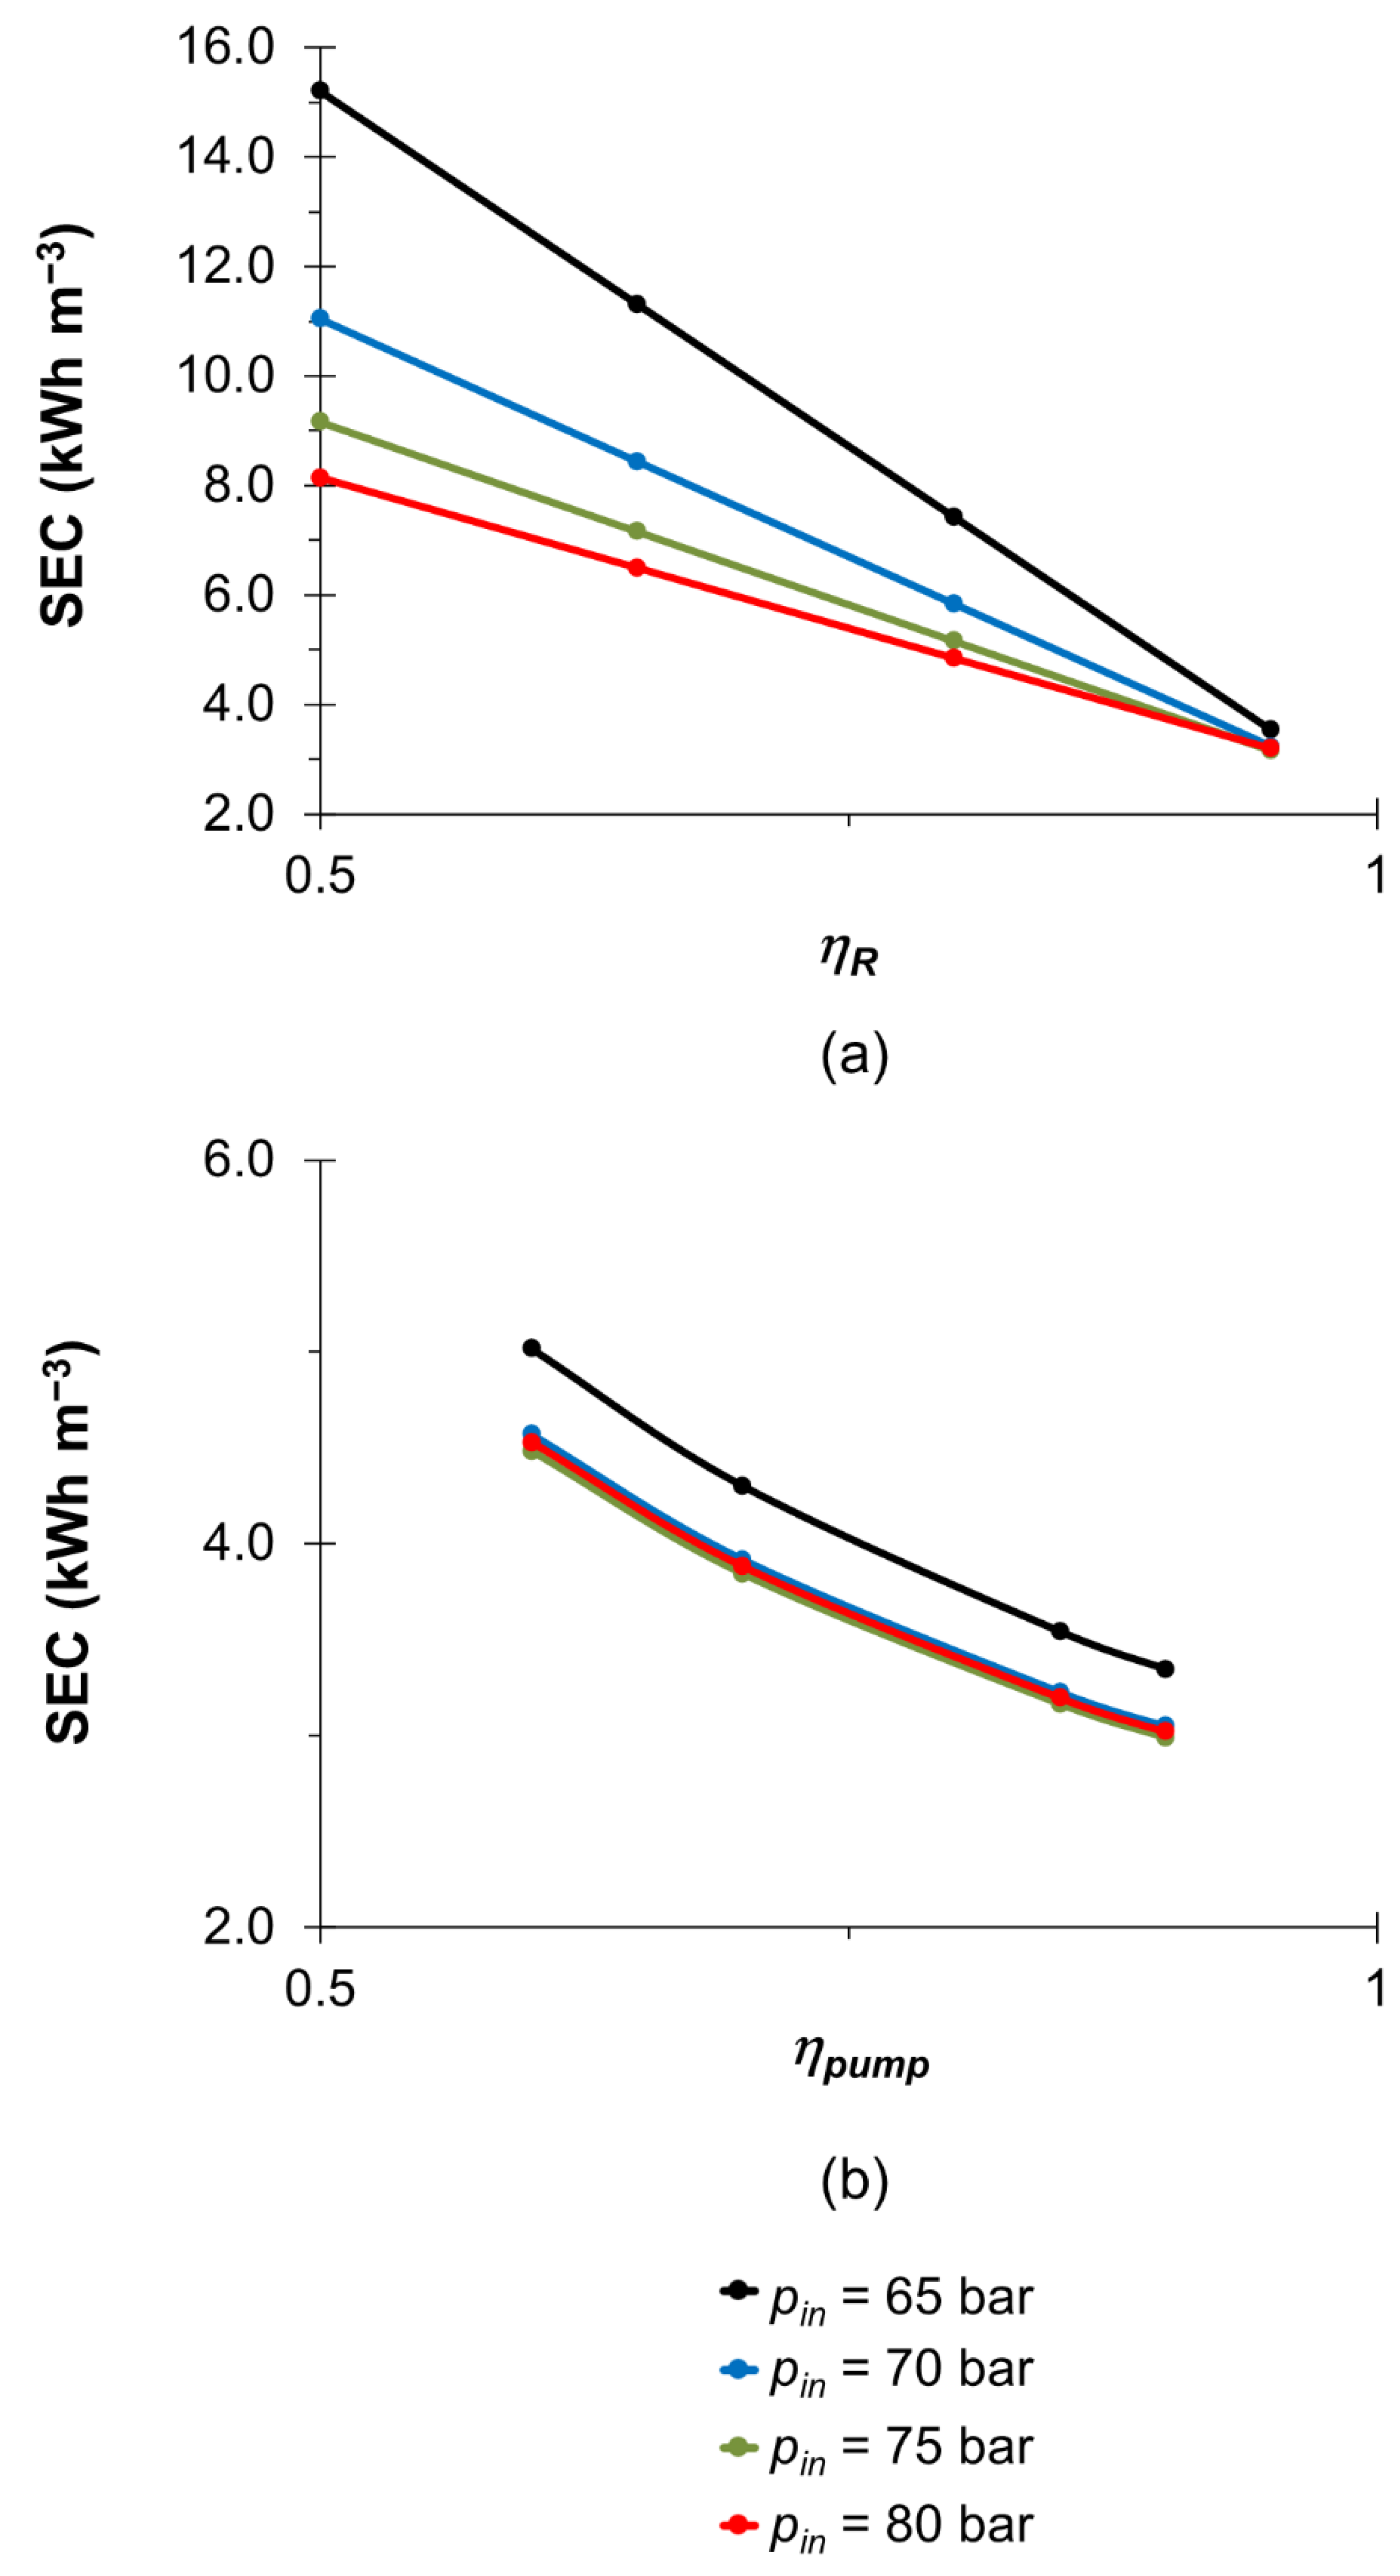
3.2. Effect of Retentate Pressure Recovery and Pump Efficiency

This section studied the impact of retentate pressure recovery and pump efficiencies on the performance of hypersaline brine desalination using SWM. The upper limit of retentate pressure recovery efficiency used in this study is 95% given that the current pressure recovery device can achieve an efficiency of over 95% [58,59], whereas the pump efficiency could reach a practical limit of about 90% if the centrifugal pump type is used [58,60]. The improvement in the energy recovery efficiencies can be achieved by increasing the processing capacity of the pressure recovery device [61], or using a larger size of pump [58,59]. A higher energy recovery efficiency typically reduces the energy consumption as more energy can be recovered [58,59,60]. Figure 4 shows that an increase in the retentate pressure recovery efficiency (ηR) and/or pump efficiency (ηpump) would reduce the SEC of HBRO by at least 33%. These results indicate that a high retentate pressure recovery efficiency is very important for SEC reduction, especially at a low inlet pressure condition (i.e., 65 bar) as a maximum 77% of energy saving can be achieved (Figure 4a). This study found that all of the inlet pressures used for hypersaline brine desalination show a comparable SEC with SWRO desalination (<5.5 kWh/m3 [36]) at ηR of 95% (Figure 4a) and/or a minimum ηpump of 50% (Figure 4b). However, a high energy requirement (i.e., >8 kWh/m3) is required for ηR of 50%, despite the fact that a high efficiency pump (i.e., ηpump = 85%) is used (see Figure 4a). Fouling remains the bottleneck, impeding the understanding of its effect on the flux and energy consumption using SWM. Thus, future research is still needed to enable comprehensive understanding of fouling on energy consumption, especially for typical hypersaline feed conditions.

4. Conclusions

A parametric analysis is performed in this study to evaluate the overall performance of hypersaline brine desalination in an SWM module using a module-scale model. At a lower range of inlet pressure (i.e., 65 bar), it is interesting to note that when the solute concentration of brine water is more than twice the solute concentration of seawater (i.e., 0.08 vs. 0.035), a significantly higher SEC is observed due to a very low recovery rate (i.e., 1%). Our findings indicate that the inlet pressure should be at least 75 bar for the desalination of highly concentrated brine water in order to minimise the energy consumption. This study also found that a higher feed velocity is preferred due to its larger productivity while only requiring a slightly higher energy requirement. The analysis also reported that the SEC reduction is greatly affected by the pressure recovery and pump efficiencies in desalinating brine water using SWM, and employing them with high efficiency (ηR ≥ 95% and ηpump ≥ 50%) can reduce SEC by energy-savings of at least 33% while showing a comparable SEC with SWRO desalination (<5.5 kWh/m3).

Author Contributions

K.F.: Formal analysis, Investigation, Writing–original draft. Y.Y.L.: Conceptualization, Formal analysis, Resources, Writing–review & editing, Supervision, Project administration, Funding acquisition. W.J.L.: Writing–review & editing. M.M.R.K.: Writing–review & editing. A.L.A.: Writing–review & editing. All authors have read and agreed to the published version of the manuscript.

Funding

This research was funded by the Postgraduate Research Grant Scheme (PGRS2003194) provided by UMP and the fellowship provided by Advanced Membrane Technology Research Centre (AMTEC), Universiti Teknologi Malaysia under HICOE grant (AJ090301.5300.07092).

Institutional Review Board Statement

Not applicable.

Informed Consent Statement

Not applicable.

Data Availability Statement

Data sharing not applicable.

Acknowledgments

The first author (K.F.) gratefully acknowledges the Postgraduate Research Grant Scheme (PGRS2003194) provided by UMP and the student fellowship provided by Advanced Membrane Technology Research Centre (AMTEC), Universiti Teknologi Malaysia under HICOE grant (AJ090301.5300.07092).

Conflicts of Interest

The authors declare no conflict of interest.

Nomenclature

Symbols
AmMembrane area (m2)
DDiffusion coefficient (m2 s−1)
dhHydraulic diameter (m)
f g l o b = d h 2 ρ u e f f 2 Δ p c h L m Fanning friction factor
hchMembrane channel height (m)
JMass flux (kg m−2 s−1, L m−2 h−1)
kmtMass transfer coefficient (m s−1)
LmMembrane length (m)
LpMembrane permeance (m Pa−1 s−1)
NNumber of envelopes
pPressure (Pa, bar)
Δ p t m = p i n p a Transmembrane pressure (bar)
QVolumetric flow rate (m3 s−1)
R = 1 w p w w Membrane intrinsic rejection
R e h = ρ u e f f d h μ Hydraulic Reynolds number
RRORecovery ratio
S c = μ ρ D Schmidt number
S h = k m t d h D Sherwood number
tTime (s)
uavgInlet velocity (m s−1)
u e f f = u a v g 0 ε Effective velocity (m s−1)
v Velocity vector (m s−1)
wSolute mass fraction
xDistance in the bulk flow direction, parallel to the membrane surface (m)
yDistance from the bottom membrane surface, in the direction normal to the surface (m)
Greek letters
δchChannel width (m)
εPorosity
γ Concentration polarisation modulus
μDynamic viscosity (kg m−1 s−1)
ηpumpPump efficiency
η R = p 0 p a ( p 0 p a ) i d e a l Retentate pressure recovery efficiency
πOsmotic pressure (Pa)
π 0 = φ w b 0 Inlet osmotic pressure (Pa)
φOsmotic pressure coefficient (Pa)
ψRatio of volumetric flux to the impermeable mass transfer coefficient
ρDensity (kg m−3)
σReflection coefficient
Subscripts
bValue at the inlet bulk conditions
fValue for the feed
HBValue for hypersaline brine
impValue for the impermeable wall condition
inValue for the inlet
outValue at the domain outlet
pValue for the permeate
perValue for the permeable wall condition
rValue for the retentate/concentrate
SWValue for seawater
wValue on the feed side membrane surface (wall)

References

  1. Mavukkandy, M.O.; Chabib, C.M.; Mustafa, I.; Al Ghaferi, A.; AlMarzooqi, F. Brine management in desalination industry: From waste to resources generation. Desalination 2019, 472, 114187. [Google Scholar] [CrossRef]
  2. Brady, P.V.; Kottenstette, R.J.; Mayer, T.M.; Hightower, M.M. Inland desalination: Challenges and research needs. J. Contemp. Water Res. Educ. 2005, 132, 46–51. [Google Scholar] [CrossRef] [Green Version]
  3. Elimelech, M.; Phillip, W.A. The Future of Seawater Desalination: Energy, Technology, and the Environment. Science 2011, 333, 712–717. [Google Scholar] [CrossRef] [PubMed]
  4. Park, K.; Kim, J.; Hong, S. Brine management systems using membrane concentrators: Future directions for membrane development in desalination. Desalination 2022, 535, 115839. [Google Scholar] [CrossRef]
  5. Muhammad, Y.; Lee, W. Zero-liquid discharge (ZLD) technology for resource recovery from wastewater: A review. Sci. Total Environ. 2019, 681, 551–563. [Google Scholar] [CrossRef]
  6. Shah, K.M.; Billinge, I.H.; Chen, X.; Fan, H.; Huang, Y.; Winton, R.K.; Yip, N.Y. Drivers, challenges, and emerging technologies for desalination of high-salinity brines: A critical review. Desalination 2022, 538, 115827. [Google Scholar] [CrossRef]
  7. Pérez-González, A.; Urtiaga, A.M.; Ibáñez, R.; Ortiz, I. State of the art and review on the treatment technologies of water reverse osmosis concentrates. Water Res. 2012, 46, 267–283. [Google Scholar] [CrossRef]
  8. Mauter, M.S.; Fiske, P.S. Desalination for a circular water economy. Energy Environ. Sci. 2020, 13, 3180–3184. [Google Scholar] [CrossRef]
  9. Bello, A.S.; Zouari, N.; Da’ana, D.A.; Hahladakis, J.N.; Al-Ghouti, M.A. An overview of brine management: Emerging desalination technologies, life cycle assessment, and metal recovery methodologies. J. Environ. Manag. 2021, 288, 112358. [Google Scholar] [CrossRef]
  10. Panagopoulos, A.; Haralambous, K.-J.; Loizidou, M. Desalination brine disposal methods and treatment technologies—A review. Sci. Total Environ. 2019, 693, 133545. [Google Scholar] [CrossRef]
  11. Shatat, M.; Riffat, S.B. Water desalination technologies utilizing conventional and renewable energy sources. Int. J. Low-Carbon Technol. 2014, 9, 1–19. [Google Scholar] [CrossRef]
  12. Davenport, D.M.; Deshmukh, A.; Werber, J.R.; Elimelech, M. High-Pressure Reverse Osmosis for Energy-Efficient Hypersaline Brine Desalination: Current Status, Design Considerations, and Research Needs. Environ. Sci. Technol. Lett. 2018, 5, 467–475. [Google Scholar] [CrossRef] [Green Version]
  13. Al-Obaidi, M.A.; Rasn, K.H.; Aladwani, S.H.; Kadhom, M.; Mujtaba, I.M. Flexible design and operation of multi-stage reverse osmosis desalination process for producing different grades of water with maintenance and cleaning opportunity. Chem. Eng. Res. Des. 2022, 182, 525–543. [Google Scholar] [CrossRef]
  14. Nakagawa, K.; Togo, N.; Takagi, R.; Shintani, T.; Yoshioka, T.; Kamio, E.; Matsuyama, H. Multistage osmotically assisted reverse osmosis process for concentrating solutions using hollow fiber membrane modules. Chem. Eng. Res. Des. 2020, 162, 117–124. [Google Scholar] [CrossRef]
  15. Goosen, M.F.A.; Sablani, S.S.; Al-Maskari, S.S.; Al-Belushi, R.H.; Wilf, M. Effect of feed temperature on permeate flux and mass transfer coefficient in spiral-wound reverse osmosis systems. Desalination 2002, 144, 367–372. [Google Scholar] [CrossRef]
  16. Koutsou, C.P.; Kritikos, E.; Karabelas, A.J.; Kostoglou, M. Analysis of temperature effects on the specific energy consumption in reverse osmosis desalination processes. Desalination 2020, 476, 114213. [Google Scholar] [CrossRef]
  17. Toh, K.Y.; Liang, Y.Y.; Lau, W.J.; Fletcher, D.F. CFD study of the effect of perforated spacer on pressure loss and mass transfer in spacer-filled membrane channels. Chem. Eng. Sci. 2020, 222, 115704. [Google Scholar] [CrossRef]
  18. Kamal, A.M.; El-Sayed, T.A.; El-Butch, A.M.A.; Farghaly, S.H. Analytical and finite element modeling of pressure vessels for seawater reverse osmosis desalination plants. Desalination 2016, 397, 126–139. [Google Scholar] [CrossRef]
  19. Fritzmann, C.; Löwenberg, J.; Wintgens, T.; Melin, T. State-of-the-art of reverse osmosis desalination. Desalination 2007, 216, 1–76. [Google Scholar] [CrossRef]
  20. Xu, Y.; Peng, X.; Tang, C.Y.; Fu, Q.S.; Nie, S. Effect of draw solution concentration and operating conditions on forward osmosis and pressure retarded osmosis performance in a spiral wound module. J. Membr. Sci. 2010, 348, 298–309. [Google Scholar] [CrossRef]
  21. Salim, W.; Vakharia, V.; Chen, Y.; Wu, D.; Han, Y.; Ho, W.S.W. Fabrication and field testing of spiral-wound membrane modules for CO2 capture from flue gas. J. Membr. Sci. 2018, 556, 126–137. [Google Scholar] [CrossRef] [Green Version]
  22. Chen, K.K.; Salim, W.; Han, Y.; Wu, D.; Ho, W.S.W. Fabrication and scale-up of multi-leaf spiral-wound membrane modules for CO2 capture from flue gas. J. Membr. Sci. 2020, 595, 117504. [Google Scholar] [CrossRef]
  23. Scholes, C.A.; Motuzas, J.; Smart, S.; Kentish, S.E. Membrane Adhesives. Ind. Eng. Chem. Res. 2014, 53, 9523–9533. [Google Scholar] [CrossRef]
  24. Liu, M.; Yu, S.; Qi, M.; Pan, Q.; Gao, C. Impact of manufacture technique on seawater desalination performance of thin-film composite polyamide-urethane reverse osmosis membranes and their spiral wound elements. J. Membr. Sci. 2010, 348, 268–276. [Google Scholar] [CrossRef]
  25. Li, D.; Yan, Y.; Wang, H. Recent advances in polymer and polymer composite membranes for reverse and forward osmosis processes. Prog. Polym. Sci. 2016, 61, 104–155. [Google Scholar] [CrossRef] [Green Version]
  26. Lin, W.; Lei, J.; Wang, Q.; Wang, X.-M.; Huang, X. Performance enhancement of spiral-wound reverse osmosis membrane elements with novel diagonal-flow feed channels. Desalination 2022, 523, 115447. [Google Scholar] [CrossRef]
  27. Lin, W.; Zhang, Y.; Li, D.; Wang, X.-M.; Huang, X. Roles and performance enhancement of feed spacer in spiral wound membrane modules for water treatment: A 20-year review on research evolvement. Water Res. 2021, 198, 117146. [Google Scholar] [CrossRef]
  28. Zhang, Z.; Wu, Y.; Luo, L.; Li, G.; Li, Y.; Hu, H. Application of disk tube reverse osmosis in wastewater treatment: A review. Sci. Total Environ. 2021, 792, 148291. [Google Scholar] [CrossRef]
  29. Panagopoulos, A. Process simulation and analysis of high-pressure reverse osmosis (HPRO) in the treatment and utilization of desalination brine (saline wastewater). Int. J. Energy Res. 2022, 46, 23083–23094. [Google Scholar] [CrossRef]
  30. Davenport, D.M.; Wang, L.; Shalusky, E.; Elimelech, M. Design principles and challenges of bench-scale high-pressure reverse osmosis up to 150 bar. Desalination 2021, 517, 115237. [Google Scholar] [CrossRef]
  31. Qiu, T.Y.; Davies, P.A. Concentration polarization model of spiral-wound membrane modules with application to batch-mode RO desalination of brackish water. Desalination 2015, 368, 36–47. [Google Scholar] [CrossRef] [Green Version]
  32. Toh, K.Y.; Liang, Y.Y.; Lau, W.J.; Weihs, G.A.F. The techno-economic case for coupling advanced spacers to high-permeance RO membranes for desalination. Desalination 2020, 491, 114534. [Google Scholar] [CrossRef]
  33. Ali, Z.; Al Sunbul, Y.; Pacheco, F.; Ogieglo, W.; Wang, Y.; Genduso, G.; Pinnau, I. Defect-free highly selective polyamide thin-film composite membranes for desalination and boron removal. J. Membr. Sci. 2019, 578, 85–94. [Google Scholar] [CrossRef]
  34. Li, Y.; Qi, S.; Tian, M.; Widjajanti, W.; Wang, R. Fabrication of aquaporin-based biomimetic membrane for seawater desalination. Desalination 2019, 467, 103–112. [Google Scholar] [CrossRef]
  35. Liu, L.; Xie, X.; Qi, S.; Li, R.; Zhang, X.; Song, X.; Gao, C. Thin film nanocomposite reverse osmosis membrane incorporated with UiO-66 nanoparticles for enhanced boron removal. J. Membr. Sci. 2019, 580, 101–109. [Google Scholar] [CrossRef]
  36. Goh, P.S.; Liang, Y.Y.; Ismail, A.F. Energy Efficient Seawater Desalination: Strategies and Opportunities. Energy Technol. 2021, 9, 2100008. [Google Scholar] [CrossRef]
  37. Liang, Y.Y.; Toh, K.Y.; Fimbres-Weihs, G.A. 3D CFD study of the effect of multi-layer spacers on membrane performance under steady flow. J. Membr. Sci. 2019, 580, 256–267. [Google Scholar] [CrossRef]
  38. Guillen, G.; Hoek, E.M.V. Modeling the impacts of feed spacer geometry on reverse osmosis and nanofiltration processes. Chem. Eng. J. 2009, 149, 221–231. [Google Scholar] [CrossRef]
  39. Kedem, O.; Katchalsky, A. Thermodynamic analysis of the permeability of biological membranes to non-electrolytes. Biochim. Biophys. Acta 1958, 27, 229–246. [Google Scholar] [CrossRef]
  40. Fimbres-Weihs, G.A.; Wiley, D.E. Review of 3D CFD modeling of flow and mass transfer in narrow spacer-filled channels in membrane modules. Chem. Eng. Process. Process Intensif. 2010, 49, 759–781. [Google Scholar] [CrossRef]
  41. Geraldes, V.; Afonso, M.D. Generalized mass-transfer correction factor for nanofiltration and reverse osmosis. AIChE J. 2006, 52, 3353–3362. [Google Scholar] [CrossRef]
  42. Werber, J.R.; Deshmukh, A.; Elimelech, M. The Critical Need for Increased Selectivity, Not Increased Water Permeability, for Desalination Membranes. Environ. Sci. Technol. Lett. 2016, 3, 112–120. [Google Scholar] [CrossRef]
  43. Fimbres-Weihs, G.A.; Wiley, D.E. Numerical study of two-dimensional multi-layer spacer designs for minimum drag and maximum mass transfer. J. Membr. Sci. 2008, 325, 809–822. [Google Scholar] [CrossRef]
  44. Cohen-Tanugi, D.; McGovern, R.K.; Dave, S.H.; Lienhard, J.H.; Grossman, J.C. Quantifying the potential of ultra-permeable membranes for water desalination. Energy Environ. Sci. 2014, 7, 1134–1141. [Google Scholar] [CrossRef] [Green Version]
  45. Shi, B.; Marchetti, P.; Peshev, D.; Zhang, S.; Livingston, A.G. Will ultra-high permeance membranes lead to ultra-efficient processes? Challenges for molecular separations in liquid systems. J. Membr. Sci. 2017, 525, 35–47. [Google Scholar] [CrossRef]
  46. McGovern, R.K.; Lienhard, V.J.H. On the asymptotic flux of ultrapermeable seawater reverse osmosis membranes due to concentration polarisation. J. Membr. Sci. 2016, 520, 560–565. [Google Scholar] [CrossRef] [Green Version]
  47. Baker, R.W. Membrane Technology and Applications; John Wiley & Sons Ltd.: Oxford, UK, 2004. [Google Scholar]
  48. Liang, Y.Y.; Fimbres-Weihs, G.A.; Fletcher, D.F. CFD study of the effect of unsteady slip velocity waveform on shear stress in membrane systems. Chem. Eng. Sci. 2018, 192, 16–24. [Google Scholar] [CrossRef]
  49. Goi, Y.K.; Liang, Y.Y.; Lau, W.J.; Fimbres Weihs, G.A. Analysis of the effect of advanced FO spacer on the specific energy consumption of hybrid RO desalination system. J. Membr. Sci. 2023, 668, 121247. [Google Scholar] [CrossRef]
  50. Lim, Y.J.; Ma, Y.; Chew, J.W.; Wang, R. Assessing the potential of highly permeable reverse osmosis membranes for desalination: Specific energy and footprint analysis. Desalination 2022, 533, 115771. [Google Scholar] [CrossRef]
  51. Ruiz-García, A.; de la Nuez Pestana, I. Feed Spacer Geometries and Permeability Coefficients. Effect on the Performance in BWRO Spriral-Wound Membrane Modules. Water 2019, 11, 152. [Google Scholar] [CrossRef] [Green Version]
  52. Wang, Z.; Zhang, Y.; Wang, T.; Zhang, B.; Ma, H. Design and Energy Consumption Analysis of Small Reverse Osmosis Seawater Desalination Equipment. Energies 2021, 14, 2275. [Google Scholar] [CrossRef]
  53. Shrivastava, A.; Rosenberg, S.; Peery, M. Energy efficiency breakdown of reverse osmosis and its implications on future innovation roadmap for desalination. Desalination 2015, 368, 181–192. [Google Scholar] [CrossRef]
  54. Reima, I.; Jae Min, H.; Kunio, K. Analyses of three-dimensional flow calculations in a driven cavity. Fluid Dyn. Res. 1990, 6, 91–102. [Google Scholar] [CrossRef]
  55. Goh, P.S.; Lau, W.J.; Othman, M.H.D.; Ismail, A.F. Membrane fouling in desalination and its mitigation strategies. Desalination 2018, 425, 130–155. [Google Scholar] [CrossRef]
  56. DOW, FILMTECTM Membranes: FILMTEC SW30-8040 Seawater Reverse Osmosis Element Product Information; The Dow Chemical Company: Midland, MI, USA, 2018.
  57. Aladwani, S.H.; Al-Obaidi, M.A.; Mujtaba, I.M. Performance of reverse osmosis based desalination process using spiral wound membrane: Sensitivity study of operating parameters under variable seawater conditions. Clean. Eng. Technol. 2021, 5, 100284. [Google Scholar] [CrossRef]
  58. Voutchkov, N. Energy use for membrane seawater desalination—Current status and trends. Desalination 2018, 431, 2–14. [Google Scholar] [CrossRef]
  59. Kim, J.; Park, K.; Yang, D.R.; Hong, S. A comprehensive review of energy consumption of seawater reverse osmosis desalination plants. Appl. Energy 2019, 254, 113652. [Google Scholar] [CrossRef]
  60. Park, K.; Kim, J.; Yang, D.R.; Hong, S. Towards a low-energy seawater reverse osmosis desalination plant: A review and theoretical analysis for future directions. J. Membr. Sci. 2020, 595, 117607. [Google Scholar] [CrossRef]
  61. Wu, J.; Jin, Q.; Wang, Y.; Tandon, P. Theoretical analysis and auxiliary experiment of the optimization of energy recovery efficiency of a rotary energy recovery device. Desalination 2017, 415, 1–7. [Google Scholar] [CrossRef]
Figure 1. Schematic illustration of the typical RO membrane desalination process.
Membranes 13 00248 g001
Figure 2. Comparison between SWRO and HBRO performance in terms of (a) the area-averaged flux ( J ¯ ) , (b) area-averaged concentration polarisation modulus ( γ ¯ ) , (c) area-averaged mass transfer coefficient ( k ¯ m t ) and (d) specific energy consumption at a different inlet pressure (pin) and feed mass fraction (wb0). wb0,SW and wb0,HB represent the feed mass fraction of seawater and hypersaline brine, respectively. The comparison study is performed at the same inlet velocity, i.e., uavg = 0.135 m s−1, with ηR and ηpump constant at 0.95 and 0.85, respectively.
Membranes 13 00248 g002
Figure 3. Effect of the inlet velocity (uavg) on the HBRO performance in terms of (a) the area-averaged flux ( J ¯ ) , (b) area-averaged mass transfer coefficient ( k ¯ m t ) , (c) specific energy consumption and (d) recovery ratio (RRO) for different inlet pressure (pin) at fixed wb0,HB = 0.07, ηR = 0.95 and ηpump = 0.85.
Membranes 13 00248 g003
Figure 4. Effect of (a) retentate pressure recovery efficiency and (b) pump efficiency on SEC in the HBRO process at different inlet pressures (pin) with constant wb0,HB = 0.07 and uavg = 0.135 m s−1.
Membranes 13 00248 g004
Table 1. Case parameters used for SWRO and HBRO.
Case ParametersSWROHBRO
Feed mass fraction, wb00.0350.05–0.08
Inlet pressure, pin (bar)65–80
Inlet velocity, uavg (m s−1) 0.07–0.135
Table 2. SWM module specifications and base conditions used for the case studies of SWRO and HBRO.
ParametersValue
Membrane area of module, Am (m2)28
Number of envelopes, N14
Module length, Lm (m)1
Number of module units per pressure vessel4
Channel width of module, δch (m)1
Channel height, hch (m)0.001
Schmidt number, Sc600
Membrane permeance, Lp (m Pa−1 s−1)6 × 10⁻¹²
Reflection coefficient, σ1
Osmotic pressure coefficient, φ (Pa)8.051 × 10⁷
Intrinsic rejection, R0.996
Inlet velocity, uavg (m s−1)0.07–0.135
Retentate pressure recovery efficiency, ηR0.95
Pump efficiency, ηpump0.85
Disclaimer/Publisher’s Note: The statements, opinions and data contained in all publications are solely those of the individual author(s) and contributor(s) and not of MDPI and/or the editor(s). MDPI and/or the editor(s) disclaim responsibility for any injury to people or property resulting from any ideas, methods, instructions or products referred to in the content.

