Article

Differences in the Effect of Mn2+ on the Reverse Osmosis Membrane Fouling Caused by Different Types of Organic Matter: Experimental and Density Functional Theory Evidence

1
College of Water Sciences, Beijing Normal University, Beijing 100875, China
2
State Key Laboratory of Environmental Criteria and Risk Assessment, Chinese Research Academy of Environmental Sciences, Beijing 100012, China
3
Institute of Water Ecology and Environment, Chinese Research Academy of Environmental Sciences, Beijing 100012, China
4
Institute of Ecology, Chinese Research Academy of Environmental Sciences, Beijing 100012, China
*
Authors to whom correspondence should be addressed.
Membranes 2023, 13(10), 823; https://doi.org/10.3390/membranes13100823
Submission received: 10 September 2023 / Revised: 24 September 2023 / Accepted: 3 October 2023 / Published: 5 October 2023
(This article belongs to the Special Issue Membrane Separation Systems: Design and Applications)

Abstract

:
Landfill leachate from some sites contains a high concentration of Mn2+, which may cause reverse osmosis (RO) membrane fouling during RO treatment. In this study, the effect of Mn2+ on RO membrane fouling caused by typical organic pollutants (humic acid (HA), protein (BSA), and sodium alginate (SA)) was systematically investigated, and it was found that Mn2+ exacerbates RO membrane fouling caused by HA, SA, and HBS (mixture of HA + BSA + SA). When the Mn2+ concentration was 0.5 mM and 0.05 mM separately, the membrane fouling caused by HA and SA began to become significant. On the other hand, with for HBS fouling only, the water flux decreased significantly by about 21.7% and further decreased with an increasing Mn2+ concentration. However, Mn2+ has no direct effect on BSA. The effect degrees to which Mn2+ affected RO membrane fouling can be expressed as follows: HBS > SA > HA > BSA. The density functional theory (DFT) calculations also gave the same results. In modeling the reaction of the complexation of Mn2+ with the carboxyl group in these four types of organic matter, BSA has the highest energy (−55.7 kJ/mol), which predicts that BSA binding to Mn2+ is the most unstable compared to other organic matter. The BSA carboxylate group also has the largest bond length (2.538–2.574 Å) with Mn2+ and the weakest interaction force, which provides a theoretical basis for controlling RO membrane fouling exacerbated by Mn2+.

1. Introduction

Currently, landfills are still the main way to dispose of solid waste, due to their low cost [1]. However, leachate is an unavoidable problem in landfill disposal [2]. Inorganic matter, dissolved organic matter, heavy metals, and xenobiotic organic compounds are the main components of leachate, which is thought to be one of the most polluted wastewater [3]. Treating leachate is important for reducing environmental hazards and maintaining ecological balance.
Reverse osmosis (RO) is considered the most ideal method for the in situ treatment of leachate due to its high removal rate of almost any pollutant [4] and has been widely used in landfill treatment [5,6]. But, when it comes to membranes, membrane fouling is an unavoidable problem, especially under such complex water quality conditions. The high concentration and complexity of metal ions interacting with organic matter can greatly exacerbate membrane fouling and reduce RO membrane permeate flux [7].
Mitigating membrane fouling is a current research hotspot. Membrane fouling caused by the interaction between calcium, magnesium, silicon, and organic matter has been extensively studied [8,9,10]. Furthermore, membrane fouling from the interaction between aluminum and iron was reported [11,12,13,14]. However, the literature has revealed that Mn concentrations can be significant at some sites with high concentrations of organic matter [2,15], so research on the effect of Mn on RO membrane fouling caused by organic matter would be worthwhile.
There have been some studies on membrane fouling caused by Mn. As early as Kaiya et al. [16] found that membrane fouling was mainly caused by TOC and manganese when hollow fiber membranes were used in treating drinking water. Since then, some studies have also found that large quantities of manganese oxides accumulated in the long-term use of filtration membranes, resulting in severe and irreversible fouling [17,18,19,20]. However, most of the above studies about manganese fouling in membrane separation processes are on ultrafiltration, and most focus on the morphology and distribution of manganese on the membranes after long-term filtration. There are few studies on the process of manganese accumulation on RO membranes. Moreover, the effect of Mn2+ on RO membrane fouling caused by organic matter has not been paid enough attention.
Density functional theory (DFT) calculations have been widely used for modeling and predicting reactions between substances and have been used in membrane fouling studies [8,11,21,22]. Because of the lack of a research base related to RO membrane fouling exacerbated by Mn2+, DFT would be a good aid in interpreting the results. In this study, we use humic acid (HA), sodium alginate (SA), bovine serum albumin (BSA) and their mixtures (HBS, HA + BSA + SA) to simulate the typical organic matter in leachate. in the fouling experiment, the effect of Mn2+ was systemically studied, and combined with the DFT simulation and the experimental and DFT evidence about the work of Mn2+ were addressed, which can provide a theoretical basis for the control of RO membrane fouling exacerbated by Mn2+ and post a good case about the combination of simulation and experimentation in membrane fouling studies.

2. Materials and Methods

2.1. Chemicals and Materials

The following chemicals were used directly without further purification. BSA and HA were obtained from Sigma-Aldrich, St. Louis, MI, USA. SA manganese chloride tetrahydrate, sodium chloride, and sodium hydroxide were purchased from Shanghai McLean Biochemical Technology Co., Shanghai, China. Hydrochloric acid was purchased from Sinopharm Chemical Reagent Co., Shanghai, China. Ultrapure water (18.2 mΩcm) was obtained by Millipore Ultrapure Water Systems (Millipore, Boston, MA, USA).
The RO membrane (BW30) was purchased from The Dow Chemical Company, Midland, TX, USA. The nylon filter membrane (0.7 μm) was purchased from Membrane Solutions, Nantong, China.

2.2. Preparation of Reserve Reagent

Preparation of BSA solution: 1 g of BSA powder was dissolved in 1 L of ultrapure water and stirred for 24 h to fully dissolve it and obtain 1 g/L BSA reserve solution, which was stored at 4 °C.
Preparation of HA solution: 1 g of HA powder was dissolved in a 0.1 M NaOH so-lution, stirred continuously for 24 h, filtered with 0.7 μm membrane, adjusted the pH to neutral, and fixed to 1 L to obtain 1 g/L HA reserve solution, which was stored at 4 °C.
SA solution preparation: 1 g of SA powder was dissolved in 1 L of ultrapure water and stirred for 24 h to fully dissolve it and obtain 1 g/L SA reserve solution, which was stored at 4 °C.
Preparation of MnCl2 solution: 19.791 g of manganese chloride tetrahydrate was dissolved in 1 L of ultrapure water to obtain 100 mM MnCl2 reserve solution, which was stored at 4 °C.

2.3. Design of Experiments

Two series of experiments were carried out in this work (Table 1). In series 1, the organic matter concentration was set to 50 mg/L, and the Mn2+ concentration was set to 0, 0.01, 0.05, 0.1, 0.5, 0.8, 1, 2, 5, 8, and 10 mM, respectively.
Feed water preparation: According to the pollutant concentration setting, the organic matter reserve solution, MnCl2, and ultrapure water were stirred thoroughly to obtain 2.5 L of the feed solution. Finally, 1.461 g of sodium chloride solution was added to give an ionic strength of 10 mM; the pH value of the solution was between 6.22 and 6.85 without pH adjustment.

2.4. RO Membrane Filtration Experiment

The membrane pool area is 24 cm2, the filtration pressure range is 1–60 bar, and the working temperature range is 0–80 °C. The principle of the high-pressure flat membrane experimental equipment is shown in Figure 1. The inlet solution enters the RO membrane pool after adjusting the temperature in the cryostat, and the high-pressure pump can provide the required pressure. Then, the water flowing out from the RO membrane pool is weighed with a balance and flows back into the inlet pool.
To ensure the accuracy of the experiments, three RO systems were used to carry out the same experiments simultaneously. The specific parameters of the RO equipment are shown in Table 1. The RO membranes were preserved in 1% NaHSO3 solution immersed at 4 °C, rinsed with deionized water, and soaked for 48 h before use. During the experiment, the membrane was cut into a rectangle of 4 cm × 6 cm and put into the membrane pool. when the simulated feed water was introduced, the concentrated water reflux mode was adopted, and the ultrapure water was first filtered for 12 h with a pressure of 12 bar. Then, under the premise that the flux was kept stable, the feed water was replaced with 500 mg/L NaCl solution. It continued to run for 2 h to make the membrane fully compacted, during which the desalination rate was determined using the conductivity of the feed water and the effluent. If it was greater than 85%, the membrane was deemed fully compacted. After preparing the above work, the solution in the water inlet tank is replaced with the reserve solution. After the preliminary experimental simulation, there was a significant decline in water flux after 6 h of operation, so the experimental membrane filtration time in this work was set to 6 h.
The membrane permeate flux (J, m3/(m·s2)) was calculated as follows (Equation (1)):
J = Δ m / ( 60 × 10 ) ρ · A · 100
where A is the effective membrane area (cm2), ρ is the density of produced water (g/cm3), and Δm is the product water quality per 10 min (g/min).
The initial flux at the starting phase of the fouling period (5 min) is known as J0. J/J0, on behalf of the flux ratio at any moment during the experiment, was identified as the normalized flux [9].

2.5. RO Membrane Characterization

The plugged RO membrane was removed from the flat membrane module, cut into 0.5 cm × 0.5 cm sizes, and placed at room temperature to dry for at least 24 h at the end of the membrane plugging experiment. The membrane surface was characterized using SEM/EDS.

2.6. The Density Functional Theory (DFT) Calculations

The density functional theory (DFT) calculations were carried out with the VASP code [23]. The Perdew–Burke–Ernzerhof (PBE) function of the generalized gradient approximation (GGA) [24] was used to process the exchange–correlation. The projector augmented-wave pseudopotential (PAW) [25] was applied with a kinetic energy cut-off of 500 eV, which was utilized to describe the expansion of the electronic eigenfunctions. The vacuum thickness was set to 25 Å to minimize interlayer interactions. The Brillouin zone integration was sampled using a Γ-centered 5 × 5 × 1 Monkhorst–Pack k-point. All atomic positions were fully relaxed until the energy and force reached a tolerance of 1 × 10⁻⁵ eV and 0.03 eV/Å, respectively. The dispersion-corrected DFT-D method was employed to consider the long-range interactions [26].
The binding energy (Ebind) of a complex formed between two molecules, A and B, can be calculated using the following equation (Equation (2)):
Ebind = Ecomplex − (EA + EB)
where Ecomplex is the total energy of the molecular complex of A and B; EA and EB are the total energies of isolated molecules A and B, respectively.

3. Results and Discussion

3.1. Effect of Mn2+ on RO Membrane Fouling Caused by HA

The change in water flux is the most direct indicator of membrane fouling. The effect of different Mn2+ concentrations on the HA fouling when the HA concentration is 50 mg/L is shown in Figure 2. When there is only HA in the feed water, the water flux of the RO membrane only decreases by 4.7% after 6 h of operation, which indicates that HA alone does not cause significant fouling of the RO membrane. Li et al. [7], in their study of RO membrane fouling with HA and silicon, found no significant change in water flux when the HA concentration was 50 mg/L, consistent with this study. It has also been found that the water flux remained insignificant at HA concentrations of 10–90 mg/L [27]. With the increase in the Mn2+ concentration, the water flux began to decrease significantly. When the Mn2+ concentration was 0.01, 0.05, and 0.1 mM, the decrease in the water flux was small, only 8.3–9.0%. But when the concentration increased to 0.5 mM, the water flux showed a notable decrease of 21.6%. Finally, when the Mn2+ concentration was 10 mM, the water flux decreased by 42.7%. Overall, HA itself had no significant effect on RO membrane fouling. However, the addition of Mn2+ exacerbated RO membrane HA fouling and increased the degree of membrane fouling as the concentration of Mn2+ increased, producing a synergistic contamination effect between the two pollutants, which is similar to that of the currently known roles of Ca2+ and Mg2+ in the HA fouling [28,29].
To further investigate the effect pattern of Mn2+ on the HA fouling of the RO membrane, the morphology of the RO membrane was examined using SEM, while the HA concentration was 50 mg/L (Figure 3). The surface of the unfouled RO membrane was rougher with obvious fiber structure and dense voids, and the membrane fouling was only caused by HA, which had a reduced fiber structure and roughness compared to the pristine membrane but still had more voids [30]. With the increase in Mn2+ concentration, the surface of the RO membrane was gradually covered by Mn2+-HA fouling, and the membrane morphology also showed a large difference. Even if the Mn2+ concentration is 0.01 mM, a layer of fouling can be seen on the membrane. When the Mn2+ concentration increased to 0.05 mM and 0.1 mM, the membrane surface roughness was further reduced but still retained some pore structure. However, until the Mn2+ concentration increased to 0.5 mM, the thickness of the fouling on the membrane increased significantly, and the void structure completely disappeared; meanwhile, the membrane fouling significantly increased, which is consistent with the change in water flux. With the further increase in Mn2+ concentration, the fouling accumulated on the membrane was thicker and denser. In addition, with the increase in Mn2+ concentration, more severe Mn2+ fouling on the membrane surface was also present in the corresponding EDS patterns.

3.2. Effect of Mn2+ on RO Membrane Fouling Caused by SA

When the SA concentration was 50 mg/L, the effect of different Mn2+ concentrations on the SA fouling of the RO membrane was as shown in Figure 4. When only SA was in the feed water, the water flux decreased by about 10.6% after 6 h of operation, and the degree of fouling was higher than that of HA, mainly because SA could form a three-dimensional reticulation colloid [31], which resulted in more serious membrane fouling. Unlike HA, a significant decrease in water flux was observed when the Mn2+ concentration was only 0.05 mM. With the increase in Mn2+ concentration, the water flux further dropped until the water flux decreased by 64.5% when the Mn2+ concentration reached 10 mM. The interaction between Mn2+ and SA molecules is stronger than HA, and the presence of Mn2+ greatly enhances the strength of SA molecules binding to each other, exacerbating membrane fouling. Mn2+ may play a bridging role in SA, bridging the two-dimensional SA structure into a larger structure of three-dimensional pollutants and accumulating in the membrane.
When the concentration of SA was 50 mg/L, the effect of Mn2+ concentration on RO membrane morphology is shown in Figure 5. Compared with the unfouled pristine RO membrane, the membrane fouling caused by SA alone was visibly clogged, with a small number of spherical projections on the membrane surface. As the Mn2+ concentration increased to 0.8 mM, the density of spherical projections increased, but the roughness of the membrane surface decreased. However, when the Mn2+ concentration increased from 1 mM to 10 mM, the spherical projections gradually disappeared, and a dense and smooth fouling layer was formed on the membrane surface, which led to a rapid decrease in water flux. The EDS mapping of Mn was further analyzed, and similar to the HA membrane fouling, the intensification of the SA membrane fouling was directly proportional to the distribution density of elemental Mn, which further proved the important role of Mn2+ in membrane fouling.

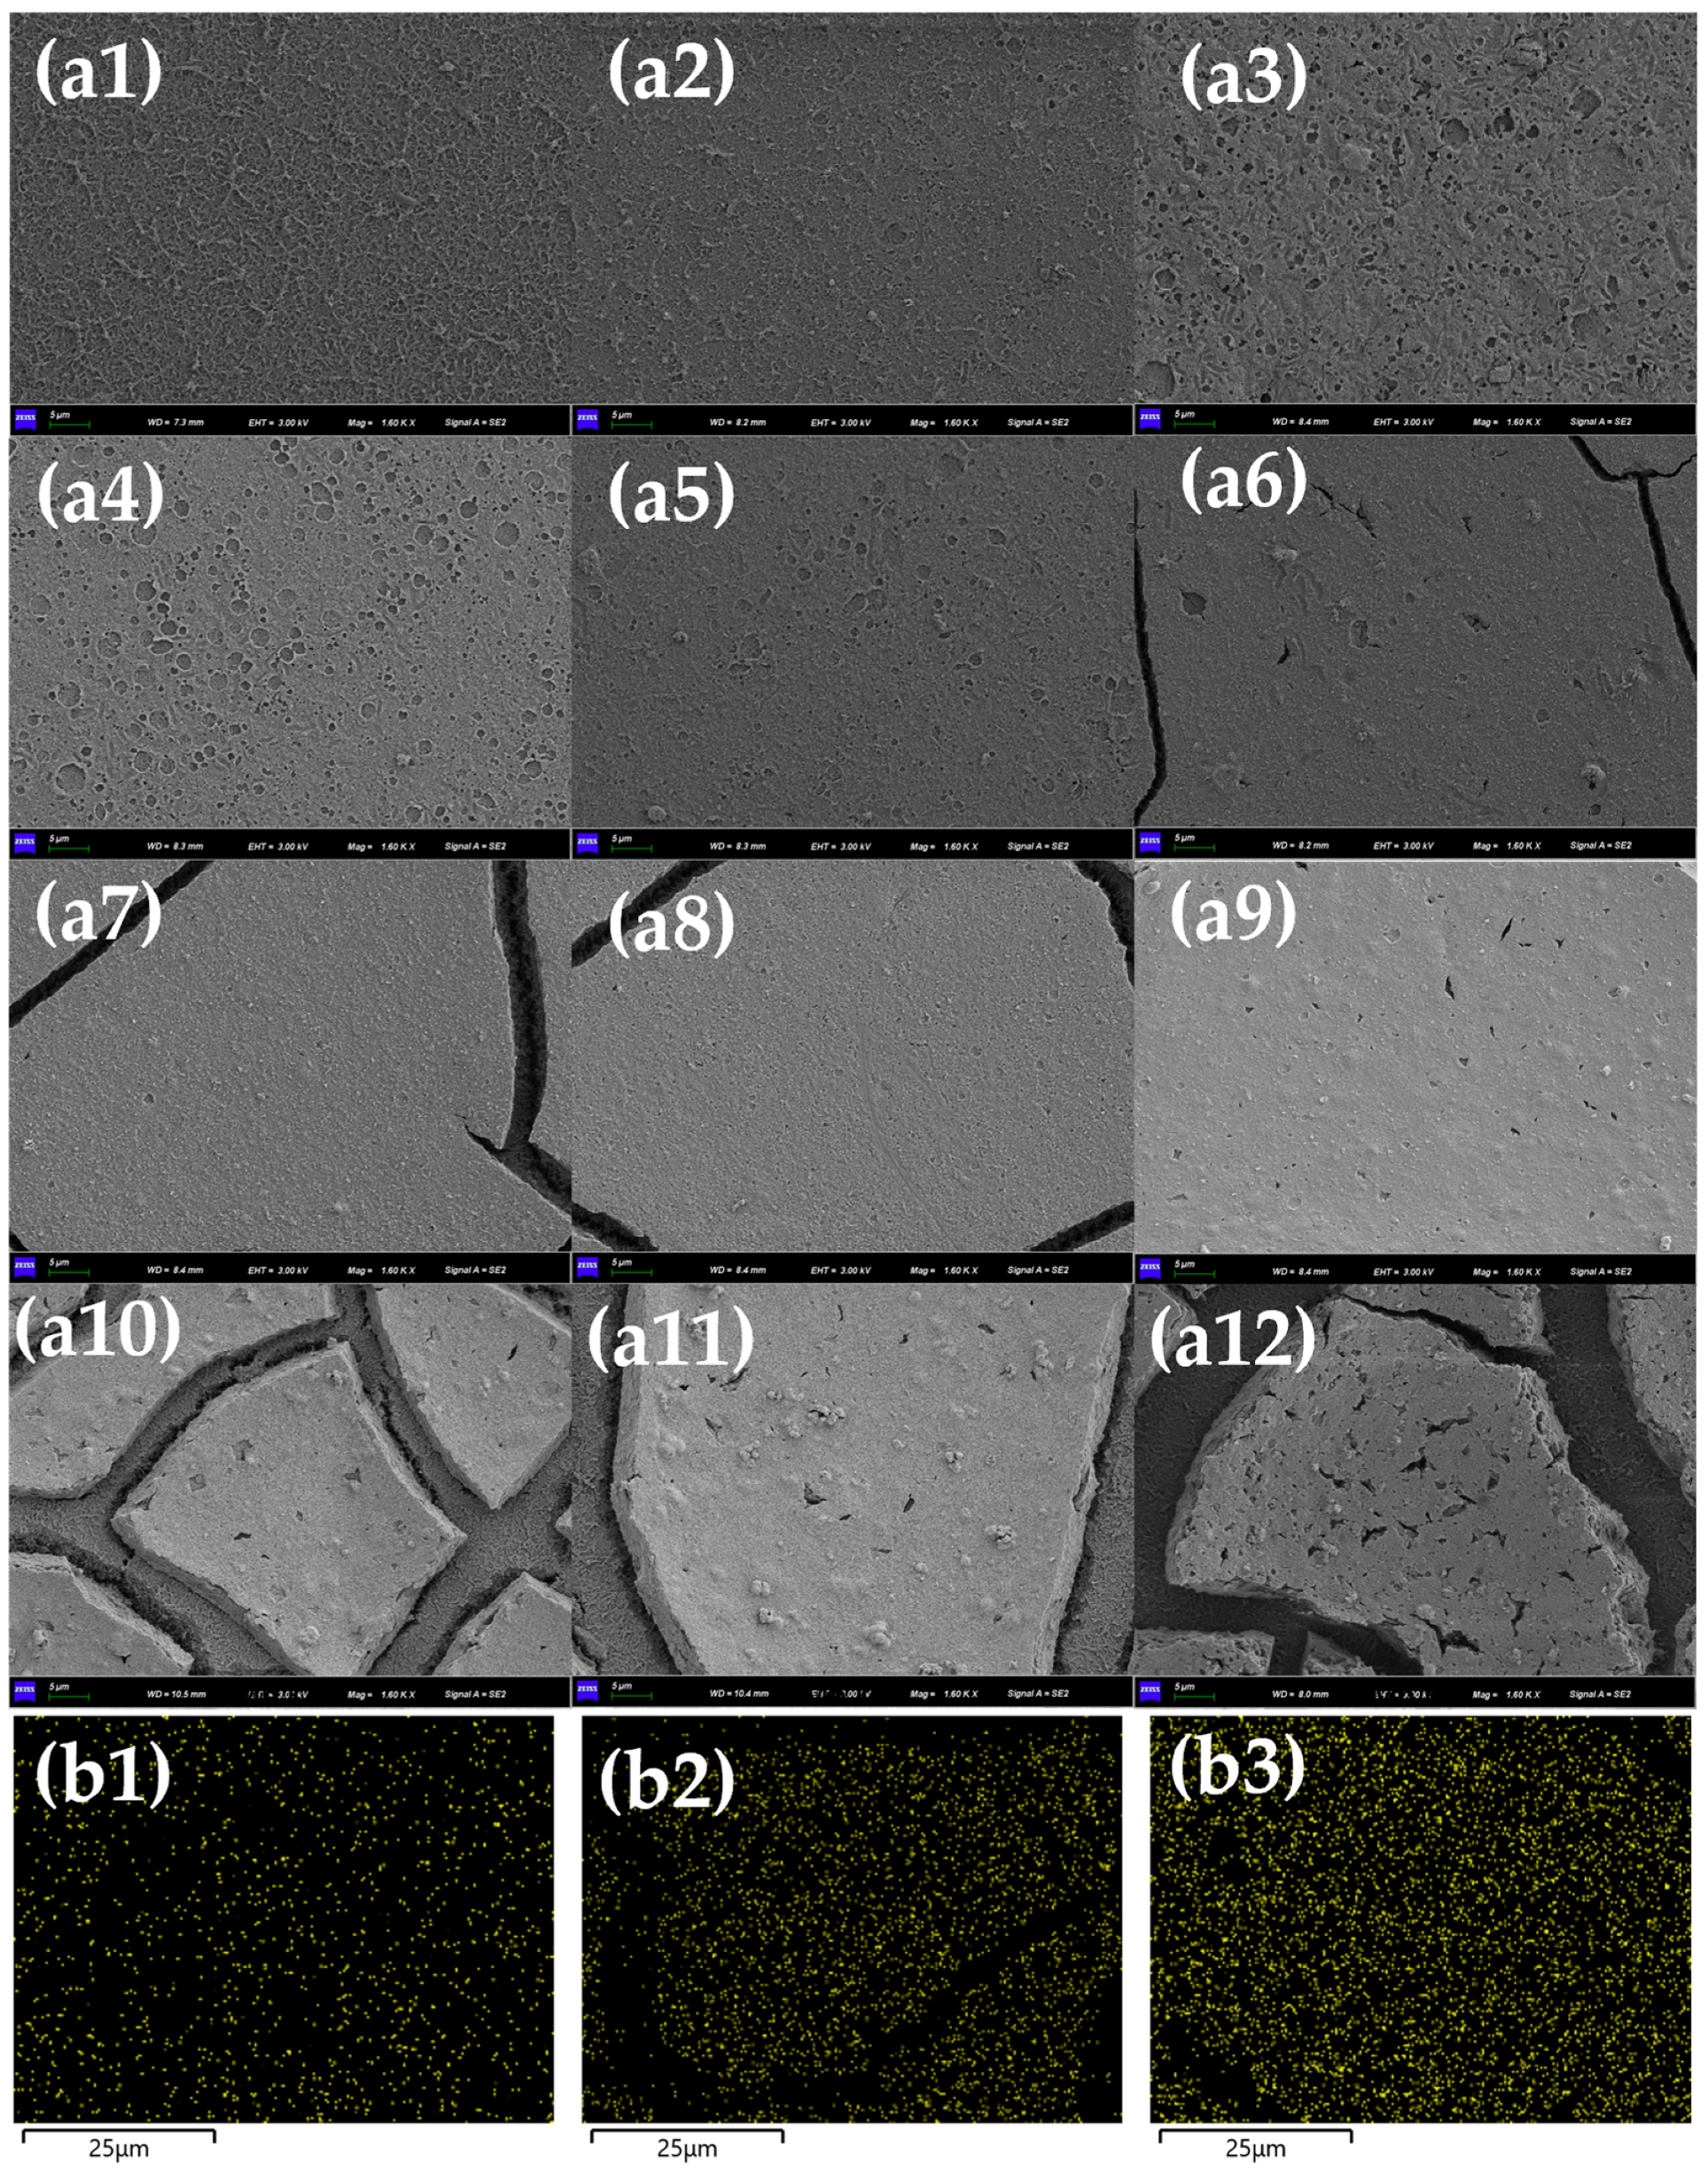
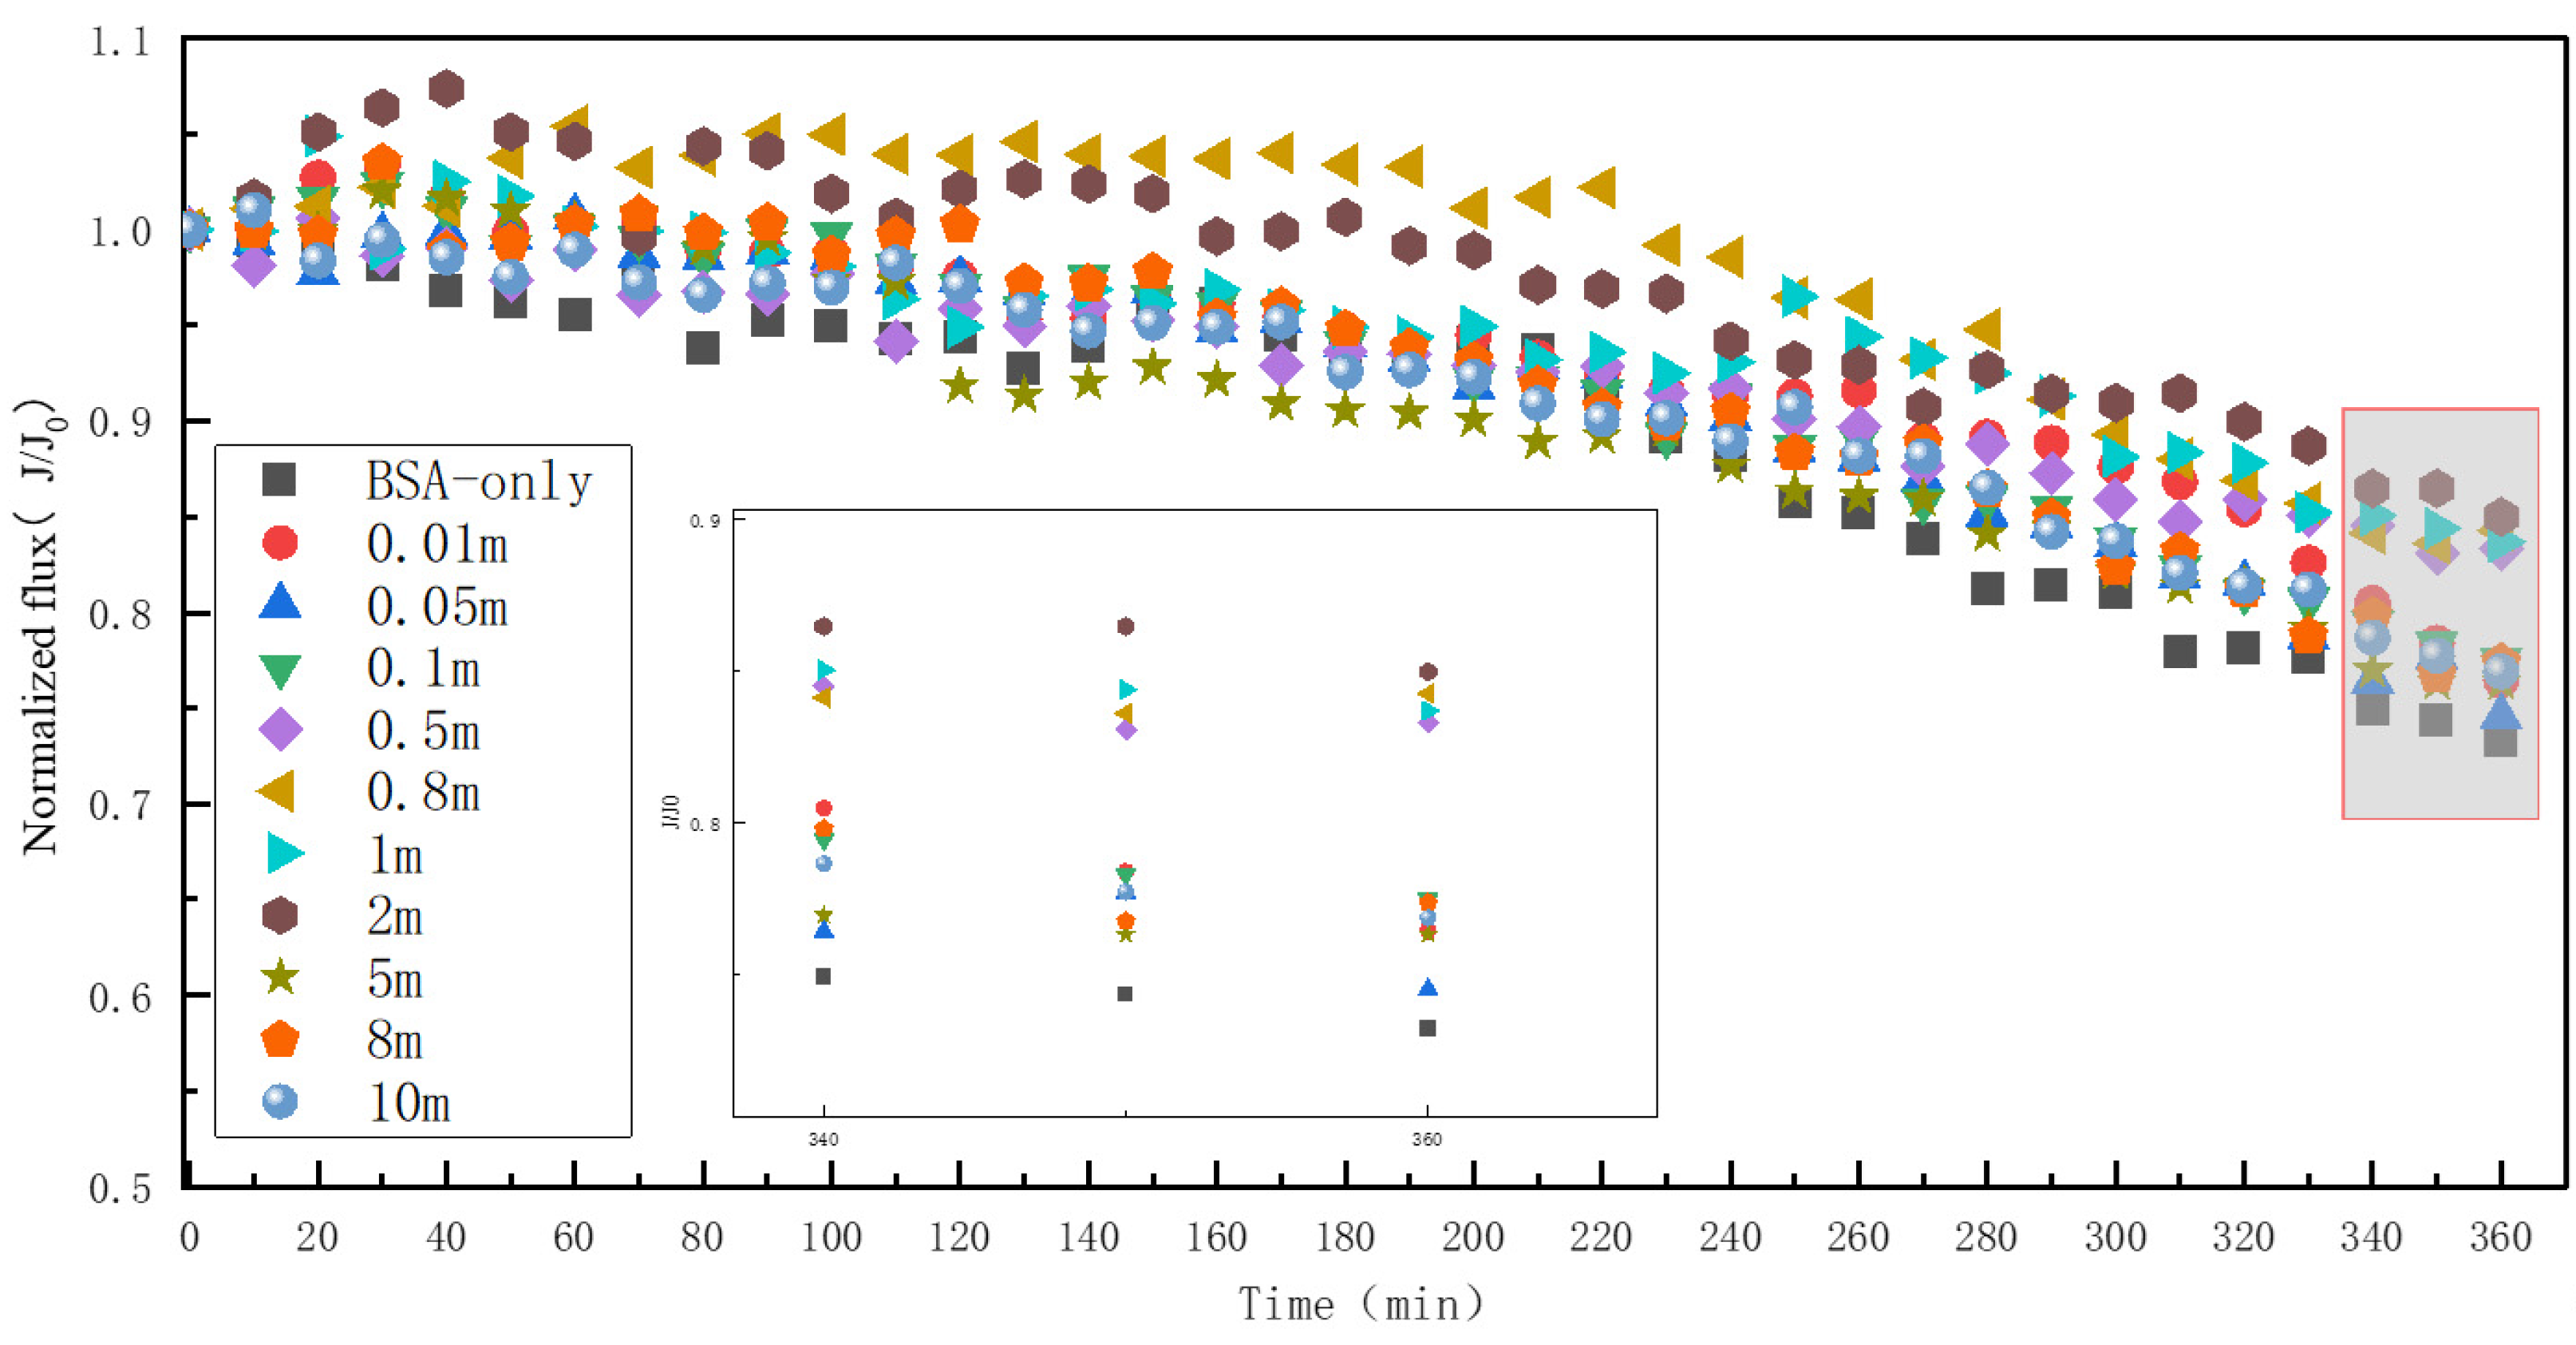
3.3. Effect of Mn2+ on RO Membrane Fouling by Caused BSA

The effect of different concentrations of Mn2+ on BSA fouling of RO membranes at a BSA concentration of 50 mg/L is shown in Figure 6. Different from HA and SA, the water flux decreased by 26.8% when there was only 50 mg/L of BSA within the feed water, and the membrane fouling was the most serious. As the concentration of Mn2+ increased, the membrane fouling showed a slow recovery until the concentration of 2 mM, and the water flux recovered by 11%. But, when the concentration continued to increase to 5 mM, the water flux decreased by about 8.6%, remained stable and did not change with the increase in the concentration of Mn2+. It is possible that when only BSA was present, the BSA molecules aggregated with each other through the cross-linking disulfide bonds [32], causing membrane fouling.
Figure 7a shows the RO morphology under BSA fouling. After filtering 50 mg/L BSA solution, the membrane was covered with a porous BSA membrane, and although the water channels on the RO membrane were covered by the BSA pollutant, its porous characteristics still ensured a sizable water flux (73.2%). With the increase in Mn2+ concentration to 2 mM, the pores on the surface of the fouled membrane gradually increase, explaining the phenomenon of water flux increase. Afterward, the Mn2+ concentration further increased to 10 mM, the pores on the membrane gradually decreased, the membrane thickness increased, and the water flux decreased, though it was still higher than the case of 50 mg/L BSA fouling alone. The results of the EDS mapping analysis of Mn elements on the membrane surface are shown in Figure 6b, and the distribution density of Mn elements has nothing to do with the membrane fouling and the Mn2+ concentration in the feed water; there is no interaction between Mn2+ and BSA.
This difference in BSA fouling may be because Mn2+ exacerbates the salting-out phenomenon. Mo et al. [33] found a similar phenomenon for Mg2+, which, because of its high charge density, causes a more significant salting-out effect. When BSA alone is present, membrane fouling is caused by the mutual aggregation of BSA molecules through the cross-linking disulfide bonds when membrane fouling is the most serious. On the other hand, with the addition of Mn2+, BSA is no longer aggregated, but a salting-out effect occurs, resulting in the deposition of individual BSA molecules on the membrane; the fouling layer remains porous, although the fouling layer is thickened.

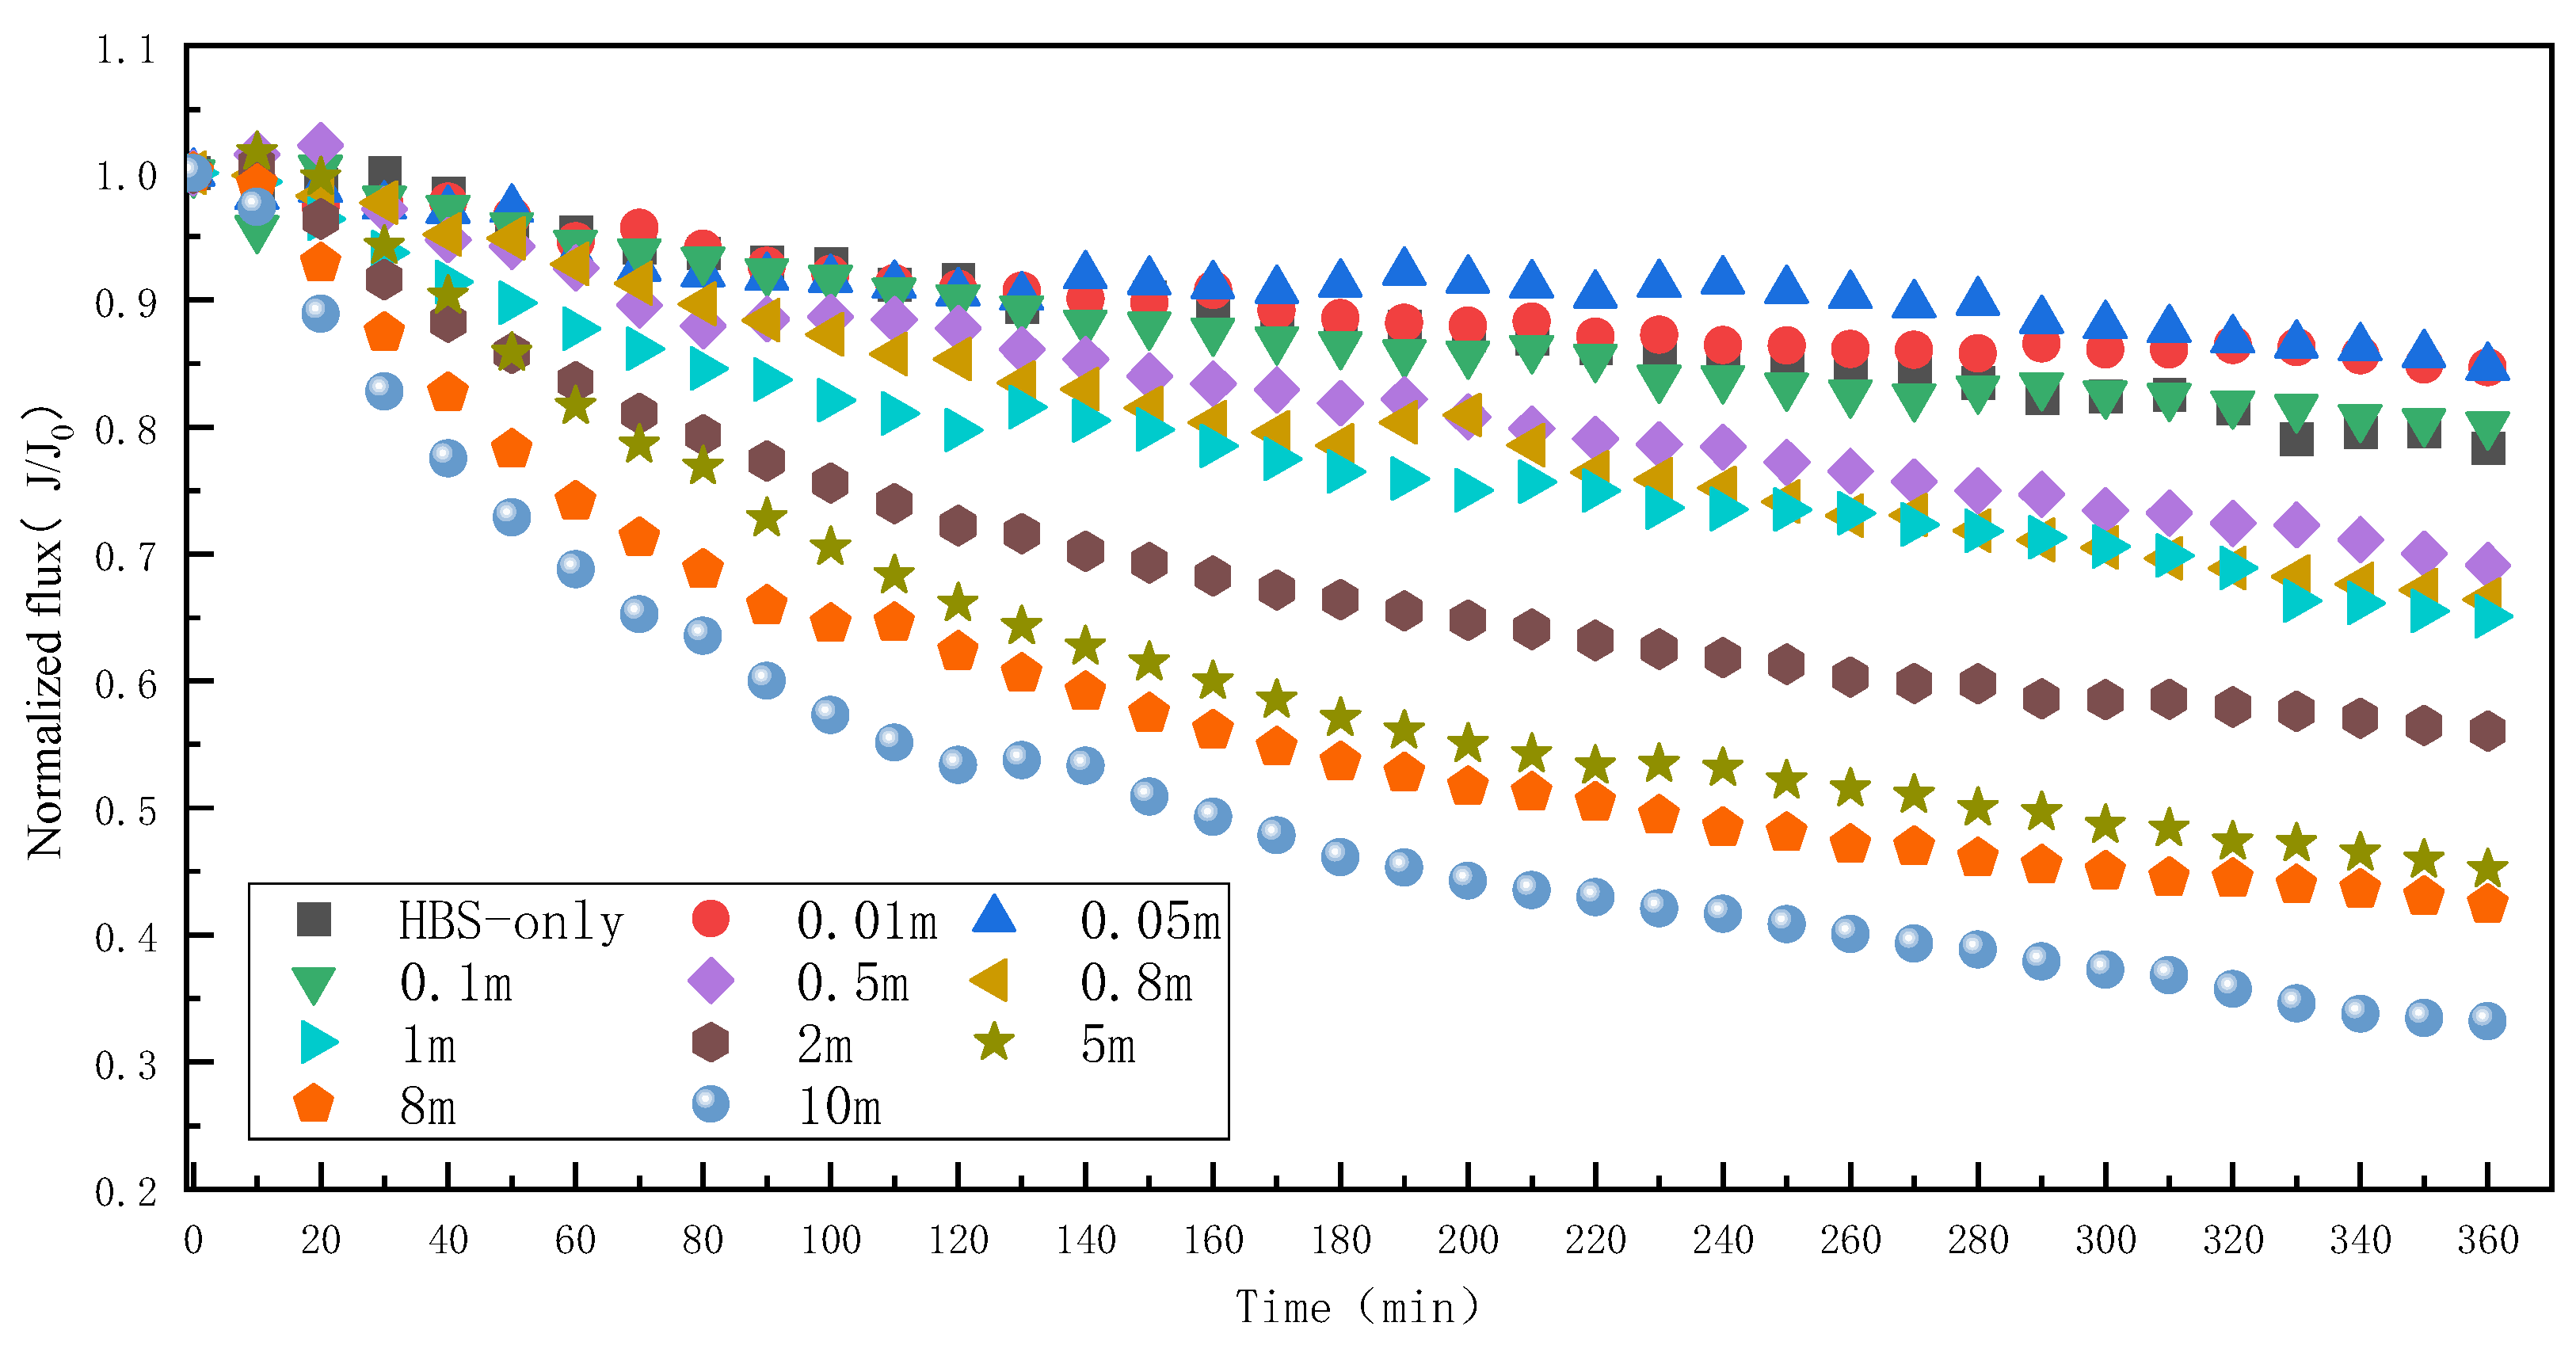
3.4. Effect of Mn2+ on RO Membrane Fouling Caused by HBS

When the concentration of HBS was 50 mg/L (20 mg/L HA + 15 mg/L BSA + 15 mg/L SA), the effects of different concentrations of Mn2+ on RO membrane fouling were as shown in Figure 8. Compared with HA, SA, and BSA, the membrane fouling caused by HBS combines the characteristics of the three pollutants. When only HBS was present in the RO system, the water flux decreased by about 21.7%, similar to that in the presence of only BSA. Existing studies have found that when HA and BSA are present in the system, the two organisms will aggregate regardless of the presence of multivalent ions [22], and at this time the decrease in water flux may be due to the interaction of HA-BSA or the action of BSA alone. However, when the Mn2+ concentration in the system increased from 0 to 0.1 mM, the water flux gradually recovered, similar to the fouling characteristics of BSA in the previous text. This may be due to the limited interaction between organic matter and Mn2+ at a low Mn2+ concentration, and the membrane fouling is mainly dominated by BSA. When the Mn2+ concentration increased to 0.5 mM, there was a significant decrease in water flux, and this critical concentration was consistent with that of HA fouling. The water flux decreased rapidly with the increase in Mn2+ concentration, and this decrease rate was characterized by SA fouling. When the Mn2+ concentration reached 10 mM, the water flux decreased by 66.8%, which is the maximum decrease value in this work. The above results showed that Mn2+ exacerbated the membrane fouling caused by HBS, and the degree of membrane fouling caused by the mixture of the three organics was much higher than those caused by any organics.
The SEM image of the RO membrane is shown in Figure 9a. The surface of the membrane foul with 50 mg/L HBS was covered by a layer of fluffy and porous fouling, which was similar to the morphology of the membrane fouling caused by BSA alone. With the increase in Mn2+ concentration from 0 mM to 0.1 mM, the pore space of the fouled layer on the membrane increased and became fluffier, which was characterized by obvious BSA fouling and was consistent with the change rule of water flux, indicating that the fouling of the HBS membrane was dominated by BSA when the Mn2+ concentration level was low. With the further increase in Mn2+ concentration, the fouled layer became smooth and dense, with the morphological characteristics of HA and SA membrane fouling at the same time, and the change rule of water flux remained consistent. At the same time, the EDS mapping (Figure 8b) of elemental Mn also showed that the distribution density of elemental Mn on the RO membrane increased with the increase in membrane fouling. It further illustrated that the presence of Mn2+ exacerbated the HBS fouling of the RO membrane.

3.5. Validation Using DFT

The effect of Mn2+ on RO membrane fouling caused by different organic matter varies widely. Influenced by manganese ions, the mixture of SA, HA, and BSA caused the most significant RO membrane fouling, followed by SA and HA, whereas BSA appeared to be unaffected by manganese ions, with the main fouling coming from BSA itself. This is quite different from the role of the Ca2+ and Mg2+. Without having to do additional characterization experiments, DFT calculations are a great tool that can be used to validate and interpret this result.
In the realm of Mn2+ interactions with organic compounds, the ability of Mn2+ to engage in multiple coordination bonds with various oxygen-containing functional groups within these organic molecules plays a pivotal role. Among these functional groups, carboxyl groups, often carrying a negative charge, exhibit a notably heightened affinity for manganese ions. This discrepancy in binding strength stems from the differences in the chemical structure and functionalities of the organic molecules, which, in turn, influence the intensity of their interactions with Mn2+.
Coordination bonds, the focal point of this interplay, refer to the interactions between Mn2+ and one or more ligands, typically atoms or molecules with unpaired electrons, facilitated by sharing electron pairs to form chemical bonds. Mn2+ can form multiple coordination bonds due to possessing numerous unpaired electron pairs.
When Mn2+ associates with organic compounds, they can establish coordination bonds with oxygen-containing functional groups present in these substances. These functional groups encompass carboxyl (-COOH) and hydroxyl (-OH), oxygen atoms in sugar rings, and glycosidic bonds. The interaction between Mn2+ and these groups is achieved by sharing electron pairs. Notably, carboxyl groups bearing negative charges emerge as particularly effective functional groups in this context due to the presence of electron-rich oxygen atoms within their carboxyl groups. That is why carboxyl groups tend to bind more readily to manganese ions than other functional groups.
The capacity of Mn2+ to form complexes with -COOH of different types of organic matter obtained via DFT calculations (Figure 10) agrees with the experimental results; thus, the order is HBS > SA > HA > BSA. BAS has the highest energy (−55.7 kJ/mol) for stabilizing structures, which predicts that BSA binding to Mn2+ is the most unstable compared to the other three organics. The BSA carboxylate group also has the largest bond length (2.538–2.574 Å) with Mn2+, showing the weakest interaction force. As a result, BSA and Mn2+ bind to a limited extent.

4. Conclusions

The presence of Mn2+ enhanced the aggregation of HA, SA, and HBS, thereby leading to deposition on the membrane surface and causing more severe membrane fouling. When the Mn2+ concentration was 0.5 mM and 0.05 mM separately, the membrane fouling caused by HA and SA began to become significant, while with HBS fouling only, the water flux decreased significantly by about 21.7%, and decreased further with increasing Mn2+ concentrations. However, Mn2+ has no direct effect on BSA. The degrees to which Mn2+ affected membrane fouling were in the order HBS > SA > HA > BSA, which was confirmed via DFT calculations. In modeling the reaction of the complexation of Mn with these three types of organics, BSA has the highest energy (−55.7 kJ/mol), which predicts that BSA binding to Mn2+ is the most unstable; compared to the other three organics, the BSA carboxylate group also has the largest bond length (2.538–2.574 Å) with Mn2+, showing the weakest interaction force. This study provides a theoretical basis for the control of RO membrane fouling exacerbated by Mn2+.
This study explores the feasibility of using DFT calculations to interpret the experimental results. Although better results were obtained, the DFT results can only be used as a reference; the results still need to be analyzed in depth in conjunction with other data in the next study.

Author Contributions

Q.G.: Conceptualization, Methodology, Writing—Original Draft, and Formal Analysis. L.D.: Conceptualization, Methodology, Resources, Supervision, Writing—Review and Editing, and Funding Acquisition. Y.J.: Data Curation. H.Z.: Data Curation. J.L.: Writing—Review and Editing. W.Y.: Writing—Review and Editing. All authors have read and agreed to the published version of the manuscript.

Funding

This work was financially supported by the Special Fund for Basic Scientific Research Business of Central Public Research Institutes (2022YSKY-14).

Institutional Review Board Statement

Not applicable.

Data Availability Statement

The data presented in this study are available on request from the corresponding author.

Conflicts of Interest

The authors declare that they have no known competing financial interests or personal relationships that could have appeared to influence the work reported in this paper.

References

  1. Cheng, J.; Shi, F.; Yi, J.; Fu, H. Analysis of the factors that affect the production of municipal solid waste in China. J. Clean. Prod. 2020, 259, 120808. [Google Scholar] [CrossRef]
  2. Wu, J.; Zhang, H.; He, P.-J.; Shao, L.-M. Insight into the heavy metal binding potential of dissolved organic matter in MSW leachate using EEM quenching combined with PARAFAC analysis. Water Res. 2011, 45, 1711–1719. [Google Scholar] [CrossRef] [PubMed]
  3. Ramaswami, S.; Behrendt, J.; Otterpohl, R. Comparison of NF-RO and RO-NF for the Treatment of Mature Landfill Leachates: A Guide for Landfill Operators. Membranes 2018, 8, 17. [Google Scholar] [CrossRef] [PubMed]
  4. Liu, J.; Duan, L.; Gao, Q.; Zhao, Y.; Gao, F. Removal of Typical PPCPs by Reverse Osmosis Membranes: Optimization of Treatment Process by Factorial Design. Membranes 2023, 13, 355. [Google Scholar] [CrossRef]
  5. Sir, M.; Podhola, M.; Patocka, T.; Honzajková, Z.; Kocurek, P.; Kubal, M.; Kuraš, M. The effect of humic acids on the reverse osmosis treatment of hazardous landfill leachate. J. Hazard. Mater. 2012, 207, 86–90. [Google Scholar] [CrossRef]
  6. Peters, T.A. Purification of landfill leachate with reverse osmosis and nanofiltration. Desalination 1998, 119, 289–293. [Google Scholar] [CrossRef]
  7. Li, D.; Lin, W.; Shao, R.; Shen, Y.-X.; Zhu, X.; Huang, X. Interaction between humic acid and silica in reverse osmosis membrane fouling process: A spectroscopic and molecular dynamics insight. Water Res. 2021, 206, 117773. [Google Scholar] [CrossRef]
  8. Zhang, M.; Hong, H.; Lin, H.; Shen, L.; Yu, H.; Ma, G.; Chen, J.; Liao, B.-Q. Mechanistic insights into alginate fouling caused by calcium ions based on terahertz time-domain spectra analyses and DFT calculations. Water Res. 2018, 129, 337–346. [Google Scholar] [CrossRef]
  9. Tong, X.; Zhao, X.-H.; Wu, Y.-H.; Bai, Y.; Ikuno, N.; Ishii, K.; Hu, H.-Y. The molecular structures of polysaccharides affect their reverse osmosis membrane fouling behaviors. J. Membr. Sci. 2021, 625, 118984. [Google Scholar] [CrossRef]
  10. Xin, Y.; Bligh, M.W.; Kinsela, A.S.; Waite, T.D. Effect of iron on membrane fouling by alginate in the absence and presence of calcium. J. Membr. Sci. 2016, 497, 289–299. [Google Scholar] [CrossRef]
  11. Teng, J.; Chen, Y.; Ma, G.; Hong, H.; Sun, T.; Liao, B.-Q.; Lin, H. Membrane fouling by alginate in polyaluminum chloride (PACl) coagulation/microfiltration process: Molecular insights. Sep. Purif. Technol. 2020, 236, 116294. [Google Scholar] [CrossRef]
  12. Long, Y.; Yu, G.; Dong, L.; Xu, Y.; Lin, H.; Deng, Y.; You, X.; Yang, L.; Liao, B.-Q. Synergistic fouling behaviors and mechanisms of calcium ions and polyaluminum chloride associated with alginate solution in coagulation-ultrafiltration (UF) process. Water Res. 2021, 189, 116665. [Google Scholar] [CrossRef] [PubMed]
  13. Hao, Y.; Moriya, A.; Ohmukai, Y.; Matsuyama, H.; Maruyama, T. Effect of metal ions on the protein fouling of hollow-fiber ultrafiltration membranes. Sep. Purif. Technol. 2013, 111, 137–144. [Google Scholar] [CrossRef]
  14. Yin, Z.; Shao, Q.; Wen, T.; Li, A.; Long, C. Insights into the coupling pre-ozonation with coagulation pre-treatment for mitigating biopolymer fouling of reverse osmosis membrane: Role of Ca2+. J. Membr. Sci. 2021, 639, 119768. [Google Scholar] [CrossRef]
  15. Beinabaj, S.M.H.; Heydariyan, H.; Aleii, H.M.; Hosseinzadeh, A. Concentration of heavy metals in leachate, soil, and plants in Tehran’s landfill: Investigation of the effect of landfill age on the intensity of pollution. Heliyon 2023, 9, e13017. [Google Scholar] [CrossRef]
  16. Kaiya, Y.; Itoh, Y.; Fujita, K.; Takizawa, S. Study on fouling materials in the membrane treatment process for potable water. Desalination 1996, 106, 71–77. [Google Scholar] [CrossRef]
  17. Tang, X.; Zhu, X.; Huang, K.; Wang, J.; Guo, Y.; Xie, B.; Li, G.; Liang, H. Can ultrafiltration singly treat the iron—And manganese-containing groundwater? J. Hazard. Mater. 2021, 409, 124983. [Google Scholar] [CrossRef]
  18. Tang, X.; Wang, J.; Zhang, H.; Yu, M.; Guo, Y.; Li, G.; Liang, H. Respective role of iron and manganese in direct ultrafiltration: From membrane fouling to flux improvements. Sep. Purif. Technol. 2021, 259, 118174. [Google Scholar] [CrossRef]
  19. Choo, K.H.; Lee, H.; Choi, S.J. Iron and manganese removal and membrane fouling during UF in conjunction with prechlorination for drinking water treatment. J. Membr. Sci. 2005, 267, 18–26. [Google Scholar] [CrossRef]
  20. Gray, S.; Ritchie, C.; Tran, T.; Bolto, B. Effect of NOM characteristics and membrane type on microfiltration performance. Water Res. 2007, 41, 3833–3841. [Google Scholar] [CrossRef]
  21. Tu, Q.; Ibrahimi, W.; Ren, S.; Wu, J.; Li, S. A Molecular Dynamics Study on Rotational Nanofluid and Its Application to Desalination. Membranes 2020, 10, 117. [Google Scholar] [CrossRef] [PubMed]
  22. Myat, D.T.; Stewart, M.B.; Mergen, M.; Zhao, O.; Orbell, J.D.; Gray, S. Experimental and computational investigations of the interactions between model organic compounds and subsequent membrane fouling. Water Res. 2014, 48, 108–118. [Google Scholar] [CrossRef] [PubMed]
  23. Kresse, G.; Furthmuller, J. Efficiency of ab-initio total energy calculations for metals and semiconductors using a plane-wave basis set. Comp. Mater. Sci. 1996, 6, 15–50. [Google Scholar] [CrossRef]
  24. Perdew, J.P.; Burke, K.; Ernzerhof, M. Generalized gradient approximation made simple. Phys. Rev. Lett. 1996, 77, 3865. [Google Scholar] [CrossRef]
  25. Blochl, P.E. Projector Augmented-wave method. Phys. Rev. B 1994, 50, 17953–17979. [Google Scholar] [CrossRef]
  26. Grimme, S. Semiempirical GGA-type density functional constructed with a long-range dispersion correction. J. Comput. Chem. 2006, 27, 1787–1799. [Google Scholar] [CrossRef]
  27. Zhao, X.; Wu, Y.; Zhang, X.; Tong, X.; Yu, T.; Wang, Y.; Ikuno, N.; Ishii, K.; Hu, H. Ozonation as an efficient pretreatment method to alleviate reverse osmosis membrane fouling caused by complexes of humic acid and calcium ion. Front. Environ. Sci. Eng. 2019, 13, 55. [Google Scholar] [CrossRef]
  28. Ye, W.; Bernstein, N.J.; Lin, J.; Jordens, J.; Zhao, S.; Tang, C.Y.; Van der Bruggen, B. Theoretical and experimental study of organic fouling of loose nanofiltration membrane. J. Taiwan Inst. Chem. E 2018, 93, 509–518. [Google Scholar] [CrossRef]
  29. Wang, L.-F.; He, D.-Q.; Chen, W.; Yu, H.-Q. Probing the roles of Ca2+ and Mg2+ in humic acids-induced ultrafitltration membrane fouling using an integrated approach. Water Res. 2015, 81, 325–332. [Google Scholar] [CrossRef]
  30. Wang, S.; Xiao, K.; Huang, X. Characterizing the roles of organic and inorganic foulants in RO membrane fouling development: The case of coal chemical wastewater treatment. Sep. Purif. Technol. 2019, 210, 1008–1016. [Google Scholar] [CrossRef]
  31. Bar-Zeev, E.; Passow, U.; Castrillón, S.R.-V.; Elimelech, M. Transparent Exopolymer Particles: From Aquatic Environments and Engineered Systems to Membrane Biofouling. Environ. Sci. Technol. 2015, 49, 691–707. [Google Scholar] [CrossRef] [PubMed]
  32. Kelly, S.T.; Zydney, A.L. Mechanisms for BSA fouling during microfiltration. J. Membr. Sci. 1995, 107, 115–127. [Google Scholar] [CrossRef]
  33. Mo, H.; Tay, K.G.; Ng, H.Y. Fouling of reverse osmosis membrane by protein (BSA): Effects of pH, calcium, magnesium, ionic strength and temperature. J. Membr. Sci. 2008, 315, 28–35. [Google Scholar] [CrossRef]
Figure 1. Schematic diagram of reverse osmosis experiment.
Membranes 13 00823 g001
Figure 2. Effect of different Mn2+ concentrations on RO membrane fouling caused by HA.
Membranes 13 00823 g002
Figure 3. (a) Morphology of RO membrane, concentration of HA = 50 mg/L, (a1a12): no-fouled RO membrane, HA + 0 mM Mn2+, HA + 0.01 mM Mn2+, HA + 0.05 mM Mn2+, HA + 0.1 mM Mn2+, HA + 0.5 mM Mn2+, HA + 0.8 mM Mn2+, HA + 1 mM Mn2+, HA + 2 mM Mn2+, HA + 5 mM Mn2+, HA + 8 mM Mn2+, and HA + 10 mM Mn2+; (b) EDS mapping of RO membrane, concentration of HA = 50 mg/L, (b1b3) HA + 0.05 mM Mn2+, HA + 1 mM Mn2+, and HA + 10 mM Mn2+.
Membranes 13 00823 g003
Figure 4. Effect of different Mn2+ concentrations on RO membrane fouling caused by SA.
Membranes 13 00823 g004
Figure 5. (a) Morphology of RO membrane, concentration of SA = 50 mg/L, (a1a12) unfouled RO membrane, SA + 0 mM Mn2+, SA + 0.01 mM Mn2+, SA + 0.05 mM Mn2+ SA + 0.1 mM Mn2+, SA + 0.5 mM Mn2+, SA + 0.8 mM Mn2+, SA + 1 mM Mn2+, SA + 2 mM Mn2+, SA + 5 mM Mn2+, SA + 8 mM Mn2+, and SA + 10 mM Mn2+; (b) EDS mapping of RO membrane, concentration of SA = 50 mg/L, (b1b3) SA + 0.05 mM, Mn2+ SA + 1 mM, Mn2+, and SA + 10 mM Mn2+.
Membranes 13 00823 g005
Figure 6. Effect of different Mn2+ concentrations on RO membrane fouling caused by BSA.
Membranes 13 00823 g006
Figure 7. (a) Morphology of RO membrane, concentration of BSA = 50 mg/L, (a1a12) unfouled RO membrane, BSA + 0 mM Mn2+, BSA + 0.01 mM Mn2+, BSA + 0.05 mM Mn2+, BSA + 0.1 mM Mn2+, BSA + 0.5 mM Mn2+, BSA + 0.8 mM Mn2+, BSA + 1 mM Mn2+, BSA + 2 mM Mn2+, BSA + 5 mM Mn2+, BSA + 8 mM Mn2+, and BSA + 10 mM Mn2+; (b) EDS mapping of RO membrane, concentration of BSA = 50 mg/L, (b1b3) BSA + 0.05 mM Mn2+, BSA + 1 mM Mn2+, and BSA + 10 mM Mn2+.
Membranes 13 00823 g007
Figure 8. Effect of different Mn2+ concentrations on RO membrane fouling caused by HBS.
Membranes 13 00823 g008
Figure 9. (a) Morphology of RO membrane, concentration of HBS = 50 mg/L, (a1a12) unfouled RO membrane, HBS + 0 mM Mn2+, HBS + 0.01 mM Mn2+, HBS + 0.05 mM Mn2+, HBS + 0.1 mM Mn2+, HBS + 0.5 mM Mn2+, HBS + 0.8 mM Mn2+, HBS + 1 mM Mn2+, HBS + 2 mM Mn2+, HBS + 5 mM Mn2+, HBS + 8 mM Mn2+, and HBS + 10 mM Mn2+; (b) EDS mapping of RO membrane, concentration of HBS = 50 mg/L, (b1b3) HBS + 0.05 mM Mn2+, HBS + 1 mM Mn2+, and HBS + 10 mM Mn2+.
Membranes 13 00823 g009
Figure 10. Structure and energies in the stable state of Mn2+ binding to various organic pollutants.
Membranes 13 00823 g010
Table 1. Operating parameters of RO test equipment.
ItemParameter
Membrane Size24 cm2
Operation methodCross-flow filtration + concentrate recirculation
RO Membrane materialPolyamide composite membrane
Operating pressure12 bar
Filtration time6–12 h
Crossflow rateabout 9.6 cm/s
Working voltage220 V
Working temperature25 °C
Disclaimer/Publisher’s Note: The statements, opinions and data contained in all publications are solely those of the individual author(s) and contributor(s) and not of MDPI and/or the editor(s). MDPI and/or the editor(s) disclaim responsibility for any injury to people or property resulting from any ideas, methods, instructions or products referred to in the content.

