
Concepts and Misconceptions Concerning the Influence of Divalent Ions on the Performance of Reverse Electrodialysis Using Natural Waters

Abstract
:
1. Introduction
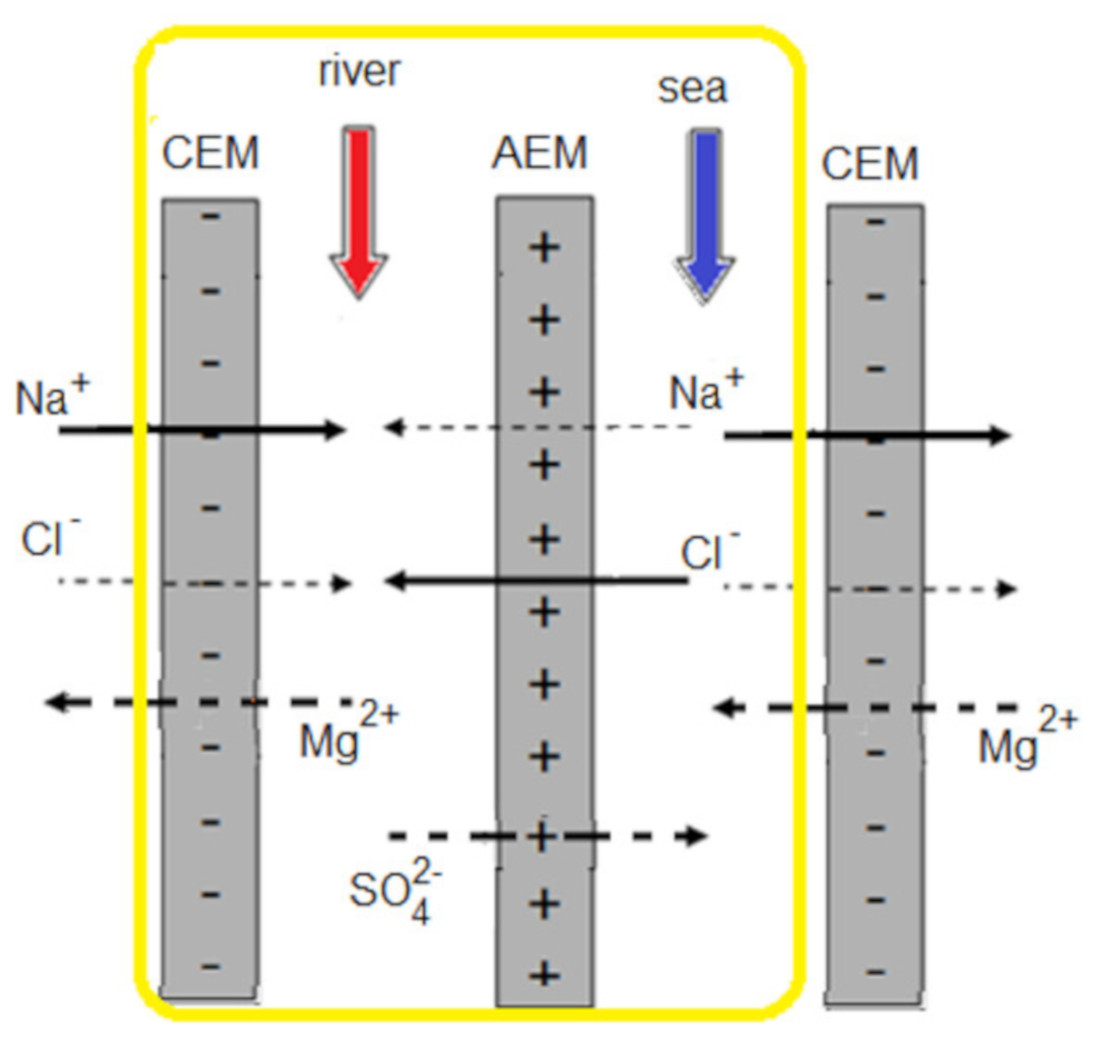
2. Fundamentals
3. Effects of Multivalent Ions on RED Power
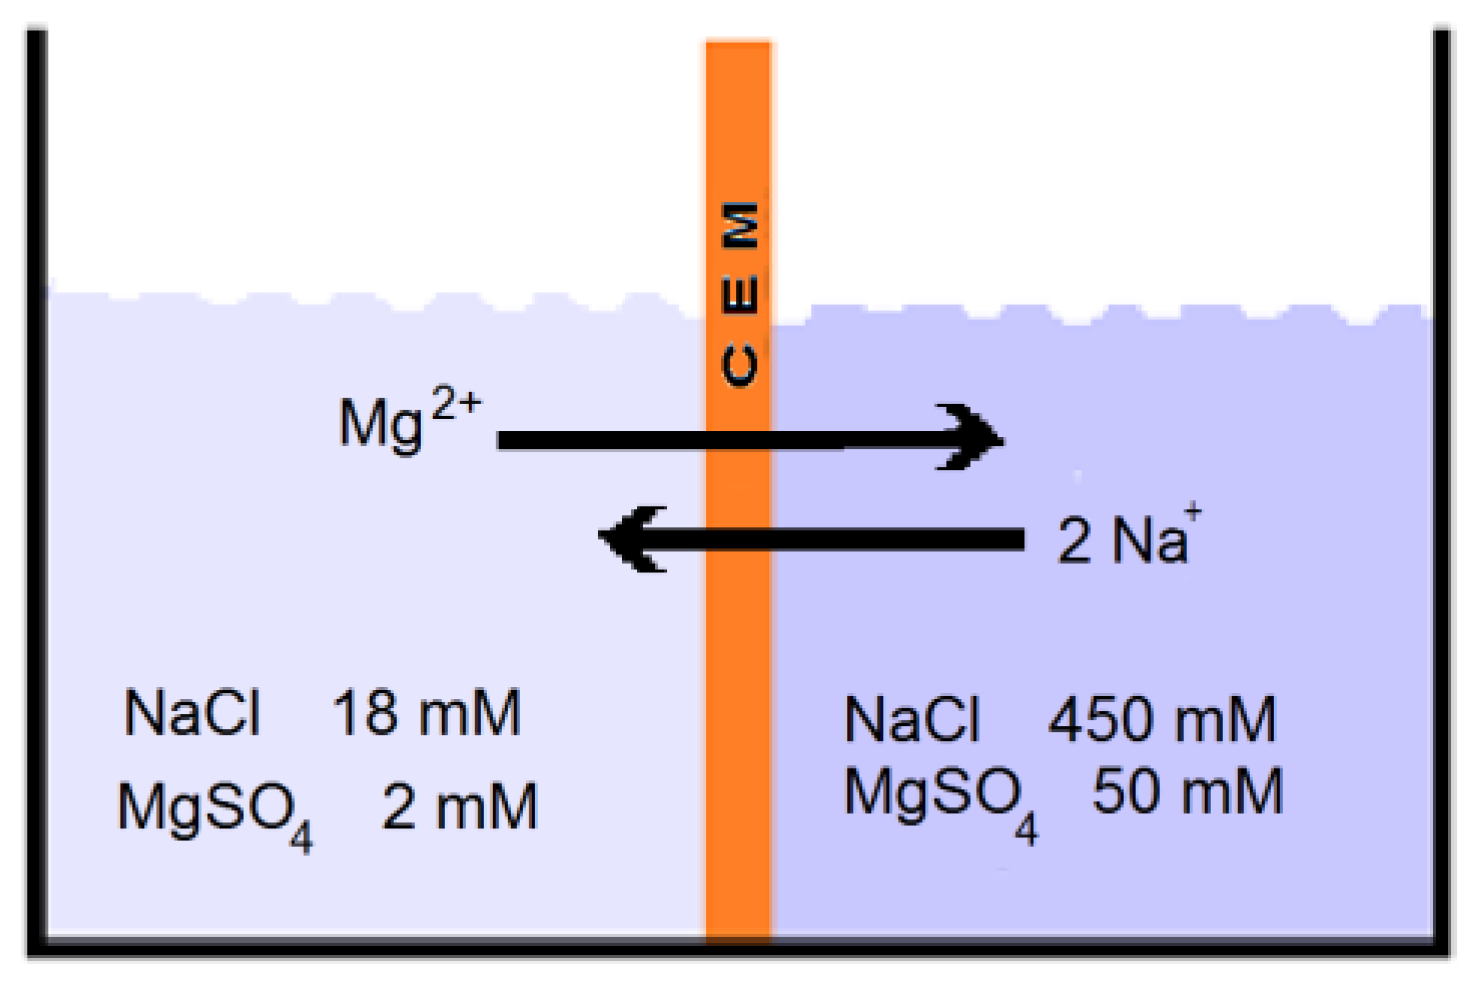
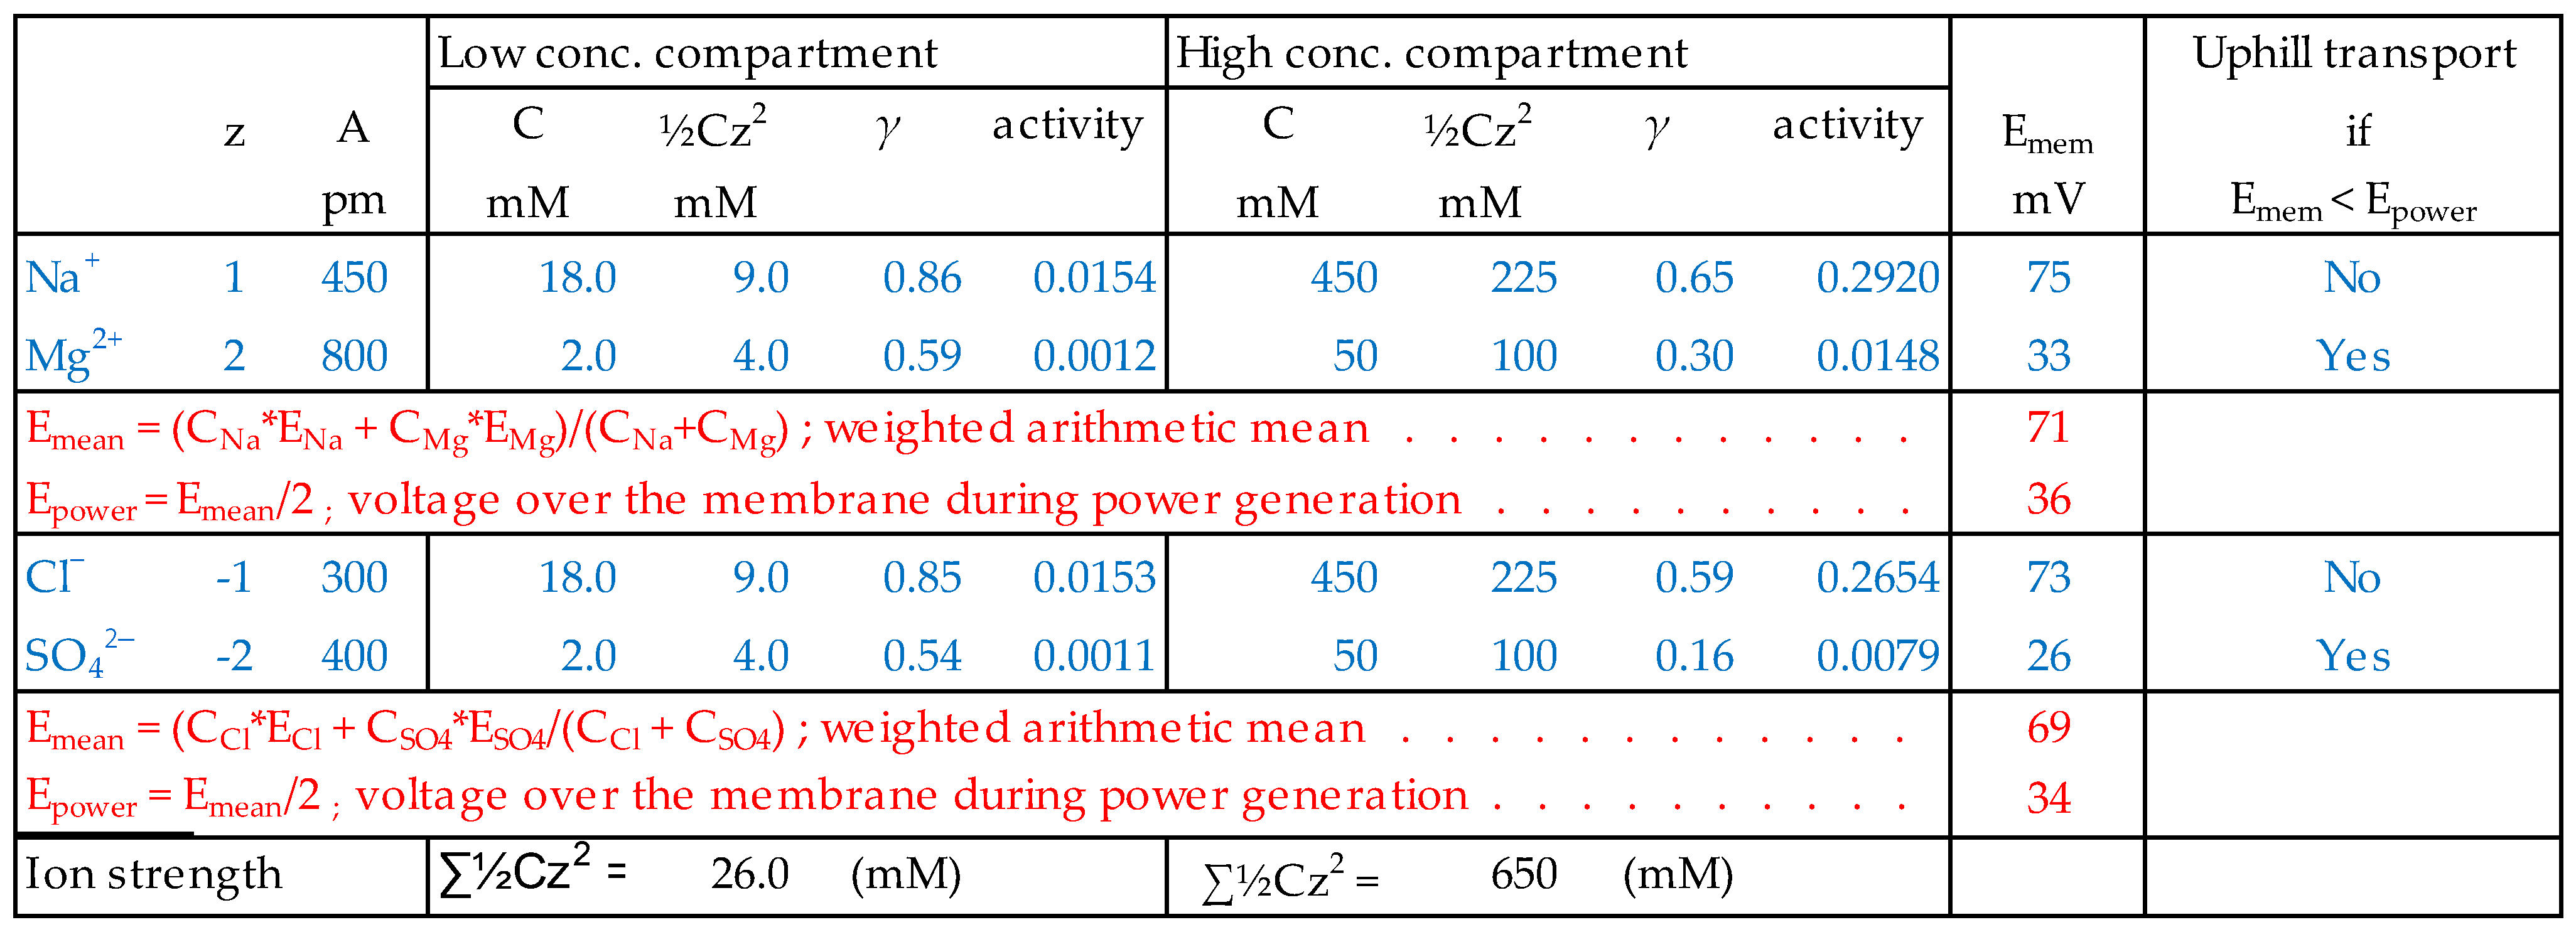
3.1. Uphill Transport
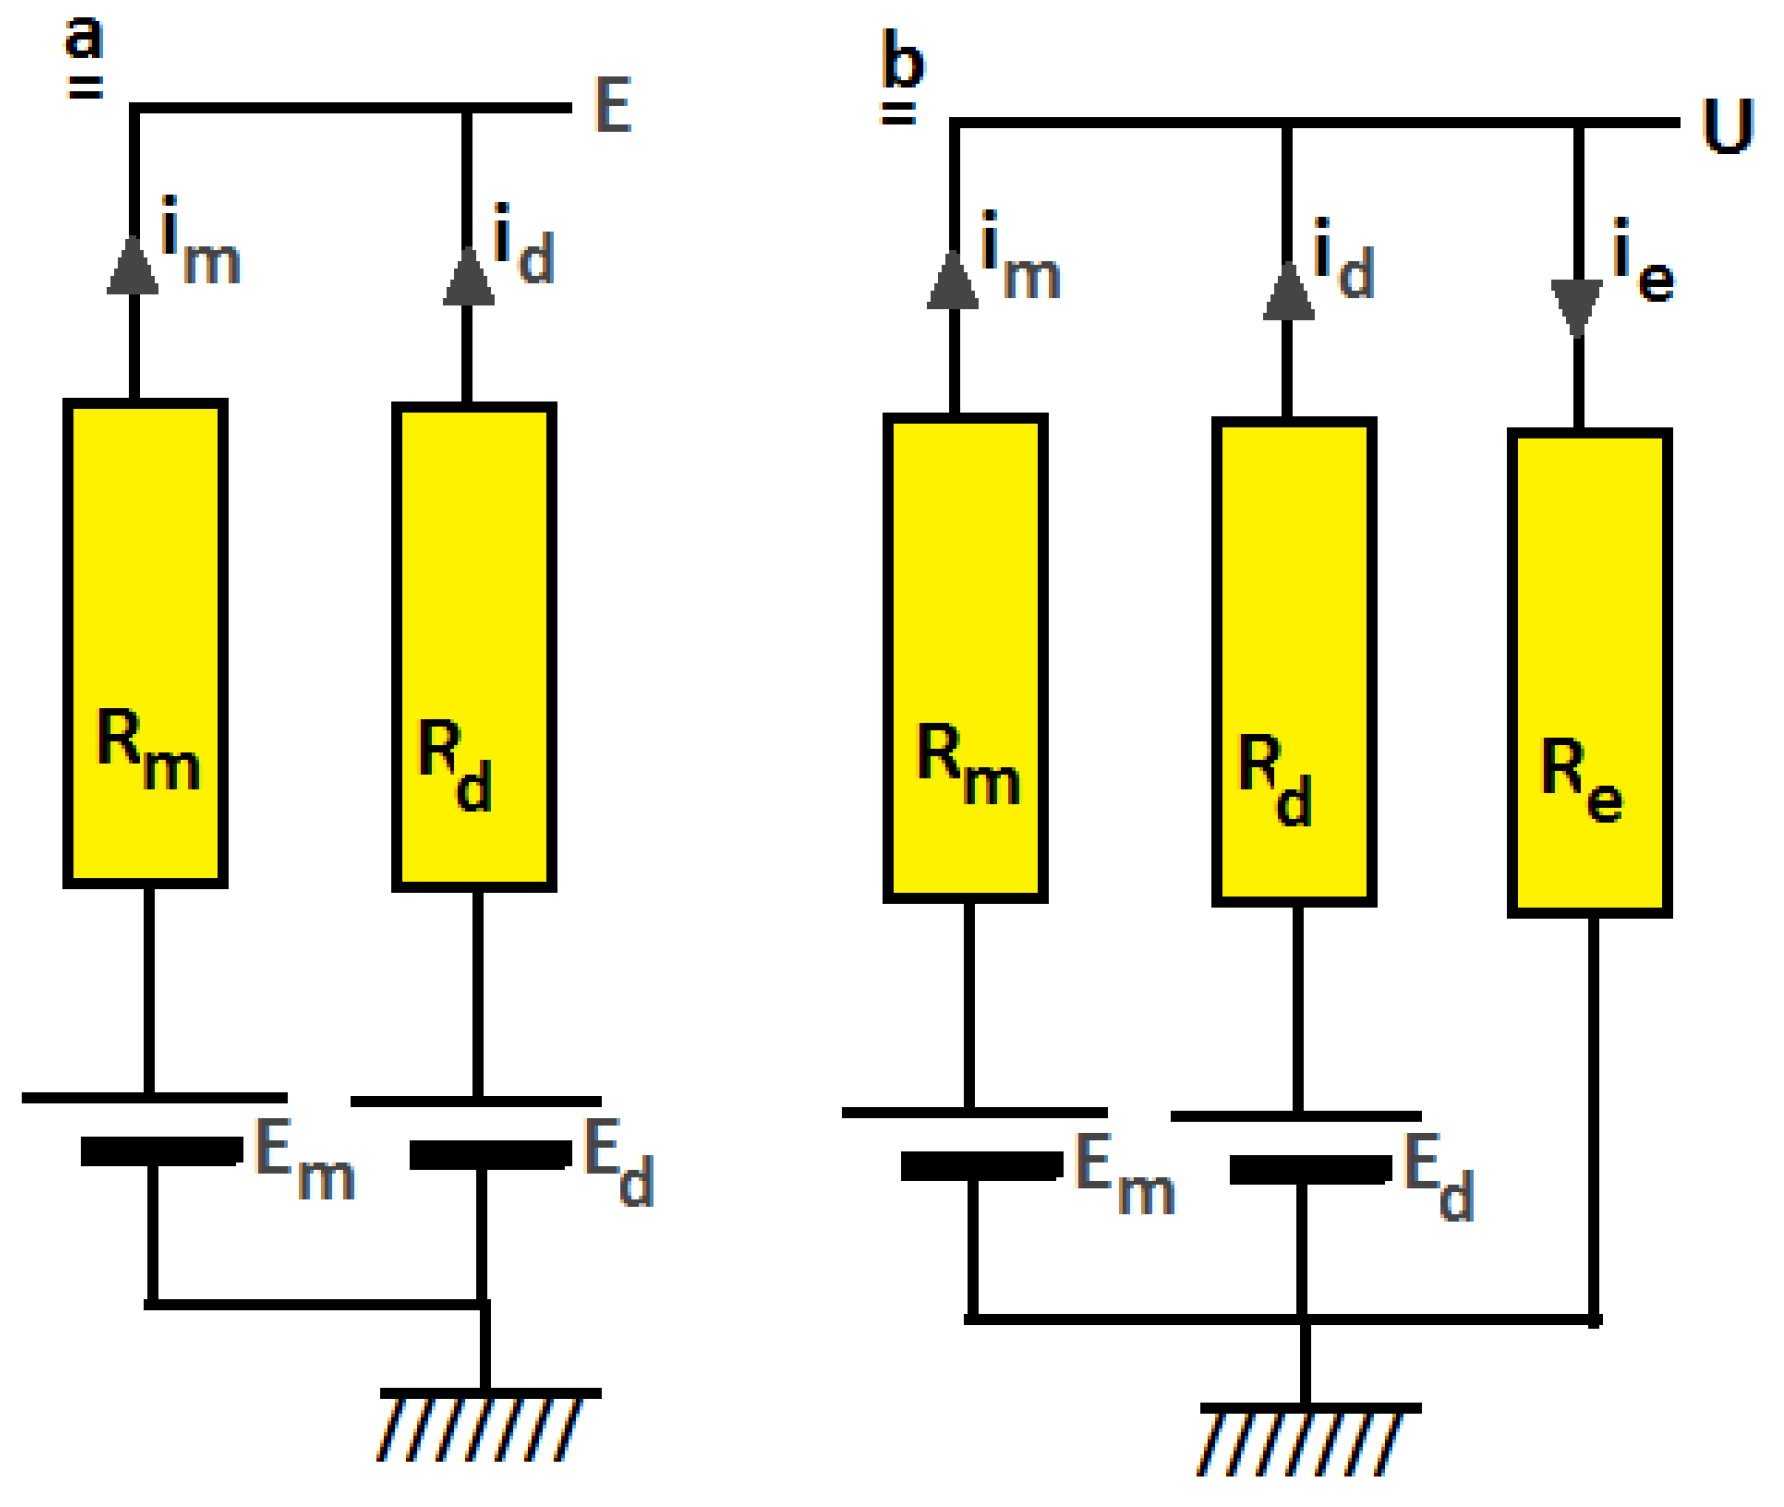
3.2. Stack Voltage
3.3. Effect of Divalent Ions on RED Power
3.4. Measuring the Reduced Stack Voltage
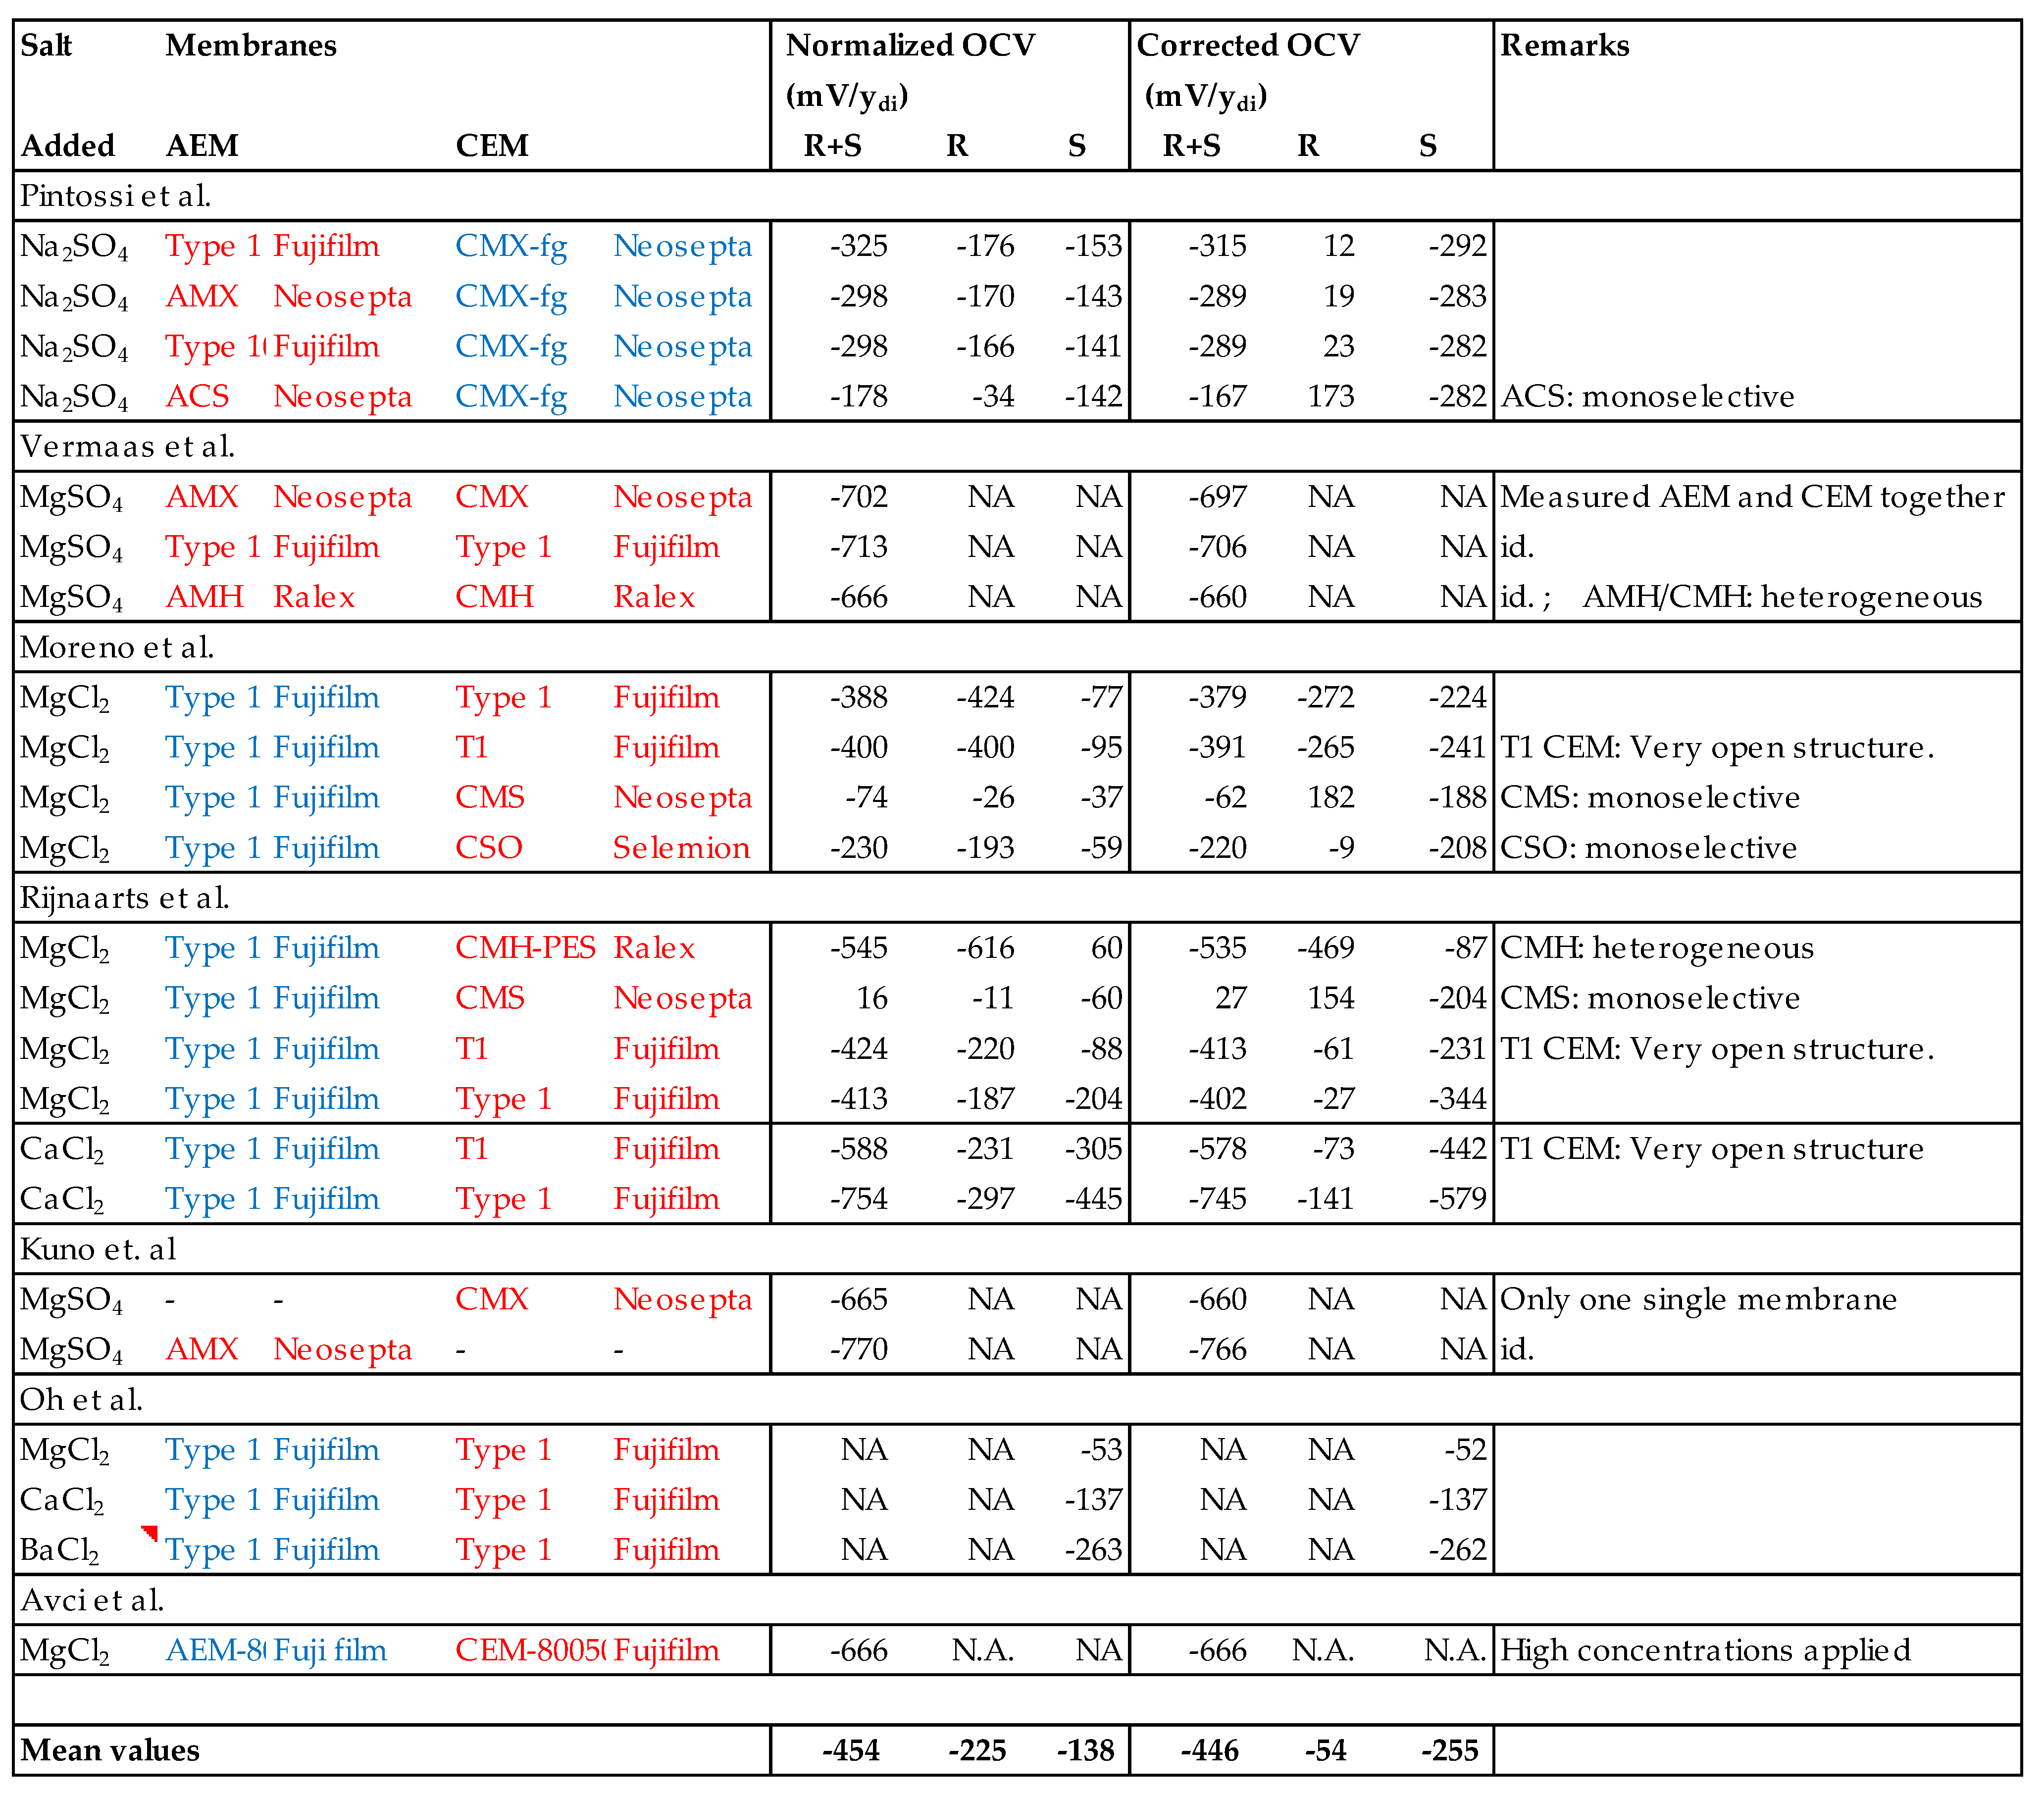
- The mean values in the R and S columns of the corrected values show that multivalent ions have a much larger negative influence on the OVC when in seawater (mean = −255 mV/ydi) than in river water (−54 V/ydi). This is remarkable because with a high concentration of divalent ions in river water, a decrease of the OCV due to uphill transport is expected.
- Correction has little influence on the experiments where divalent salts were added in both feed waters.
- Addition of divalent ions to both feed waters has a larger effect than the sum of the separate effects (of addition to seawater and to river water).
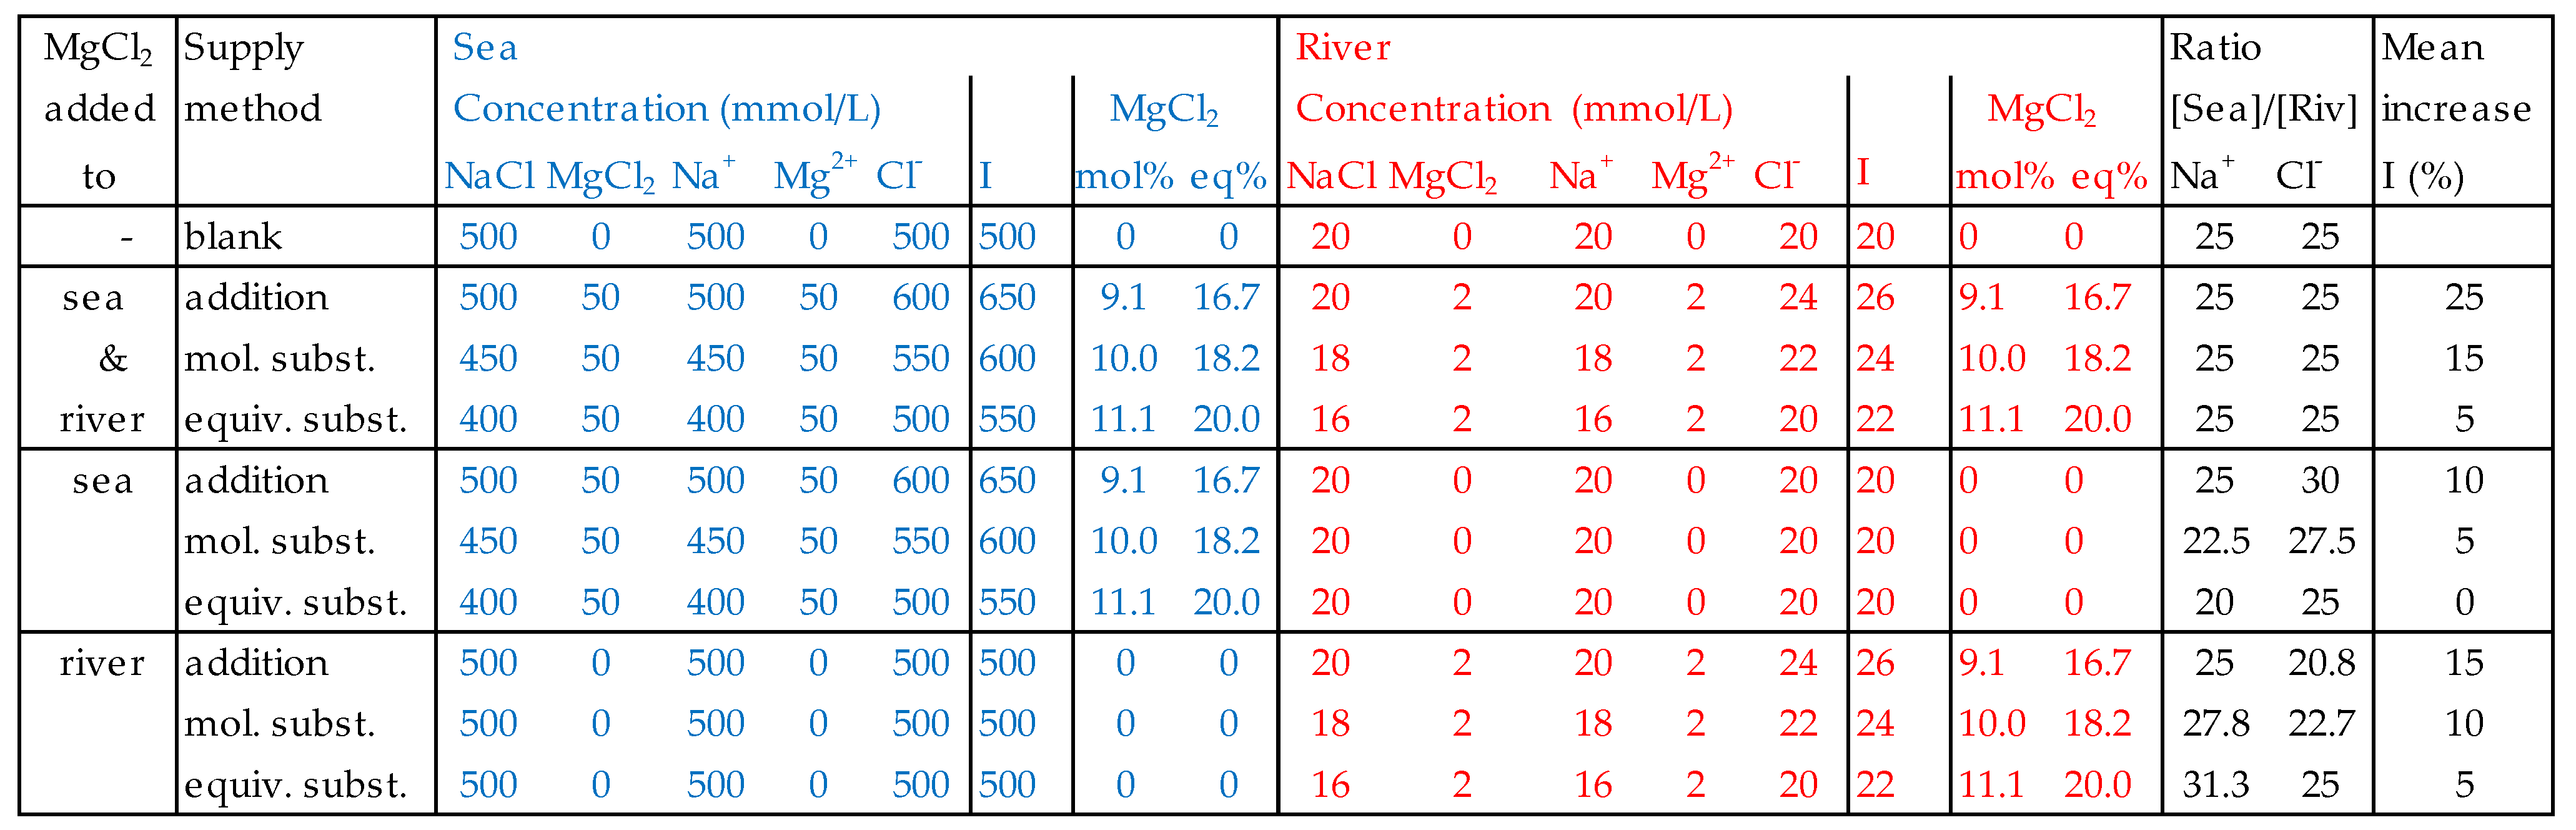
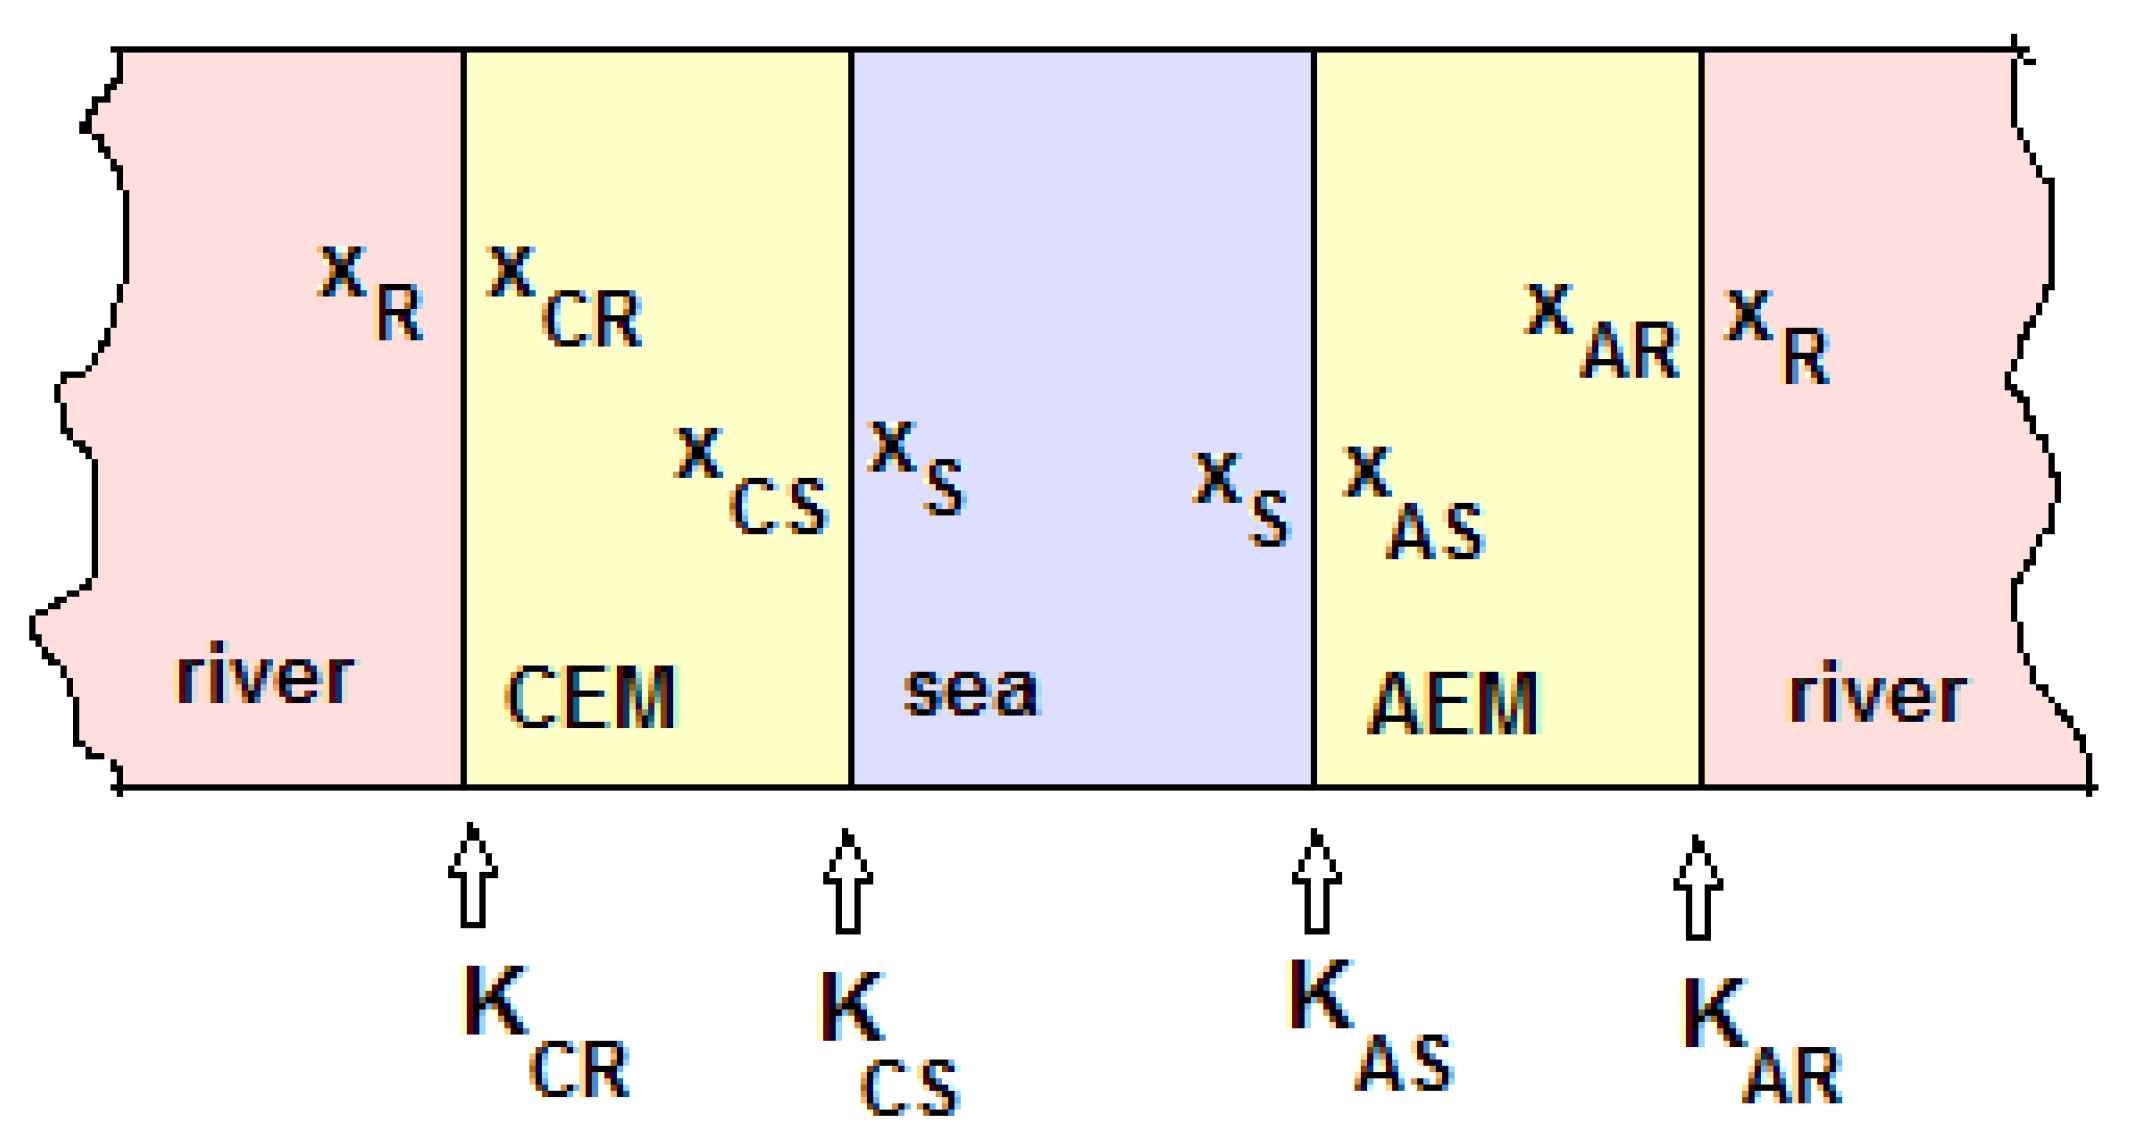
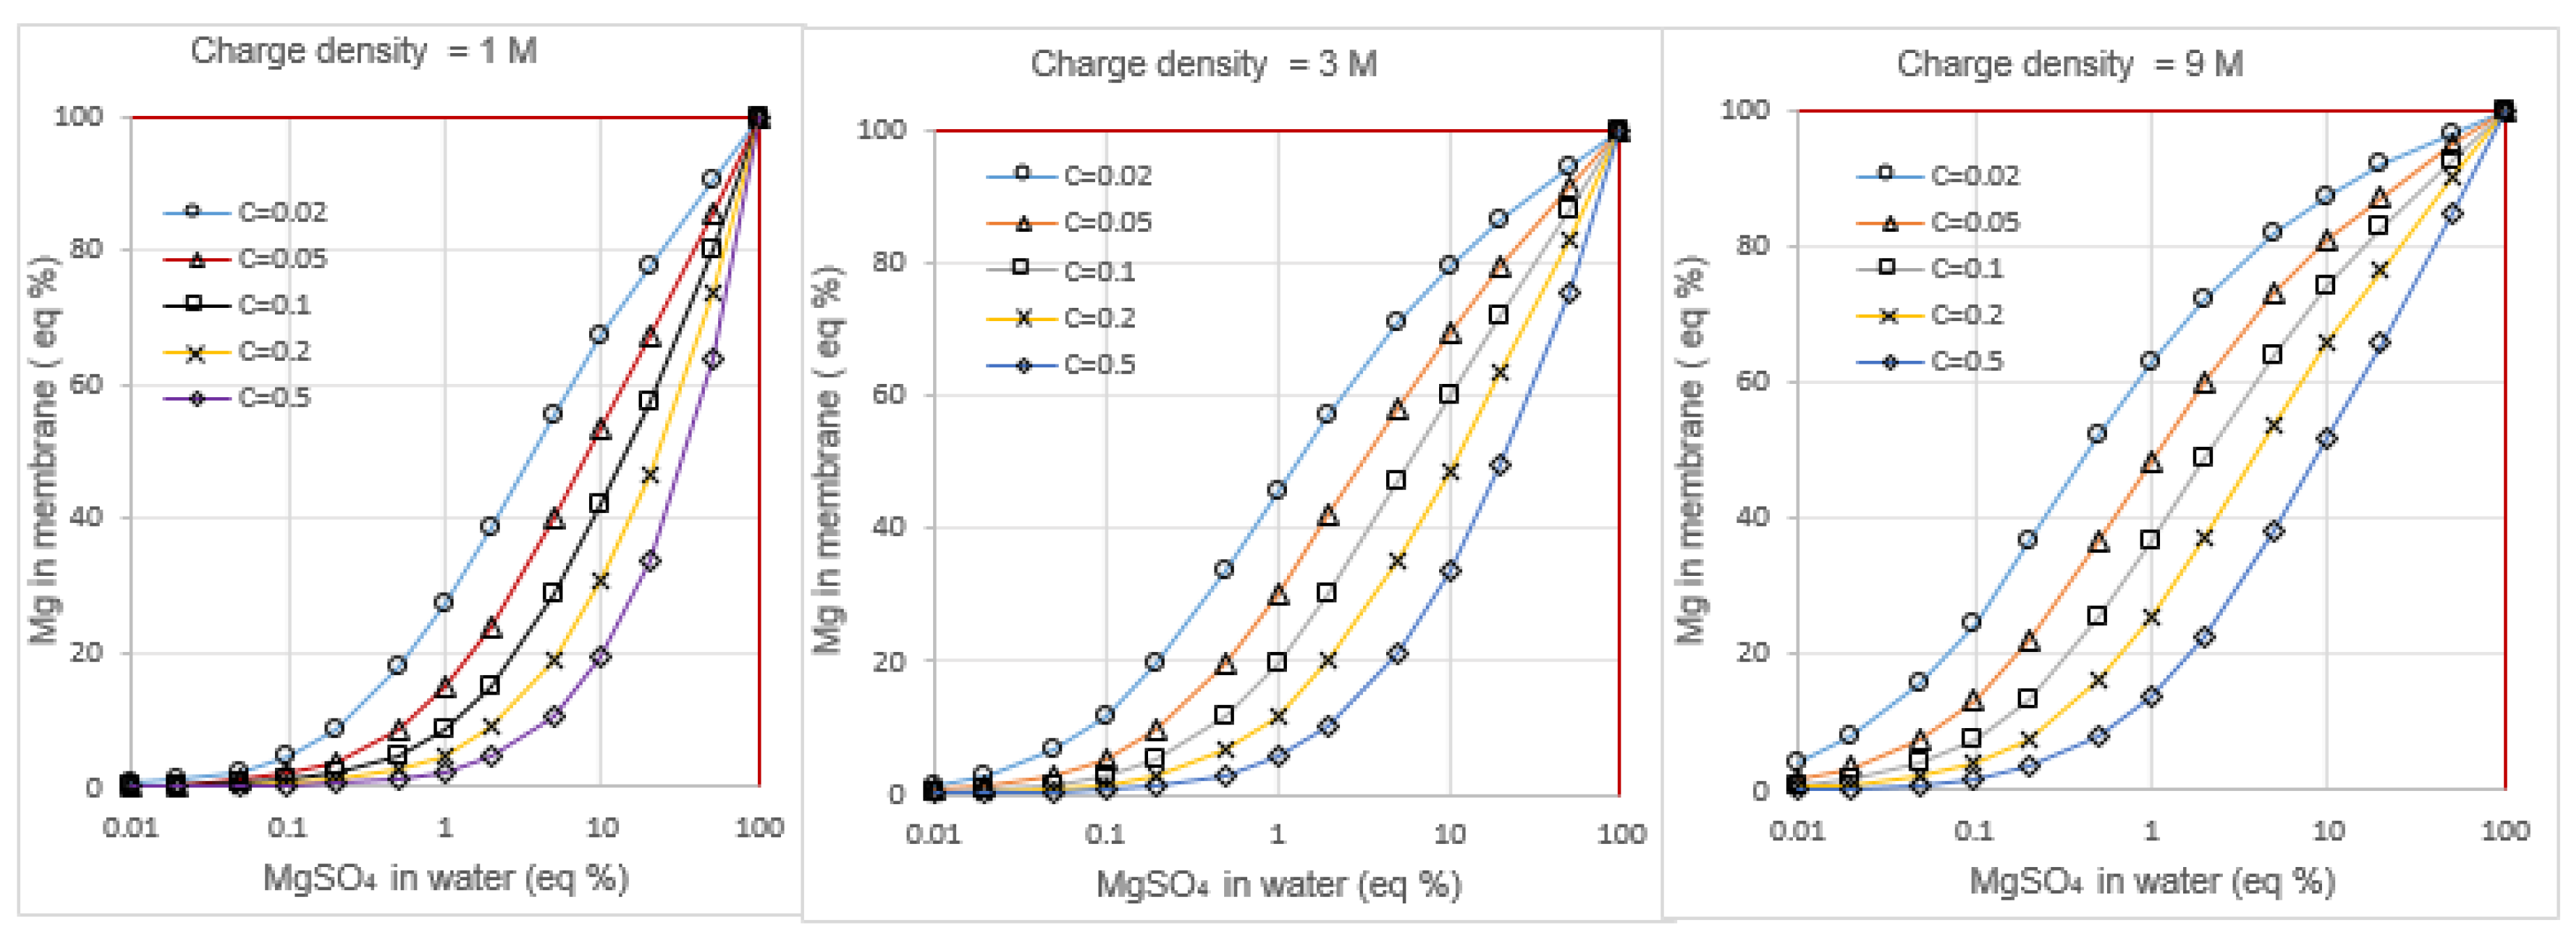
3.5. Donnan Exclusion in NaCl Solutions Containing Divalent Ions
3.6. Formation of Ion Pairs in the Feed Water
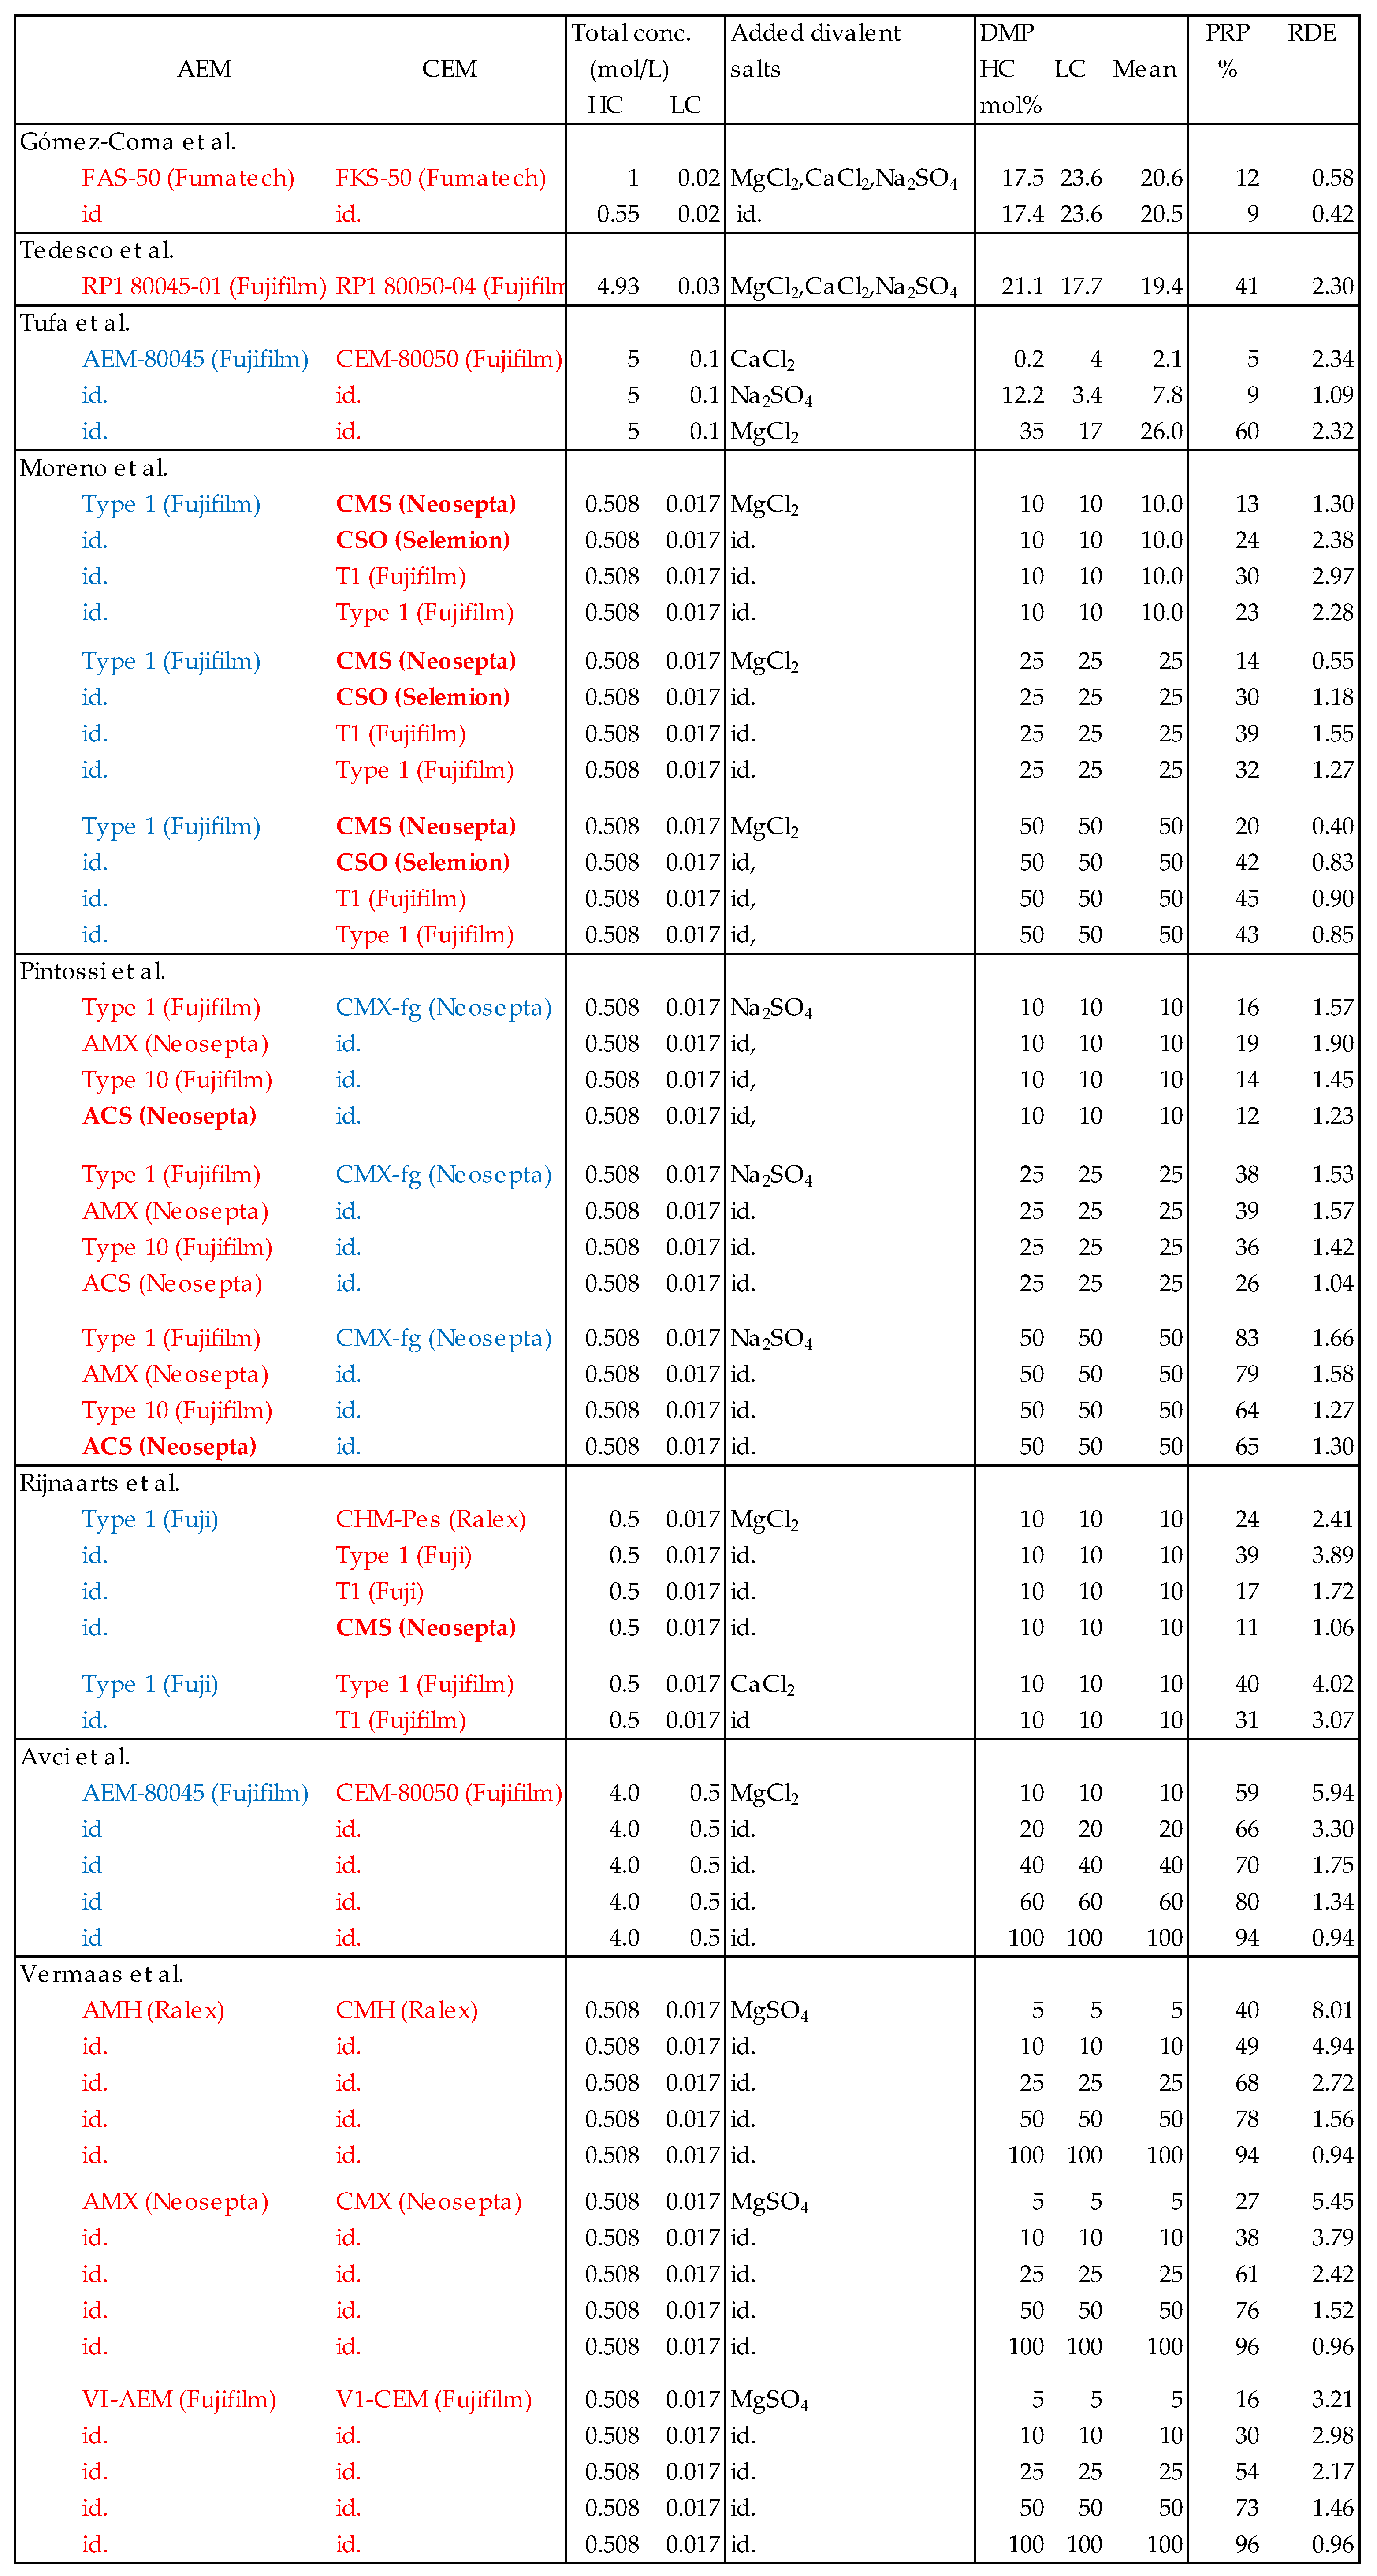
3.7. Gross Power Density
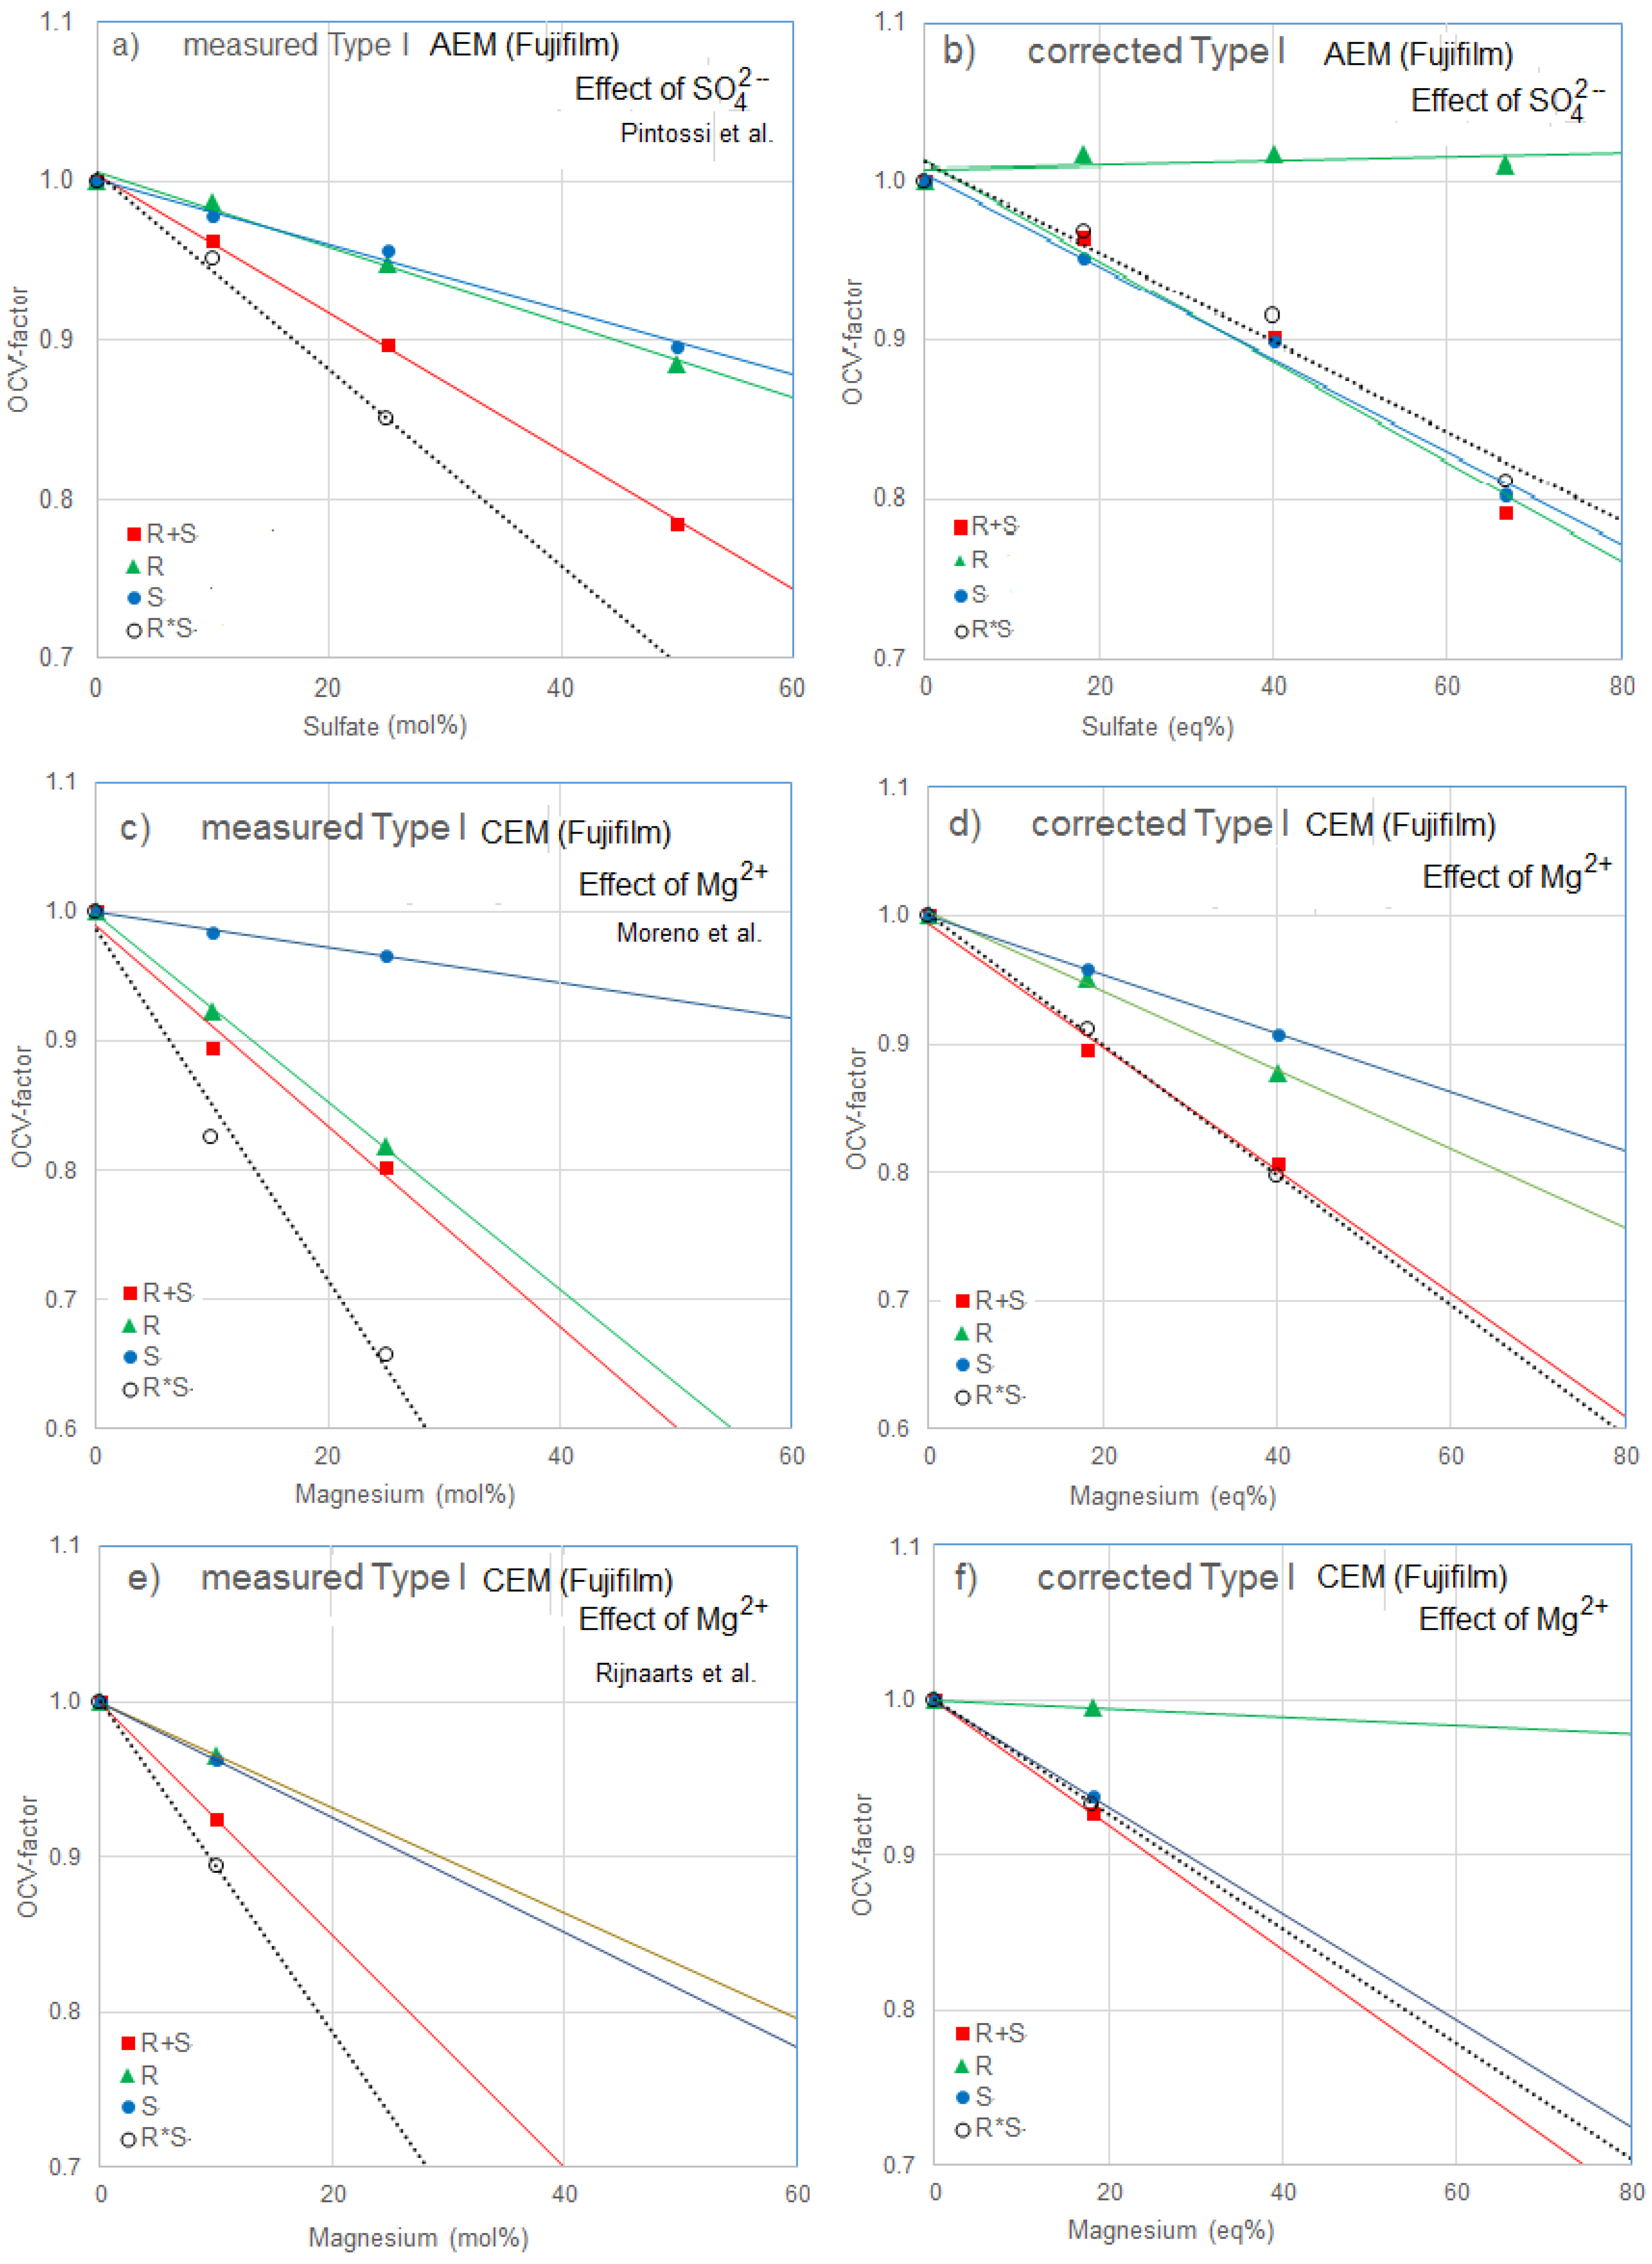
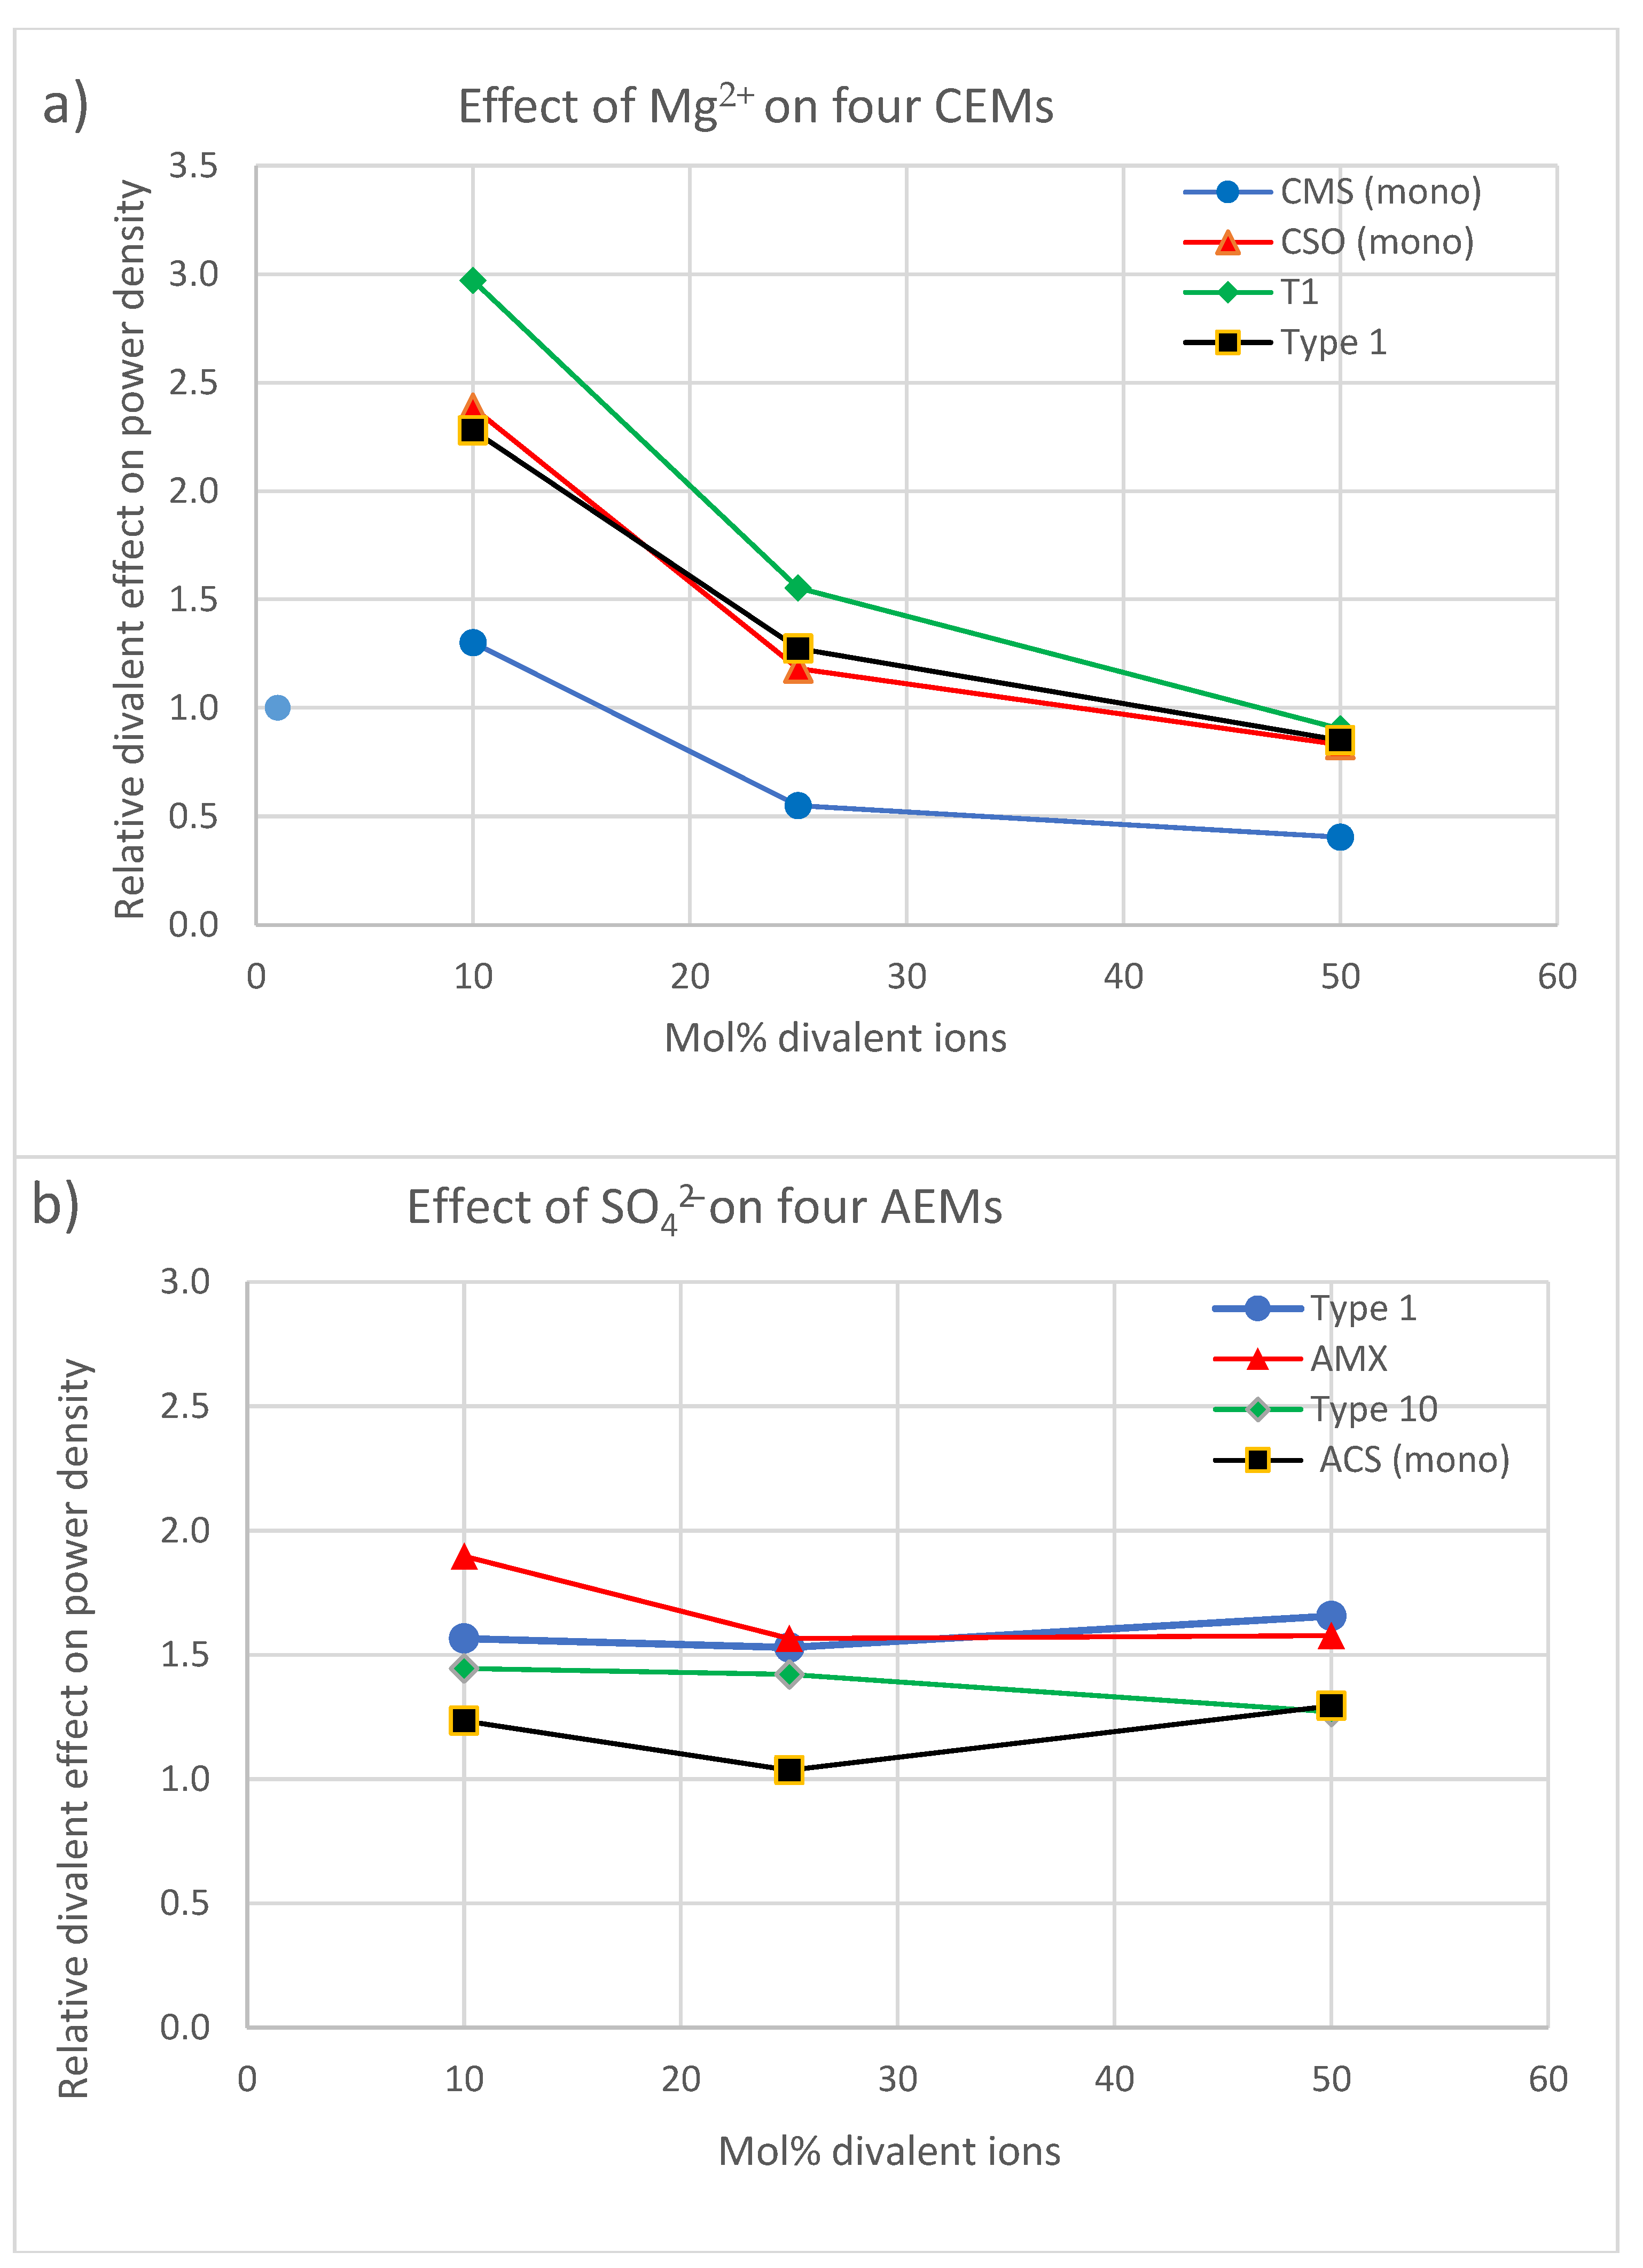
- At lower concentrations (10 mol% divalent ions), the effect of Mg2+ on a CEM is generally higher than the effect of SO42− on an AEM; however, at high concentrations (50 mol% divalent ions), these effects are reversed.
- The membranes that suffer the least for both the CEMs and the AEMs are mono-selective membranes (CMS and ACS). However, from the CEMs, the CSO performs the same as the normal membranes. The monoselectivity of the CMS is based on a double-sided coating with a charged polymer, the CSO has such a charged layer only at one side and the ACS has on both sides a high cross-linked coating. In line with this, the question can be asked whether the CMS and ACS also continue to perform better during an endurance test or whether these membranes also become saturated with divalent ions after some time and therefore lose their unique properties.
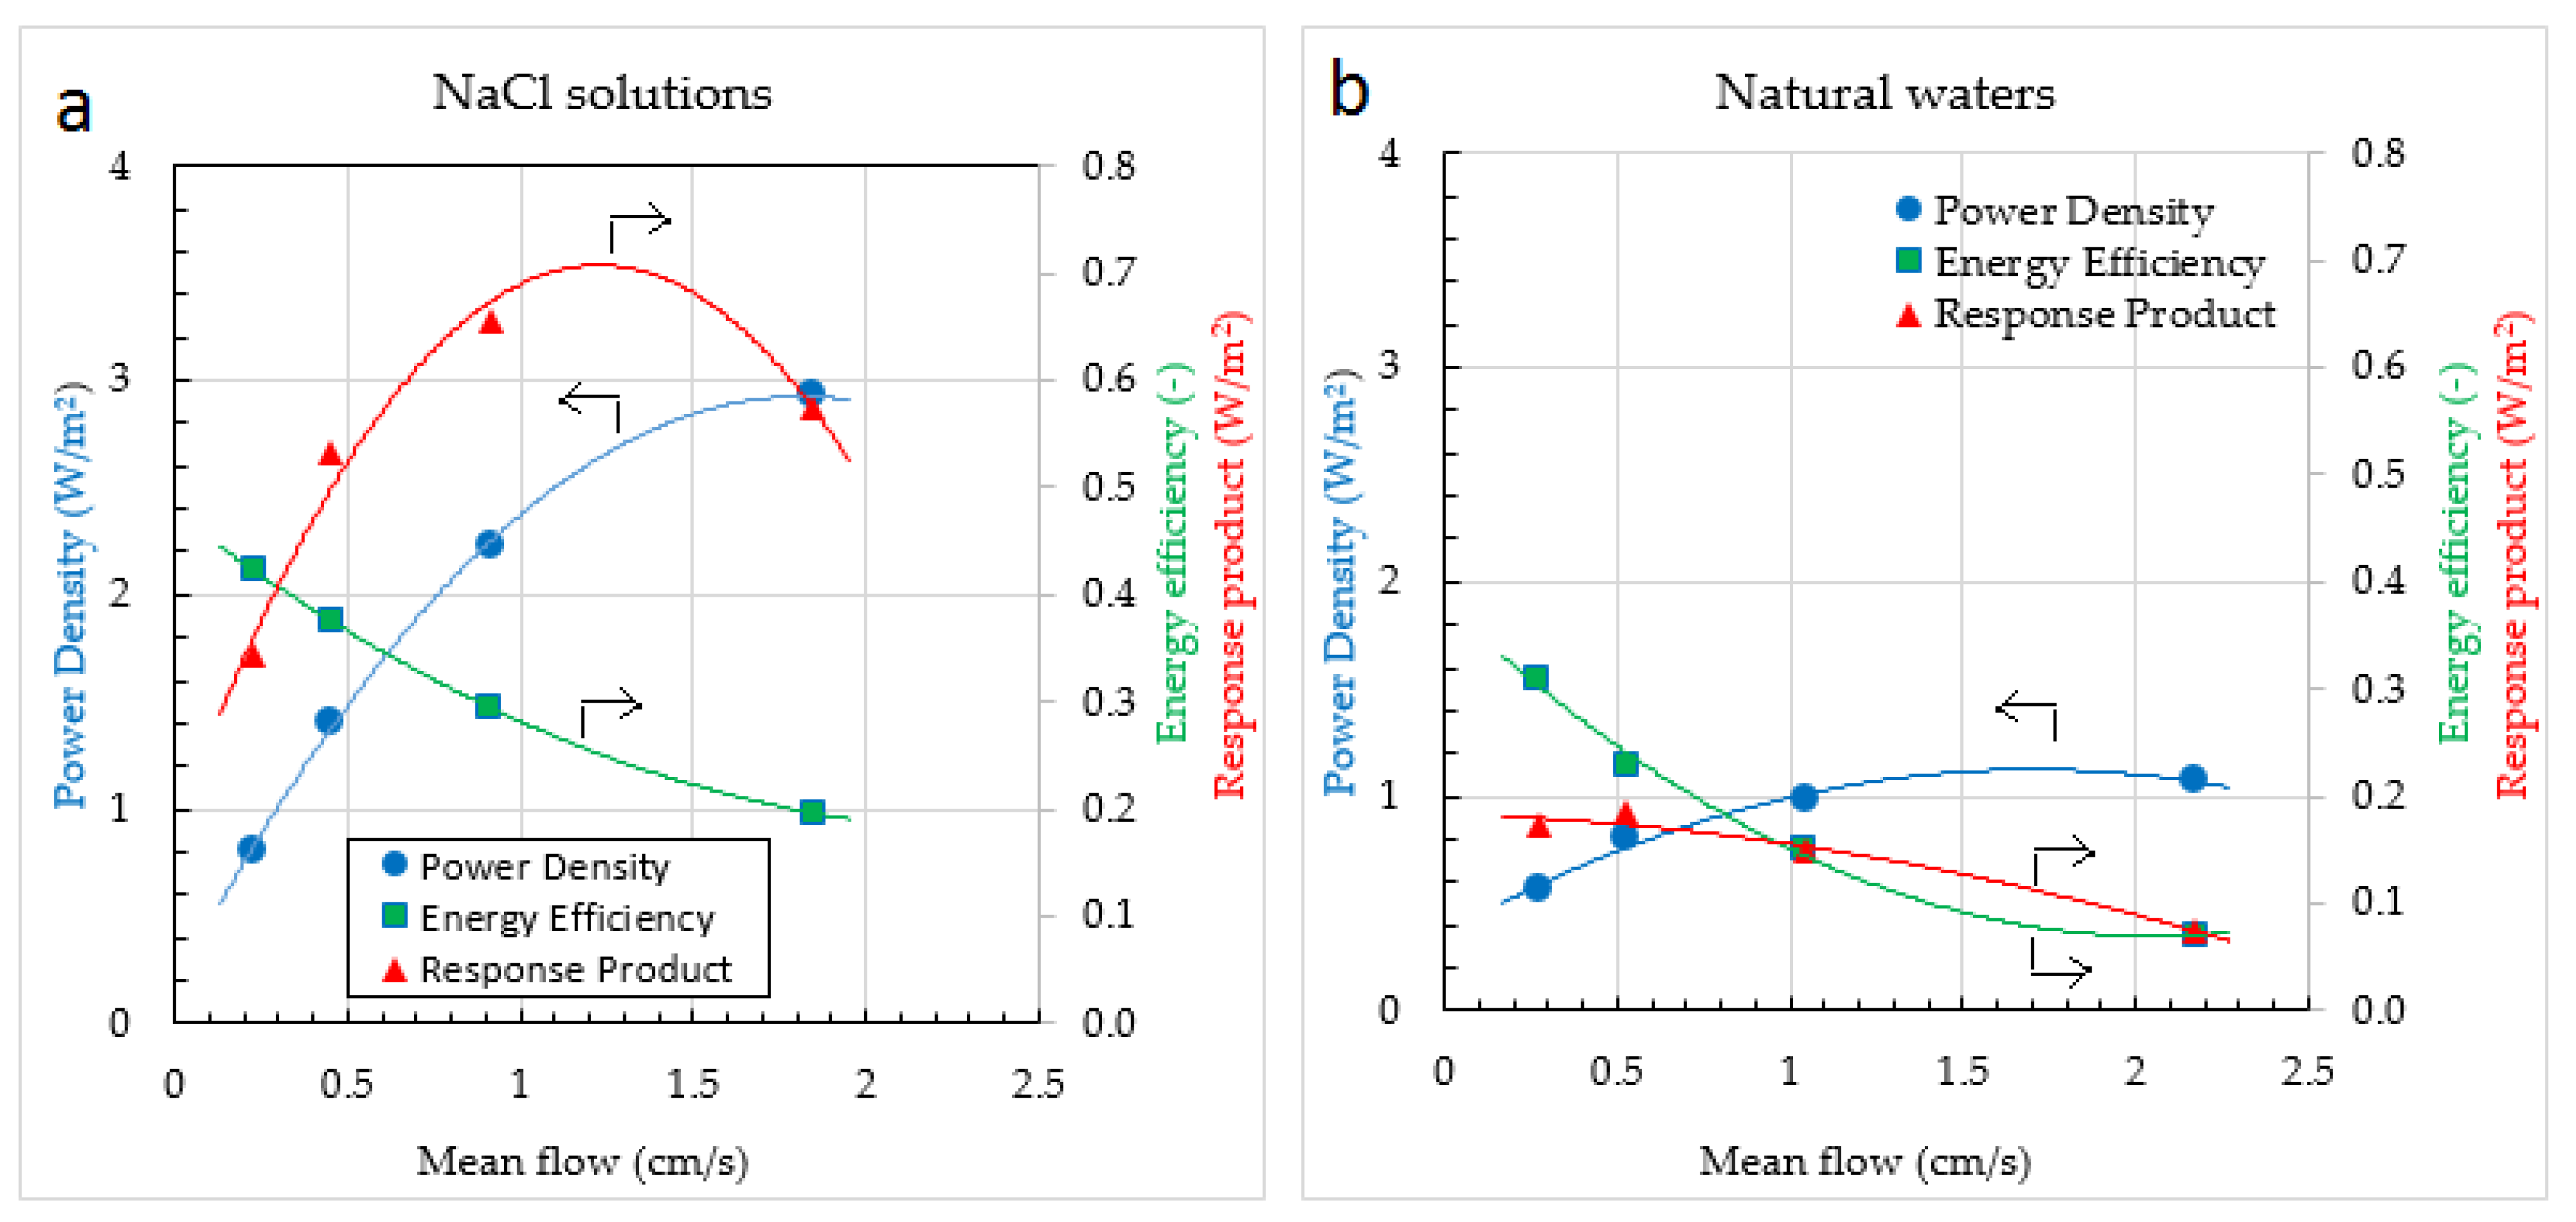
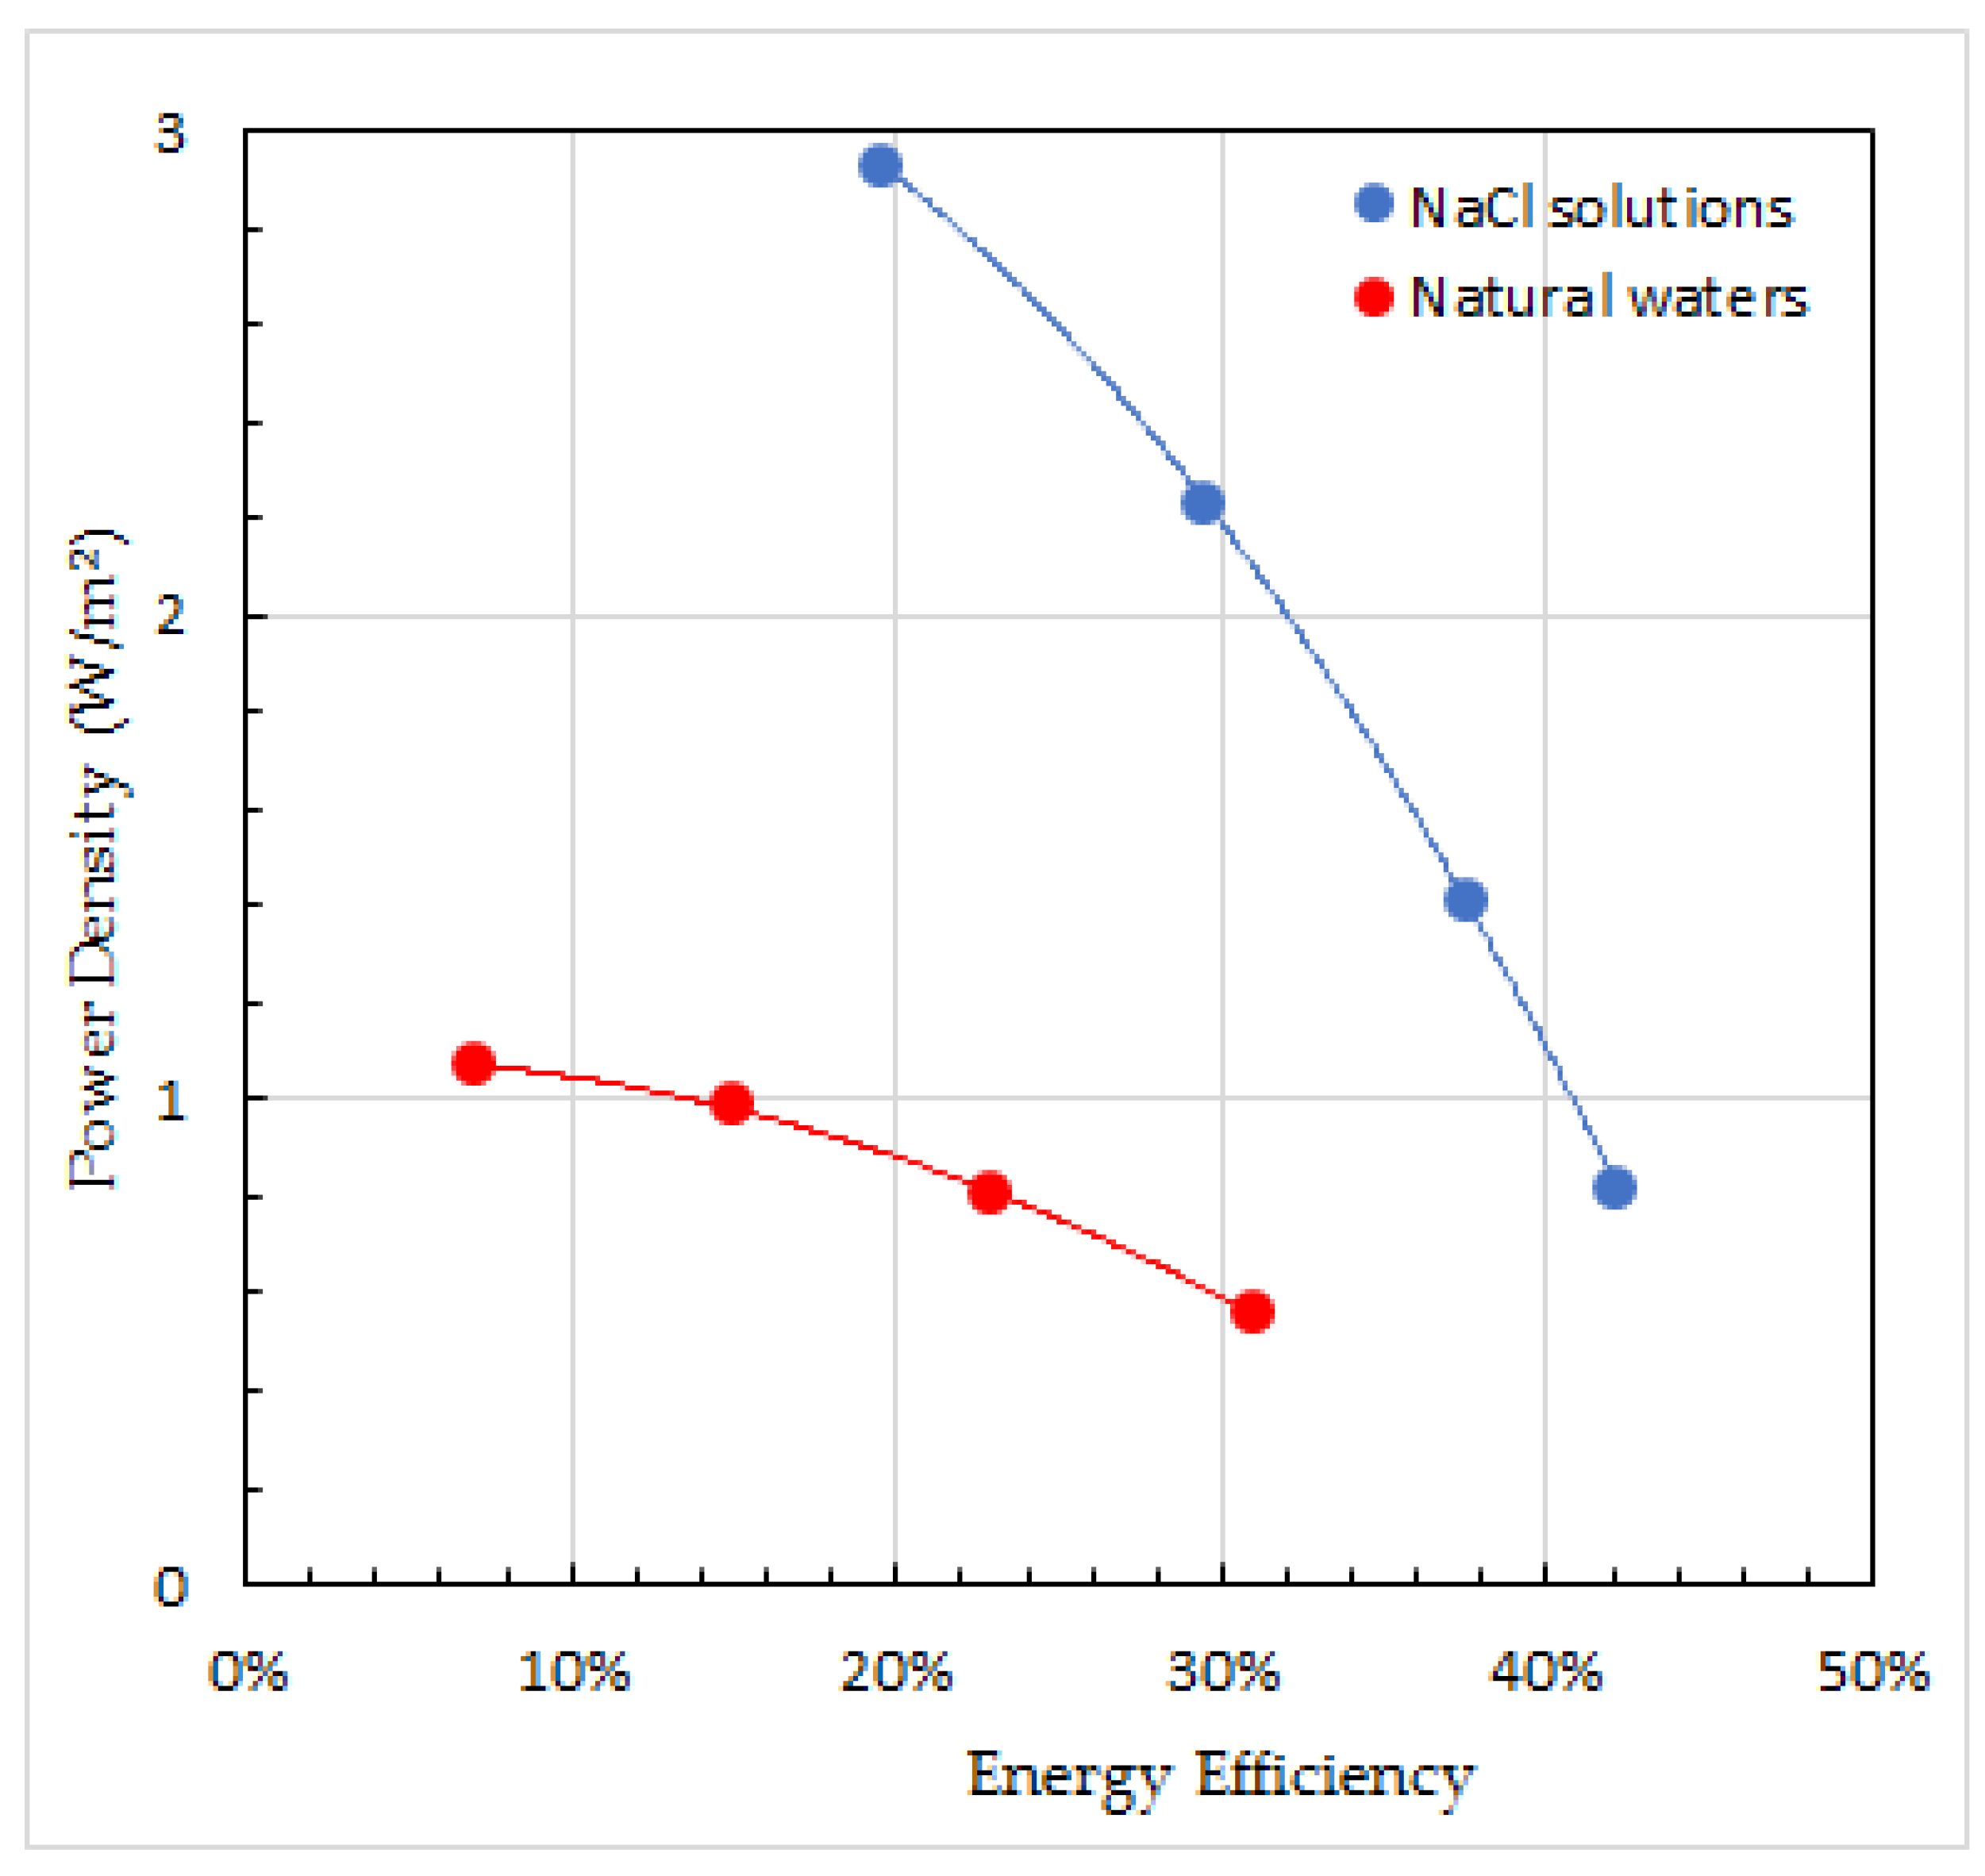
3.8. Power Density and Efficiency
4. Conclusions and Perspectives
- The determining factor of whether uphill transport will occur is not the OCV but the membrane potential under power-producing conditions.
- In experiments investigating the influence of divalent ions on the OCV, the fact is often ignored that the addition of divalent salts also influences the concentrations of Na+ and Cl− and, therefore, also the membrane voltage.
- The question is whether the apparent advantages of applying monospecific membranes in a RED stack will hold up during endurance tests.
- The effect of magnesium ions on CEMs is strongly concentration dependent in contrast to the effect of sulfate ions on AEMs.
Funding
Data Availability Statement
Acknowledgments
Conflicts of Interest
Nomenclature
| Roman | |
| A | ion diameter (pm) |
| a | activity (1) |
| C | concentration (mol/L) |
| CD | charge density (mol/L) |
| DMP | divalent molar percentage (%) |
| ∆G | Gibbs free energy (J) |
| E | membrane voltage (V) |
| F | Faraday constant (96,485 C∙mol−1) |
| i | electrical current (A) |
| I | ionic strength (mol/L) |
| IEC | ion exchange capacity (eg/kg) |
| M | molarity (mol/L) |
| N | normality (Eq/L) |
| N | number of cell pairs |
| OCV | open circuit voltage (V) |
| P | power (W) |
| Pd | power density (Wm–2) |
| PRP | power reduction percentage (%) |
| R | gas constant (8.3145 J∙mol−1K−1) |
| RD | relative difference (1) |
| RDE | relative divalent effect (1) |
| Re | external resistance of a RED stack (load) (Ω) |
| Ri | internal resistance of a RED stack (Ω) |
| RP | response product (Wm–2) |
| P | power (W) |
| SD | swelling degree (1) |
| T | time (s) |
| T | temperature (K) |
| U | terminal voltage of a stack (V) |
| X | exergy flow rate (J/s) |
| Y | energy efficiency (1) |
| x | molar fraction (1) |
| y | equivalent fraction (1) |
| z | charge number (1) |
| Greek | |
| α | permselectivity (1) |
| γ | activity coefficient (1) |
| ρ | density (kg∙m3) |
| Subscripts | |
| m | monovalent |
| d | divalent |
| Acronyms | |
| AEM | anion exchange membrane |
| CEM | cation exchange membrane |
| DP | Donnan potential (V) |
| ED | electrodialysis |
| EMF | electromotive force |
| H | high concentration solution |
| L | low concentration solution |
| PNP | Poisson-Nernst-Planck |
| RED | reverse electrodialysis |
| SGE | salinity gradient energy |
References
- Pattle, R.E. Electricity from fresh and salt water—Without fuel. Chem. Proc. Eng. 1955, 35, 351–354. [Google Scholar]
- Veerman, J.; Vermaas, D.A. Reverse electrodialysis: Fundamentals. In Chapter 4 in Sustainable Energy from Salinity Gradients; Cipollina, A., Micale, G., Eds.; Woodhead Publishing: Duxford, UK, 2016. [Google Scholar] [CrossRef]
- Vermaas, D.A.; Saakes, M.; Nijmeijer, K. Doubled Power Density from Salinity Gradients at Reduced Intermembrane Distance. Sci. Technol. 2011, 45, 7089–7095. [Google Scholar] [CrossRef] [PubMed]
- Vermaas, D.A.; Kunteng, D.; Saaakes, M.; Nijmeijer, K. Fouling in reverse electrodialysis under natural conditions. Water Res. 2013, 47, 1289–1298. [Google Scholar] [CrossRef] [PubMed]
- Di Salvo, L.J.; Cosenza, A.; Tamburini, A.; Micale, G.; Cipollina, A. Long-run operation of a reverse electrodialysis system fed with wastewaters. J. Environ. Manag. 2018, 217, 871–887. [Google Scholar] [CrossRef]
- Mehdizadeh, S.; Yasukawa, M.; Suzuki, T.; Higa, M. Reverse electrodialysis for power generation using seawater/municipal wastewater: Effect of coagulation pretreatment. Desalination 2020, 481, 114356. [Google Scholar] [CrossRef]
- Alvarez-Silva, O.; Maturana, A.Y.; Pacheco-Bustos, C.A.; Osorio, A.F. Effects of water pretreatment on the extractable salinity gradient energy at river mouths: The case of Magdalena River, Caribbean Sea. J. Ocean. Eng. Mar. Energy 2019, 5, 227–240. [Google Scholar] [CrossRef]
- Vital, B.; Torres, E.V.; Sleutels, T.; Gagliano, M.C.; Saakes, M.; Hamelers, H.V.M. Fouling fractionation in reverse electrodialysis with natural feed waters demonstrates dual media rapid filtration as an effective pre-treatment for fresh water. Desalination 2021, 518, 115277. [Google Scholar] [CrossRef]
- Lacey, R.E. Energy by reverse electrodialysis. Ocean. Eng. 1980, 7, 1–47. [Google Scholar] [CrossRef]
- Post, J.W.; Hamelers, H.V.M.; Buisman, C.J.N. Influence of multivalent ions on power production from mixing salt and fresh water with a reverse electrodialysis system. J. Membr. Sci. 2009, 330, 65–72. [Google Scholar] [CrossRef]
- Hong, J.G.; Zhang, W.; Luo, J.; Chen, Y. Modeling of power generation from the mixing of simulated saline and freshwater with a reverse electrodialysis system: The effect of monovalent and multivalent ions. Appl. Energy 2013, 110, 244–251. [Google Scholar] [CrossRef]
- Vermaas, D.A.; Veerman, J.; Saakes, M.; Nijmeijer, K. Influence of multivalent ions on renewable energy generation in reverse electrodialysis. Energy Environ. Sci. 2014, 7, 1434–1445. [Google Scholar] [CrossRef] [Green Version]
- Tufa, R.A.; Curcio, E.; van Baak, W.; Veerman, J. Potential of brackish water and brine for energy generation by salinity gradient power-reverse electrodialysis (SGP-RE). J. RSC Adv. 2014, 4, 42617–44262. [Google Scholar] [CrossRef] [Green Version]
- Moreno, J.; Díez, V.; Saakes, M.; Nijmeijer, K. Mitigation of the effects of multivalent ion transport in reverse electrodialysis. J. Membr. Sci. 2018, 550, 155–162. [Google Scholar] [CrossRef]
- Oh, Y.; Jeong, Y.; Han, S.-J.; Kim, C.S.; Kim, H.; Han, J.-H.; Hwang, K.-S.; Jeong, N.; Park, J.S.; Chae, S. Effects of divalent cations on electrical membrane resistance in reverse electrodialysis for salinity power generation. Ind. Eng. Chem. Res. 2018, 57, 15803–15810. [Google Scholar] [CrossRef]
- Kuno, M.; Yasukawa, M.; Kakihana, Y.; Higa, M. The Effect of Divalent Ions on Reverse Electrodialysis Power Generation System. Bull. Soc. Sea Water Sci. Jpn. 2017, 71, 350–351. [Google Scholar]
- Besha, A.T.; Tsehaye, M.T.; Aili, D.; Zhang, W.; Tufa, R.A. Design of Monovalent Ion Selective Membranes for Reducing the Impacts of Multivalent Ions in Reverse Electrodialysis. Membranes 2020, 10, 7. [Google Scholar] [CrossRef] [PubMed] [Green Version]
- Pintossi, D.; Simões, C.; Saakes, M.; Borneman, Z.; Nijmeijer, K. Predicting reverse electrodialysis performance in the presence of divalent ions for renewable energy generation. Energy Convers. Manag. 2021, 243, 114369. [Google Scholar] [CrossRef]
- Simões, C.; Vital, B.; Sleutels, T.; Saakes, M.; Brilman, W. Scaled-up multistage reverse electrodialysis pilot study with natural waters. Chem. Eng. J. 2022, 450, 138412. [Google Scholar] [CrossRef]
- Website RED Stack bv. Available online: http://www.REDstack.nl (accessed on 1 July 2021).
- RIWA. Jaarrapport 2020, De Rijn. Available online: https://www.riwa-rijn.org/wp-content/uploads/2020/09/RIWA-2020-NL-Jaarrapport-2019-De-Rijn.pdf (accessed on 1 July 2021).
- Website Lentech. Available online: https://www.lenntech.com/composition-seawater.htm (accessed on 1 July 2021).
- Rijnaarts, T.; Shenkute, N.; Wood, J.A.; de Vos, W.M.; Nijmeijer, K. Divalent cation removal by Donnan dialysis for improved reverse electrodialysis. ACS Sustain. Chem. Eng. 2018, 6, 7035–7041. [Google Scholar] [CrossRef] [Green Version]
- Rijnaarts, T.; Reurink, D.M.; Radmanesh, F.; de Vos, W.M.; Nijmeijer, K. Layer-by-layer coatings on ion exchange membranes: Effect of multilayer charge and hydration on monovalent ion selectivities. J. Membr. Sci. 2019, 570–571, 513–521. [Google Scholar] [CrossRef] [Green Version]
- Sata, T. Studies on ion exchange membranes with permselectivity for specific ions in electrodialysis. J. Membr. Sci. 1994, 93, 117–135. [Google Scholar] [CrossRef]
- Suzuki, T.; Kakihana, Y.; Higa, M. Recovery of Salinity Gradient Energy by Reverse Electrodialysis (RED): Principle, Recent Developments, and Challenges for Commercialization. Salt Seawater Sci. Technol. 2021, 1, 46–60. [Google Scholar] [CrossRef]
- Pintossi, D.; Chen, C.; Saakes, M.; Nijmeijer, K.; Borneman, Z. Influence of sulfate on anion exchange membranes in reverse electrodialysis. NPJ Clean Water 2020, 3, 29. [Google Scholar] [CrossRef]
- Kielland, J. Individual activity coefficients of ions in aqueous solutions. J. Am. Chem. Soc. 1937, 59, 1675–1678. [Google Scholar] [CrossRef]
- Veerman, J.; Post, J.W.; Saakes, M.; Metz, S.J.; Harmsen, G.J. Reducing power losses caused by ionic shortcut currents in reverse electrodialysis stacks by a validated model. J. Membr. Sci. 2008, 310, 418–430. [Google Scholar] [CrossRef] [Green Version]
- Castilla, J.; García-Hernández, M.T.; Moya, A.A.; Hayas, A.; Horno, J. A study of the transport of ions against their concentration gradient across ion-exchange membranes using te network method. J. Membr. Sci. 1997, 130, 183–192. [Google Scholar] [CrossRef]
- Moya, A.A. Uphill transport in improved reverse electrodialysis by removal of divalent cations in the dilute solution: A Nernst-Planck based study. J. Membr. Sci. 2020, 598, 117784. [Google Scholar] [CrossRef]
- Rijnaarts, T.; Huerta, E.; van Baak, W.; Nijmeijer, K. Effect of divalent cations on RED performance and cation exchange membrane selection to enhance power densities. Environ. Sci. Technol. 2017, 51, 13028–13035. [Google Scholar] [CrossRef]
- Moore, W.J. Physical Chemistry; Prentice-Hall, Inc.: Hoboken, NJ, USA, 1974; ISBN 0 582 44234 6. [Google Scholar]
- Veerman, J. The Effect of the NaCl bulk concentration on the resistance of ion exchange membranes—Measuring and modeling. Energies 2020, 13–18, 1946. [Google Scholar] [CrossRef] [Green Version]
- Długołęcki, P.; Nymeijer, K.; Metz, S.; Wessling, M. Current status of ion exchange membranes for power generation from salinity gradients. J. Membr. Sci. 2008, 319, 214–222. [Google Scholar] [CrossRef]
- Gómez-Coma, L.; Ortiz-Martínez, V.M.; Carmona, J.; Palacio, L.; Prádanos, P.; Fallanza, M.; Ortiz, A.; Ibañez, R.; Ortiz, I. Modeling the influence of divalent ions on membrane resistance and electric power in reverse electrodialysis. J. Membr. Sci. 2019, 592, 117385. [Google Scholar] [CrossRef]
- Avci, A.H.; Sarkar, P.; Tufa, R.A.; Messana, D.; Argurio, P.; Fontananova, E.; di Profio, G.; Curcio, E. Effect of Mg2+ ions on energy generation by reverse electrodiakysis. J. Membr. Sci. 2016, 520, 499–506. [Google Scholar] [CrossRef]
- Vermaas, D.A.; Guler, E.; Saakes, M.; Nijmeijer, K. Theoretical power density from salinity gradients using reverse electrodialysis. Energy Procedia 2012, 20, 170–184. [Google Scholar] [CrossRef] [Green Version]
- Veerman, J.; Saakes, M.; Metz, S.J.; Harmsen, G.J. Reverse electrodialysis: Performance of a stack with 50 cells on the mixing of sea and river water. J. Membr. Sci. 2009, 327, 136–144. [Google Scholar] [CrossRef] [Green Version]
- Sata, T. Ion Exchange Membranes—Preparation, Characterization, Modification and Application; Royal Society of Chemistry: Cambridge, UK, 2004; ISBN 0-85404-590-2. [Google Scholar]
- Tufa, R.A.; Pawlowski, S.; Veerman, J.; Bouzek, K.; Fontananova, E.; di Profio, G.; Velizarov, S.; Crespo, J.G.; Nijmeijer, K.; Curcio, E. Progress and prospects in reverse electrodialysis for salinity gradient energy conversion and storage. Appl. Energy 2018, 225, 290–331. [Google Scholar] [CrossRef]
- Güler, E.; van Baak, W.; Saakes, M.; Nijmeijer, K. Monovalent-ion-selective membranes for reverse electrodialysis. J. Membr. Sci. 2014, 455, 254–270. [Google Scholar] [CrossRef]
- Saracco, G. Transport properties of monovalent-ionpermselective membranes. Chem. Emfineering Sci. 1997, 52, 3019–3031. [Google Scholar] [CrossRef]
- Kester, D.R.; Pytkowicz, R.M. Sodium, Magnesium, and Calcium Sulfate Ion-Pairs in Seawater at 25C. Limnol. Oceanogr. 1969, 14, 686–692. [Google Scholar] [CrossRef]
- Buchner, R.; Chen, T.; Hefter, G. Complexity in “Simple” Electrolyte Solutions: Ion Pairing in MgSO4. J. Phys. Chem. B 2004, 108, 2365–2375. [Google Scholar] [CrossRef]
- Smith, R.M.; Martell, A.E.; Moitekaitis, R.J. NIST Critical Stability Constants of Metal Complexes Database 46. Gaithersburg, MD. Natl. Inst. Stand. Technol. 1995. Available online: https://www.nist.gov/system/files/documents/srd/46_8.pdf (accessed on 1 July 2021).
- OLI. OLI Analyser Studio; OLI Systems: Parsippany, NJ, USA, 2011. [Google Scholar]
- Magnico, P. Ion transport dependence on the ion pairing solvation competition in cation-exchange membranes. J. Membr. Sci. 2015, 483, 112–127. [Google Scholar] [CrossRef]
- Soldatov, V.S.; Kosandrovich, E.G.; Bezyazychnaya, T.V. Quantum chemical evidence of a fundamental difference between hydrations and ion exchange selectivities of sodium and potassium ions on carboxylic and sulfonic acid cation exchangers. J. Struct. Chem. 2020, 61, 1898–1909. [Google Scholar] [CrossRef]
- Shaposhnik, V.A.; Butyrskaya, E.V. Computer Simulation of Cation-Exchange Membrane Structure: An Elementary Act of Hydrated Ion Transport. Russ. J. Electrochem. 2004, 40, 767–770. [Google Scholar] [CrossRef]
- Badessa, T.; Shaposhnik, V. The electrodialysis of electrolyte solutions of multi-charged cations. J. Membr. Sci. 2016, 498, 86–93. [Google Scholar] [CrossRef]
- Badessa, T.S.; Shaposhnik, V.A.; Nartova, M.R. Transport of multi-charged cations through cation exchange membrane by electrodialysis. Sorpt. Chromatogr. Process. 2015, 15, 450–455. [Google Scholar]
- Pourcelly, G.; Oikonomou, A.; Gavach, C.; Hurwitz, H.D. Influence of the water content on the kinetics of counter-ion transport in perfluorosulphonic membranes. J. Electroanal. Chem. 1990, 287, 43–59. [Google Scholar] [CrossRef]
- Farhat, T.R.; Schlenoff, J.B. Doping-Controlled Ion Diffusion in Polyelectrolyte Multilayers: Mass Transport in Reluctant Exchangers. J. Am. Chem. Soc. 2003, 125, 4627–4636. [Google Scholar] [CrossRef]
- Yaroslavtev, A.B. Perfluorinated on-exchange membranes. Polym. Sci. Ser. A 2013, 55, 674–698. [Google Scholar] [CrossRef]
- Yaroslavtev, A.B.; Nikonenko, V.V.; Zabolotsky, V.I. Ion transfer in ion-exchange and membrane materials. Russ. Chem. Rev. 2004, 72–75, 393–421. [Google Scholar] [CrossRef]
- Badessa, T.S.; Shaposhnik, V.A. The dependence of electrical conductivity of ion exchange membranes on the charge of counter ions. Кoнденсирoванные Среды И Межфазные Границы 2014, 16, 129–133. [Google Scholar]
- Veerman, J.; de Jong, R.M.; Saakes, M.; Metz, S.J.; Harmsen, G.J. Reverse electrodialysis: Comparison of six commercial membrane pairs on the thermodynamic efficiency and power density. J. Membr. Sci. 2009, 343, 7–15. [Google Scholar] [CrossRef]
- Veerman, J.; Saakes, M.; Metz, S.J.; Harmsen, G.J. Reverse electrodialysis: A validated process model for design and optimization. Chem. Eng. J. 2011, 166, 256–268. [Google Scholar] [CrossRef]
- Abidin, M.N.Z.; Nasef, M.M.; Veerman, J. Towards the development of new generation of ion exchange membranes for reverse electrodialysis: A review. Desalination 2022, 537, 115854. [Google Scholar] [CrossRef]
- Bazinet, L.; Georoy, T.R. Electrodialytic Processes: Market Overview, Membrane Phenomena, Recent Developments and Sustainable Strategies. Membranes 2020, 10, 221. [Google Scholar] [CrossRef]


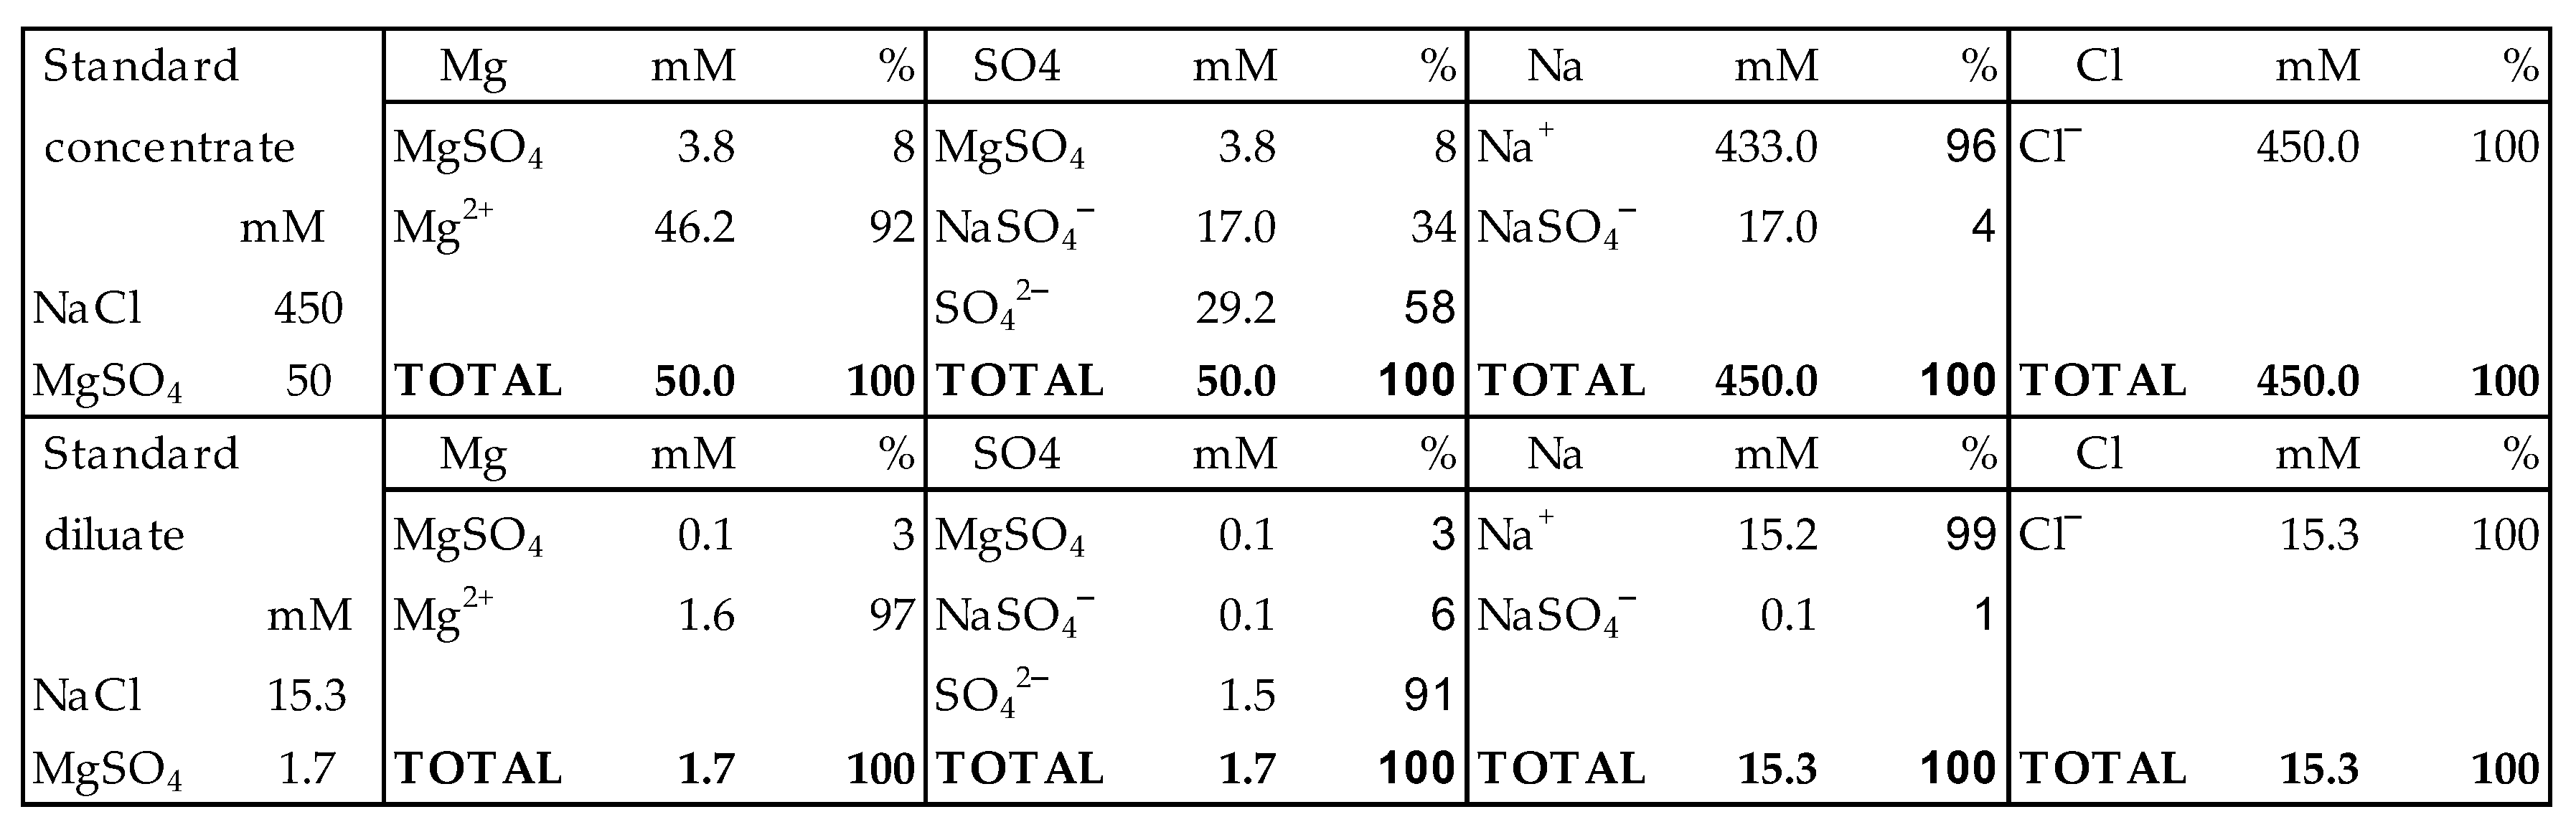
| Lake IJssel mg/L mmol/L mol% meq/L eq% | Sea mg/L mmol/L mol% meq/L eq% | |||||||||
|---|---|---|---|---|---|---|---|---|---|---|
| Na+ | 41.4 | 1.8 | 46 | 1.8 | 30 | 10,556 | 459 | 86 | 459 | 78 |
| K+ | 4 | 0.1 | 3 | 0.1 | 2 | 380 | 10 | 2 | 10 | 2 |
| Ca2+ | 65 | 1.6 | 41 | 3.2 | 53 | 400 | 10 | 2 | 20 | 3 |
| Mg2+ | 10.2 | 0.4 | 10 | 0.8 | 13 | 1262 | 52 | 10 | 104 | 18 |
| total | 120.6 | 3.9 | 100 | 6 | 100 | 12,598 | 531 | 100 | 592 | 100 |
| HCO3− | 141 | 2.3 | 35 | 2.3 | 32 | 140 | 2 | 0 | 2 | 0 |
| Cl− | 126 | 3.6 | 55 | 3.6 | 50 | 18,980 | 535 | 95 | 535 | 90 |
| Br− | 0.3 | 0 | 0 | 0 | 0 | 65 | 1 | 0 | 1 | 0 |
| SO42− | 64.3 | 0.7 | 11 | 1.3 | 18 | 2649 | 28 | 5 | 55 | 9 |
| total | 331.8 | 6.5 | 100 | 7.2 | 100 | 21,836 | 565 | 100 | 593 | 100 |
| Cations | λ0 S∙cm2 mol−1 | Anions | λ0 S∙cm2 mol−1 |
|---|---|---|---|
| Na+ | 50.11 | Cl− | 76.34 |
| K+ | 73.52 | Br− | 78.4 |
| ½ Mg2+ | 53.06 | I− | 76.8 |
| ½ Ca2+ | 59.50 | ½ SO42− | 79.8 |
| Feed Water | Salt Conc.(eq/L) | Divalent Ions in Feed (eq%) | Divalent Ions | Membrane | Divalent Ions in Gel Phase (Eq%) | ||
|---|---|---|---|---|---|---|---|
| CD = 1 | CD = 3 | CD = 9 | |||||
| Lake IJssel | 0.006 | 68% | Mg2+/Ca2+ | CEM | 96% | 98% | 99% |
| Sea | 0.6 | 21% | Mg2+/Ca2+ | CEM | 33% | 48% | 64% |
| Lake IJssel | 0.006 | 18% | SO42− | AEM | 85% | 92% | 95% |
| Sea | 0.6 | 9% | SO42− | AEM | 16% | 29% | 47% |
Disclaimer/Publisher’s Note: The statements, opinions and data contained in all publications are solely those of the individual author(s) and contributor(s) and not of MDPI and/or the editor(s). MDPI and/or the editor(s) disclaim responsibility for any injury to people or property resulting from any ideas, methods, instructions or products referred to in the content. |
© 2023 by the author. Licensee MDPI, Basel, Switzerland. This article is an open access article distributed under the terms and conditions of the Creative Commons Attribution (CC BY) license (https://creativecommons.org/licenses/by/4.0/).
Share and Cite
Veerman, J. Concepts and Misconceptions Concerning the Influence of Divalent Ions on the Performance of Reverse Electrodialysis Using Natural Waters. Membranes 2023, 13, 69. https://doi.org/10.3390/membranes13010069
Veerman J. Concepts and Misconceptions Concerning the Influence of Divalent Ions on the Performance of Reverse Electrodialysis Using Natural Waters. Membranes. 2023; 13(1):69. https://doi.org/10.3390/membranes13010069
Chicago/Turabian StyleVeerman, Joost. 2023. "Concepts and Misconceptions Concerning the Influence of Divalent Ions on the Performance of Reverse Electrodialysis Using Natural Waters" Membranes 13, no. 1: 69. https://doi.org/10.3390/membranes13010069