Article

Model Evaluation of the Microbial Metabolic Processes in a Hydrogen-Based Membrane Biofilm Reactor for Simultaneous Bromate and Nitrate Reduction

1
Guangxi Key Laboratory of Environmental Pollution Control Theory and Technology, Guilin University of Technology, 319 Yanshan Street, Guilin 541006, China
2
College of Life and Environmental Science, Guilin University of Electronic Technology, 1 Jinji Road, Guilin 541004, China
3
School of Chemistry and Materials Engineering, Huizhou University, 46 Yanda Road, Huizhou 516007, China
4
State Key Laboratory of Pollution Control and Resource Reuse, School of Environmental Science and Engineering, Tongji University, 1239 Siping Road, Shanghai 200092, China
*
Authors to whom correspondence should be addressed.
Membranes 2022, 12(8), 774; https://doi.org/10.3390/membranes12080774
Submission received: 19 July 2022 / Revised: 9 August 2022 / Accepted: 10 August 2022 / Published: 11 August 2022

Abstract

:
The H2-based membrane biofilm reactor (H2-MBfR) has been acknowledged as a cost-effective microbial reduction technology for oxyanion removal from drinking water sources, but it remains unknown how the evolution of biofilm characteristics responds to the changing critical operating parameters of the H2-MBfR for simultaneous bromate (BrO3) and nitrate (NO3) elimination. Therefore, an expanded multispecies model, applicable to mechanistically interpret the bromate-reducing bacteria (BRB)- and denitrifying bacteria (DNB)-dominated metabolic processes in the biofilm of the H2-MBfR, was developed in this study. The model outputs indicate that (1) increased BrO3 loading facilitated the metabolism of BRB by increasing BRB fraction and BrO3 gradients in the biofilm, but had a marginal influence on NO3 reduction; (2) H2 pressure of 0.04 MPa enabled the minimal loss of H2 and the extension of the active region of BRB and DNB in the biofilm; (3) once the influent NO3 concentration was beyond 10 mg N/L, the fraction and activity of BRB significantly declined; (4) BRB was more tolerant than DNB for the acidic aquatic environment incurred by the CO2 pressure over 0.02 MPa. The results corroborate that the degree of microbial competition for substrates and space in the biofilm was dependent on system operating parameters.

1. Introduction

Bromate (BrO3), a common disinfection byproduct formed during the advanced oxidation processes (especially ozonation) of drinking water, has been assigned as a Group 2B carcinogen with a maximum contaminant level of 10 μg/L in potable water by the World Health Organization [1,2,3]. The BrO3 concentration varies typically from below 30 μg/L in the ozonated surface water to 0.8–1.4 mg/L in the groundwater intruded by industrial discharges [2,4]. Current physicochemical approaches for aquatic BrO3 elimination, involving adsorption, separation, chemical reduction, and photo-/electro-catalysis, exhibit limited application potential due to their disadvantages in terms of high energy consumption, stringent optional conditions, and requirements of post-treatment steps [5,6,7]. Comparably, autotrophic microbial reduction has received increasing interest in the past decade, owing to its proven capacity of cost-efficiently converting BrO3 to innocuous Br under mild circumstances and the organic-deficient nature of most drinking water sources [6,8].
Nitrate (NO3) is a pervasive contaminant which coexists with BrO3 at a typical concentration range of 10–30 mg N/L in surface water and groundwater, and which can result in methemoglobinemia in infants [8,9,10,11]. This accentuates the necessity to develop robust technology capable of simultaneously eliminating BrO3 and NO3 from polluted drinking water sources. As an advanced autotrophic microbial reduction technology, the H2-based membrane biofilm reactor (H2-MBfR) has been successfully practiced at a pilot and/or commercial scale for eradicating a variety of oxidized pollutants, e.g., BrO3, NO3, sulfate, perchlorate, selenate, and chromate [9,12]. In this system, electron donor H2 diffuses through the wall of gas-permeable hollow fiber membranes (HFM), and supports the functional microorganisms in the HFM-attached biofilm to respire the electron acceptors (i.e., oxidized pollutants); such a scheme of passive gas delivery enables the full utilization of H2, as well as the efficient removal of targeted contaminants [9,13]. Several case studies have shown that, when the influent concentrations of BrO3 and NO3 were in the range of 0.1–1.5 mg/L and 5–20 mg N/L, respectively, which were approachable to those in real drinking water sources, the appreciable removal (beyond 95%) of both oxyanions could be realized in H2-MBfRs [1,8].
In H2-MBfRs, the biofilm microorganisms, which can dominate the reduction of BrO3 and NO3, are defined as bromate-reducing bacteria (BRB) and denitrifying bacteria (DNB), respectively [1,11]. Since H2 is shared by functional bacteria (e.g., BRB and DNB) in the biofilm as the sole electron donor to drive the reduction of oxidized pollutants, the microbial competition for H2 availability (controlled by H2 supplying pressure) inevitably occurs in H2-MBfRs [14]. The results of empirical studies corroborated that BrO3 and NO3- concentrations were critical to the efficiencies of microbial reduction, and the BrO3 reduction processes could be inhibited in the case of exorbitant NO3 loading [11,15]. Microbial community investigations have revealed the variation trends in the species and abundance of BRB and DNB in the biofilm systems under diverse BrO3 and NO3 loadings [6,11]. Despite the above progress, it remains understudied the extent to which the critical operating parameters drive the evolution of biofilm microenvironment, structure, and activity of the H2-MBfR for simultaneous BrO3 and NO3 elimination. This constitutes a major hindrance to our understanding of the interaction mechanism between BRB and DNB in the biofilm. The development of a systematic and quantitative framework might be a solution to this concern, given the difficulty in the use of present experimental means for elucidating the stratification features of biofilm.
The one-dimensional, multispecies biofilm model, developed on the AQUASIM platform, is a versatile tool applicable to quantitatively assess the steady-state characteristics of the biofilm, e.g., the substrate profiles, as well as microbial distribution and activities [16]. To date, a model framework, which can be implemented to simulate the simultaneous removal processes of BrO3 and NO3 in the H2-MBfR, is still unavailable in the literature. In this work, a sophisticated biofilm model was established on the AQUASIM platform to mechanistically interpret the BrO3 and NO3 reduction processes of H2-MBfR. On the basis of the previous model frameworks for NO3 removal [14,16], we proposed an expanded model framework through incorporation into the algorithm for the metabolic process kinetics of BRB, as well as the influences of CO2 addition (as carbon source and pH regulator) on metabolic process kinetics of BRB and DNB. Long- and short-term experimental data regarding BrO3 and NO3 removal, obtained from a lab-scale H2-MBfR, were used for the calibration of key model parameters and the validation of the model outputs, respectively. The validated model was then applied to evaluate the gradients of substrates (H2, BrO3, and NO3), as well as the distribution and activities of BRB and DNB in the biofilm, in the case of changing system operating parameters including the H2 pressure, CO2 addition, and influent BrO3 and NO3 concentrations.

2. Materials and Methods

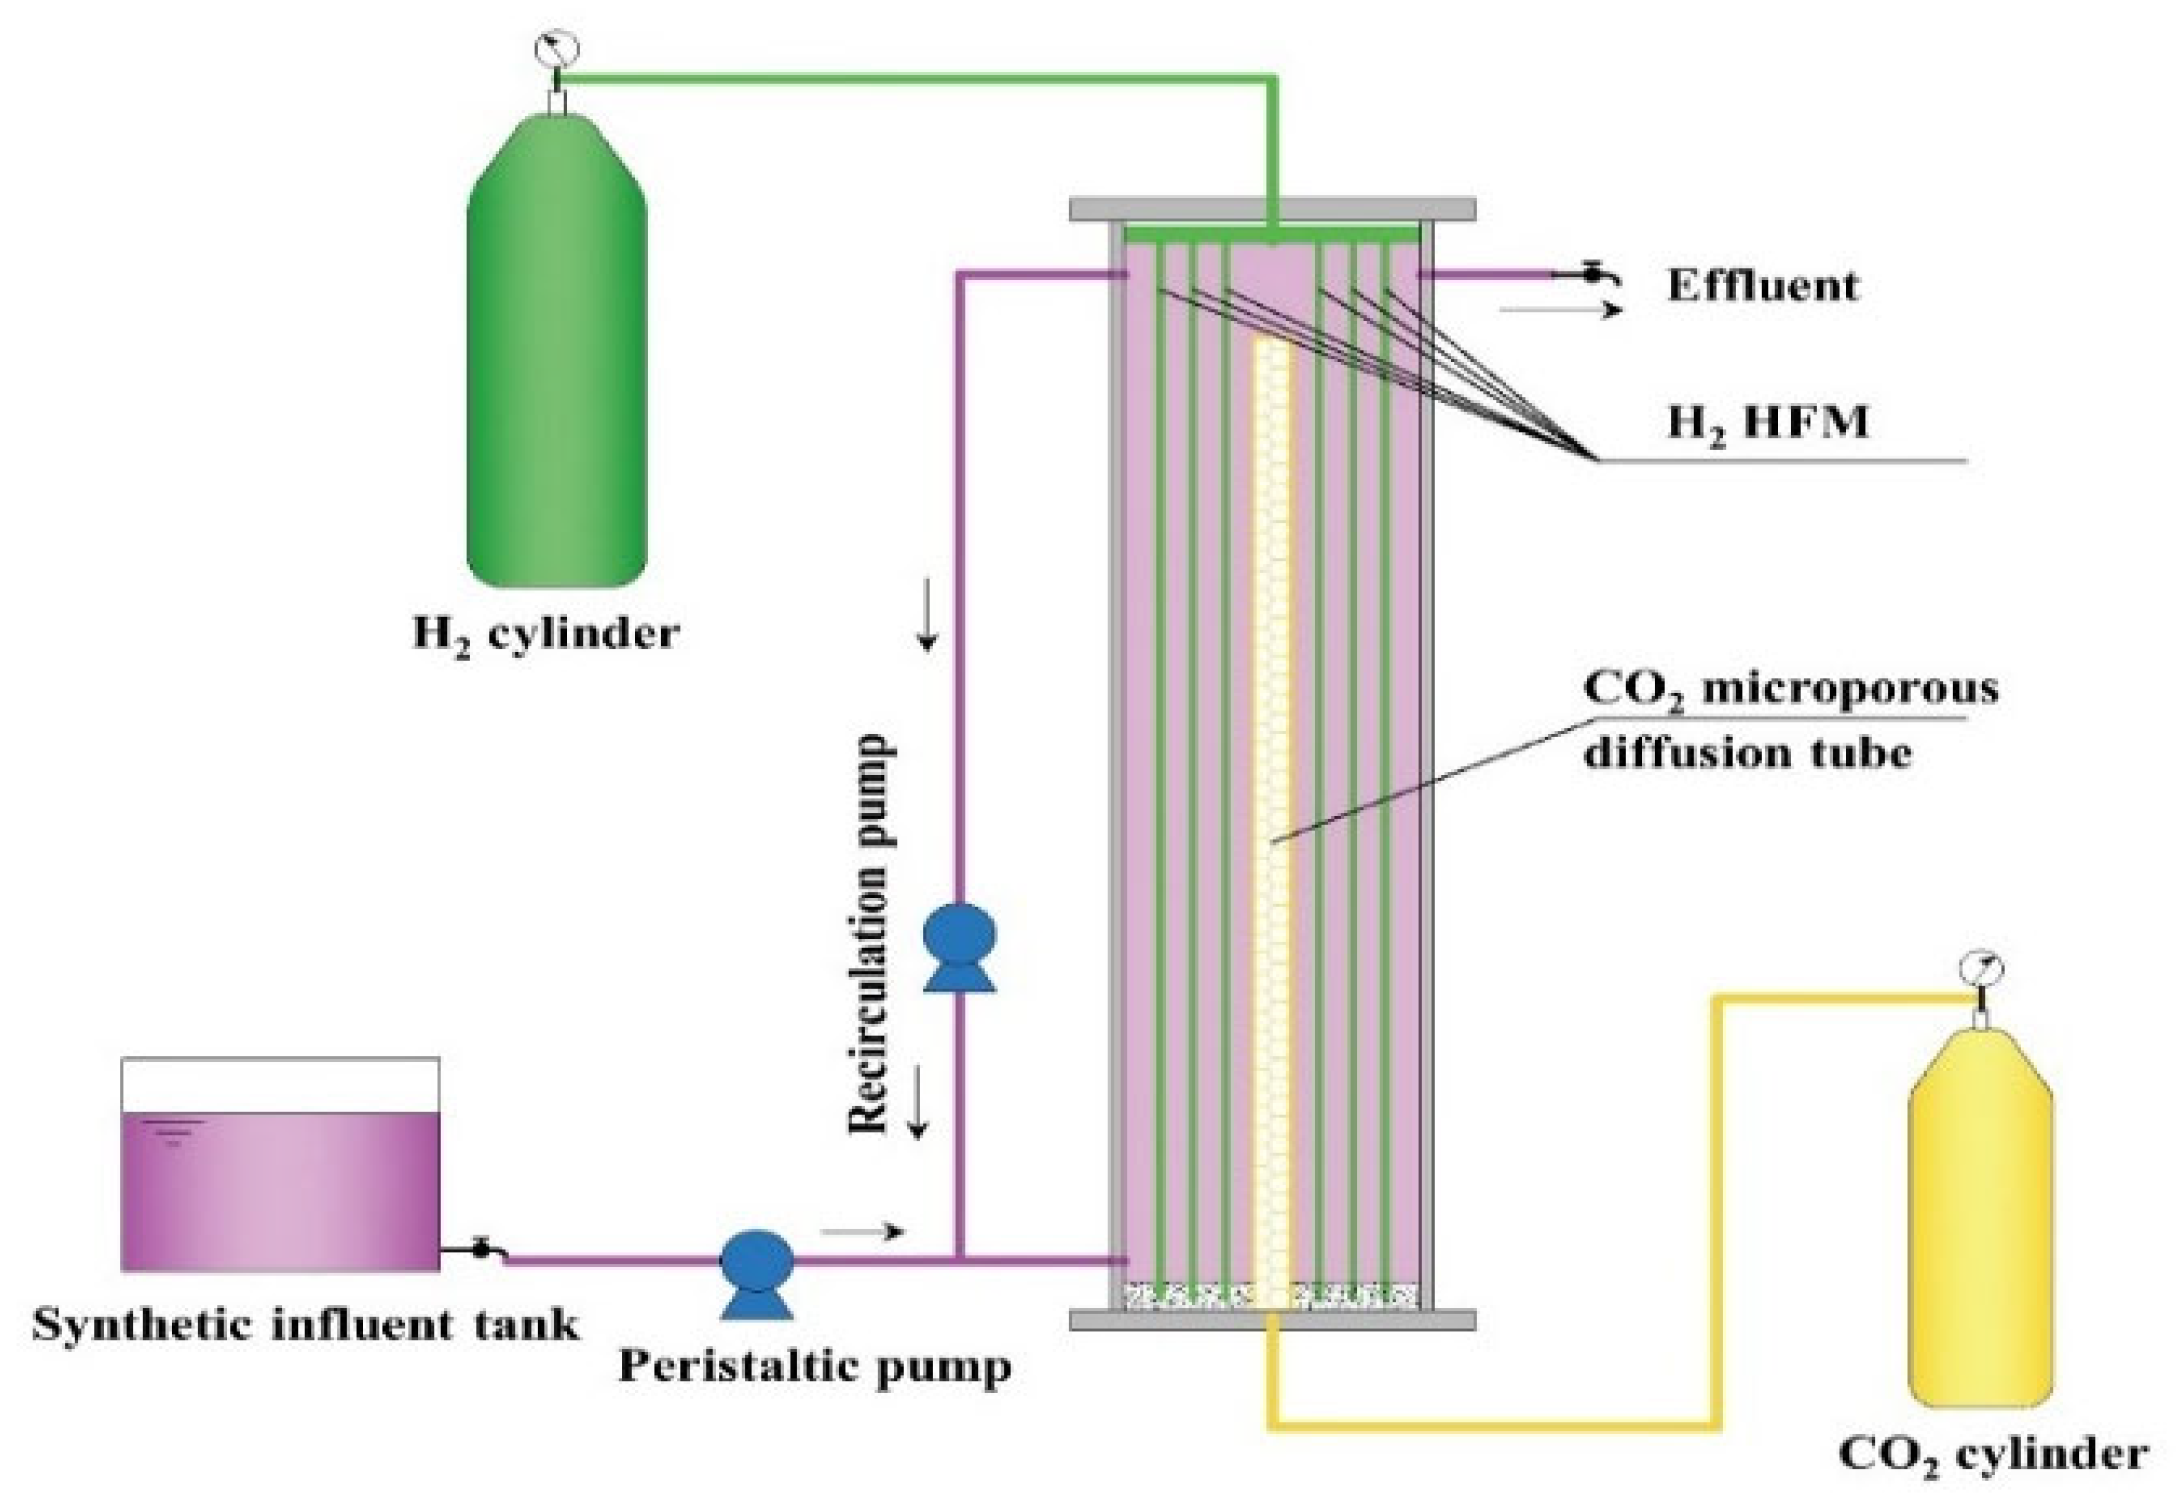
2.1. Reactor Setup and Start-Up

The schematic of the H2-MBfR used in this study is shown in Figure 1. The reactor consisted of a module containing 96 HFMs (Litree Company, Suzhou, China) and a microporous tube placed in a plexiglass cylinder (height = 22 cm, inner diameter = 6 cm, effective volume = 0.56 L). The average outer diameter and pore size of HFM was 1.5 mm and 0.02 μm, respectively, and the total membrane surface area of HFM module was 633 cm2. The module with a sealed lower end was connected to a H2 tank for delivering pressurized H2. Pure CO2 was supplied by the microporous tube with its bottom end linked to a CO2 tank to serve as carbon source and pH regulator. Synthetic influent was introduced into the reactor via a peristaltic pump (BT101L-DG-1, Lead Fluid, Baoding, China), and the effluent was collected from the outlet of the reactor. A recirculation pump (BT101L-YZ15/25, Lead Fluid, Baoding, China) was sustained at a high flowrate of 100 mL/min to keep the bulk liquid completely mixed. The reactor was inoculated with 50 mL of biomass collected from a denitrifying H2-MBfR in our lab. The synthetic influent, containing 10 mg N/L NaNO3 with an identical composition to that described in Li et al. [17], was used in the start-up period of the reactor. During the start-up period, the influent flowrate was maintained at 1.6 mL/min (resulting in an HRT of 5.8 h), and the H2 and CO2 pressure was kept at 0.04 and 0.012 MPa, respectively. After 30 days of operation, the influent flowrate was changed to 2.0 mL/min (corresponding to an HRT of 4.7 h) until the biofilm was well formed, and the performance of the reactor reached a steady state with stable NO3 removal.

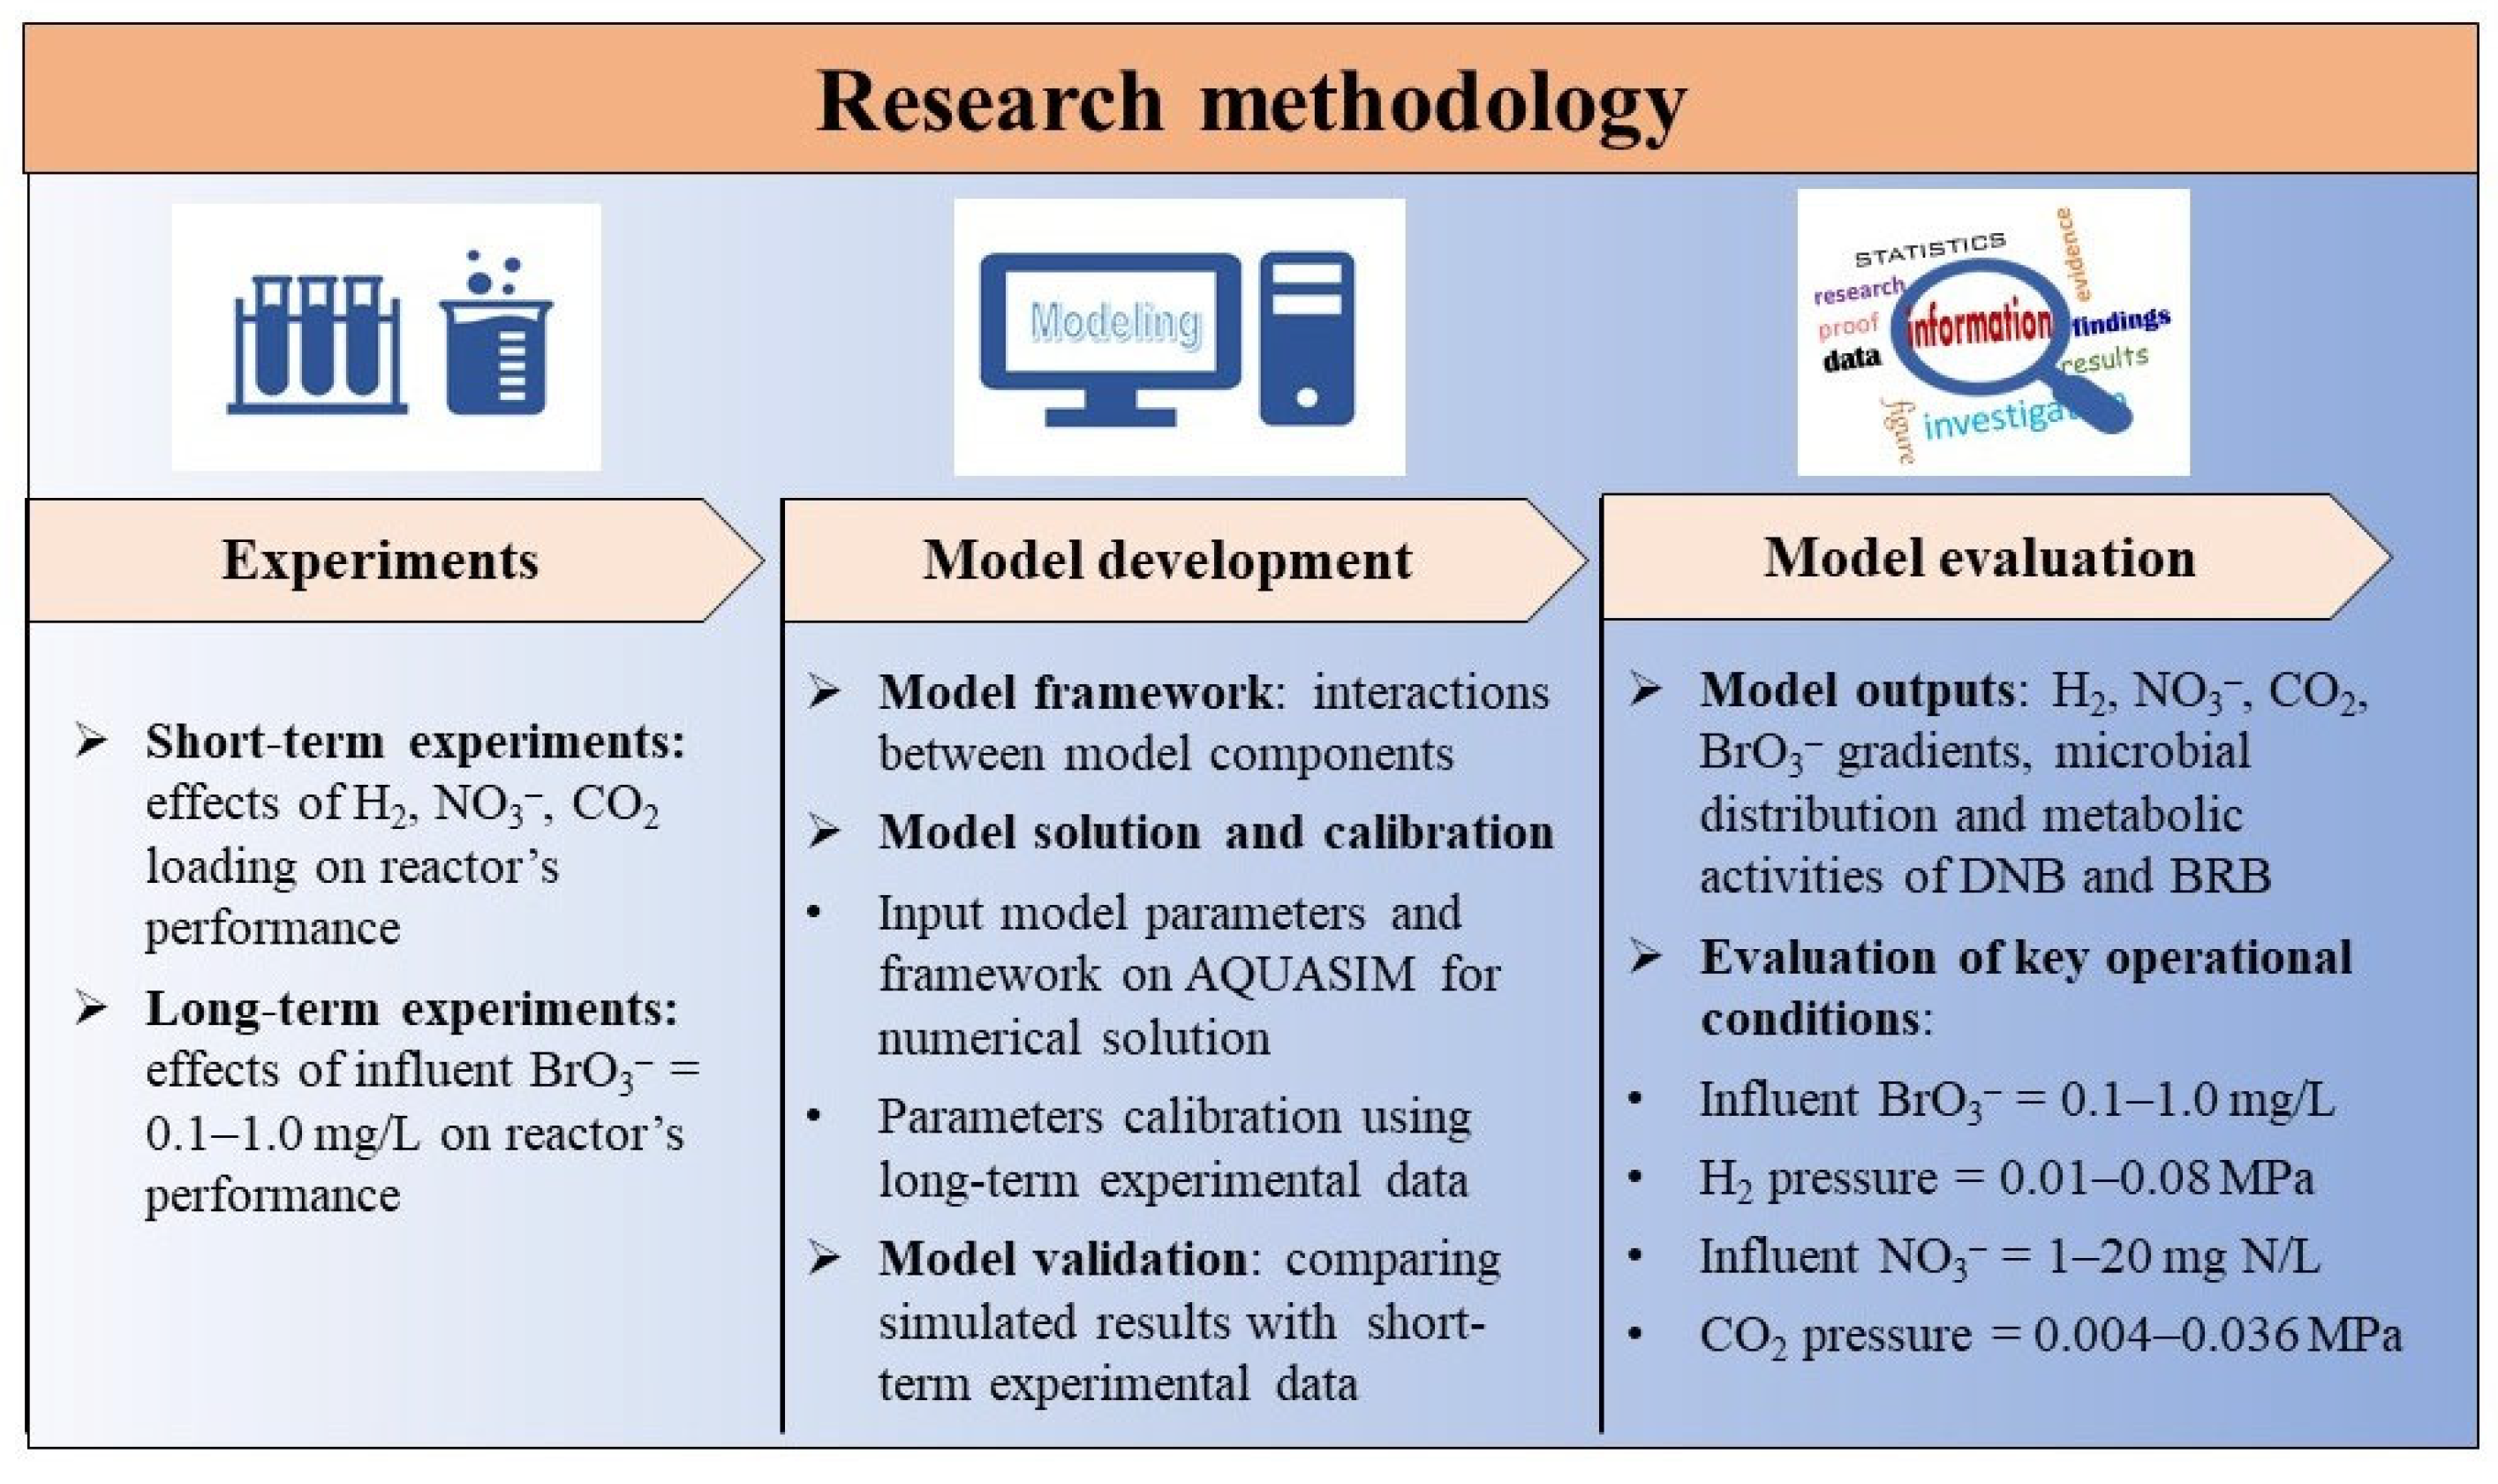
2.2. Short- and Long-Term Experiments and Sample Analysis

On days 31–40 of stage 1, short-term experiments were performed to assess the effects of H2 pressure (0.01–0.08 MPa), influent NO3 (1–20 mg N/L), and CO2 pressure (0.004–0.036 MPa) on the NO3 and BrO3 removal of the H2-MBfR. The detailed information concerning the operational conditions of short-term experiments can be found in Table S1. For each experiment, one system operating parameter was changed, while keeping the others fixed. Once the experiment condition was changed, aqueous samples were collected after three HRT operations of the system, in order to allow the stabilization of effluent contaminant concentrations [18]. Following the short-term experiments, long-term experiments (days 41–140) were carried out to investigate how the oxyanion removal performance of the system responded to the changing BrO3 loadings. As summarized in Table S2, in long-term experiments, the influent concentrations of BrO3 were set at 0.1, 0.5, and 1.0 mg/L in stage 3, stage 4, and stage 5, respectively, and the H2 and CO2 pressure were maintained at 0.04 and 0.012 MPa, respectively.
The collected aqueous samples were filtered immediately through a 0.22 µm pore size polycarbonate membrane filter (Anpel Co., Ltd., Shanghai, China) and stocked in a refrigerator (4 °C) until analyzed. The concentrations of NO3, NO2, and BrO3 were determined by ion chromatography (ICS-1000, Dionex, Sunnyvale, USA) equipped with an AS-19 column (4 × 250 mm, Dionex, Sunnyvale, USA). The dissolved H2 was determined using a H2 microsensor (H210, Unisense A/S Corp., Aarhus, Denmark). The pH value was measured using a pH meter (pHS-3C model, Leici, Shanghai, China). The contaminant removal flux was calculated using Equation (1):
J = Q A ( S i S e ) ,
where J is the NO3 and BrO3 removal flux in units of g N/(m2·day) and g BrO3/(m2·day), respectively, Q signifies the influent flowrate (m3/day), A refers to the total membrane surface area (m2), and Si and Se denote the influent concentration of NO3 or BrO3 and the effluent concentration of NO3 or BrO3, respectively.

2.3. Model Development and Evaluation

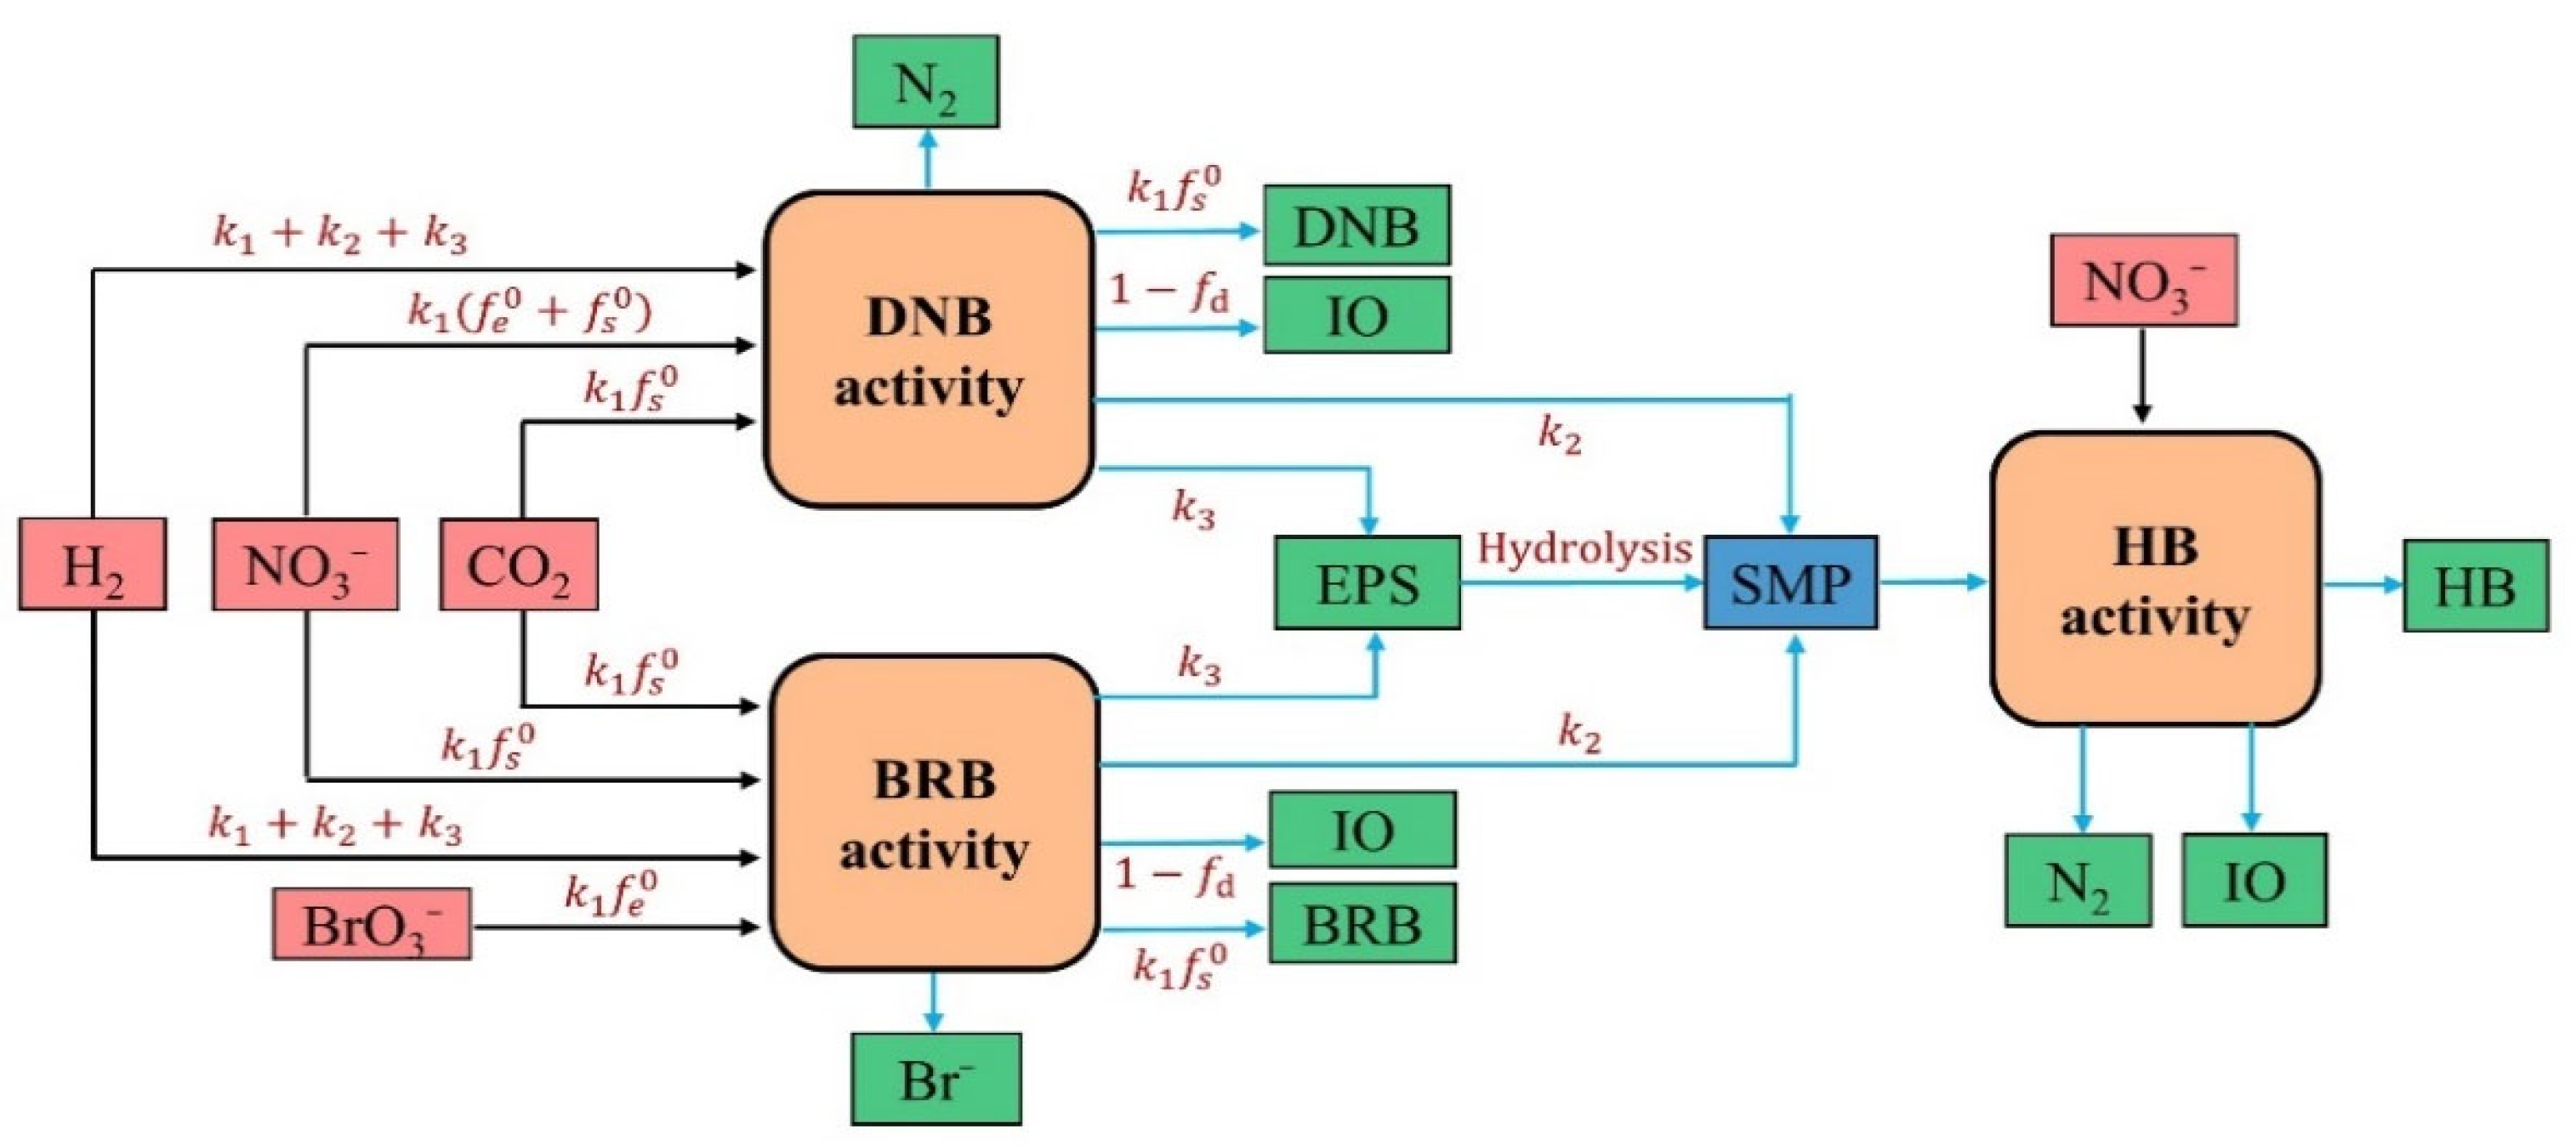
2.3.1. Model Framework Development

Unlike the classical biofilm models established by Tang et al. [14,16], the framework of the developed mathematical model involves the biochemical process of hydrogenotrophic BrO3 reduction, and it considers the effects on the metabolic process kinetics of BRB and DNB in the case of CO2 addition (as carbon source and pH regulator). Figure 2 shows the schematic of the involved biochemical processes and the correlated interactions between the model components in the biofilm. The model components include five solid components (i.e., BRB, DNB, heterotrophic bacteria (HB), extracellular polymeric substances (EPS), and inert organics (IO)) and five dissolved components (i.e., H2, CO2, NO3, BrO3, and soluble microbial products (SMP)). H2 is exploited by BRB and DNB as the electron donors, BrO3 and NO3 as the electron acceptors, and CO2 as the carbon source. In the conversion processes of BrO3 and NO3 to Br and N2, BRB and DNB obtain energy to sustain their growth and metabolism. H2 was the sole energy source of the hydrogenotrophic bacteria, since no organic carbon was introduced to the influent; thus, BRB and DNB could merely abstract electrons from H2 to drive the BrO3 and NO3 reduction. HB grows either on the SMP directly produced by BRB and DNB or indirectly on the hydrolyzed EPS (i.e., SMP) originated from BRB and DNB. The decay of BRB, DNB, and HB generates nonbiodegradable IO. The electrons provided from H2 can be classified into three portions during the BRB and DNB metabolic processes: bacterial cell synthesis (k1), SMP formation (k2), and EPS formation (k3); thus, k1 + k2 + k3 = 1. The electrons for cell synthesis are subdivided into the fraction for energy-providing reaction (fe0) and the other for synthesis reaction of true yield of biomass (fs0); therefore, fe0 + fs0 = 1. Here, fd represents the fraction of biodegradable biomass; hence, 1 − fd refers to the remaining nonbiodegradable biomass.

2.3.2. Model Solution and Calibration

The numerical solution of the model was implemented on software AQUASIM 2.1g, by inputting the process matrix (Table 1), stoichiometric and kinetic parameters (Table S3), process kinetic rate equations (Table 2), and experiment operational parameters of the H2-MBfR (Table S4). In particular, the calculation procedure for stoichiometric coefficients of model components (shown in Table 1) in the BRB metabolic process is exhibited in Section S1. Table S3 merely lists the calculated and recalibrated stoichiometric and kinetic parameters of the BRB metabolic process in this work, while other pertinent parameters can be found in Table S5. Bulk liquid pH is known to be a key factor correlated to the activities of the hydrogenotrophic microorganisms [13,19,20]. In order to quantitatively assess how bulk liquid pH affects the microbial metabolic activities, the inhibition factor of bulk liquid pH (fpH) was introduced to the kinetic rate expressions of the model framework, as shown in Table 2. According to the normalized Michaelis pH function [21], fpH can be computed using Equation (2).
f p H = 1 + 2 10 0.5 ( p K l p K h ) 1 + 10 ( p H p K h ) + 10 ( p K l p H ) ,
where pH values are the experimental measurements in this study; pKh and pKl denote the upper and lower pH values at which the metabolic rates are equal to 50% of the maximum rate at the optimum pH, respectively, and their values of 9.04 and 6.27 were adopted from previous studies [21,22,23].
Disparate reactor configurations, operating conditions, and HFM patterns commonly result in the varying compositions and metabolic kinetics of biofilms [24]. For the aim of matching the specific simulation scenarios, several parameters, i.e., H2 transfer coefficient of HFM (Km), maximum specific growth rate of DNB and BRB (µDNB and µBRB), and half-maximum-rate concentration of BrO3 for BRB (KBrO3), were recalibrated by fitting the measured effluent NO3 and BrO3 concentrations of the long-term operated system to the modeled results using the AQUASIM built-in iterative algorithms (Equation (3)). By minimizing the square error sums between the model predictions and experimental measurements, the selected parameters were calibrated to be the best-fit values.
χ 2 ( p ) = i = 1 n ( y m e a s , i y i ( p ) σ m e a s , i ) 2 ,
where ymeas,i and yi(p) represent the experimental results and model predictions at time i, and σmeas;i and n signify the standard deviation and number of data points, respectively.

2.3.3. Model Validation and Evaluation

The calibrated model was further validated by comparing the simulated results with experimentally measured NO3 and BrO3 removal fluxes in the short-term experiments. The validated model was then used to simulate the profiles of substrates, microbial distribution, and metabolic activities in the biofilm of the H2-MBfR operated in a series of system conditions, including influent BrO3 concentrations (0.1–1.0 mg/L), H2 pressure (0.01–0.08 MPa), influent NO3 concentration (1–20 mg N/L), and CO2 pressure (0.004–0.036 MPa), in order to investigate the evolution laws of biofilm microenvironment, structure, and activity in the H2-MBfR for NO3 and BrO3 removal, in the case of changing system conditions. A schematic of the research methodology is shown in Figure 3.

3. Results and Discussion

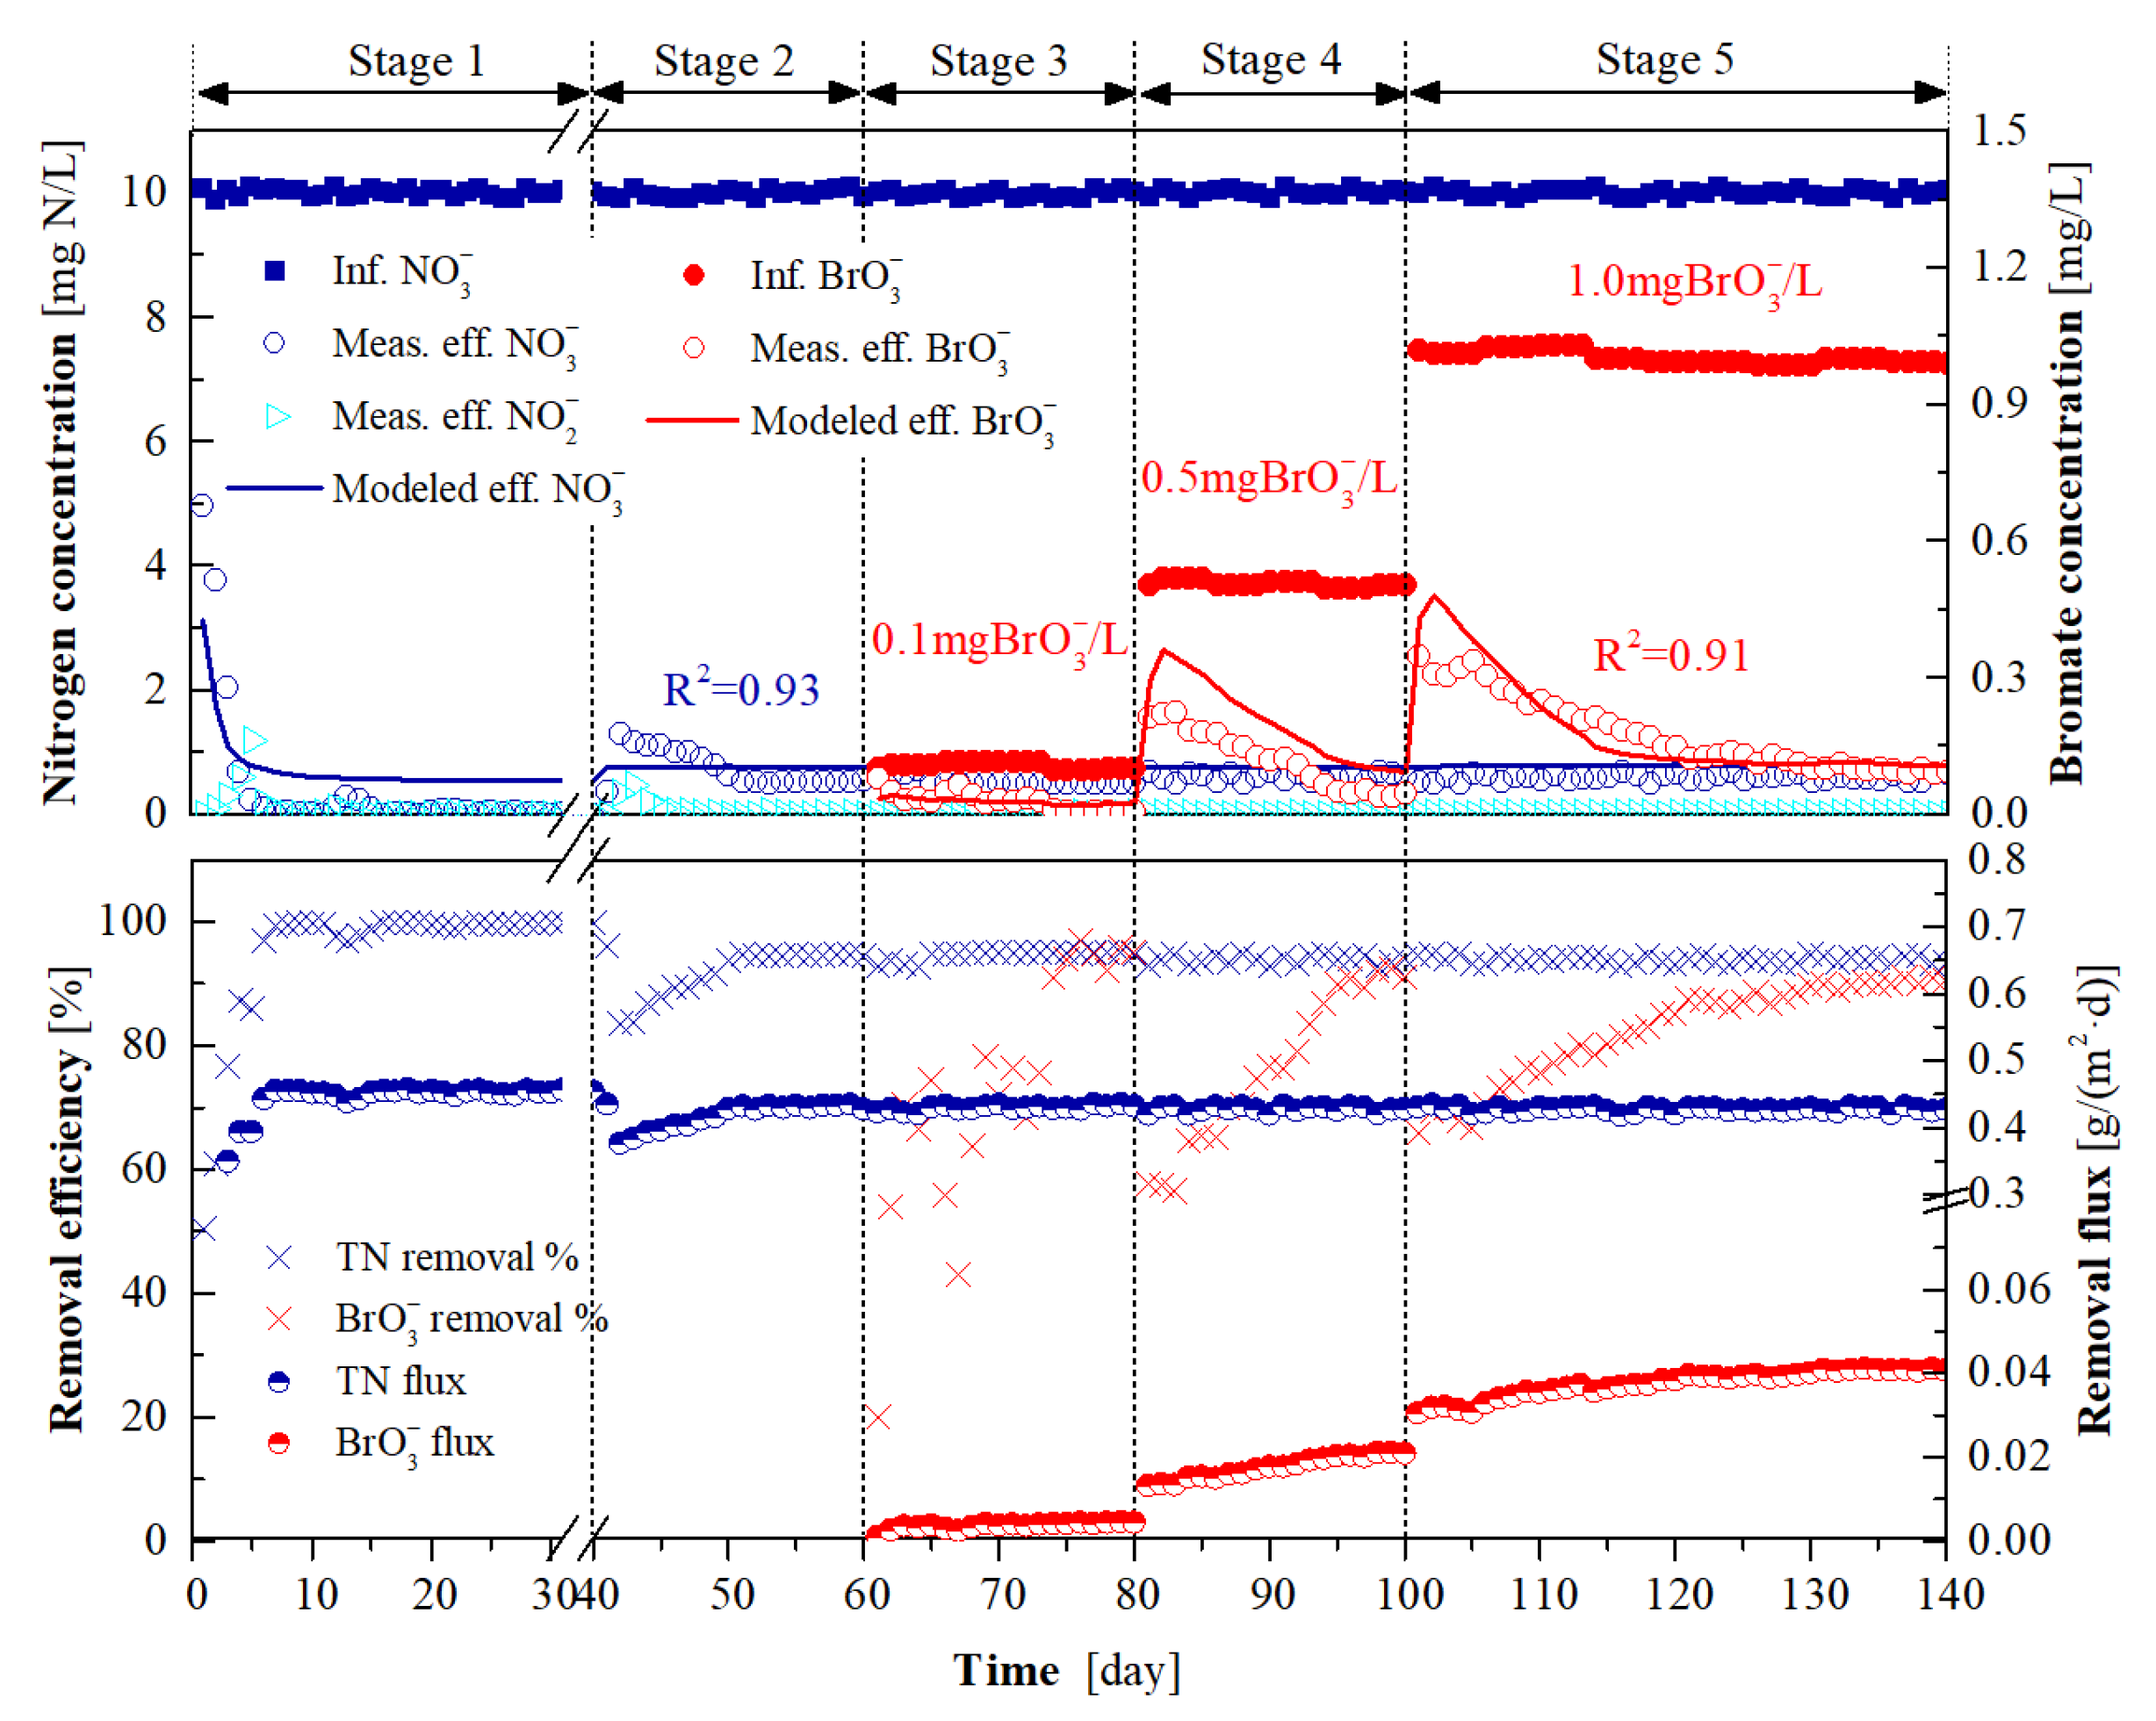
3.1. Long-Term H2-MBfR Performance and Model Calibration

The long-term experimental data obtained during the 140 days of operation of H2-MBfR were used for the recalibration of the selected parameters by fitting the effluent NO3 and BrO3 concentrations to those of simulated results. As shown in Figure 4, the measured data and simulated results were finely matched with the corresponding coefficients of determination (R2) up to 0.93 and 0.91 for the effluent NO3 and BrO3 concentrations, respectively. The analysis results concerning the sensitivity of the selected parameters to the effluent BrO3 and NO3 concentrations in the long-term operated H2-MBfR are shown in Figure 5. It can be found that the effluent BrO3 concentration of the H2-MBfR was most sensitive to µBRB and relatively sensitive to µDNB and Km (Figure 5a), while the effluent NO3 concentration was sensitive to Km and µDNB (Figure 5b). These results are in line with the findings of previous studies, i.e., the maximum specific growth rate of microorganisms and the H2 transfer coefficient of HFM were sensitive to the H2-MBfR performance [9,24,25].The best-fit values of Km, µBRB, µDNB, and KBrO3 were estimated to be 0.189 m/day, 0.85 day−1, 0.57 day−1, and 0.014 mg/L, respectively.
It can be also seen from Figure 4 that, after 7 days of start-up at stage 1, the denitrification flux of the H2-MBfR stabilized at around 0.45 g N/(m2·day), corresponding to a NO3 removal efficiency of over 99%. The slightly decreased denitrification flux of the system at stage 2 can be ascribed to the augment in the influent flowrate from 1.6 mL/min at stage 1 to 2.0 mL/min at this stage. The introduction of 0.1–1.0 mg/L BrO3 into the influent at stages 3–5 did not further decrease the denitrification performance of the system, given the identical average denitrification flux (0.42 g N/(m2·day)) at days 50–60 of stage 2 (without BrO3 addition) and stages 3–5. This observation is in agreement with the results of previous studies that a BrO3 concentration below 50 mg/L had no inhibitory effect on denitrification [15,26]. Empirical studies suggest that it usually takes 11–40 days to enable the H2-MBfRs to reach steady-state characteristics following the adjustment of operation conditions such as substrate loadings and HRT [17,27]. Similarly, our results indicate that, in the case of BrO3 addition, it took 15–25 days at stages 3–5 to enable the BrO3 removal of the H2-MBfR to reach a steady state. The stabilized BrO3 removal flux was increased from 0.0044 g/(m2·day) at stage 3 to 0.041 g/(m2·day) at stage 5. This is presumably attributed to the augment in the abundance and/or reduction rate of BRB with increasing influent BrO3 concentration. Furthermore, Downing and Nerenberg [15] found that a near 11-fold increase in the BrO3 removal flux of H2-MBfR was achieved when the influent BrO3 concentration was increased from 0.1 to 10 mg/L.

3.2. Short-Term H2-MBfR Performance and Model Validation

Short-term experiments were performed to evaluate the effects of the key influencing factors, i.e., H2 pressure, influent NO3 concentration, and CO2 pressure, on the NO3 and BrO3 reduction of the H2-MBfR. As shown in Figure 6a,b the determined BrO3 and NO3 removal fluxes were increased from 0.036 and 0.36 to 0.041 g/(m2·day) and 0.42 g N/(m2·day), respectively, as the H2 pressure was increased from 0.01 to 0.04 MPa. This is likely owing to the increased availability of electron donor, which enhanced the activities of BRB and DNB. A higher H2 pressure (0.06 and 0.08 MPa) did not ameliorate the BrO3 and NO3 removal, but led to the consumption of the remaining H2 in the effluent. Figure 6c,d delineate that, although the BrO3 and NO3 were all accumulated in the effluent, the NO3 removal flux was increased from 0.42 to 0.51 g N/(m2·day), accompanied by the significant decrease in BrO3 removal flux from 0.041 to 0.011 g/(m2·day), when the influent NO3 concentrations were augmented from 10 to 20 mg N/L. In accordance with this, Zhong et al. [6] observed that an influent NO3 concentration of 11.3 mg N/L was able to inhibit the BrO3 reduction in the H2-MBfR, which gave rise to the advantage of DNB over BRB when competing for electron donors. CO2 is arguably one of the most effective pH regulators in H2-MBfRs, and it can serve as the supplemental inorganic carbon source for hydrogenotrophic bacteria [13,28]. As depicted in Figure 6e,f, the shift of CO2 pressure from 0.012 to 0.036 MPa led to an apparent decline in the NO3 removal flux from 0.42 g N/(m2·day) at 0.012 MPa to 0.32 g N/(m2·day) at 0.036 MPa, but had a negligible influence on BrO3 removal flux. A plausible explanation is that, as the CO2 pressure was in the range of 0.020–0.036 MPa, the resultant bulk liquid pH of 6.0–6.9 was obviously lower than the reported favorable pH range (7.0–9.0) of DNB, according to existing studies [19,20], and some specific BRB was possibly able to endure more acidic conditions. Additionally, the measured removal fluxes of BrO3 and NO3 in the short-term experiments were employed to further validate the calibrated model. It can be observed from Figure 6b–f that, in all cases, the modeled results were quite approximate to the experimental data, indicating the good accuracy and reliability of the developed model for prediction of the simultaneous BrO3 and NO3 reduction processes in the H2-MBfR.

3.3. Model Evaluation of the Effects of BrO3 Loading

Figure 7 shows the simulated distribution of substrates, DNB and BRB fractions, as well as their metabolic activities, in the steady-state biofilms at stages 3–5 using the validated model. As shown in Figure 7a–c, in line with the counter-diffusional characteristics of dissolved substrate in H2-MBfR biofilm [29], the H2 concentration gradually decreased from HFM surface (i.e., biofilm thickness of zero point) toward to the bulk liquid side, while the other substrates (including CO2, NO3, and BrO3) originated from bulk liquid presented the contrary tendency. H2 and CO2 concentrations across the biofilm exhibited negligible difference when the influent concentration varied in the range of 0.1–1.0 mg/L (Figure 7a), attributed to the limited electron donor and carbon source consumption by BRB at low BrO3 loadings. It can also be seen from Figure 7a that CO2 was not a limiting factor as a carbon source for BRB and DNB anabolism, since its concentrations within the whole biofilm were much higher than the half-maximum-rate concentration (0.004 mg/L) adopted in the model. Moreover, the resultant bulk liquid pH 7.5 at the CO2 pressure of 0.012 MPa would not adversely affect the metabolic processes of BRB and DNB, since the maximum NO3 and BrO3 removal fluxes were attained at this CO2 pressure, as shown in Figure 6f. In line with this, the optimal pH reported for hydrogenotrophic denitrification and bromate reduction has been documented at neutral or weakly alkaline values [13,15].
Figure 7d plots the simulated profiles of DNB and BRB fractions in the biofilm. DNB dominated in the biofilm compared to BRB at all stages, indicating that DNB outcompeted DNB for space, likely associated with the much higher concentration of NO3 in the biofilm than BrO3. In particular, in response to the increase of the influent BrO3 concentration from stage 3 to stage 5, the BRB fraction (proportion) obviously increased in the biofilm. Figure 7e shows the DNB activity in the biofilm as a function of influent BrO3 concentration. The declined DNB activity in the biofilm range of 0–210 μm was mainly due to the inhibition of electron acceptors for DNB metabolism, given that the NO3 concentrations within this range were below the half-maximum-rate concentration of NO3 for DNB (0.2 mg N/L) [14]. The observed decrease in DNB activity from stage 3 to stage 5 at the outer layer biofilm was the result of the lower H2 concentrations. As shown in Figure 7f, the BRB activity in the biofilm increased from stage 3 to stage 5, owing to the augmented BRB fraction and BrO3 gradients in the biofilm, which facilitated the metabolism of BRB. In addition, the increased BRB fraction and activity, as exhibited in Figure 7d,f, helps explain the augmented BrO3 removal flux from stage 3 to stage 5 (Figure 4).

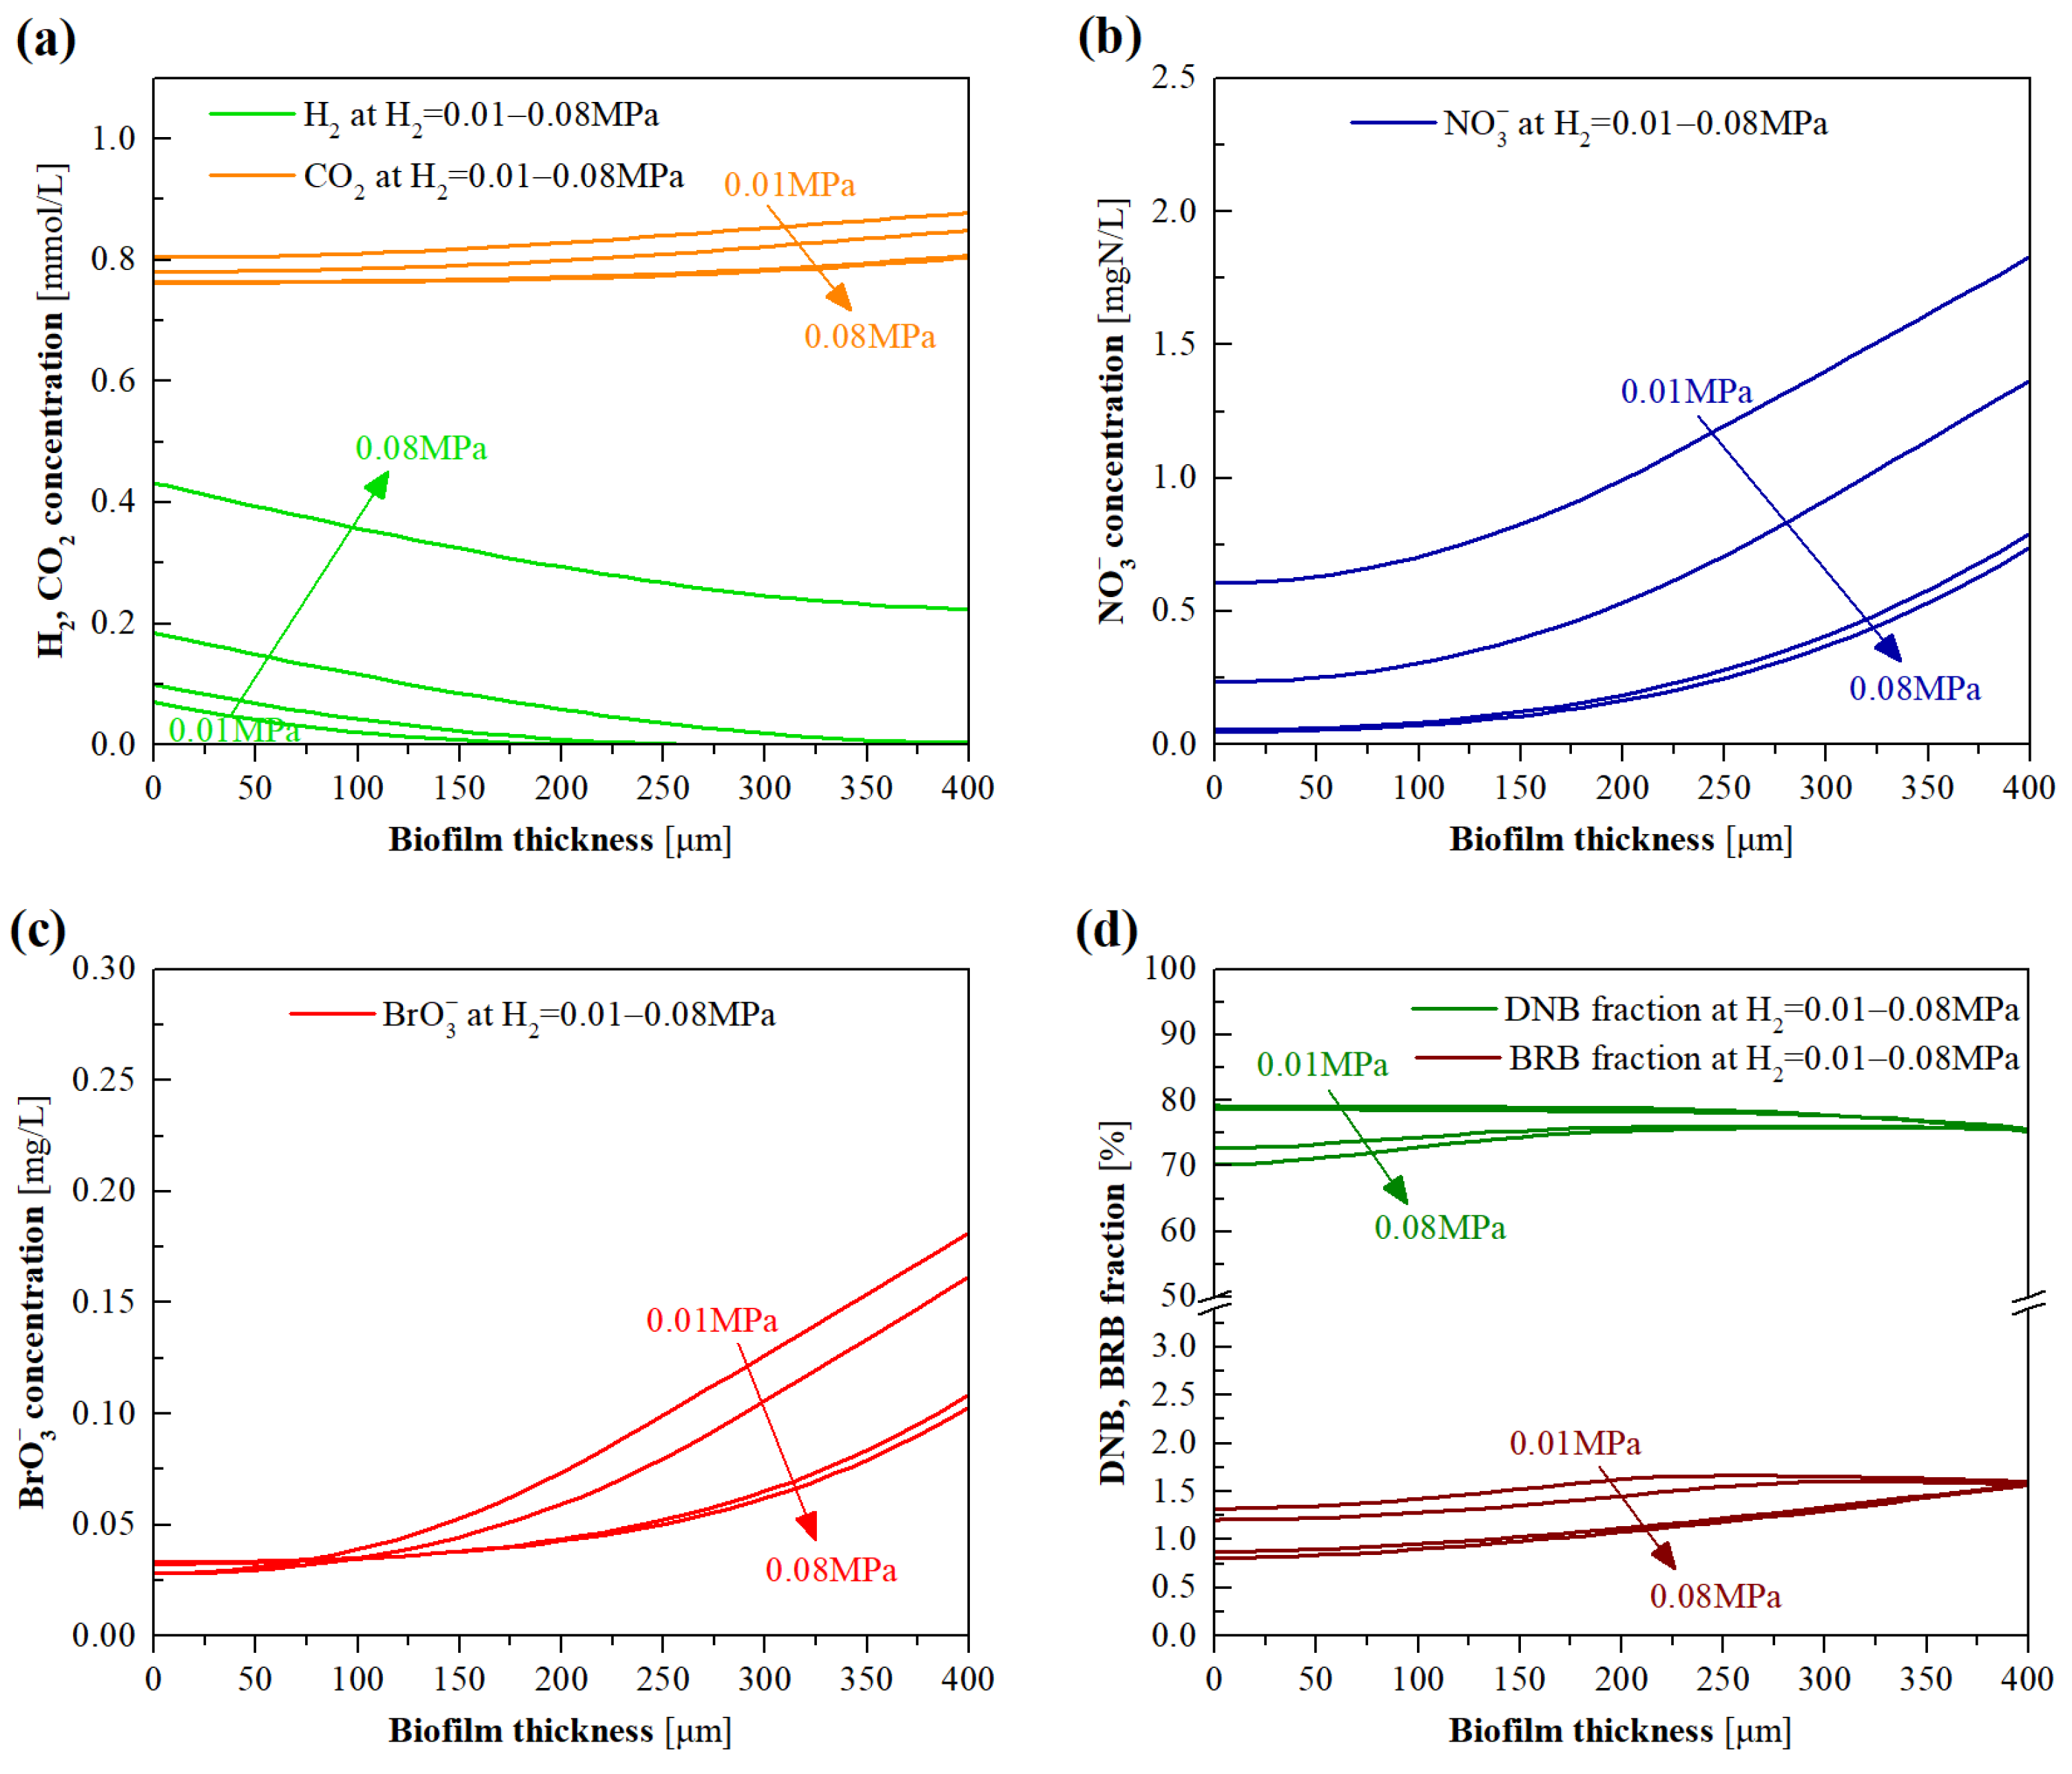
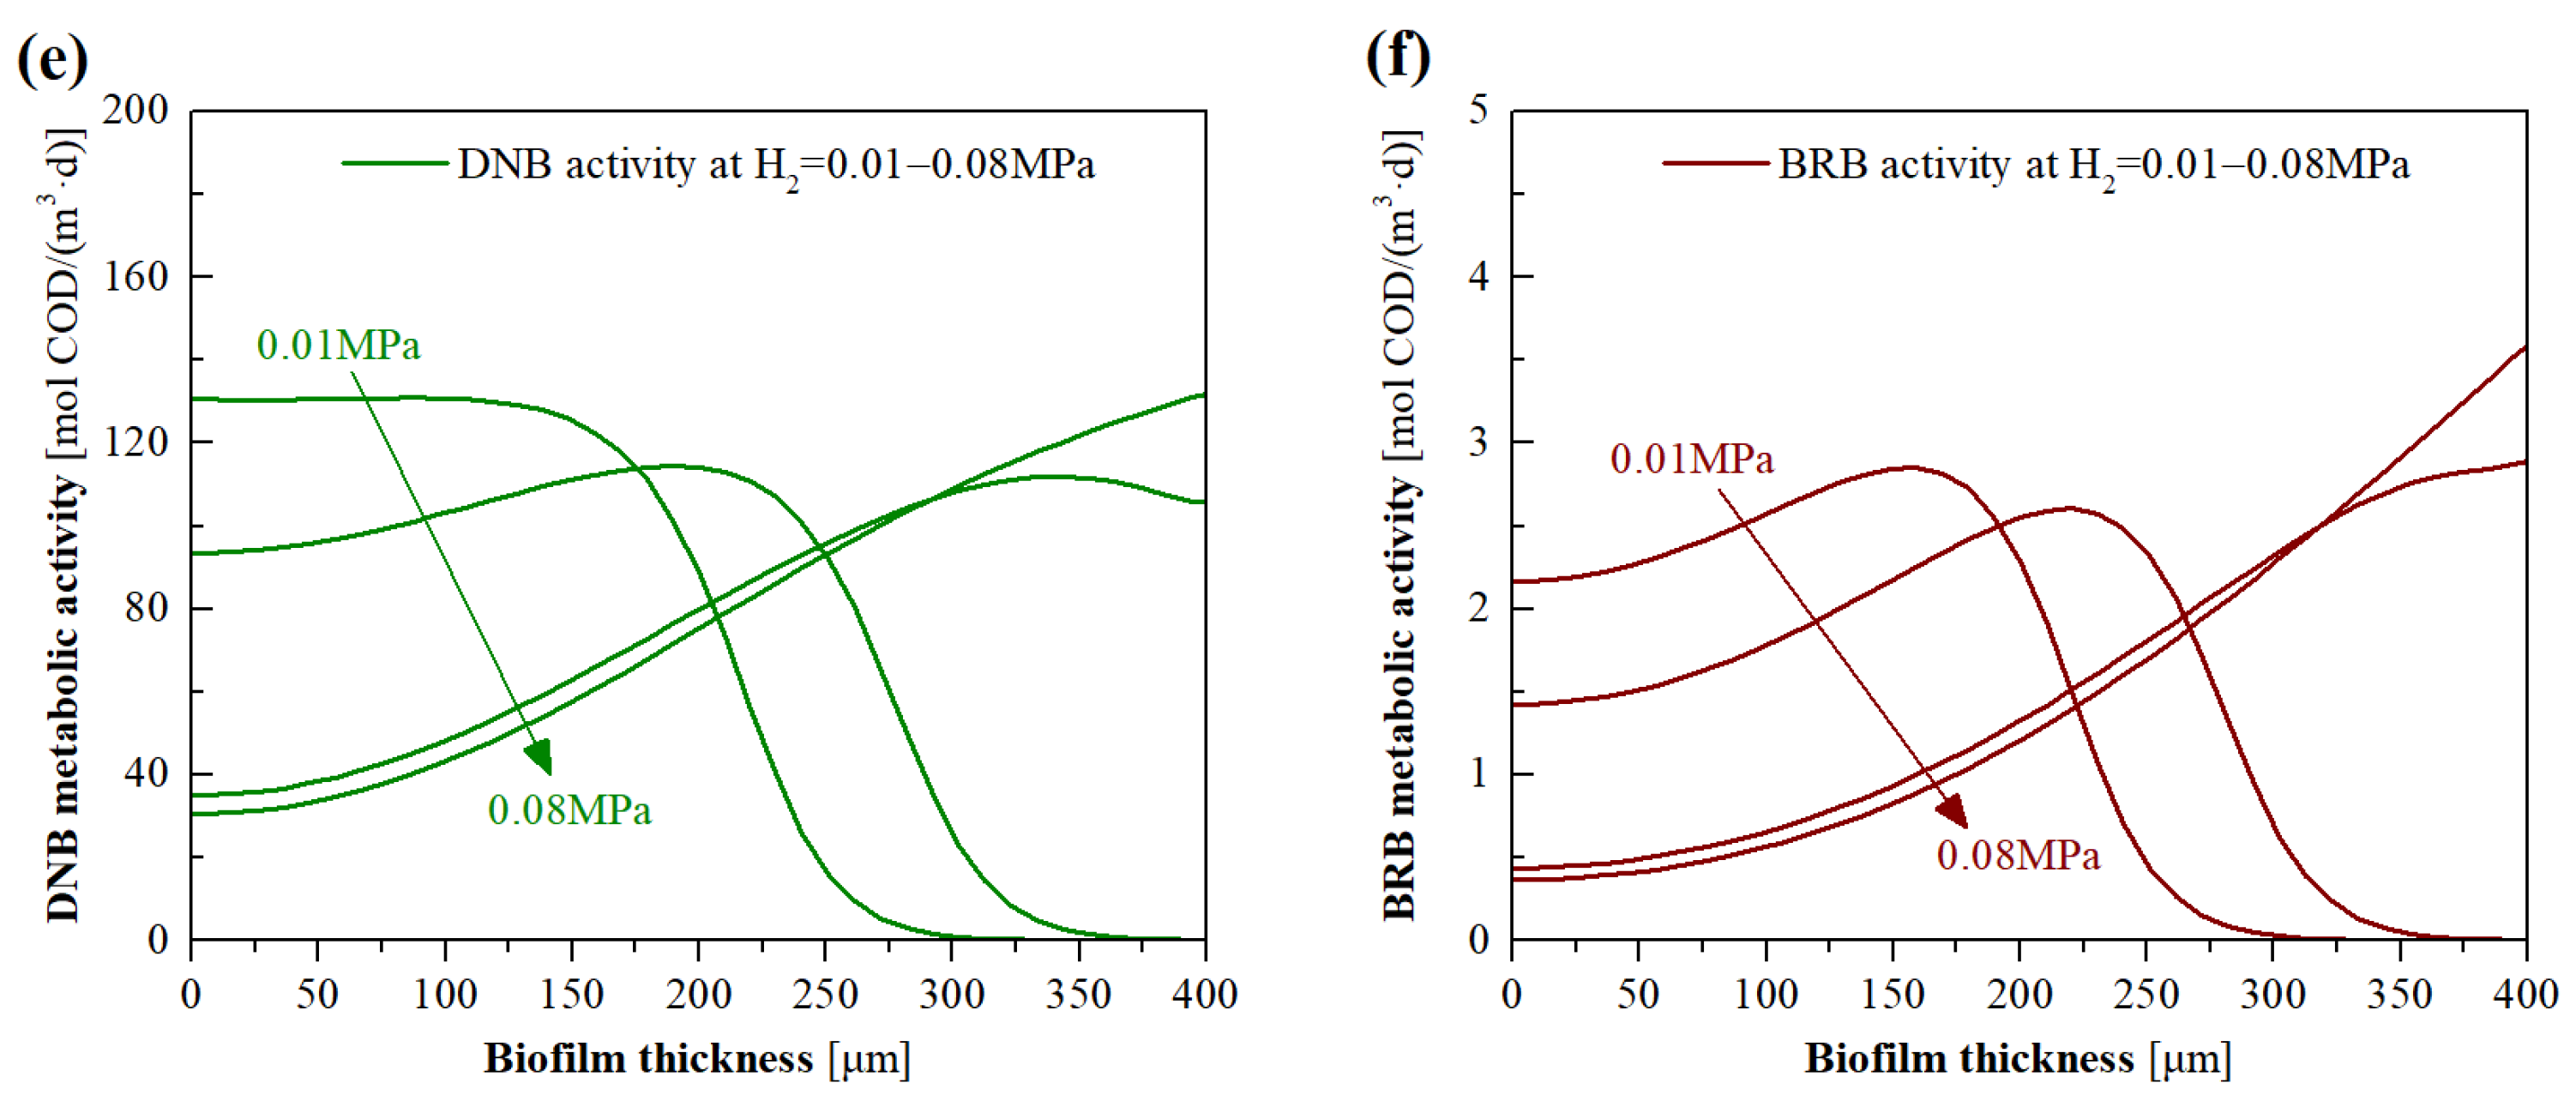
3.4. Model Evaluation of the Effects of H2 Pressure

Empirical studies [13,20] have collectively shown that excessive H2 supply pressure results in the H2 off-gassing problem, while an insufficient supply leads to unsatisfactory pollutant removal due to the electron donor scarcity in biofilms. Figure 8a plots the simulated H2 and CO2 concentration profiles in the biofilm at diverse H2 pressure (0.01–0.08 MPa). The H2 concentration in the biofilm increased with the increase in H2 pressure. At the H2 pressure of 0.01 MPa, more than half of the outer biofilm region (biofilm thickness >200 μm) could not deliver sufficient H2. H2 constitutes a limiting factor for microbial metabolic processes when its content is below the half-maximum-rate concentration. When H2 pressure was increased to 0.04 MPa, the H2 contents across the biofilm were all higher than the half-maximum-rate concentrations of H2 for DNB and BRB metabolism (0.002 mg/L) [14]; thus, it can be inferred that the H2 concentration within biofilm was not a decisive factor limiting NO3 and BrO3 removal at relatively high H2 pressure. Note that, at this H2 pressure, the simulated H2 concentration in the bulk liquid was 0.0074 mg/L, which is quite close to the measured result (0.008 mg/L) during the short-term experiments (Figure 6a) and is also comparable to the recommended aquatic H2 concentration (0.009 mg/L) in H2-MBfR [18]. Upon further increasing the H2 pressure, the H2 off-gassing phenomenon occurred. It can also be seen from Figure 8a that the CO2 concentration gradients in the biofilm hardly changed when the H2 pressure was higher than 0.04 MPa. This implies that the excessive H2 supply would not accelerate the carbon source utilization of BRB and DNB.
As depicted in Figure 8b,c, with the increase in H2 pressure from 0.01 to 0.04 MPa, the NO3 and BrO3 concentrations in the biofilm were found to markedly decline. This can be explained by the increased H2 availability for DNB and BRB compared to the biofilm exterior, which allowed a greater reduction in NO3 and BrO3 in the exterior rather than the interior of biofilm. However, NO3 and BrO3 concentration gradients hardly varied once the H2 pressure exceeded 0.04 MPa, which is in accordance with the experimental findings of the short-term experiments that the NO3 and BrO3 removal marginally changed at the excessive H2 pressure (shown in Figure 6b). According to the simulated BrO3 concentration profiles, BrO3 concentrations in the biofilm were all greater than its calibrated half-maximum-rate concentration (0.014 mg/L) at the simulated H2 pressure range, indicating that BrO3 loading was also not a limiting factor to BRB activity. The increased H2 availability in the outer layer of the biofilm resulted in the extension of the active region of DNB and BRB from the biofilm interior to the whole biofilm, as revealed in Figure 8e,f. In particular, the decreased activities of DNB and BRB in the inner layer of biofilm with increasing H2 pressure were mainly the consequence of the concurrently decreased concentrations of NO3 and BrO3 (Figure 8b,c) and the fractions of DNB and BRB (Figure 8d). In the case of low H2 pressure (0.01 and 0.02 MPa), the biofilm thicknesses of 200 and 260 μm were the locations where the H2 concentrations were all below the half-maximum-rate concentrations of DNB and BRB (Figure 8a); beyond these thicknesses, the metabolic activities of DNB and BRB began to dramatically decrease, as delineated in Figure 8e,f.

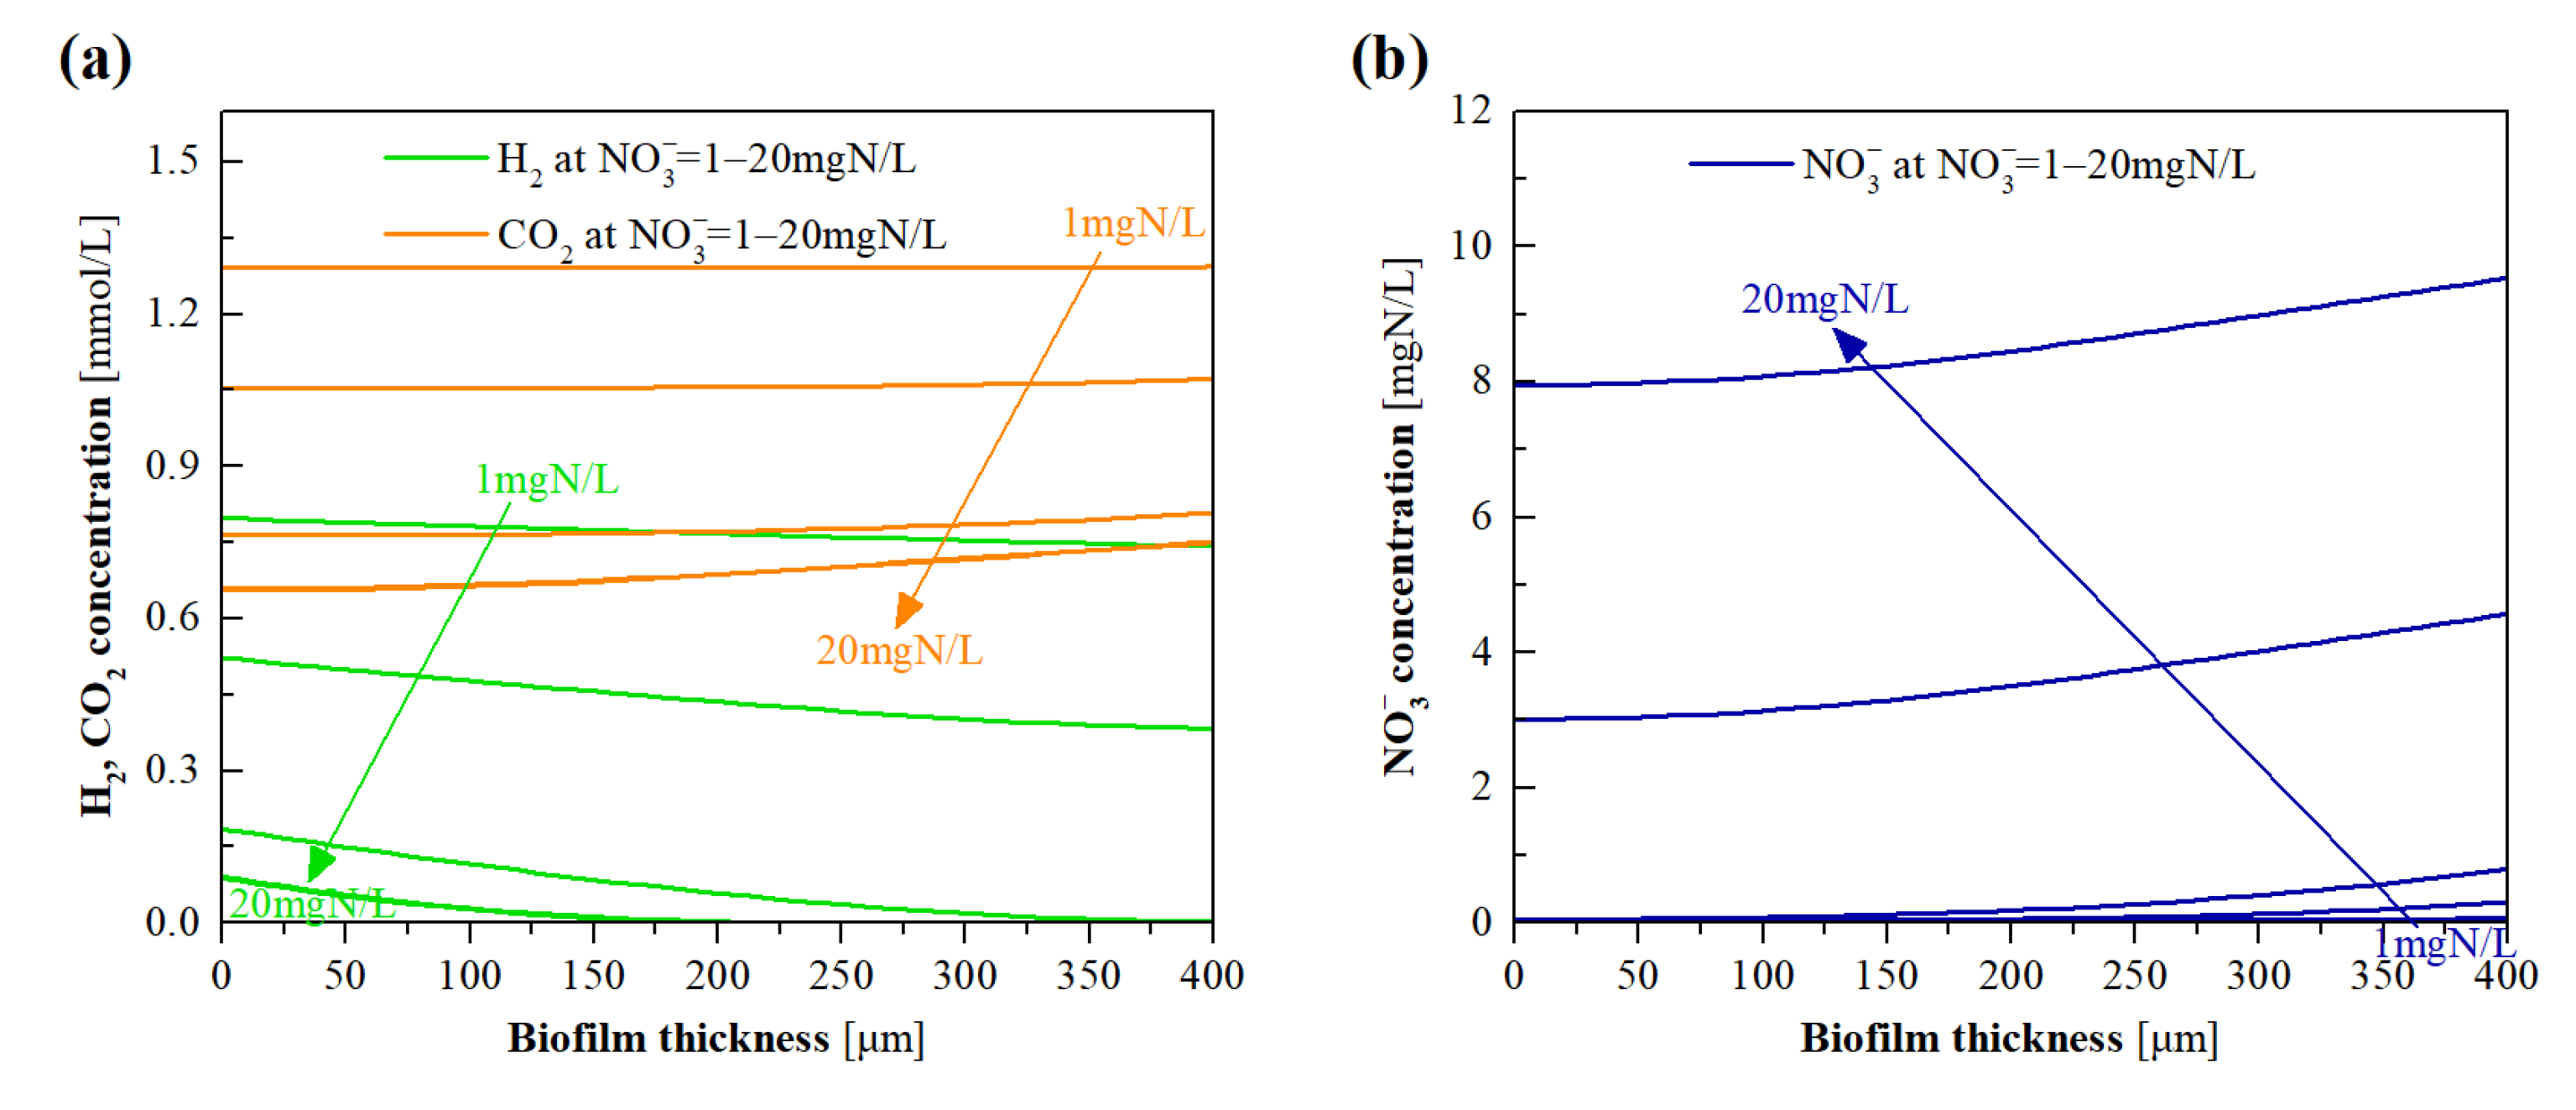
3.5. Model Evaluation of the Effects of NO3 Loading

The experimental results, as shown in Figure 6c, corroborate that the NO3 loading significantly impacted the BrO3 removal of the H2-MBfR. To understand the underlying mechanism, we employed the validated model to simulate the substrate profiles and microbial activities in the biofilm at the influent NO3 concentrations of 1–20 mg N/L. As shown in Figure 9a, the H2 and CO2 concentration gradients in the biofilm sharply decreased with increasing influent NO3 concentration, implying that high NO3 loadings might signally enhance the activity of DNB, leading to greater consumption of these two substrates. In particular, H2 off-gassing was found at the influent NO3 concentration lower than 10 mg N/L, owing to the lack of an electron acceptor for H2 consumption. Once the influent NO3 concentration was greater than 10 mg N/L, NO3 was found to accumulate in the biofilm with high concentrations (Figure 9b), presumably due to the limitation of overall DNB population, while over 90% of the inputted BrO3 could not be consumed by BRB in the biofilm (Figure 9c), suggesting the severe inhibition of BRB activity by high NO3 loadings. As exhibited in Figure 9d, when the influent NO3 concentration was increased from 1 to 20 mg N/L, the BRB factions across the biofilm decreased from beyond 20% to approximately 1%, which was accompanied by the surge of the DNB fraction across the biofilm, suggesting the competitive advantage of DNB over BRB in the case of the high NO3 loadings.
Figure 9e,f show the simulated DNB and BRB metabolic activities in the biofilm of the system operated under various influent NO3 concentrations. As the influent NO3 concentration was less than 10 mg N/L, the high DNB and BRB activities appeared at the outer layer of the biofilm, and a closer distance from the HFM side led to lower activities of DNB and BRB. This trend coincides with that of NO3 and BrO3 concentration gradients in the biofilm, as shown in Figure 9b,c. When the influent NO3 concentration was higher than 10 mg N/L, the DNB activities sharply dropped at the biofilm thickness of beyond 210 μm. This is because the H2 concentrations in the locations beyond this thickness were lower than the half-maximum-rate concentration of DNB (0.002 mg/L). In addition, the BRB activities were strongly inhibited at the higher influent NO3 concentration (especially 20 mg N/L), indicating that BRB was overwhelmed by DNB for electron donor competition, when NO3 concentration in the influent was much higher than that of BrO3. This is consistent with the previous findings that an excessive influent NO3 concentration could inhibit BrO3 reduction [6,30].

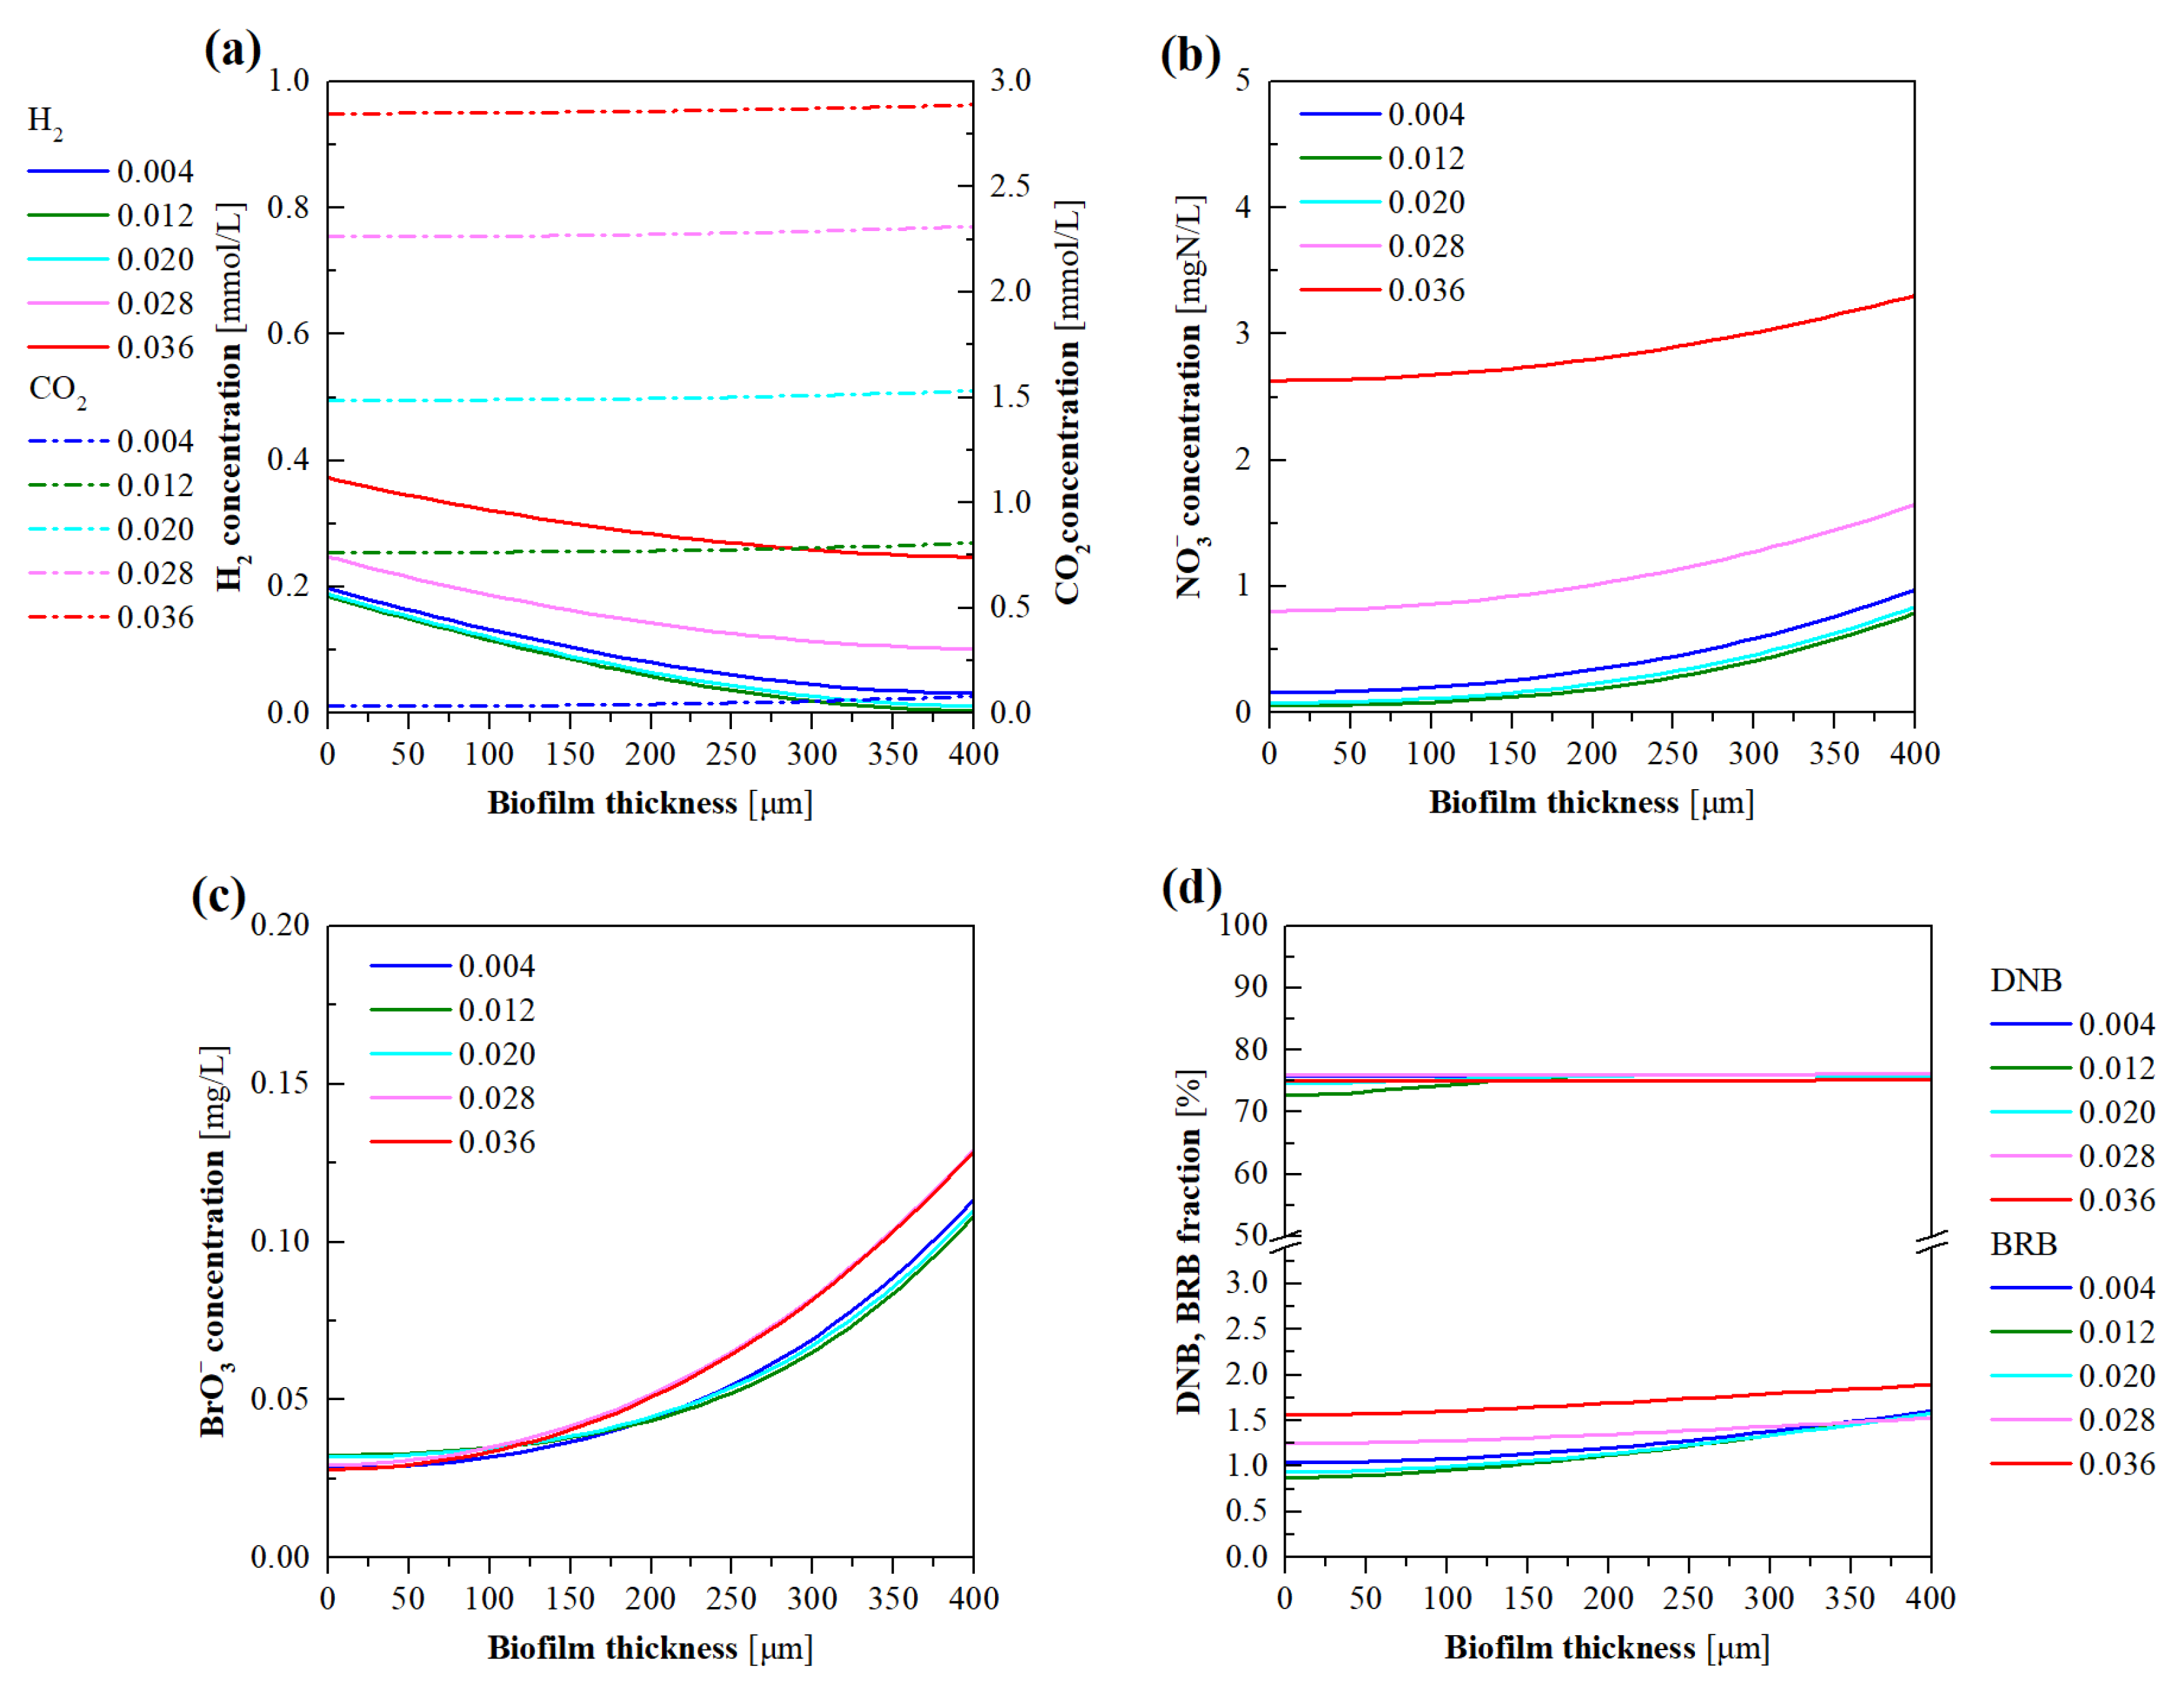
3.6. Model Evaluation of the Effects of CO2 Pressure

CO2 has dual functions, i.e., as a carbon source to support microorganism growth and for pH control to regulate the microbial activities in H2-MBfRs [19,31]. Simulations were, therefore, conducted to investigate the effects of CO2 addition on the evolution of stratification characteristics of the biofilm at the supply pressure of 0.004–0.036 MPa. As shown in Figure 10a–c, the increase in CO2 pressure from 0.004 to 0.02 MPa led to insignificant changes in the H2, NO3, and BrO3 concentration gradients of the biofilm. Once the CO2 pressure was higher than 0.02 MPa, the accumulation of H2 and NO3 was increased in the biofilm. The BrO3 concentrations in the biofilm were slightly increased at the CO2 pressure of 0.036 MPa. This implies that DNB was more sensitive to the acidic conditions (pH 6.0–6.2 at CO2 pressure 0.028–0.036 MPa) than BRB.
As depicted in Figure 10d, as the CO2 pressure was increased from 0.004 to 0.036 MPa, no apparent difference was found in the DNB fractions, while a slight increase in the BRB fractions was observed. It can be seen from Figure 10e,f that, when the CO2 pressure was less than 0.02 MPa, the DNB and BRB activities in the biofilm all gradually augmented with the increase in distance from the HFM side. This can be attributed to the relatively higher NO3 and BrO3 concentrations in the biofilm exterior. It is interesting to note that, compared to the activities of DNB and BRB at the CO2 pressure below 0.02 MPa, a CO2 pressure beyond this value gave rise to decreased and increased microbial activities in the exterior and interior of the biofilm, respectively. This can be explained by the fact that DNB and BRB in the biofilm exterior were in the vicinity of the bulk liquid, and the acidification of bulk liquid severely inhibited their metabolic activities; subsequently, the declined activities of microorganisms in the biofilm exterior led to more diffusion of NO3 and BrO3 toward the HFM side (Figure 10b,c), which consequently led to increased activities of DNB and BRB in the biofilm interior. When the CO2 pressure was increased from 0.012 to 0.036 MPa, DNB activity in the majority of the biofilm significantly declined, while the decreased BRB activity in the biofilm exterior was accompanied by an increase in BRB activity in the biofilm interior (Figure 10e,f). This also indicates that BRB was more tolerant of the acidic aquatic environment than DNB.

4. Conclusions

An expanded multispecies model was developed to provide key information regarding the microbial BrO3 and NO3 reduction processes in the H2-MBfR in diverse operating conditions. The selected model parameters, Km, µBRB, µDNB, and KBrO3, were calibrated to the best-fit values of 0.189 m/day, 0.85 day−1, 0.57 day−1, and 0.014 mg/L, respectively. The good agreement between experimental measurements and modeled results indicates the accuracy and reliability of the calibrated model. The evolution of the substrate gradients, as well as microbial fraction and activity, was driven by the changing system operating parameters involving H2 pressure, BrO3 and NO3 loading, and CO2 pressure. Increasing H2 pressure led to more efficient BrO3 and NO3 reduction in the biofilm, but an exorbitant pressure (beyond 0.04 MPa) gave rise to off-gassing of H2. The augment in BrO3 loading had no significant influence on NO3 reduction, while an influent NO3 concentration higher than 10 mg N/L resulted in the apparent inhibition of BrO3 reduction. A CO2 pressure over 0.02 MPa had a distinct negative influence on NO3 reduction, but minorly impacted BrO3 reduction. The simulation results of the developed model offer important mechanistic insights into the BrO3 and NO3 reduction processes of H2-MBfR.

Supplementary Materials

The following supporting information can be downloaded at https://www.mdpi.com/article/10.3390/membranes12080774/s1: Table S1. Short-term operational conditions of influencing factor experiment of the H2-MBfR; Table S2. Start-up and long-term operational conditions of the H2-MBfR; Table S3. Stoichiometric and kinetic parameters of BRB related metabolic process for the developed model; Table S4. Experiments operational parameters for the model development; Table S5. Other pertinent input parameters for model development; Section S1. Calculation of the stoichiometric coefficients for BRB metabolic process. Refs. [32,33] are cited on Supplementary Materials.

Author Contributions

Conceptualization, J.Z. (Junjian Zheng), M.J., and H.L.; methodology, M.J. and J.Z. (Junjian Zheng); software, M.J.; validation, Y.Z., J.Z. (Jie Zhang), X.Z., and Z.W.; formal analysis, Y.Z. and X.D.; investigation, Y.Z., and X.D.; resources, J.Z. (Junjian Zheng), H.L., X.Z., and Z.W.; data curation, M.J. and Y.Z.; writing—original draft preparation, M.J.; writing—review and editing, J.Z. (Junjian Zheng); visualization, J.Z. (Junjian Zheng) and J.Z. (Jie Zhang); supervision, X.Z. and Z.W.; project administration, J.Z. (Junjian Zheng); funding acquisition, J.Z. (Junjian Zheng), M.J., Y.Z., and H.L. All authors have read and agreed to the published version of the manuscript.

Funding

This research was funded by the Guangxi Natural Science Foundation (grant number 2022GXNSFFA035033), the National Natural Science Foundation of China (grant numbers 52000046, 52100034, and 51878197), the Special Project of Guangxi Science and Technology Base and Talent (grant numbers GuiKe AD20297009 and GuiKe AD20297007), and the Middle-aged and Young Teachers’ Basic Ability Promotion Project of Guangxi (grant numbers 2022KY0179, 2021KY0221, and 2020KY05039).

Institutional Review Board Statement

Not applicable.

Data Availability Statement

Not applicable.

Conflicts of Interest

The authors declare no conflict of interest.

References

  1. Martin, K.J.; Downing, L.S.; Nerenberg, R. Evidence of specialized bromate-reducing bacteria in a hollow fiber membrane biofilm reactor. Water Supply 2009, 8, 473–479. [Google Scholar] [CrossRef]
  2. Xiao, Q.; Yu, S. Reduction of bromate from drinking water by sulfite/ferric ion systems: Efficacy and mechanisms. J. Hazard. Mater. 2021, 418, 125940. [Google Scholar] [CrossRef] [PubMed]
  3. Yang, J.; Dong, Z.; Jiang, C.; Wang, C.; Liu, H. An overview of bromate formation in chemical oxidation processes: Occurrence, mechanism, influencing factors, risk assessment, and control strategies. Chemosphere 2019, 237, 124521. [Google Scholar] [CrossRef] [PubMed]
  4. Butler, R.; Ehrenberg, S.; Godley, A.R.; Lake, R.; Lytton, L.; Cartmell, E. Remediation of bromate-contaminated groundwater in an ex situ fixed-film bioreactor. Sci. Total Environ. 2006, 366, 12–20. [Google Scholar] [CrossRef]
  5. Jahan, B.N.; Li, L.; Pagilla, K.R. Fate and reduction of bromate formed in advanced water treatment ozonation systems: A critical review. Chemosphere 2021, 266, 128964. [Google Scholar] [CrossRef]
  6. Zhong, Y.; Yang, Q.; Fu, G.; Xu, Y.; Cheng, Y.; Chen, C.; Xiang, R.; Wen, T.; Li, X.; Zeng, G. Denitrifying microbial community with the ability to bromate reduction in a rotating biofilm-electrode reactor. J. Hazard. Mater. 2018, 342, 150–157. [Google Scholar] [CrossRef]
  7. Zhou, W.; Yang, Y.; Gai, W.-Z.; Deng, Z.-Y. A comparative study on high-efficient reduction of bromate in neutral solution using zero-valent Al treated by different procedures. Sci. Total Environ. 2021, 795, 148786. [Google Scholar] [CrossRef]
  8. Xia, S.; Liang, J.; Xu, X.; Shen, S. Simultaneous removal of selected oxidized contaminants in groundwater using a continuously stirred hydrogen-based membrane biofilm reactor. J. Environ. Eng. 2013, 25, 96–104. [Google Scholar] [CrossRef]
  9. Chen, X.; Liu, Y.; Peng, L.; Ni, B.-J. Perchlorate, nitrate, and sulfate reduction in hydrogen-based membrane biofilm reactor: Model-based evaluation. Chem. Eng. J. 2017, 316, 82–90. [Google Scholar] [CrossRef]
  10. Jiang, M.; Zhang, Y.; Yuan, Y.; Chen, Y.; Lin, H.; Zheng, J.; Li, H.; Zhang, X. Nitrate removal and dynamics of microbial community of a hydrogen-based membrane biofilm reactor at diverse nitrate loadings and distances from hydrogen supply end. Water 2020, 12, 3196. [Google Scholar] [CrossRef]
  11. Lai, C.-Y.; Lv, P.-L.; Dong, Q.-Y.; Yeo, S.L.; Rittmann, B.E.; Zhao, H.-P. Bromate and nitrate bioreduction coupled with poly-beta-hydroxybutyrate production in a methane-based membrane biofilm reactor. Environ. Sci. Technol. 2018, 52, 7024–7031. [Google Scholar] [CrossRef] [PubMed]
  12. Martin, K.J.; Picioreanu, C.; Nerenberg, R. Assessing microbial competition in a hydrogen-based membrane biofilm reactor (MBfR) using multidimensional modeling. Biotechnol. Bioeng. 2015, 112, 1843–1853. [Google Scholar] [CrossRef] [PubMed]
  13. Jiang, M.; Zheng, J.; Perez-Calleja, P.; Picioreanu, C.; Lin, H.; Zhang, X.; Zhang, Y.; Li, H.; Nerenberg, R. New insight into CO2-mediated denitrification process in H2-based membrane biofilm reactor: An experimental and modeling study. Water Res. 2020, 184, 116177. [Google Scholar] [CrossRef] [PubMed]
  14. Tang, Y.; Zhao, H.; Marcus, A.K.; Krajmalnik-Brown, R.; Rittmann, B.E. A steady-state biofilm model for simultaneous reduction of nitrate and perchlorate, part 1: Model development and numerical solution. Environ. Sci. Technol. 2012, 46, 1598–1607. [Google Scholar] [CrossRef]
  15. Downing, L.S.; Nerenberg, R. Kinetics of microbial bromate reduction in a hydrogen-oxidizing, denitrifying biofilm reactor. Biotechnol. Bioeng. 2007, 98, 543–550. [Google Scholar] [CrossRef]
  16. Tang, Y.; Zhao, H.; Marcus, A.K.; Krajmalnik-Brown, R.; Rittmann, B.E. A steady-state biofilm model for simultaneous reduction of nitrate and perchlorate, part 2: Parameter optimization and results and discussion. Environ. Sci. Technol. 2012, 46, 1608–1615. [Google Scholar] [CrossRef]
  17. Li, H.; Zhou, L.; Lin, H.; Zhang, W.; Xia, S. Nitrate Effects on Perchlorate Reduction in a H2/CO2-based Biofilm. Sci. Total Environ. 2019, 694, 133564. [Google Scholar] [CrossRef]
  18. Lee, K.-C.; Rittmann, B.E. Applying a novel autohydrogenotrophic hollow-fiber membrane biofilm reactor for denitrification of drinking water. Water Res. 2002, 36, 2040–2052. [Google Scholar] [CrossRef]
  19. Tang, Y.; Zhou, C.; Ziv-El, M.; Rittmann, B.E. A pH-control model for heterotrophic and hydrogen-based autotrophic denitrification. Water Res. 2011, 45, 232–240. [Google Scholar] [CrossRef]
  20. Wu, J.; Yin, Y.; Wang, J. Hydrogen-based membrane biofilm reactors for nitrate removal from water and wastewater. Int. J. Hydrogen Energ. 2018, 43, 1–15. [Google Scholar] [CrossRef]
  21. Estuardo, C.; Martí, M.C.; Huiliñir, C.; Aspé Lillo, E.; Roeckel von Bennewitz, M. Improvement of nitrate and nitrite reduction rates prediction. Electron. J. Biotechn. 2008, 11, 73–82. [Google Scholar] [CrossRef]
  22. Vavilin, V.A.; Vasiliev, V.B.; Rytov, S.V.; Ponomarev, A.V. Self-oscillating coexistence of methanogens and sulfate-reducers under hydrogen sulfide inhibition and the pH-regulating effect. Bioresour. Technol. 1994, 49, 105–119. [Google Scholar] [CrossRef]
  23. Angelidaki, I.; Ellegaard, L.; Ahring, B.K. A mathematical model for dynamic simulation of anaerobic digestion of complex substrates: Focusing on ammonia inhibition. Biotechnol. Bioeng. 1993, 42, 159–166. [Google Scholar] [CrossRef] [PubMed]
  24. Jiang, M.; Zhang, Y.; Zheng, J.; Li, H.; Ma, J.; Zhang, X.; Wei, Q.; Wang, X.; Zhang, X.; Wang, Z. Mechanistic insights into CO2 pressure regulating microbial competition in a hydrogen-based membrane biofilm reactor for denitrification. Chemosphere 2022, 303, 134875. [Google Scholar] [CrossRef] [PubMed]
  25. Tang, Y.; Ontiveros-Valencia, A.; Feng, L.; Zhou, C.; Krajmalnik-Brown, R.; Rittmann, B.E. A biofilm model to understand the onset of sulfate reduction in denitrifying membrane biofilm reactors. Biotechnol. Bioeng. 2013, 110, 763–772. [Google Scholar] [CrossRef]
  26. Lv, X.; Wang, D.; Iqbal, W.; Yang, B.; Mao, Y. Microbial reduction of bromate: Current status and prospects. Biodegradation 2019, 30, 365–374. [Google Scholar] [CrossRef]
  27. Pang, S.; Rittmann, B.E.; Wu, C.; Yang, L.; Zhou, J.; Xia, S. Synergistic inorganic carbon and denitrification genes contributed to nitrite accumulation in a hydrogen-based membrane biofilm reactor. Bioengineering 2022, 9, 222. [Google Scholar] [CrossRef]
  28. Ghafari, S.; Hasan, M.; Aroua, M.K. Effect of carbon dioxide and bicarbonate as inorganic carbon sources on growth and adaptation of autohydrogenotrophic denitrifying bacteria. J. Hazard. Mater. 2009, 162, 1507–1513. [Google Scholar] [CrossRef]
  29. Nerenberg, R. The membrane-biofilm Reactor (MBfR) as a counter-diffusional biofilm process. Curr. Opin. Biotech. 2016, 38, 131–136. [Google Scholar] [CrossRef]
  30. Wang, F.; van Halem, D.; Ding, L.; Bai, Y.; Lekkerkerker-Teunissen, K.; van der Hoek, J.P. Effective removal of bromate in nitrate-reducing anoxic zones during managed aquifer recharge for drinking water treatment: Laboratory scale simulations. Water Res. 2018, 130, 88–97. [Google Scholar] [CrossRef]
  31. Xia, S.; Xu, X.; Zhou, C.; Wang, C.; Zhou, L.; Rittmann, B.E. Direct Delivery of CO2 into a Hydrogen-based Membrane Biofilm Reactor and Model Development. Chem. Eng. J. 2016, 290, 154–160. [Google Scholar] [CrossRef]
  32. Henze, M.; van Loosdrecht, M.C.; Ekama, G.A.; Brdjanovic, D. Biological Wastewater Treatment; IWA Publishing: London, UK, 2008. [Google Scholar]
  33. Lide, D.R. CRC Handbook of Chemistry and Physics; CRC: Boca Raton, FL, USA, 2012. [Google Scholar]
Figure 1. Schematic of the H2-MBfR.
Membranes 12 00774 g001
Figure 2. Schematic of the interactions between model components involved in the biochemical processes of the biofilm.
Membranes 12 00774 g002
Figure 3. Schematic of the research methodology.
Membranes 12 00774 g003
Figure 4. Long-term performance of NO3 and BrO3 reduction in the H2-MBfR. The abbreviations “Inf.”, “Eff.”, and “Meas.” denote influent, effluent, and measured, respectively.
Membranes 12 00774 g004
Figure 5. Sensitivities of the effluent BrO3 (a) and NO3 (b) concentrations to the selected parameters Km, µDNB, µBRB, and KBrO3.
Membranes 12 00774 g005
Figure 6. The system performance of the H2-MBfR, as well as the compassion of the measured and simulated removal fluxes of NO3 and BrO3, in the case of changing H2 pressure (a,b), influent NO3 concentration (c,d), and CO2 pressure (e,f).
Membranes 12 00774 g006
Figure 7. Model-simulated profiles for (a) H2 and CO2, (b) NO3, (c) BrO3 concentrations, and (d) DNB and BRB fractions, as well as (e) DNB and (f) BRB metabolic activities, in the biofilm of H2-MBfR as a function of influent BrO3 concentration ranging from 0.1 to 1.0 mg/L.
Membranes 12 00774 g007aMembranes 12 00774 g007b
Figure 8. Model simulated profiles for (a) H2 and CO2, (b) NO3, (c) BrO3 concentrations, and (d) DNB and BRB fractions, as well as (e) DNB and (f) BRB metabolic activities, in the biofilm of H2-MBfR as a function of H2 pressure ranging from 0.01 to 0.08 MPa.
Membranes 12 00774 g008aMembranes 12 00774 g008b
Figure 9. Model simulated profiles for (a) H2 and CO2, (b) NO3, (c) BrO3 concentrations, and (d) DNB and BRB fractions, as well as (e) DNB and (f) BRB metabolic activities, in the biofilm of H2-MBfR as a function of influent NO3 concentration ranging from 1 to 20 mg N/L.
Membranes 12 00774 g009aMembranes 12 00774 g009b
Figure 10. Model simulated profiles for (a) H2 and CO2, (b) NO3, (c) BrO3 concentrations, and (d) DNB and BRB fractions, as well as (e) DNB and (f) BRB metabolic activities, in the biofilm of H2-MBfR as a function of CO2 pressure ranging from 0.004 to 0.036 MPa.
Membranes 12 00774 g010aMembranes 12 00774 g010b
Table 1. Process matrix for the developed model of components.
Component (i)
Process (j)
SH2SNO3SBrO3SSMPSCO2XDNBXBRBXHBXIOXEPS
DNB growth 14 5 f s , DNB 0 k 1 ( 28 f e , DNB 0 25 f s , DNB 0 + 1 5 ) k2k1k1 k3
BRB growth 14 5 f s , BRB 0 1 5 k 1 k 1 14 f e , DNB 0 15 f s , DNB 0 k2k1 k1 k3
HB growth 1 Y HB 1.25 Y HB 1 Y HB 1
DNB decay −1 1−fd
BRB decay −1 1−fd
HB Decay −11−fd
Hydrolysis 1 −1
H2
(mol/m3)
NO3
(mol/m3)
BrO3
(mol/m3)
SMP
(mol/m3)
CO2
(mol/m3)
DNB
(mol/m3)
BRB
(mol/m3)
HB
(mol/m3)
IO
(mol/m3)
EPS
(mol/m3)
Table 2. Process kinetic rate equations for the developed model.
Process (j)Kinetic Rate Expressions
DNB growth μ DNB S H 2 S H 2 + K H 2 DNB S NO 3 S NO 3 + K NO 3 DNB S CO 2 S CO 2 + K CO 2 DNB X DNB f pH
BRB growth μ BRB S H 2 S H 2 + K H 2 BRB S NO 3 S NO 3 + K NO 3 BRB S BrO 3 S BrO 3 + K BrO 3 BRB S CO 2 S CO 2 + K CO 2 BRB X BRB f pH
HB growth μ HB S NO 3 S NO 3 + K NO 3 HB S SMP S SMP + K SMP HB X HB f pH
DNB decay b DNB X DNB
BRB decay b BRB X BRB
HB Decay b HB X HB
Hydrolysis k hyd X EPS
Publisher’s Note: MDPI stays neutral with regard to jurisdictional claims in published maps and institutional affiliations.

