
Long-Time Evaluation of Solid-State Composite Reference Electrodes

 , and
, and 
Abstract
:1. Introduction
2. Experimental
2.1. Reagents
2.2. Preparation of the SSC Reference Electrodes
2.2.1. SSC Reference Electrodes Prepared by Chemical Polymerization Method
2.2.2. SSC Reference Electrodes Prepared Injection Molding Method
2.3. Characterization Methods
2.3.1. The Stability of SSC Reference Electrodes
2.3.2. Electrochemical Impedance Spectroscopy (EIS)
2.3.3. Multi-Solution Protocol
2.3.4. Calibration Measurements
2.3.5. Sample Measurements
3. Results and Discussions
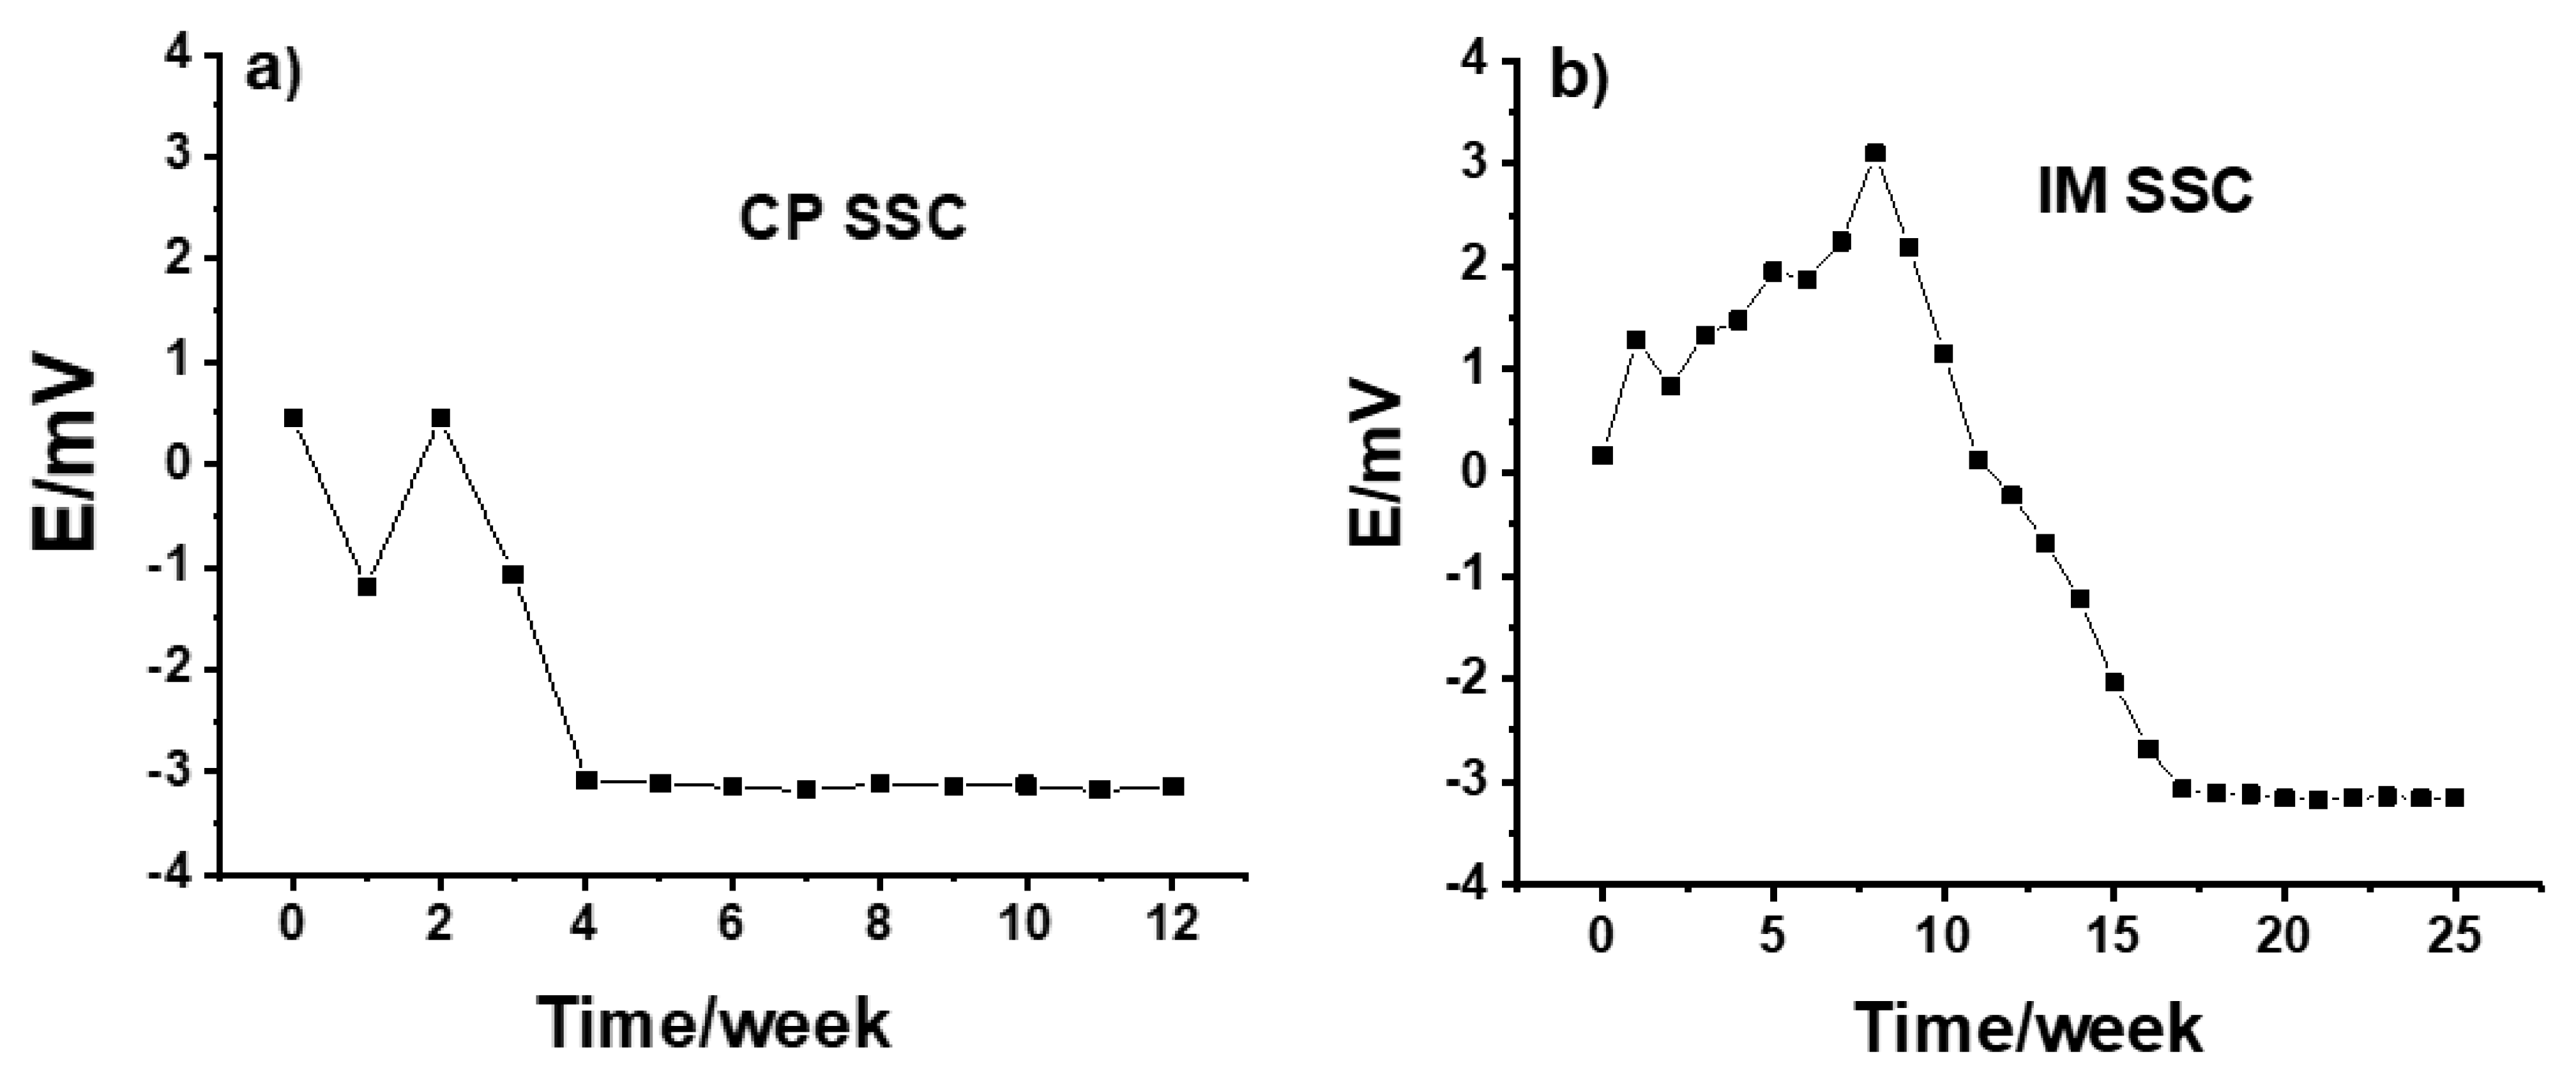
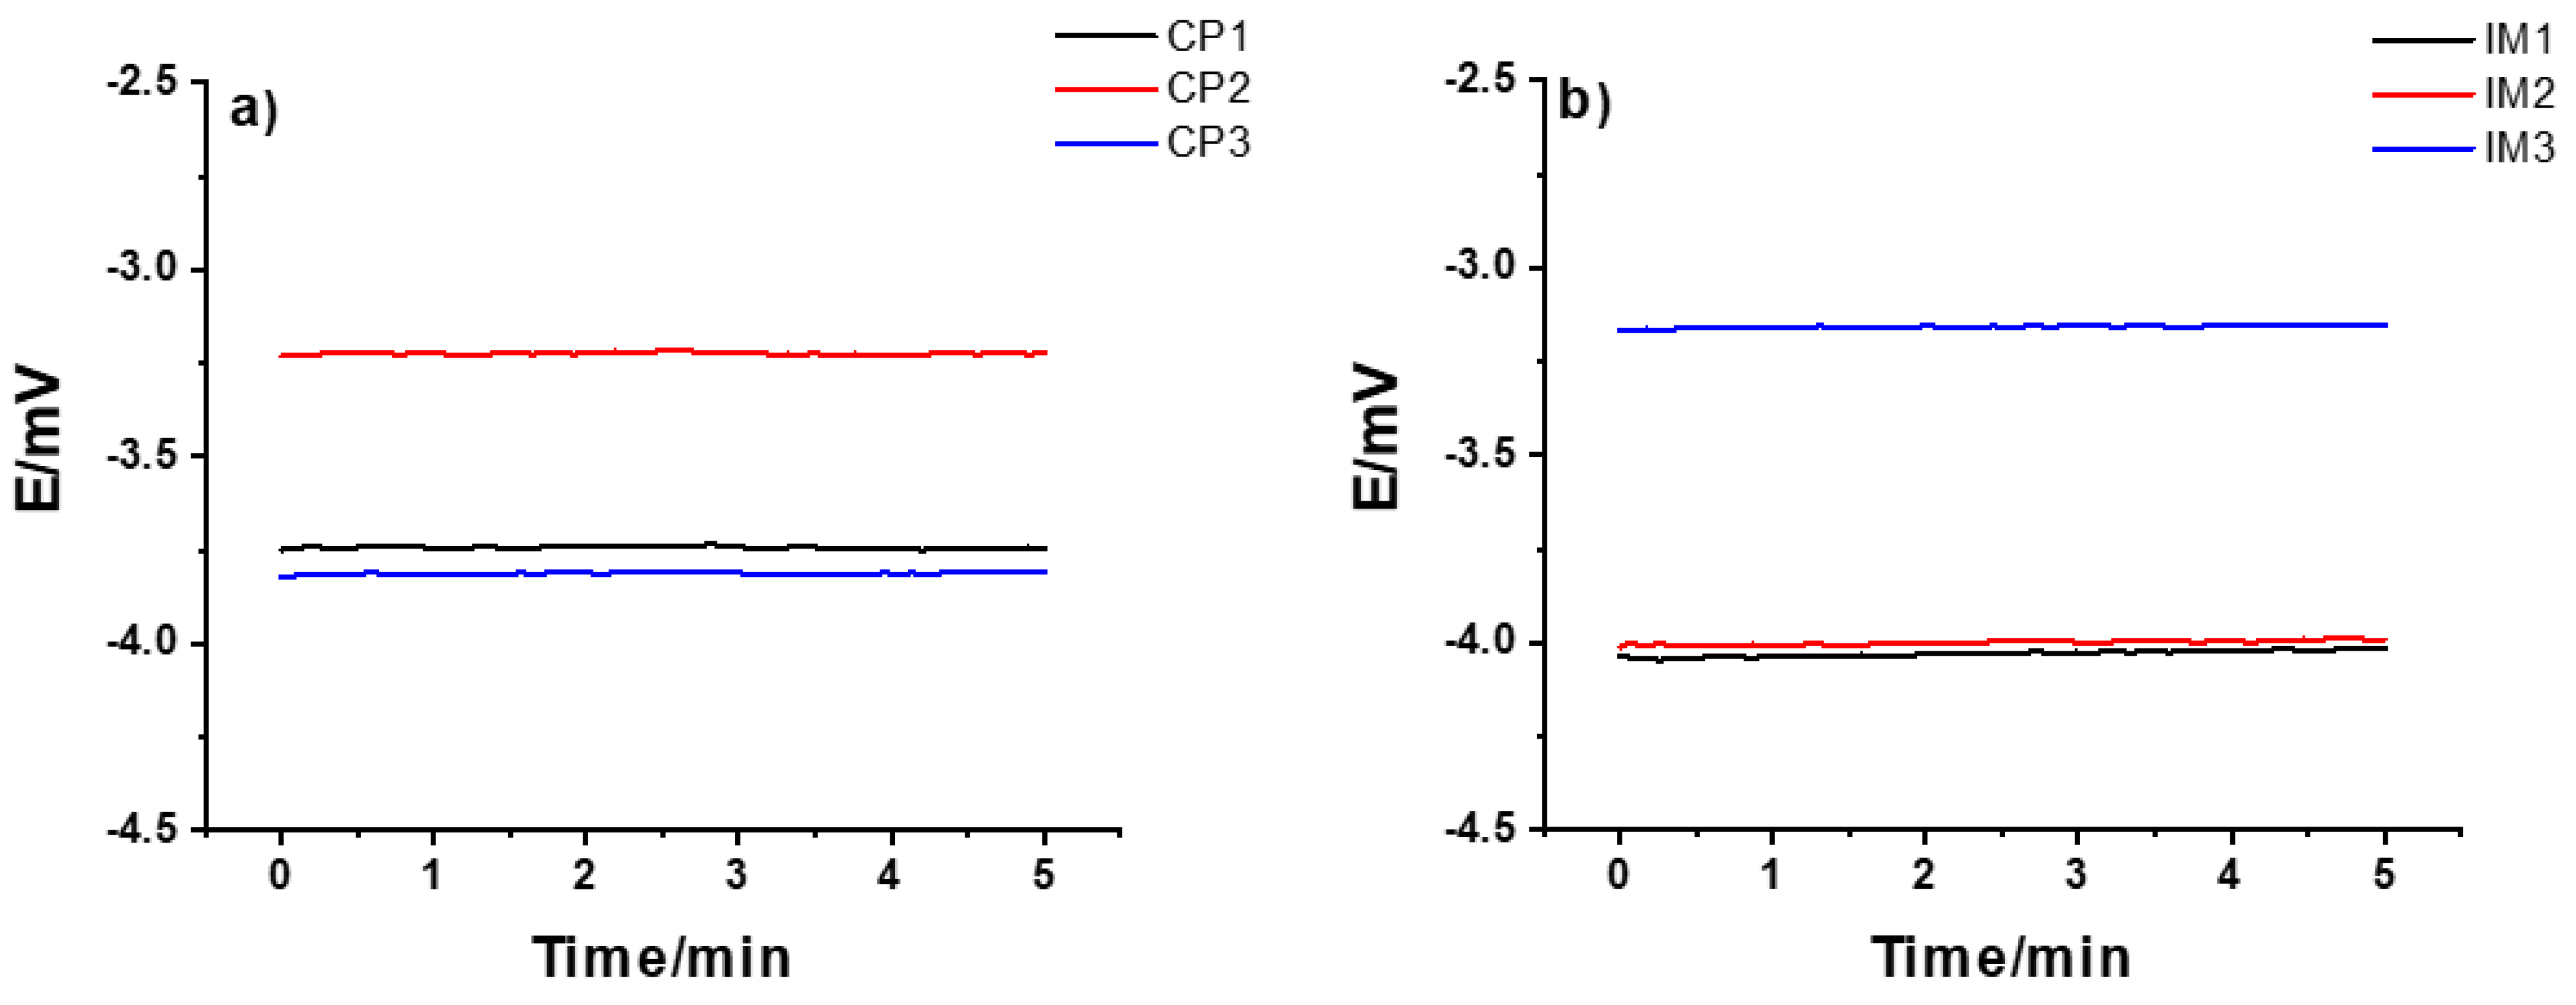
3.1. Potential Stability of the Electrodes
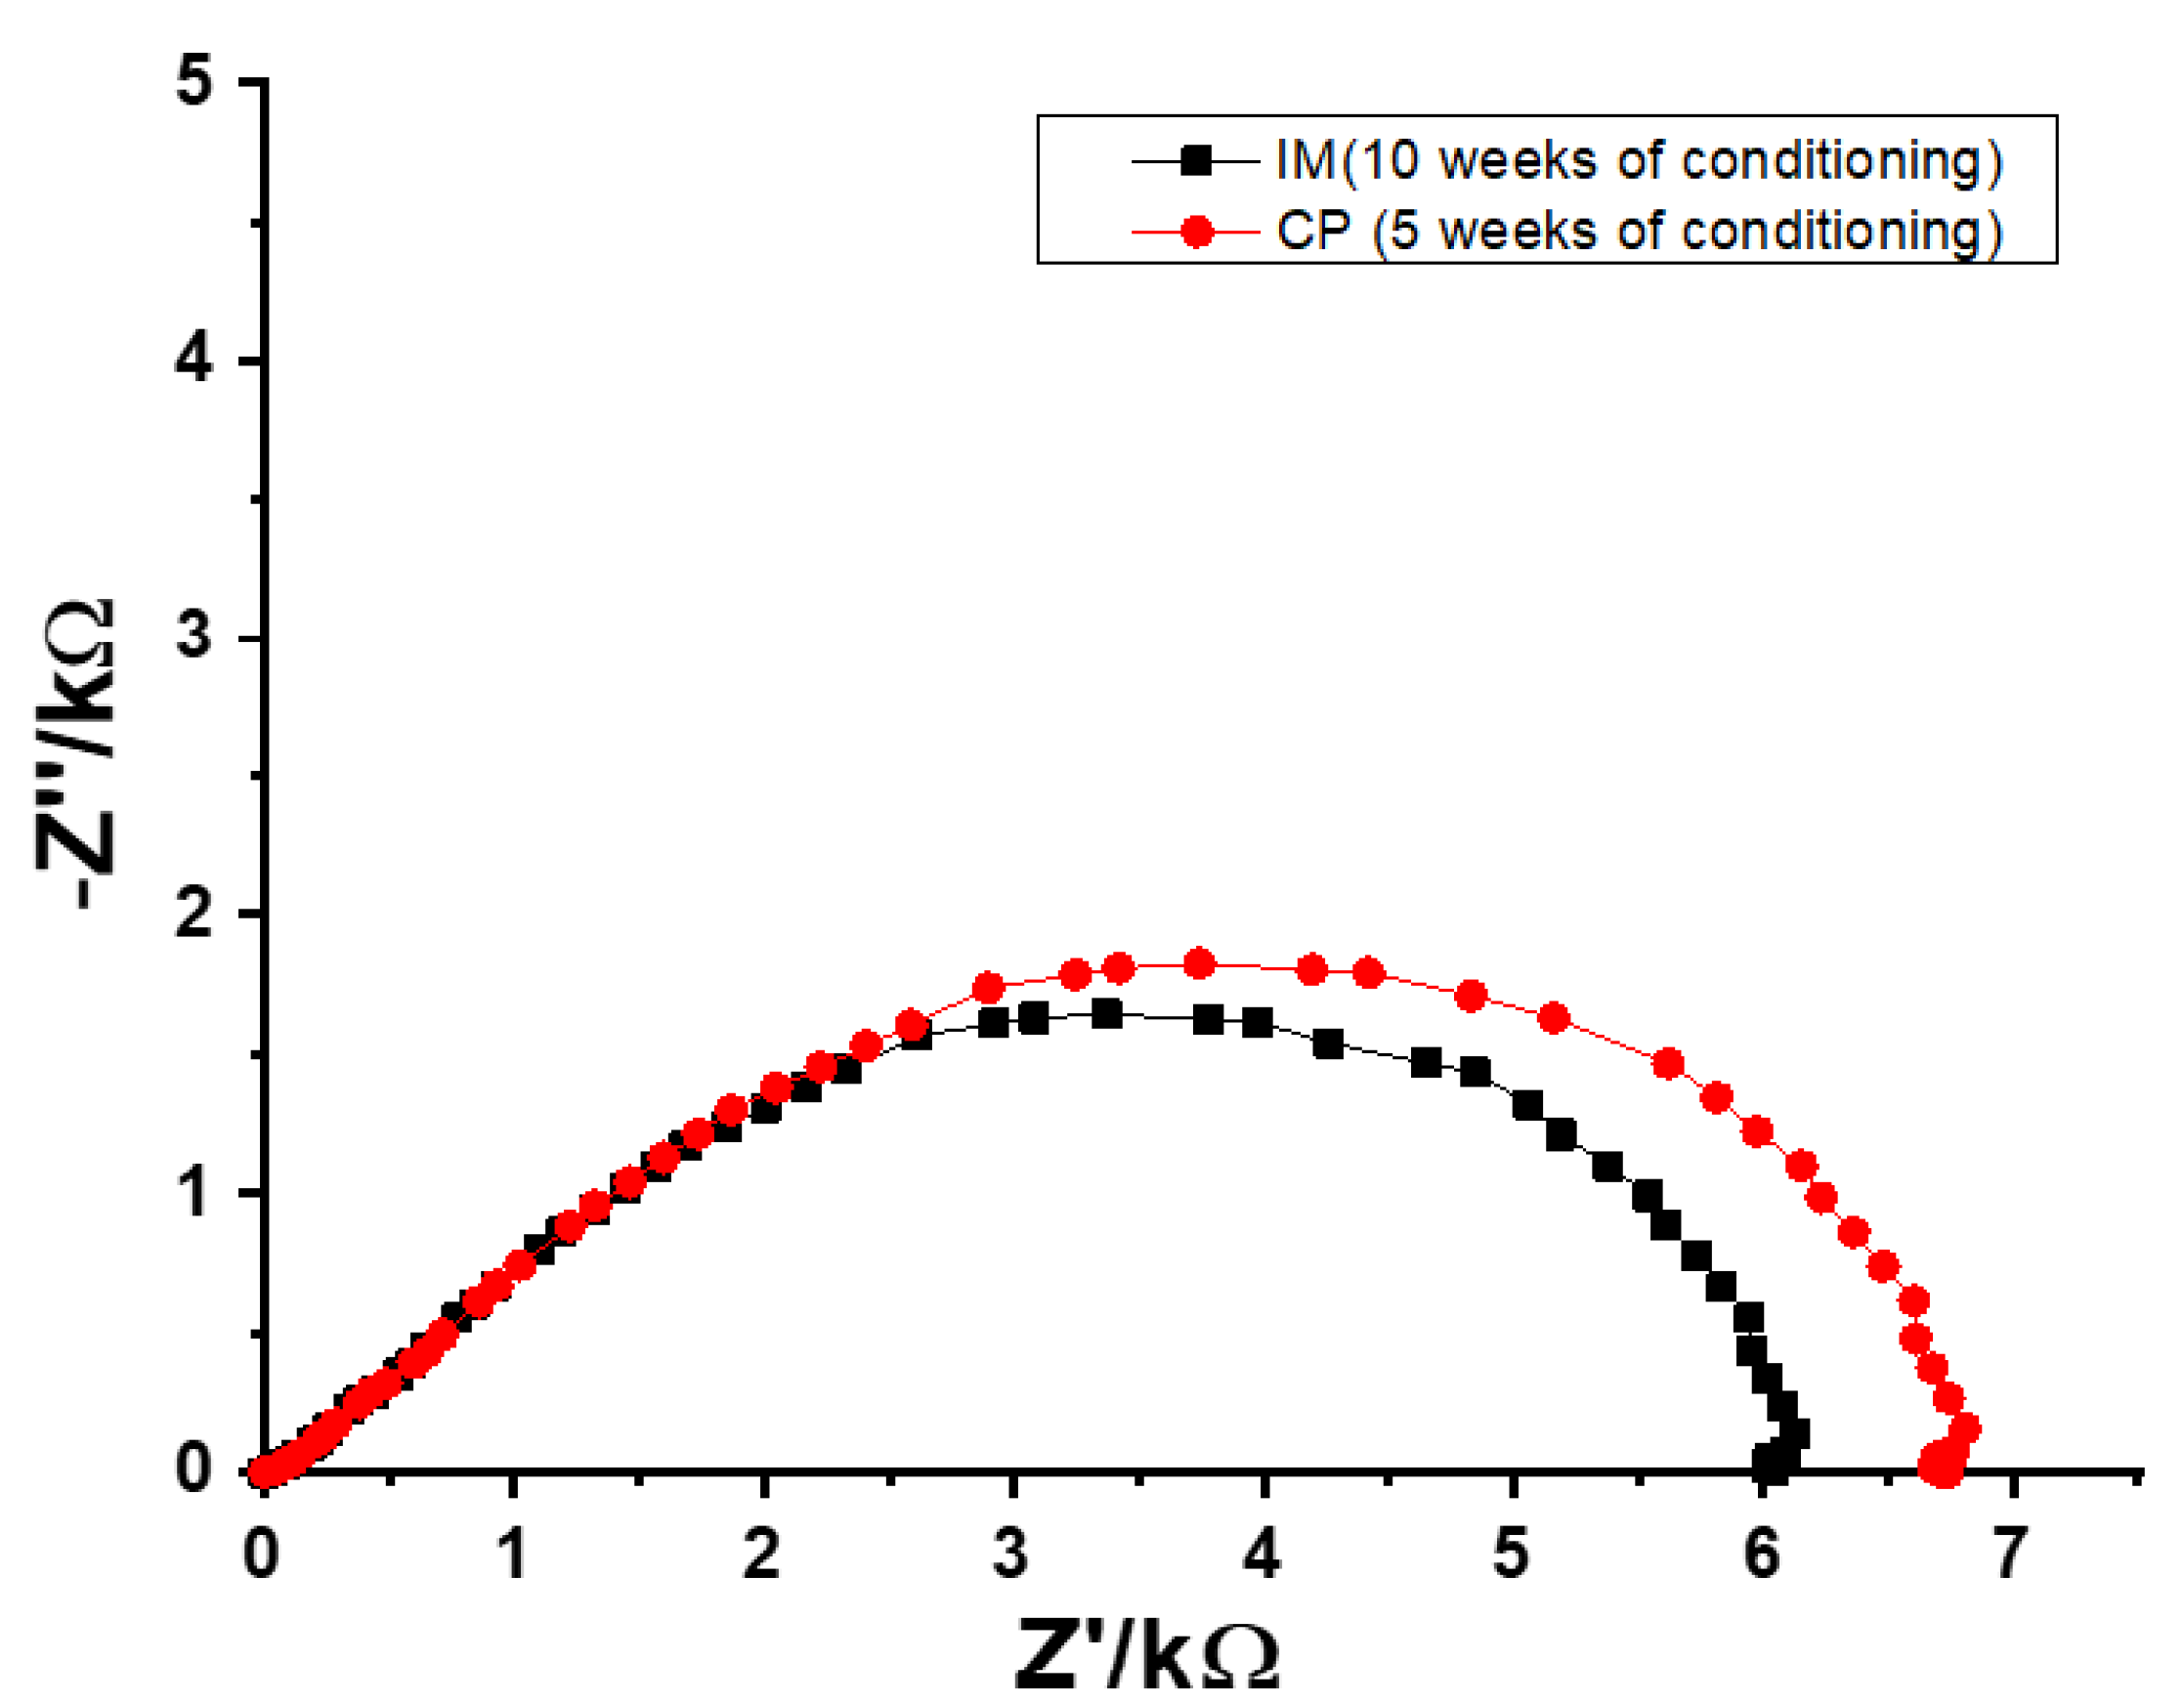
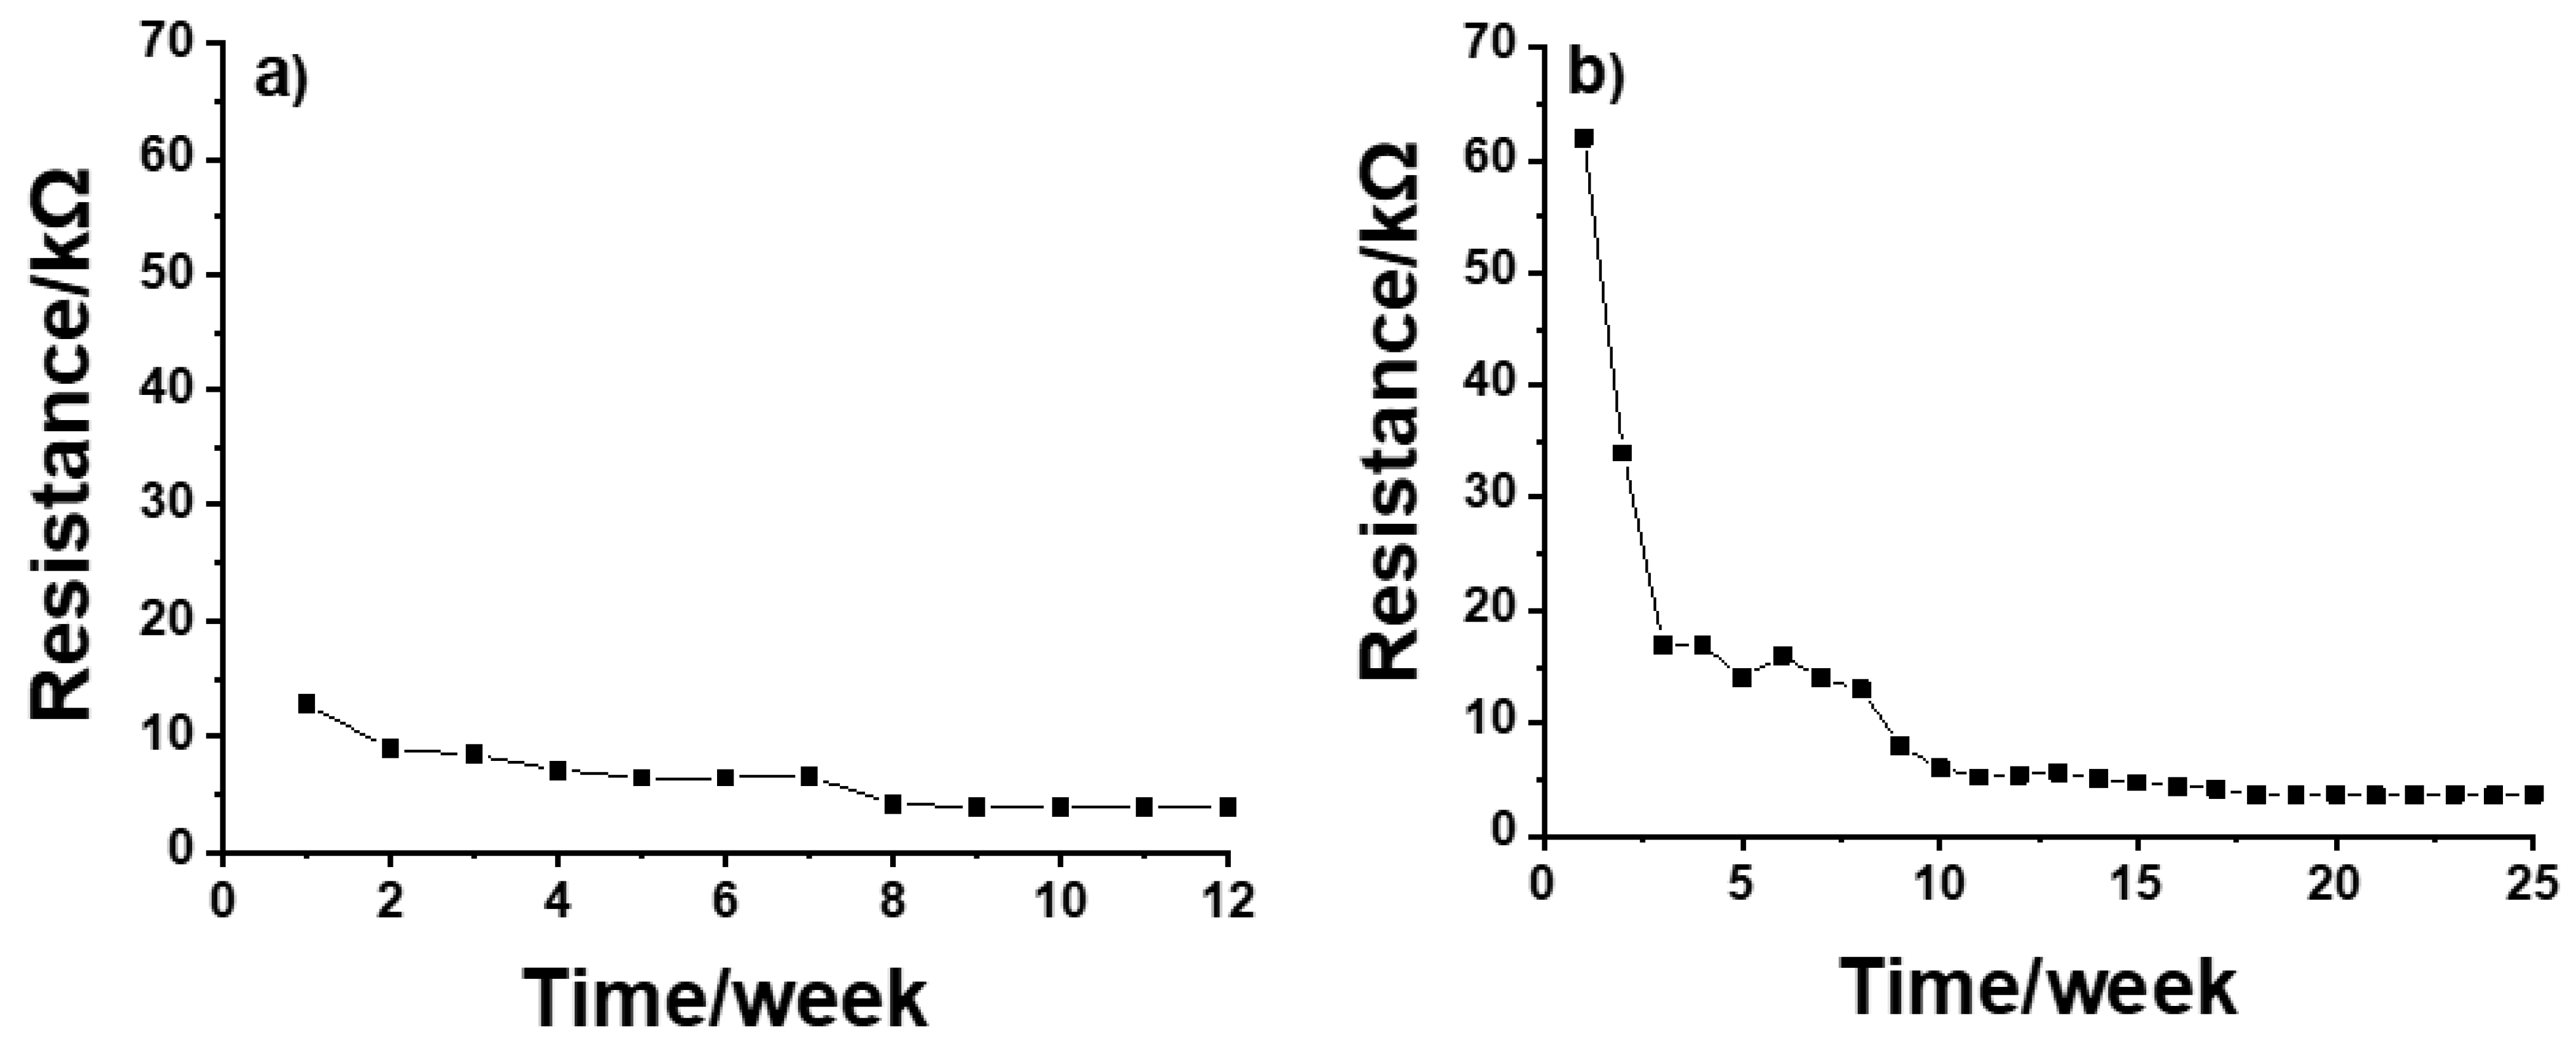
3.2. Electrochemical Impedance Spectroscopy (EIS)
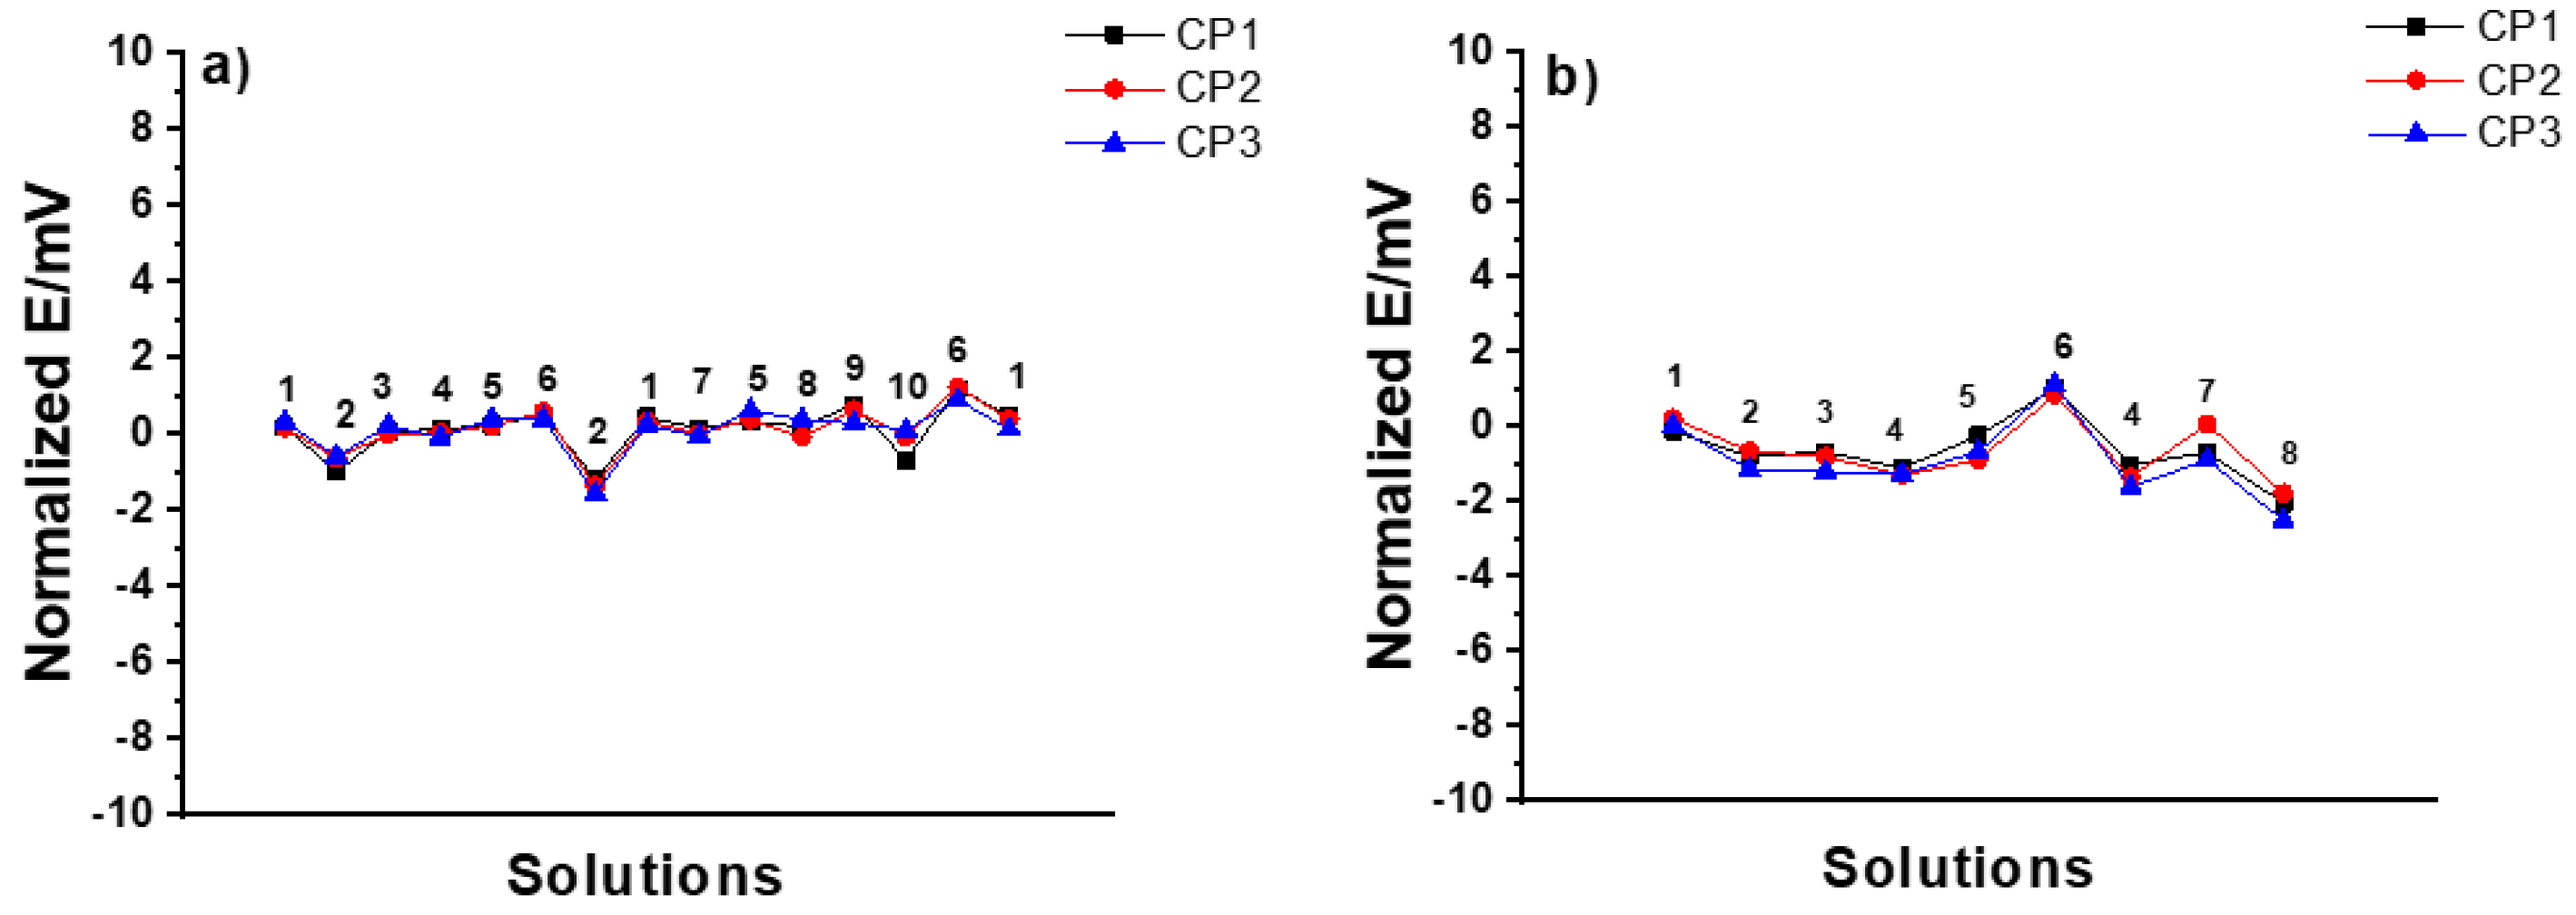
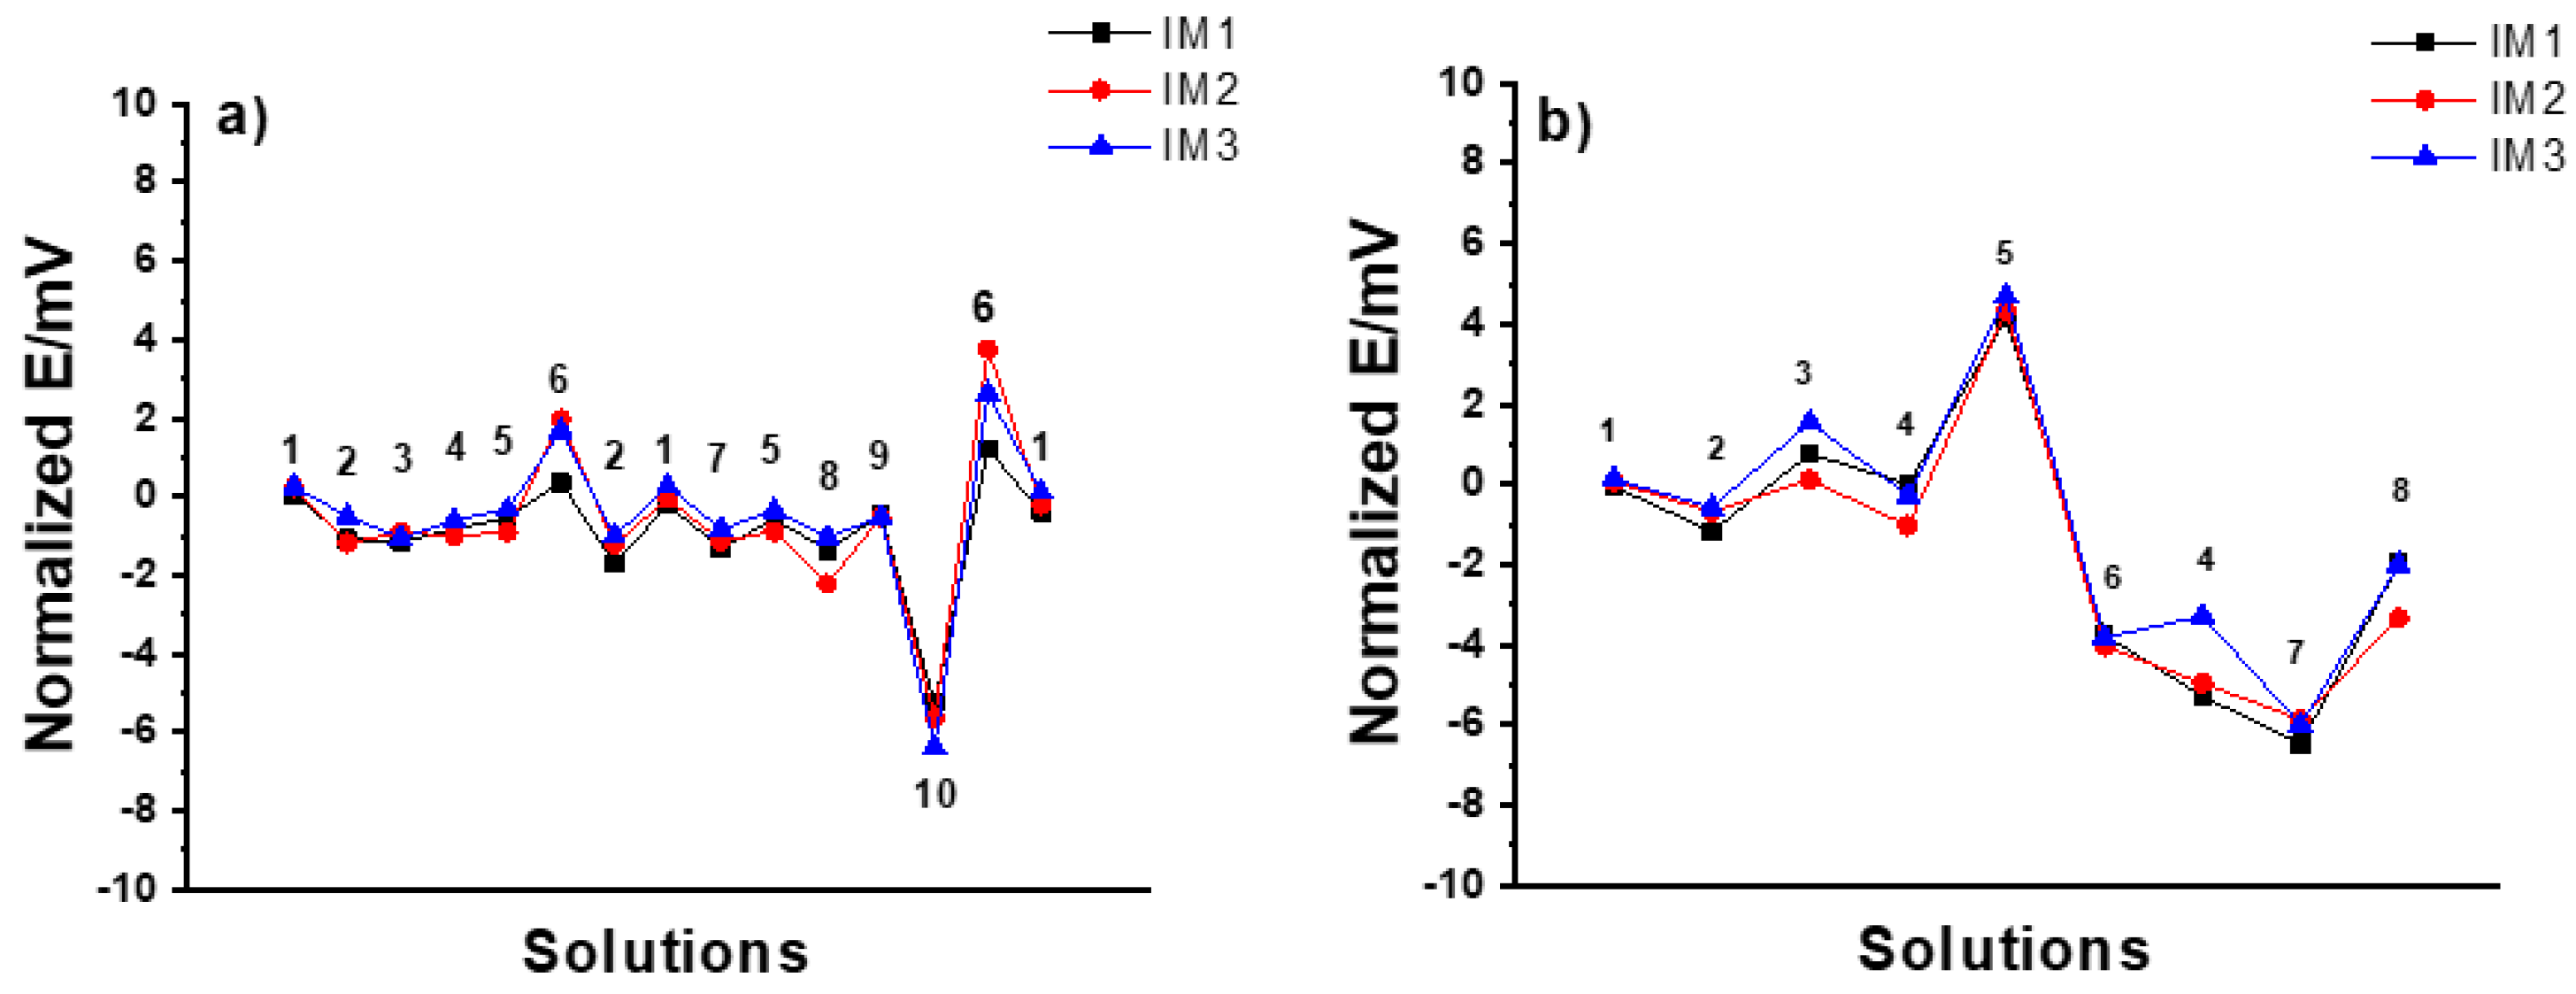
3.3. Multi-Solution Protocol
3.4. Calibration Measurements
3.5. Effect of the Temperature on the Nernstian Slope
3.6. Sample Measurements
4. Conclusions
Author Contributions
Funding
Institutional Review Board Statement
Informed Consent Statement
Data Availability Statement
Conflicts of Interest
References
- Inzelt, G.; Lewenstam, A.; Scholz, F. (Eds.) Handbook of Reference Electrodes; Springer: Berlin/Heidelberg, Germany, 2013. [Google Scholar]
- Ciobanu, M.; Wilburn, J.P.; Buss, N.I.; Ditavong, P.; Lowy, D.A. Miniaturized Reference Electrodes Based on Ag/AgiX Internal Reference Elements. I. Manufacturing and Performance. Electroanalysis 2002, 14, 989–997. [Google Scholar] [CrossRef]
- Ciobanu, M.; Wilburn, J.P.; Lowy, D.A. Miniaturized Reference Electrodes. II. Use in Corrosive, Biological, and Organic Media. Electroanalysis 2004, 16, 1351–1358. [Google Scholar] [CrossRef]
- Guth, U.; Gerlach, F.; Decker, M.; Oelßner, W.; Vonau, W. Solid-state reference electrodes for potentiometric sensors. J. Solid State Electrochem. 2009, 13, 27–39. [Google Scholar] [CrossRef]
- Vonau, W.; Oelßner, W.; Guth, U.; Henze, J. An all-solid-state reference electrode. Sens. Actuators B Chem. 2010, 144, 368–373. [Google Scholar] [CrossRef]
- Bakker, E. Hydrophobic Membranes as Liquid Junction-Free Reference Electrodes. Electroanalysis 1999, 11, 788–792. [Google Scholar] [CrossRef]
- Blaz, T.; Migdalski, J.; Lewenstam, A. Junction-less reference electrode for potentiometric measurements obtained by buffering pH in a conducting polymer matrix. Analyst 2005, 130, 637. [Google Scholar] [CrossRef] [PubMed]
- Cicmil, D.; Anastasova, S.; Kavanagh, A.; Diamond, D.; Mattinen, U.; Bobacka, J.; Lewenstam, A.; Radu, A. Ionic Liquid-Based, Liquid-Junction-Free Reference Electrode. Electroanalysis 2011, 23, 1881–1890. [Google Scholar] [CrossRef]
- Diamond, D.; McEnroe, E.; McCarrick, M.; Lewenstam, A. Evaluation of a new solid-state reference electrode junction material for ion-selective electrodes. Electroanalysis 1994, 6, 962–971. [Google Scholar] [CrossRef]
- Anastasova-Ivanova, S.; Mattinen, U.; Radu, A.; Bobacka, J.; Lewenstam, A.; Migdalski, J.; Danielewski, M.; Diamond, D. Development of miniature all-solid-state potentiometric sensing system. Sens. Actuators B Chem. 2010, 146, 199–205. [Google Scholar] [CrossRef] [Green Version]
- Mattinen, U.; Bobacka, J.; Lewenstam, A. Solid-Contact Reference Electrodes Based on Lipophilic Salts. Electroanalysis 2009, 21, 1955–1960. [Google Scholar] [CrossRef]
- Kisiel, A.; Marcisz, H.; Michalska, A.; Maksymiuk, K. All-solid-state reference electrodes based on conducting polymers. Analyst 2005, 130, 1655. [Google Scholar] [CrossRef] [PubMed]
- Rius-Ruiz, F.X.; Bejarano-Nosas, D.; Blondeau, P.; Riu, J.; Rius, F.X. Disposable Planar Reference Electrode Based on Carbon Nanotubes and Polyacrylate Membrane. Anal. Chem. 2011, 83, 5783–5788. [Google Scholar] [CrossRef] [PubMed]
- Rius-Ruiz, F.X.; Kisiel, A.; Michalska, A.; Maksymiuk, K.; Riu, J.; Rius, F.X. Solid-state reference electrodes based on carbon nanotubes and polyacrylate membranes. Anal. Bioanal. Chem. 2011, 399, 3613–3622. [Google Scholar] [CrossRef] [PubMed] [Green Version]
- Mamińska, R.; Dybko, A.; Wróblewski, W. All-solid-state miniaturised planar reference electrodes based on ionic liquids. Sens. Actuators B Chem. 2006, 115, 552–557. [Google Scholar] [CrossRef]
- Lingenfelter, P.; Bartoszewicz, B.; Migdalski, J.; Sokalski, T.; Bućko, M.M.; Filipek, R.; Lewenstam, A. Reference Electrodes with Polymer-Based Membranes—Comprehensive Performance Characteristics. Membranes 2019, 9, 161. [Google Scholar] [CrossRef] [PubMed] [Green Version]
- Le, H.T.T.; Ngo, D.T.; Kim, Y.-J.; Park, C.-N.; Park, C.-J. A perovskite-structured aluminium-substituted lithium lanthanum titanate as a potential artificial solid-electrolyte interface for aqueous rechargeable lithium-metal-based batteries. Electrochim. Acta 2017, 248, 232–242. [Google Scholar] [CrossRef]
- Lorant, S.; Bohnke, C.; Roffat, M.; Bohnke, O. New concept of an all-solid-state reference electrode using a film of lithium lanthanum titanium oxide (LLTO). Electrochim. Acta 2012, 80, 418–425. [Google Scholar] [CrossRef]
- Mousavi, Z.; Granholm, K.; Sokalski, T.; Lewenstam, A. An analytical quality solid-state composite reference electrode. Analyst 2013, 138, 5216. [Google Scholar] [CrossRef] [PubMed]
- Mousavi, Z.; Granholm, K.; Sokalski, T.; Lewenstam, A. All-solid-state electrochemical platform for potentiometric measurements. Sens. Actuators B Chem. 2015, 207, 895–899. [Google Scholar] [CrossRef]
- Granholm, K.; Mousavi, Z.; Sokalski, T.; Lewenstam, A. Analytical quality solid-state composite reference electrode manufactured by injection moulding. J. Solid State Electrochem. 2014, 18, 607–612. [Google Scholar] [CrossRef]
- Sokalski, T.; Lewenstam, A.; Mousavi, Z.; Granholm, K. Reference Electrode and an Arrangement for an Electrochemical Measurement. U.S. Patent US10094798B2, 9 October 2018. [Google Scholar]


| ISE | S ± SD (mV/Decade) | E0 ± SD (mV) | Coefficient of Determination (R2) | |||
|---|---|---|---|---|---|---|
| CP SSC | IM SSC | CP SSC | IM SSC | CP SSC | IM SSC | |
| Potassium | 58.0 ± 0.3 | 58.0 ± 0.2 | 107.6 ± 3.8 | 108.7 ± 1.6 | (0.9986–0.9993) | (0.9989–0.9994) |
| Sodium | 58.1 ± 0.3 | 58.1 ± 0.2 | 147.8 ± 0.5 | 149.6 ± 0.4 | (0.9991–0.9995) | (0.9988–0.9996) |
| Calcium | 28.2 ± 0.1 | 28.1 ± 0.1 | 101.0 ± 5.3 | 103.8 ± 0.1 | (0.9990–0.9993) | (0.9989–0.9995) |
| Chloride | −56.5 ± 0.2 | −56.4 ± 0.3 | 21.8 ± 1.4 | 27.6 ± 1.1 | (0.9988–0.9993) | (0.9991–0.9994) |
| pH | 57.3 ± 0.1 | 56.8 ± 0.1 | 640.4 ± 1.5 | 639.3 ± 0.1 | (0.9998–0.9999) | (0.9997–0.9999) |
| Temperature Change | From 5 °C to 22 °C | From 14 °C to 22 °C | From 18 °C to 22 °C |
|---|---|---|---|
| Theoretical Nernstian ratio | 1.06 (55.19, 58.57) | 1.03 (56.98, 58.57) | 1.01 (57.77, 58.57) |
| Experimental Nernstian ratio IM1 | 1.05 (55.6, 58.2) | 1.03 (56.3, 58.2) | 1.01 (57.5, 58.2) |
| Experimental Nernstian ratio CP3 | 1.05 (55.4, 58.3) | 1.04 (56.1, 58.3) | 1.02 (56.9, 58.3) |
| Experimental Nernstian ratio Orion | 1.04 (55.4, 57.7) | 1.03 (56.0, 57.7) | 1.02 (56.5, 57.7) |
| Reference Electrode | K+ Concentration (mg/L) | Na+ Concentration (mg/L) | Cl− Concentration (mg/L) | Ca2+ Concentration (mg/L) | pH |
|---|---|---|---|---|---|
| IM1 | 1.61 ± 0.05 | 7.06 ± 0.24 | 9.62 ± 0.13 | 9.73 ± 0.25 | 7.46 ± 0.00 |
| IM2 | 1.59 ± 0.02 | 7.10 ± 0.16 | 9.56 ± 0.09 | 9.54 ± 0.15 | 7.47 ± 0.01 |
| IM3 | 1.59 ± 0.04 | 7.13 ± 0.31 | 9.45 ± 0.22 | 9.39 ± 0.13 | 7.46 ± 0.01 |
| CP1 | 1.60 ± 0.04 | 7.13 ± 0.18 | 9.65 ± 0.13 | 9.50 ± 0.26 | 7.53 ± 0.01 |
| CP2 | 1.59 ± 0.03 | 7.21 ± 0.11 | 9.57± 0.18 | 9.73 ± 0.07 | 7.48 ± 0.01 |
| CP3 | 1.62 ± 0.03 | 7.10 ± 0.13 | 9.52 ± 0.10 | 9.67 ± 0.25 | 7.48 ± 0.00 |
| Commercial | 1.60 ± 0.02 | 7.14 ± 0.27 | 9.62 ± 0.14 | 9.51 ± 0.19 | 7.51 ± 0.01 |
| External laboratory | 1.60 | 7.20 | 9.10 | 9.30 | 7.50 |
| Reference Electrode | K+ Concentration (mg/L) | Na+ Concentration (mg/L) | Cl− Concentration (mg/L) | Ca2+ Concentration (mg/L) | pH |
|---|---|---|---|---|---|
| IM1 | 2.06 ± 0.11 | 10.05 ± 0.21 | 9.84 ± 0.16 | 13.72 ± 0.33 | 7.72 ± 0.02 |
| IM2 | 1.99 ± 0.05 | 10.27 ± 0.26 | 9.74 ± 0.13 | 13.73 ± 0.14 | 7.71 ± 0.02 |
| IM3 | 2.02 ± 0.05 | 10.24 ± 0.13 | 9.73 ± 0.38 | 13.40 ± 0.13 | 7.72 ± 0.02 |
| CP1 | 2.07 ± 0.04 | 10.16 ± 0.34 | 9.76 ± 0.12 | 13.53 ± 0.41 | 7.73 ± 0.01 |
| CP2 | 2.07 ± 0.01 | 10.32 ± 0.27 | 9.78 ± 0.10 | 13.15 ± 0.48 | 7.69 ± 0.02 |
| CP3 | 2.08 ± 0.04 | 10.15 ± 0.32 | 9.84 ± 0.22 | 13.67 ± 0.23 | 7.72 ± 0.02 |
| Commercial | 2.13 ± 0.01 | 9.99 ± 0.49 | 9.91 ± 0.23 | 13.70 ± 0.14 | 7.69 ± 0.00 |
| External laboratory | 2.10 | 10.00 | 10.00 | 14.00 | 7.70 |
| Reference Electrode | K+ Concentration (mg/L) | Na+ Concentration (mg/L) | Cl− Concentration (mg/L) | Ca2+ Concentration (mg/L) | pH |
|---|---|---|---|---|---|
| IM1 | 1.61 ± 0.03 | 7.18 ± 0.16 | 9.58 ± 0.31 | 9.53 ± 0.19 | 7.77 ± 0.03 |
| IM2 | 1.62 ± 0.05 | 7.17 ± 0.16 | 9.57 ± 0.09 | 9.75 ± 0.05 | 7.80 ± 0.03 |
| IM3 | 1.61 ± 0.01 | 7.32 ± 0.18 | 9.42 ± 0.11 | 9.78 ± 0.13 | 7.81 ± 0.01 |
| CP1 | 1.62 ± 0.01 | 7.58 ± 0.12 | 9.46 ± 0.17 | 9.78 ± 0.07 | 7.80 ± 0.02 |
| CP2 | 1.61 ± 0.01 | 7.36 ± 0.35 | 9.65 ± 0.31 | 9.63 ± 0.25 | 7.80 ± 0.02 |
| CP3 | 1.60 ± 0.02 | 7.34 ± 0.28 | 9.57 ± 0.19 | 9.50 ± 0.13 | 7.77 ± 0.01 |
| Commercial | 1.60 ± 0.02 | 6.80 ± 0.44 | 9.60 ± 0.08 | 9.42 ± 0.19 | 7.78 ± 0.01 |
| External laboratory | 1.60 | 7.20 | 9.10 | 9.30 | 7.50 |
| Reference Electrode | K+ Concentration (mg/L) | Na+ Concentration (mg/L) | Cl− Concentration (mg/L) | Ca2+ Concentration (mg/L) | pH |
|---|---|---|---|---|---|
| IM1 | 2.01 ± 0.03 | 9.25 ± 0.14 | 9.85 ± 0.18 | 13.60 ± 0.26 | 8.11 ± 0.03 |
| IM2 | 1.97 ± 0.01 | 9.27 ± 0.30 | 9.99 ± 0.19 | 13.64 ± 0.13 | 8.10 ± 0.02 |
| IM3 | 2.01 ± 0.03 | 9.33 ± 0.32 | 9.91 ± 0.26 | 13.42 ± 0.10 | 8.09 ± 0.02 |
| CP1 | 2.00 ± 0.03 | 9.75 ± 0.11 | 9.81 ± 0.21 | 13.32 ± 0.38 | 8.13 ± 0.01 |
| CP2 | 2.03 ± 0.02 | 9.47 ± 0.15 | 9.72 ± 0.14 | 13.57 ± 0.42 | 8.09 ± 0.01 |
| CP3 | 2.01 ± 0.01 | 9.59 ± 0.31 | 9.84 ± 0.17 | 13.73 ± 0.22 | 8.08 ± 0.02 |
| Commercial | 1.97 ± 0.02 | 9.55 ± 0.26 | 9.84 ± 0.26 | 13.16 ± 0.16 | 8.10 ± 0.01 |
| External laboratory | 2.10 | 10.00 | 10.00 | 14.00 | 7.70 |
Publisher’s Note: MDPI stays neutral with regard to jurisdictional claims in published maps and institutional affiliations. |
© 2022 by the authors. Licensee MDPI, Basel, Switzerland. This article is an open access article distributed under the terms and conditions of the Creative Commons Attribution (CC BY) license (https://creativecommons.org/licenses/by/4.0/).
Share and Cite
Blidi, S.; Granholm, K.; Sokalski, T.; Mousavi, Z.; Lewenstam, A.; Leito, I.; Bobacka, J. Long-Time Evaluation of Solid-State Composite Reference Electrodes. Membranes 2022, 12, 569. https://doi.org/10.3390/membranes12060569
Blidi S, Granholm K, Sokalski T, Mousavi Z, Lewenstam A, Leito I, Bobacka J. Long-Time Evaluation of Solid-State Composite Reference Electrodes. Membranes. 2022; 12(6):569. https://doi.org/10.3390/membranes12060569
Chicago/Turabian StyleBlidi, Slim, Kim Granholm, Tomasz Sokalski, Zekra Mousavi, Andrzej Lewenstam, Ivo Leito, and Johan Bobacka. 2022. "Long-Time Evaluation of Solid-State Composite Reference Electrodes" Membranes 12, no. 6: 569. https://doi.org/10.3390/membranes12060569