
Optimization of Giant Unilamellar Vesicle Electroformation for Phosphatidylcholine/Sphingomyelin/Cholesterol Ternary Mixtures

 , , and
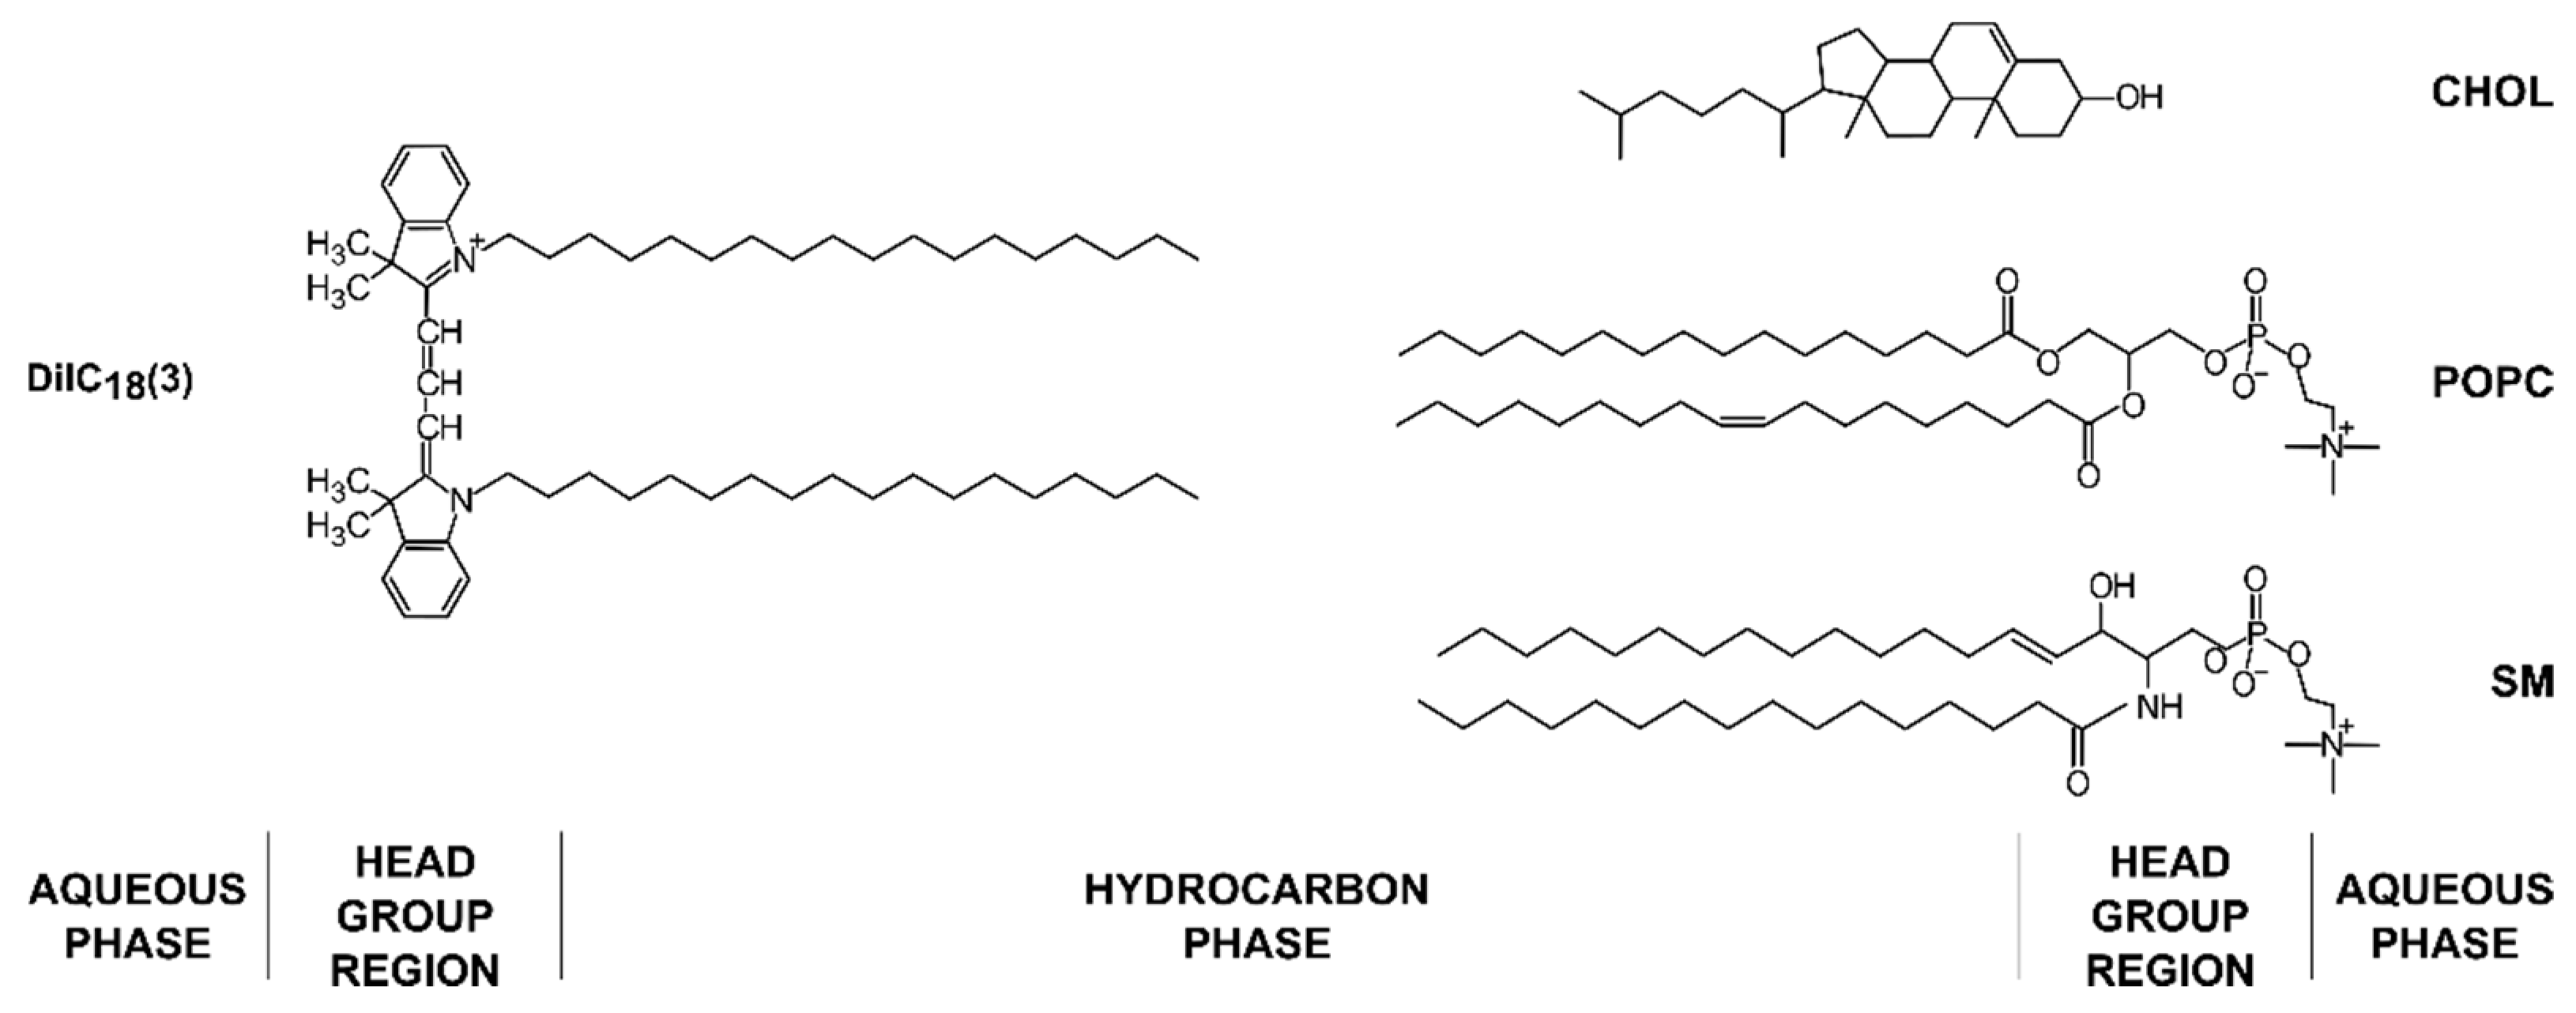
Abstract
:1. Introduction
2. Materials and Methods
2.1. Materials
2.2. Deposition of the Lipid Film
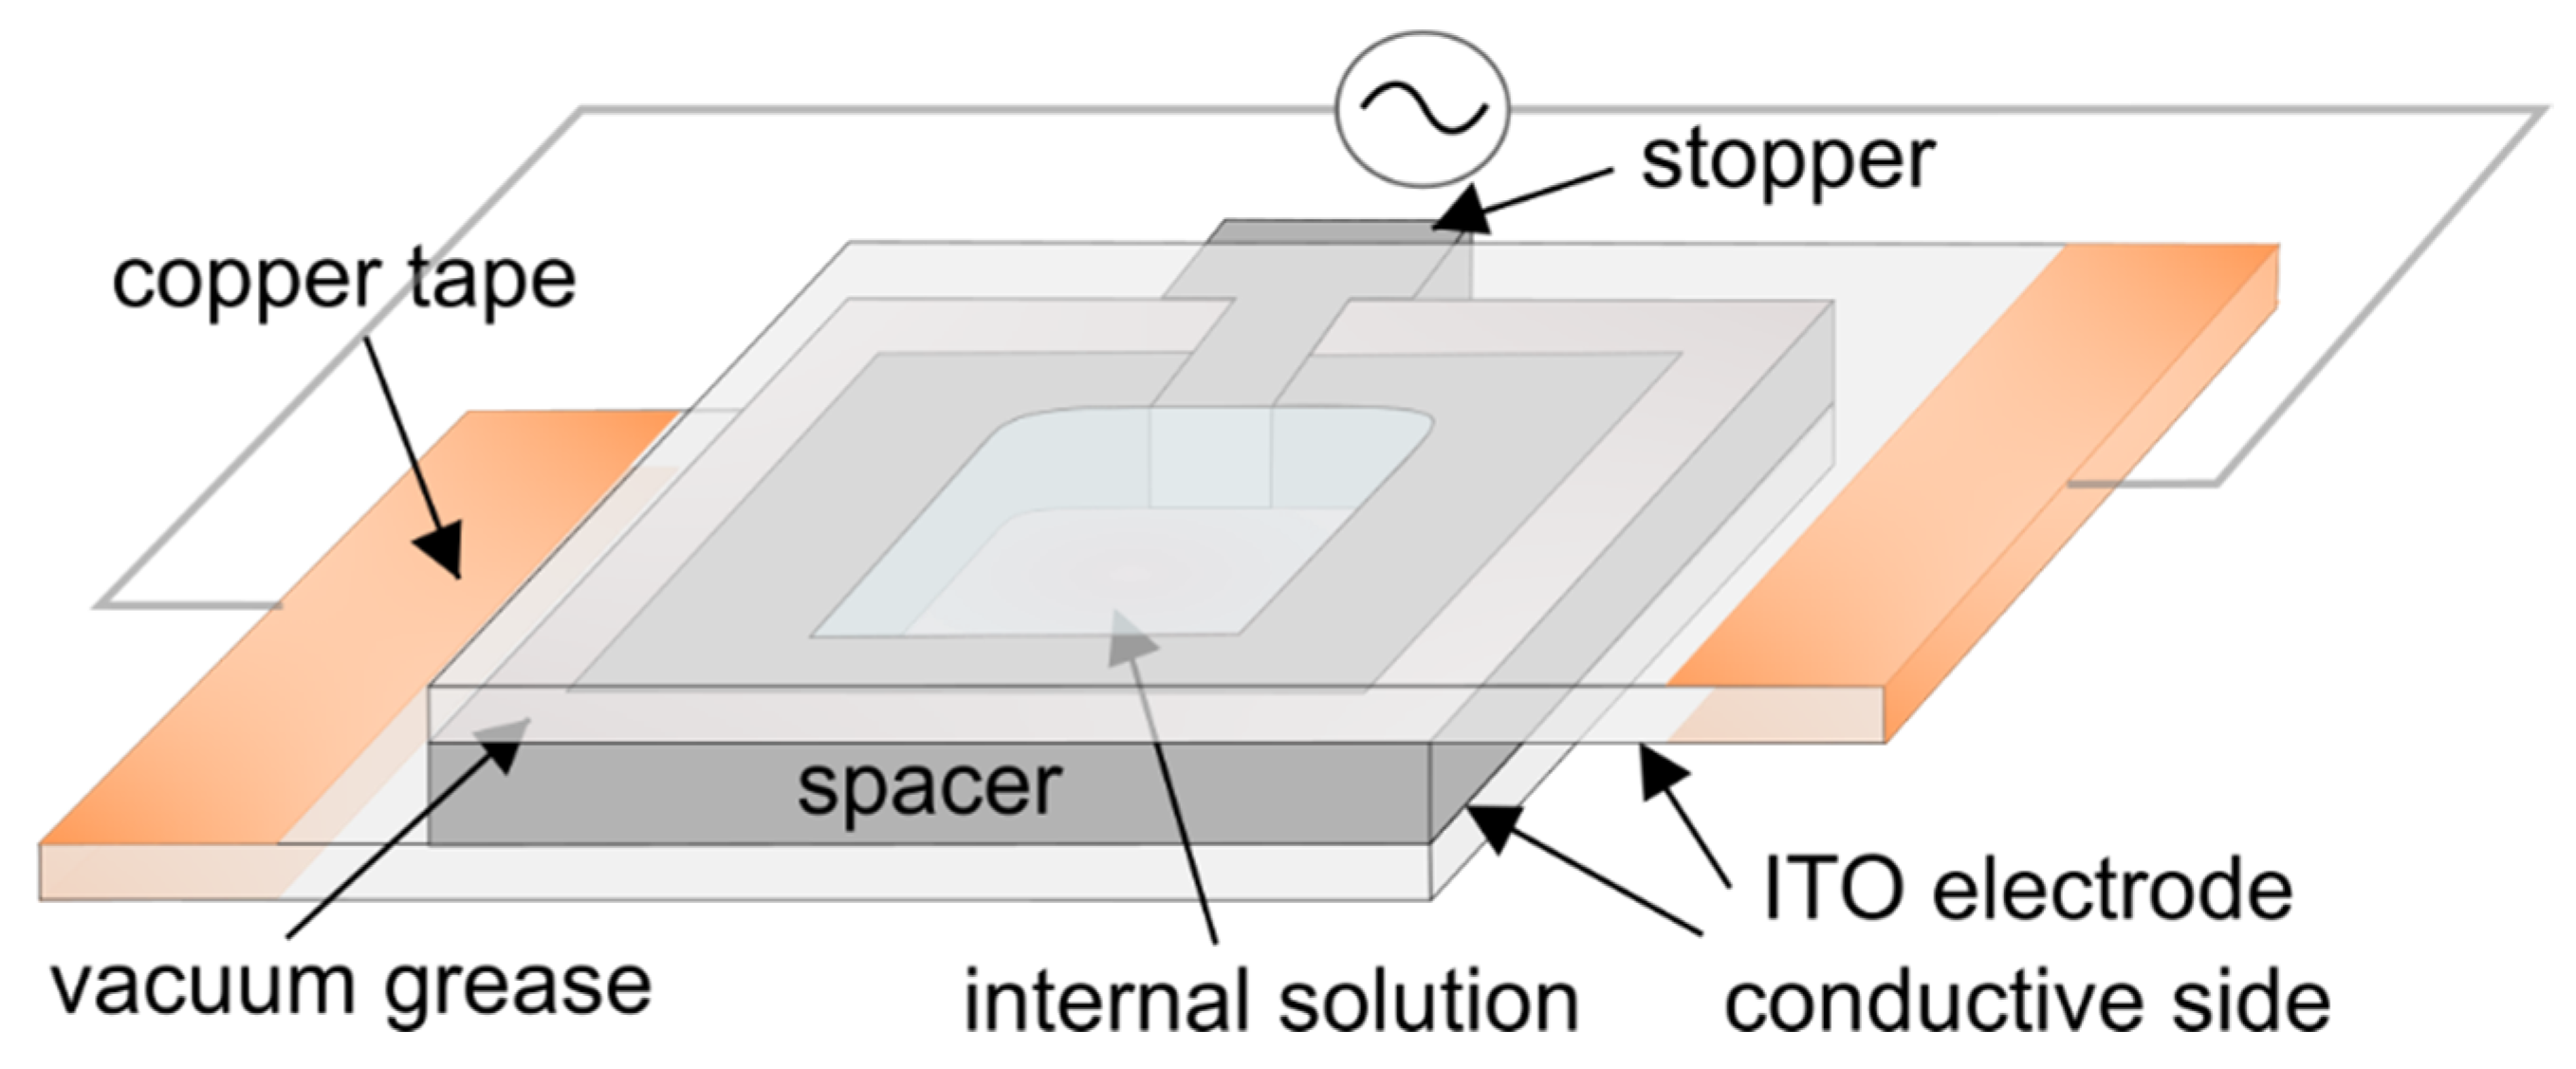
2.3. Electroformation Chamber
2.4. Thickness Measurements
2.5. Fluorescence Imaging
2.6. Data Analysis
3. Results and Discussion
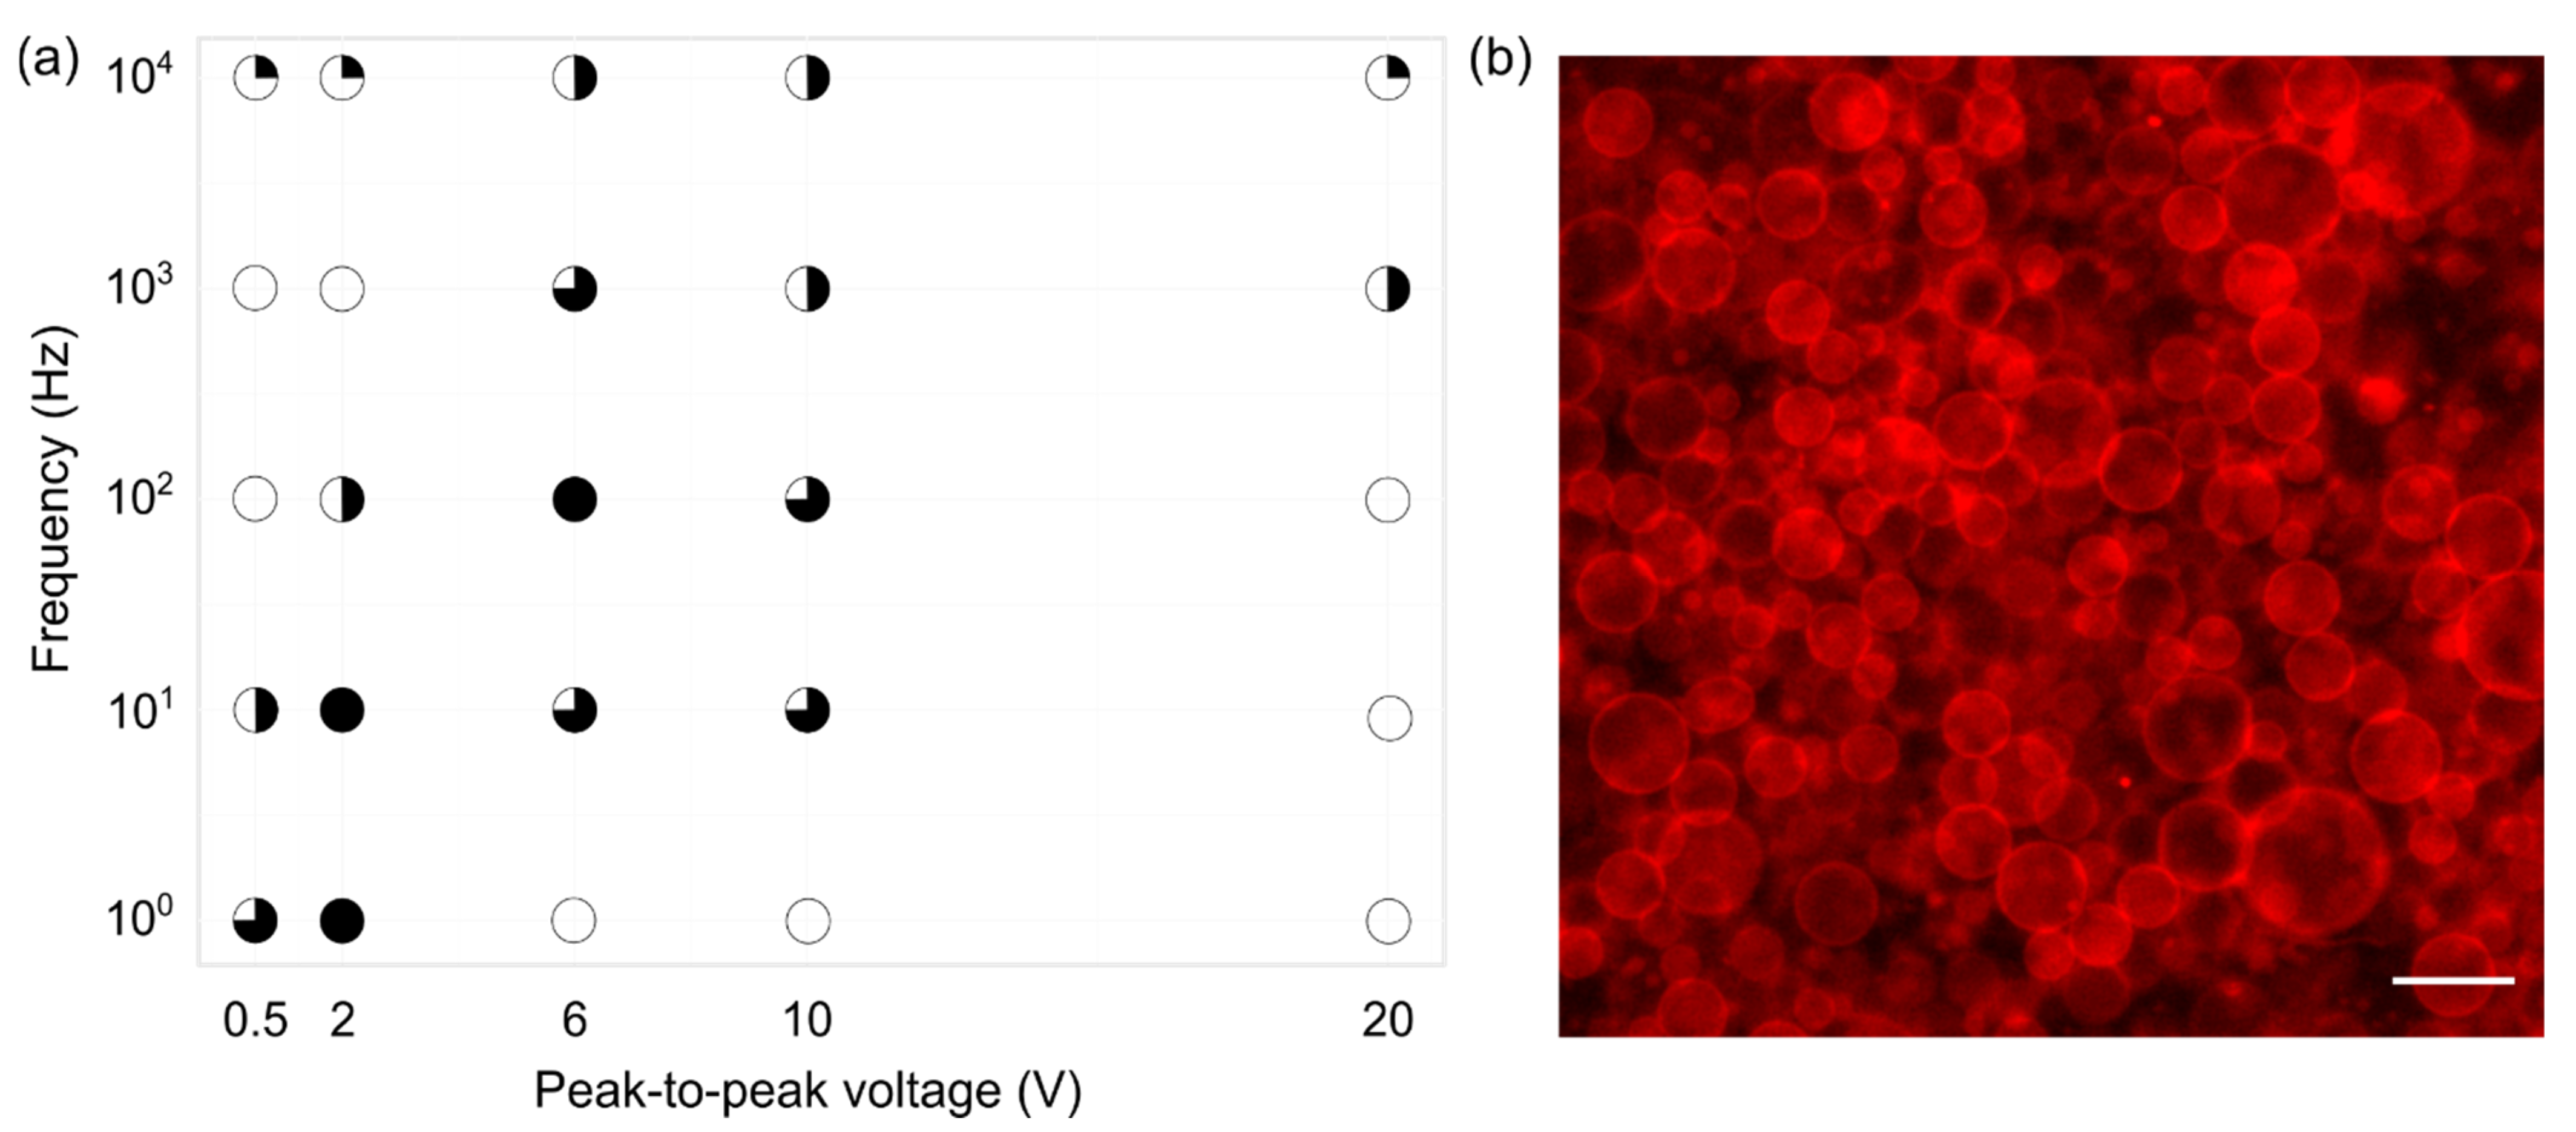
3.1. Effect of Electrical Parameters
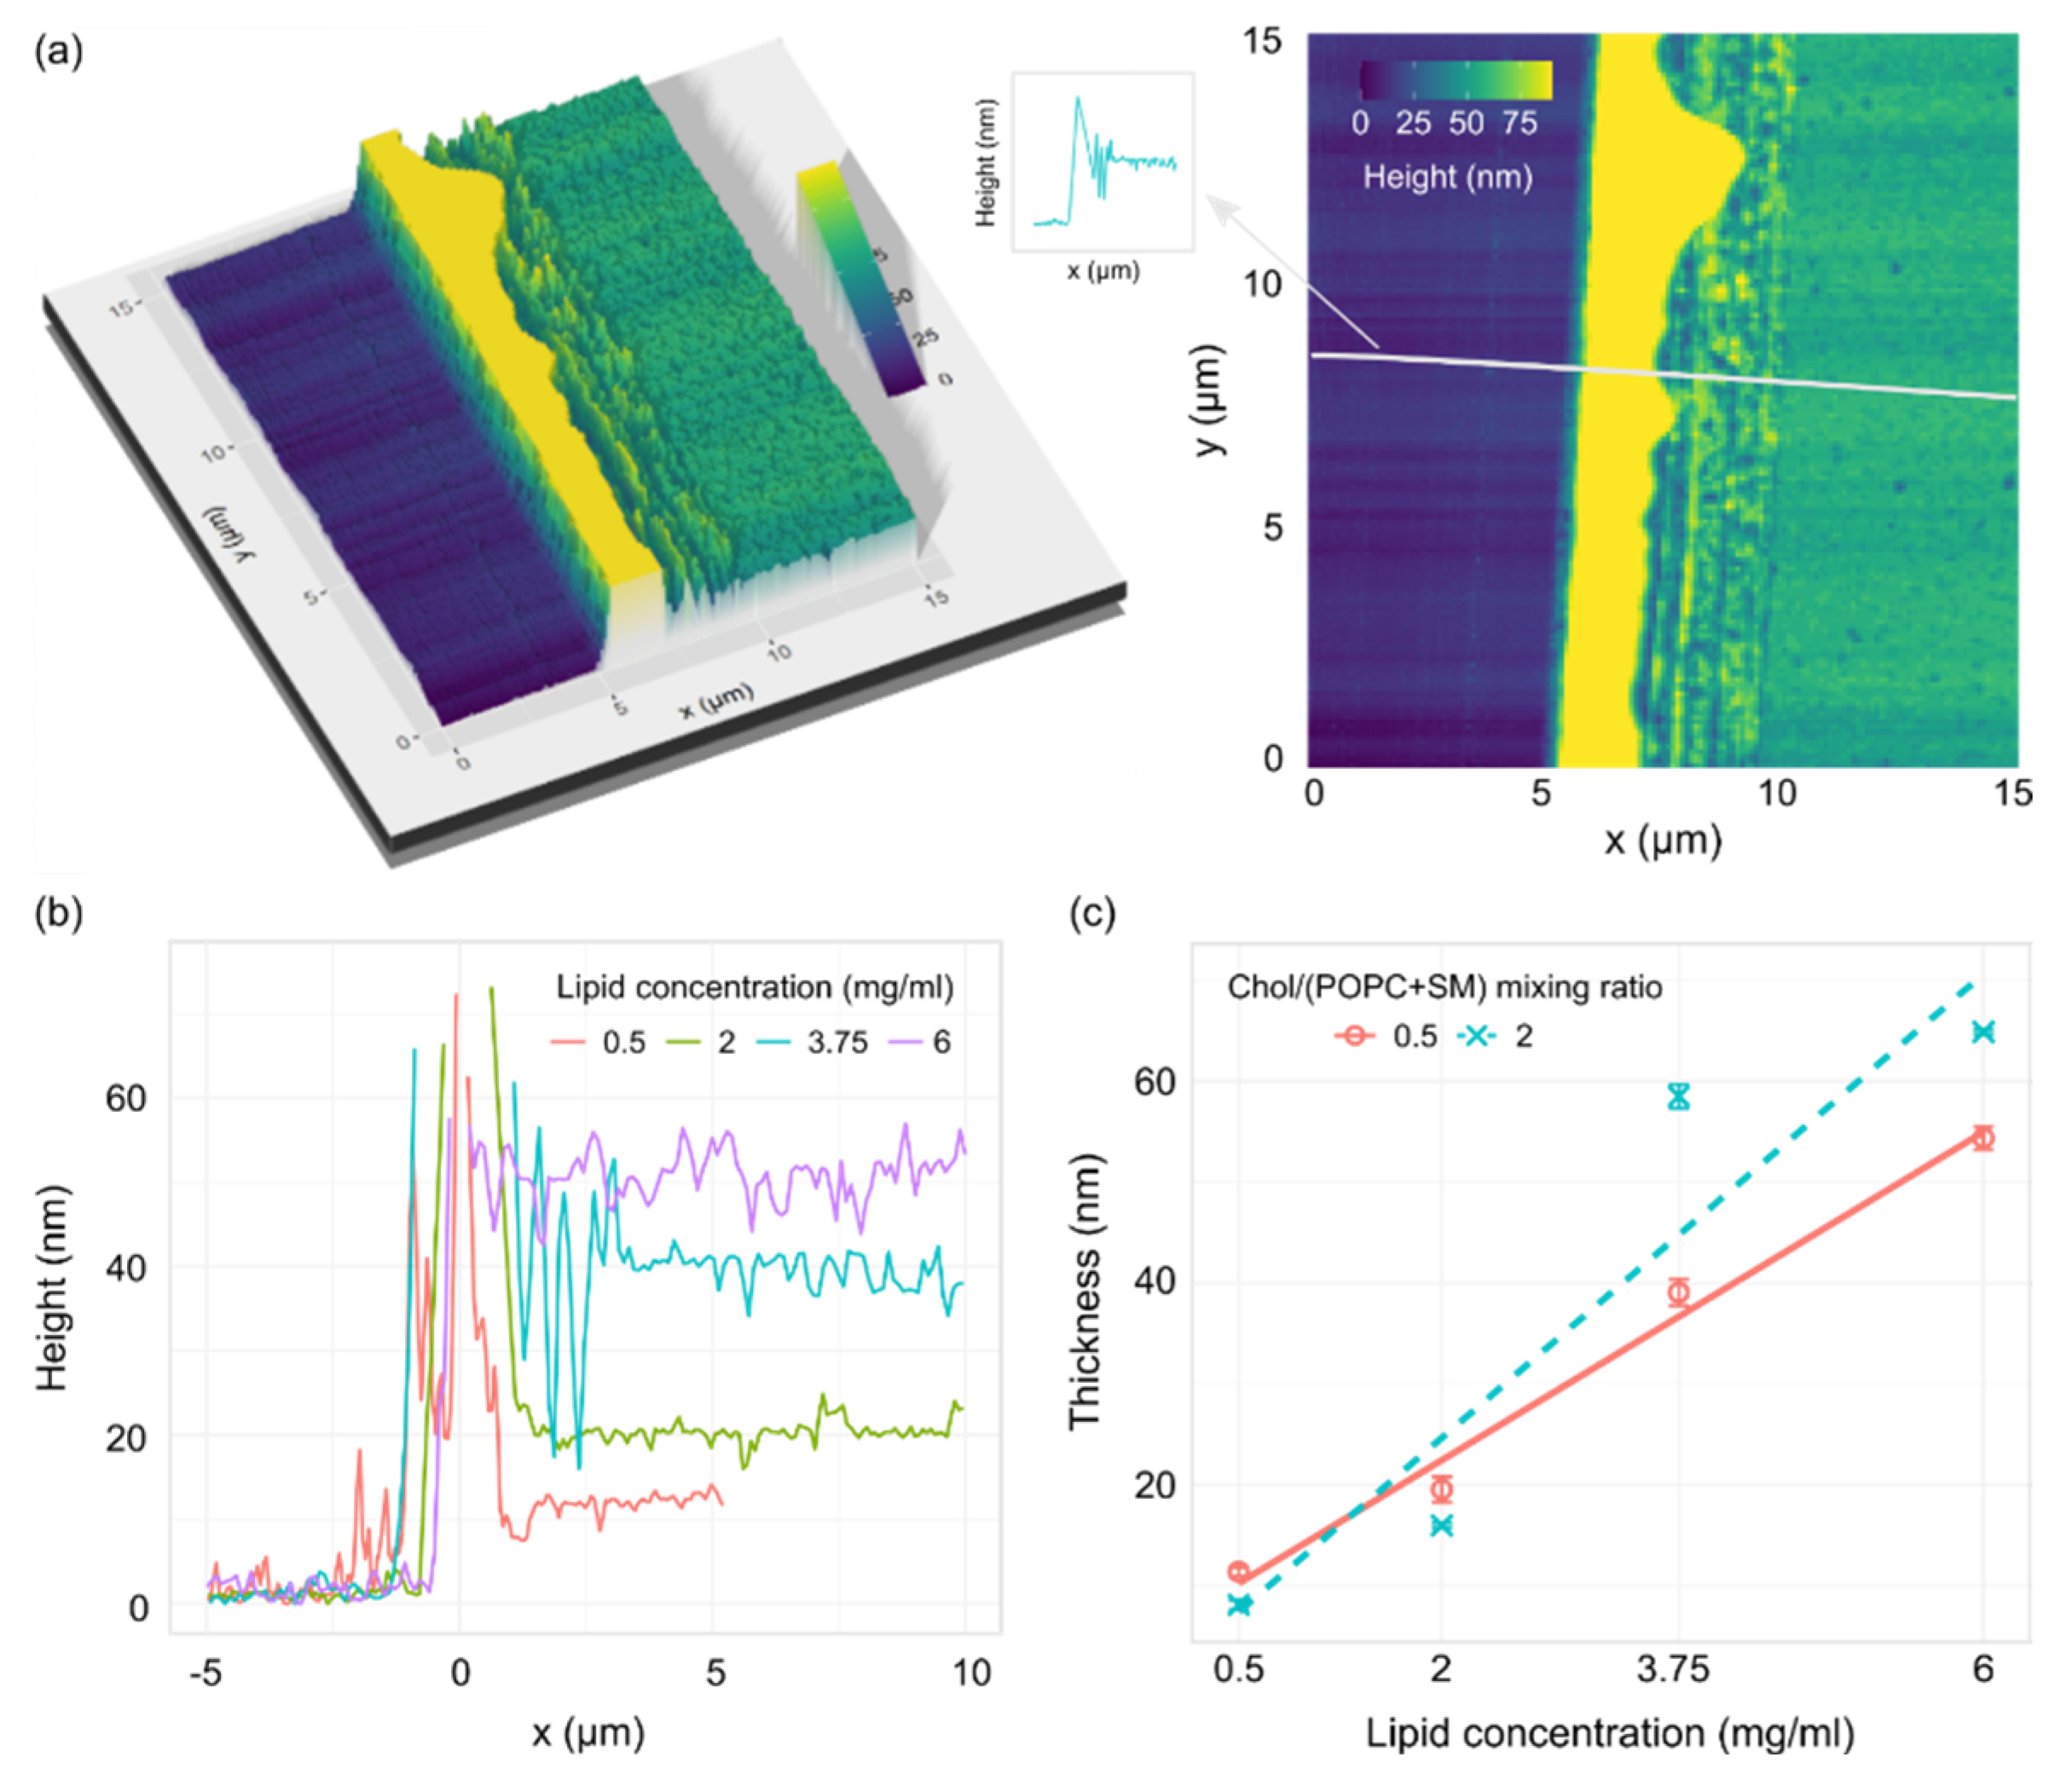
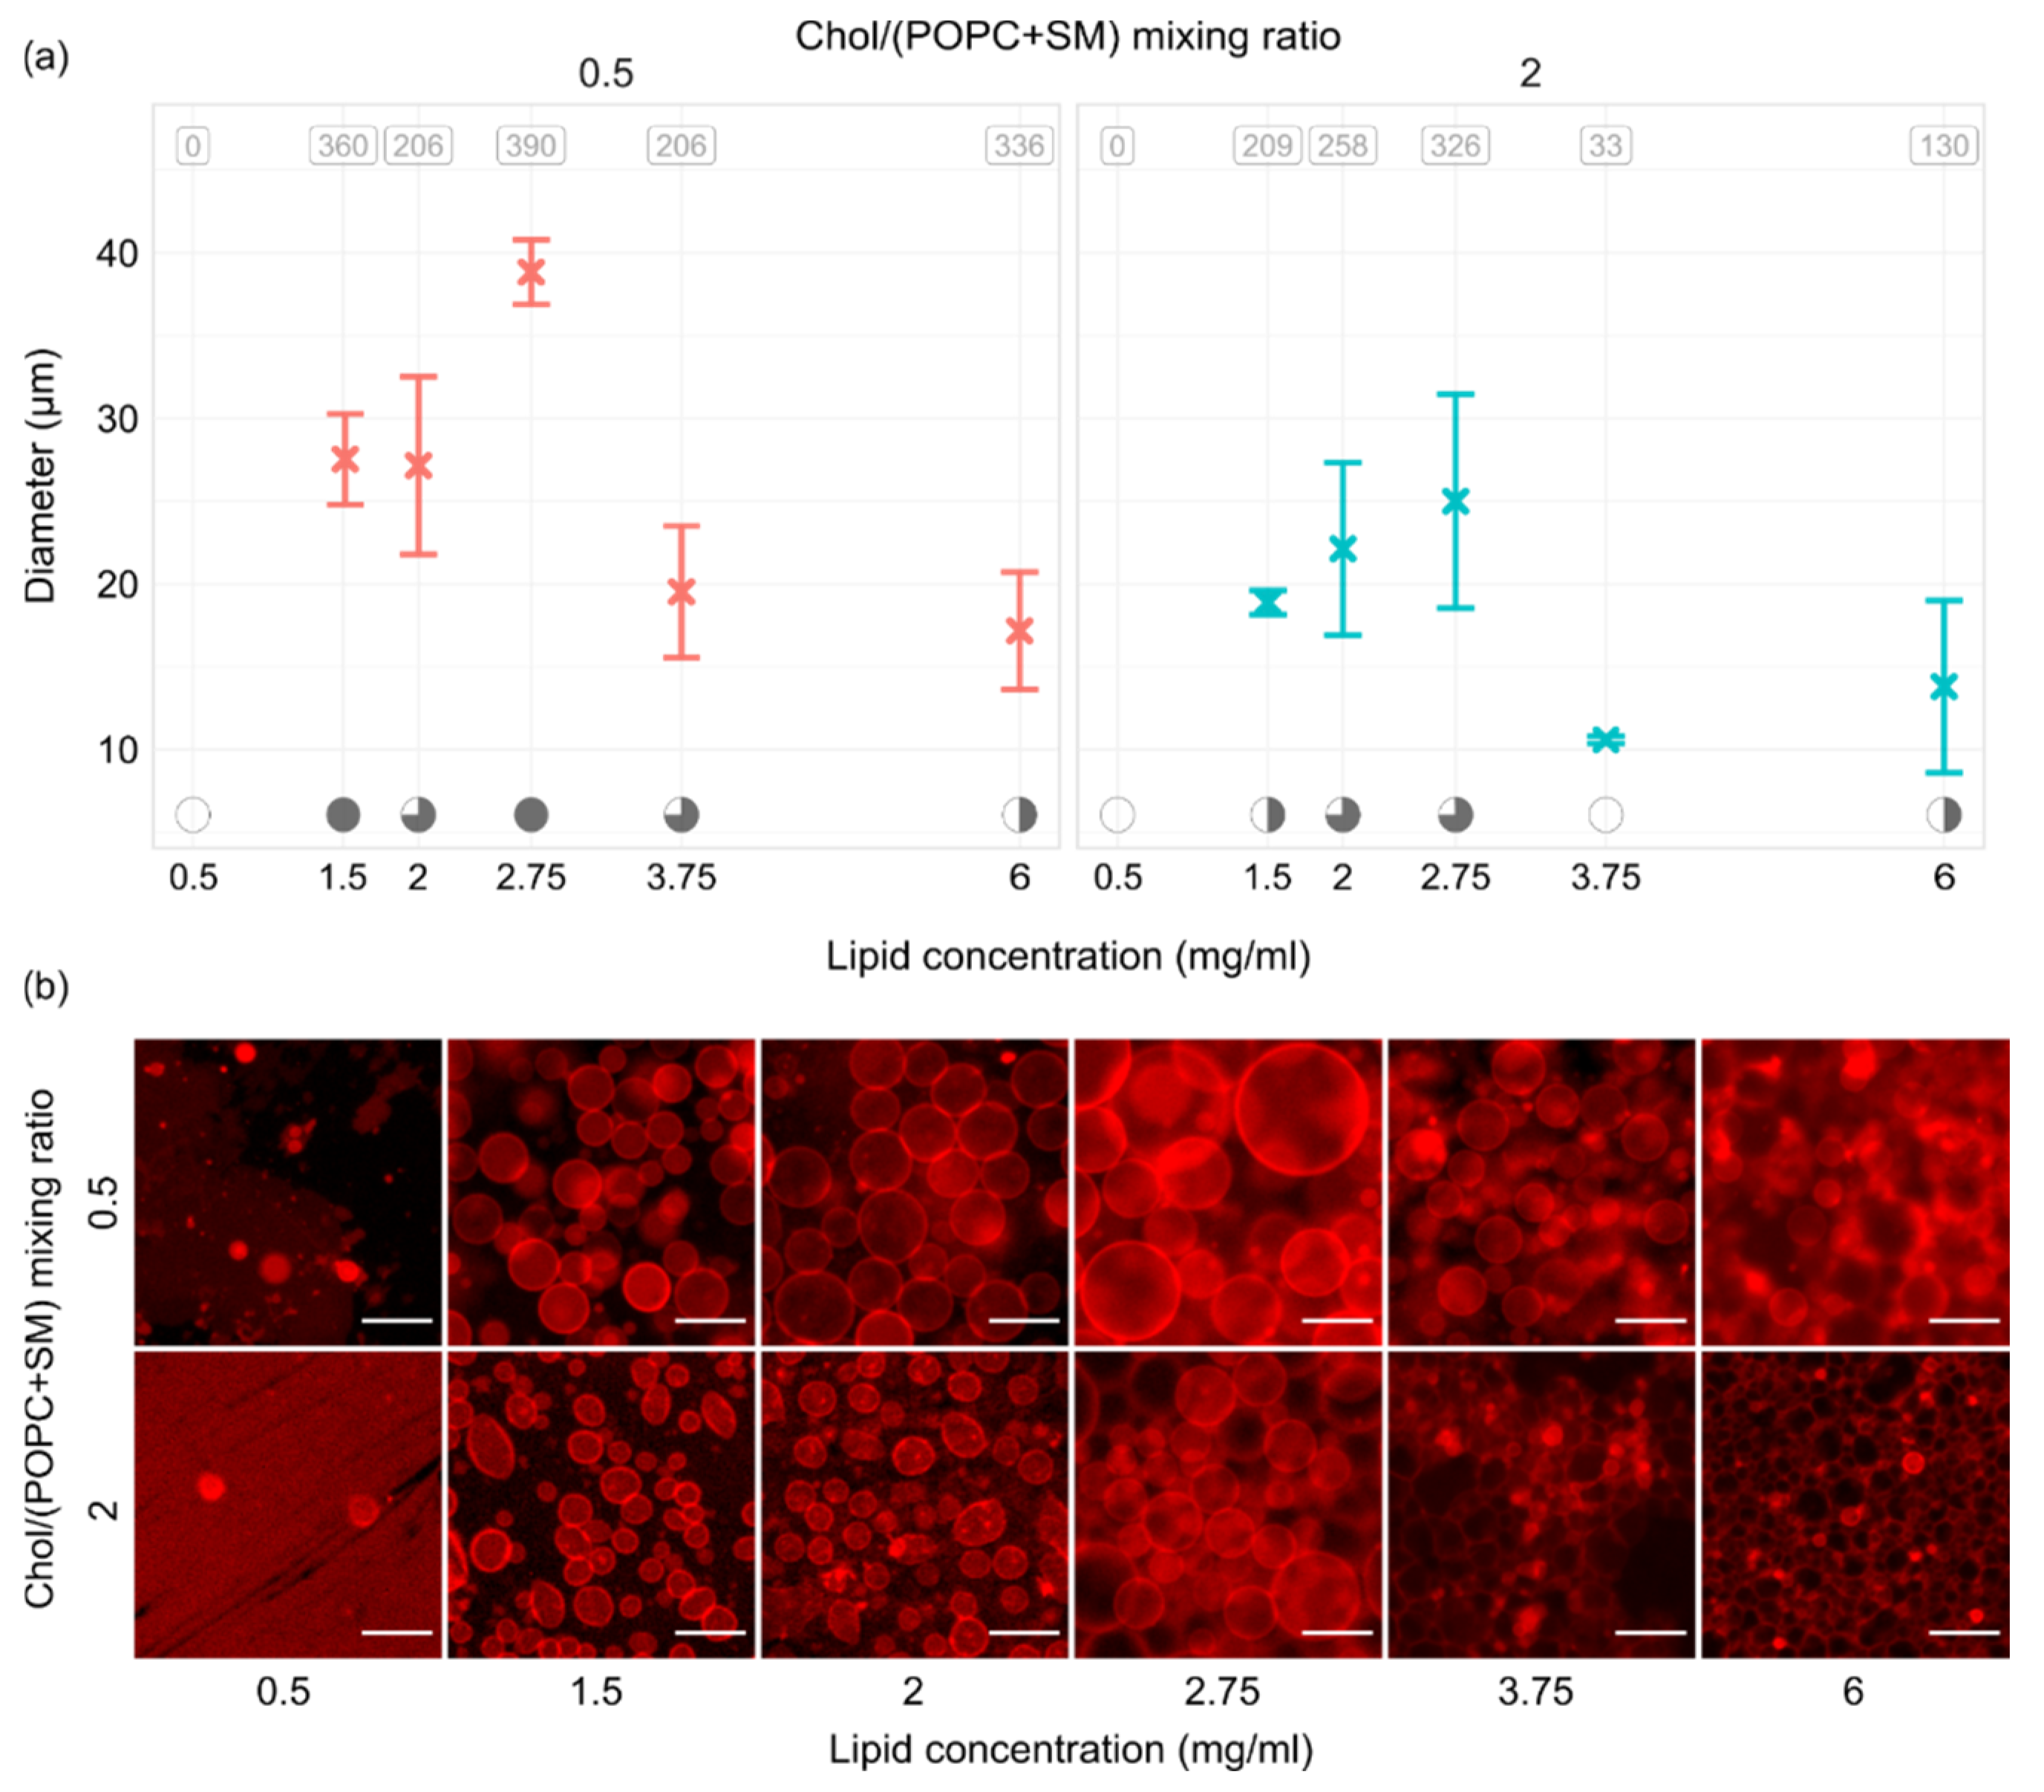
3.2. Effect of Lipid Film Thickness
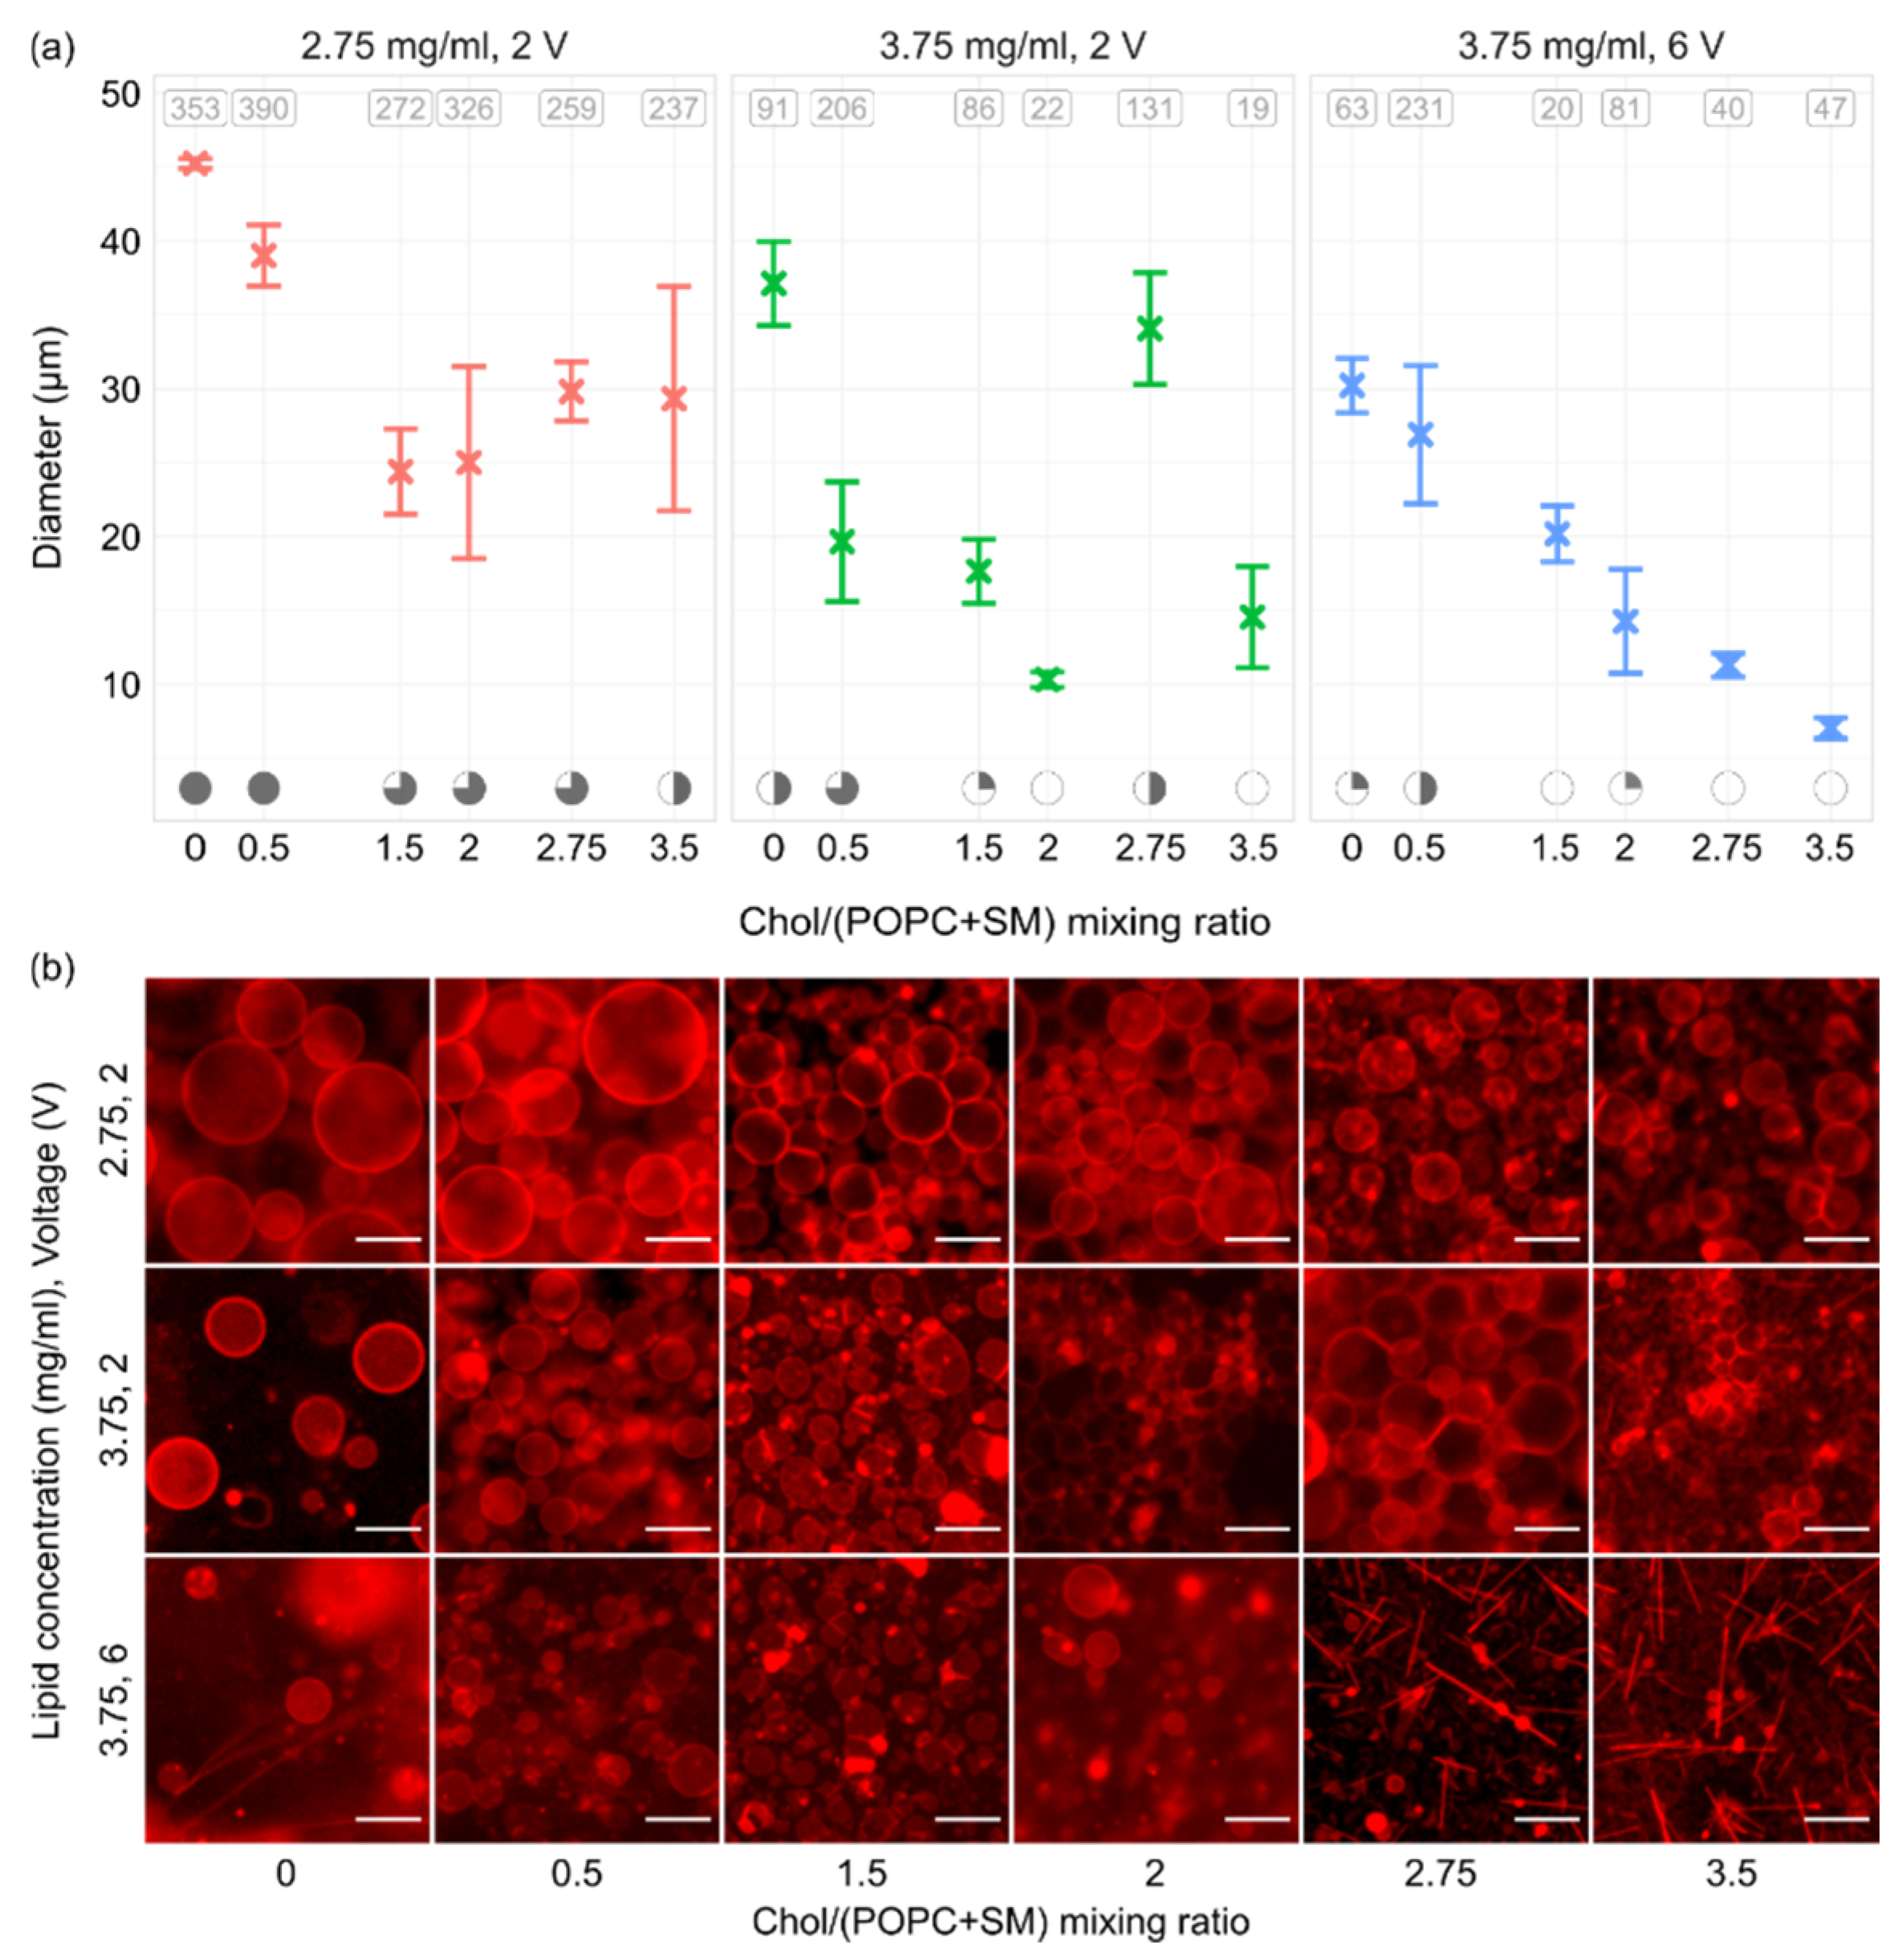
3.3. Effect of Cholesterol Concentration
4. Conclusions
Supplementary Materials
Author Contributions
Funding
Data Availability Statement
Acknowledgments
Conflicts of Interest
References
- Angelova, M.I.; Dimitrov, D.S. Liposome Electro formation. Faraday Discuss. Chem. Soc. 1986, 81, 303–311. [Google Scholar] [CrossRef]
- Boban, Z.; Mardešić, I.; Subczynski, W.K.; Raguz, M. Giant Unilamellar Vesicle Electroformation: What to Use, What to Avoid, and How to Quantify the Results. Membranes 2021, 11, 860. [Google Scholar] [CrossRef] [PubMed]
- Watson, H. Biological membranes. Essays Biochem. 2015, 59, 43–70. [Google Scholar] [CrossRef]
- Van Meer, G.; Voelker, D.R.; Feigenson, G.W. Membrane lipids: Where they are and how they behave. Nat. Rev. Mol. Cell Biol. 2008, 9, 112–124. [Google Scholar] [CrossRef] [PubMed]
- Lorent, J.H.; Levental, K.R.; Ganesan, L.; Rivera-Longsworth, G.; Sezgin, E.; Doktorova, M.; Lyman, E.; Levental, I. Plasma membranes are asymmetric in lipid unsaturation, packing and protein shape. Nat. Chem. Biol. 2020, 16, 644–652. [Google Scholar] [CrossRef]
- Kusumi, A.; Fujiwara, T.K.; Tsunoyama, T.A.; Kasai, R.S.; Koichiro, A.L.; Masanao, M.H.; Matsumori, N.; Komura, N.; Ando, H.; Suzuki, K.G.N. Defining raft domains in the plasma membrane. Traffic 2020, 21, 106–137. [Google Scholar] [CrossRef]
- Lecuyer, S.; Fragneto, G.; Charitat, T. Effect of an electric field on a floating lipid bilayer: A neutron reflectivity study. Eur. Phys. J. E 2006, 21, 153–159. [Google Scholar] [CrossRef]
- Li, Q.; Wang, X.; Ma, S.; Zhang, Y.; Han, X. Electroformation of giant unilamellar vesicles in saline solution. Colloids Surf. B Biointerfaces 2016, 147, 368–375. [Google Scholar] [CrossRef]
- Estes, D.J.; Mayer, M. Electroformation of giant liposomes from spin-coated films of lipids. Colloids Surf. B Biointerfaces 2005, 42, 115–123. [Google Scholar] [CrossRef]
- Oropeza-Guzman, E.; Riós-Ramírez, M.; Ruiz-Suárez, J.C. Leveraging the Coffee Ring Effect for a Defect-Free Electroformation of Giant Unilamellar Vesicles. Langmuir 2019, 35, 16528–16535. [Google Scholar] [CrossRef]
- Berre, L.; Chen, Y.; Baigl, D. From Convective Assembly to Landau—Levich Deposition of Multilayered Phospholipid Films of Controlled Thickness. Langmuir 2009, 25, 2554–2557. [Google Scholar] [CrossRef]
- Mainali, L.; Raguz, M.; O’Brien, W.J.; Subczynski, W.K. Properties of membranes derived from the total lipids extracted from clear and cataractous lenses of 61–70-year-old human donors. Eur. Biophys. J. 2014, 44, 91–102. [Google Scholar] [CrossRef] [PubMed] [Green Version]
- Raguz, M.; Kumar, S.N.; Zareba, M.; Ilic, N.; Mainali, L.; Subczynski, W.K. Confocal Microscopy Confirmed that in Phosphatidylcholine Giant Unilamellar Vesicles with very High Cholesterol Content Pure Cholesterol Bilayer Domains Form. Cell Biochem. Biophys. 2019, 77, 309–317. [Google Scholar] [CrossRef] [PubMed]
- Subczynski, W.K.; Raguz, M.; Widomska, J.; Mainali, L.; Konovalov, A. Functions of cholesterol and the cholesterol bilayer domain specific to the fiber-cell plasma membrane of the eye lens. J. Membr. Biol. 2012, 245, 51–68. [Google Scholar] [CrossRef] [PubMed] [Green Version]
- Mainali, L.; Raguz, M.; O’Brien, W.J.; Subczynski, W.K. Properties of membranes derived from the total lipids extracted from the human lens cortex and nucleus. Biochim. Biophys. Acta-Biomembr. 2013, 1828, 1432–1440. [Google Scholar] [CrossRef] [Green Version]
- Subczynski, W.K.; Mainali, L.; Raguz, M.; O’Brien, W.J. Organization of lipids in fiber-cell plasma membranes of the eye lens. Exp. Eye Res. 2017, 156, 79–86. [Google Scholar] [CrossRef] [PubMed] [Green Version]
- Widomska, J.; Subczynski, W.K.; Mainali, L.; Raguz, M. Cholesterol Bilayer Domains in the Eye Lens Health: A Review. Cell Biochem. Biophys. 2017, 75, 387–398. [Google Scholar] [CrossRef] [PubMed]
- Mason, R.P.; Tulenko, T.N.; Jacob, R.F. Direct evidence for cholesterol crystalline domains in biological membranes: Role in human pathobiology. Biochim. Biophys. Acta-Biomembr. 2003, 1610, 198–207. [Google Scholar] [CrossRef] [Green Version]
- Subczynski, W.K.; Pasenkiewicz-Gierula, M. Hypothetical Pathway for Formation of Cholesterol Microcrystals Initiating the Atherosclerotic Process. Cell Biochem. Biophys. 2020, 78, 241–247. [Google Scholar] [CrossRef]
- Li, L.K.; So, L.; Spector, A. Membrane cholesterol and phospholipid in consecutive concentric sections of human lenses. J. Lipid Res. 1985, 26, 600–609. [Google Scholar] [CrossRef]
- Li, L.-K.; So, L.; Spector, A. Age-dependent changes in the distribution and concentration of human lens cholesterol and phospholipids. Biochim. Biophys. Acta (BBA)-Lipids Lipid Metab. 1987, 917, 112–120. [Google Scholar] [CrossRef]
- Huang, J.; Buboltz, J.T.; Feigenson, G.W. Maximum solubility of cholesterol in phosphatidylcholine and phosphatidylethanolamine bilayers. Biochim. Biophys. Acta (BBA)-Biomembr. 1999, 1417, 89–100. [Google Scholar] [CrossRef] [Green Version]
- Baykal-Caglar, E.; Hassan-Zadeh, E.; Saremi, B.; Huang, J. Preparation of giant unilamellar vesicles from damp lipid film for better lipid compositional uniformity. Biochim. Biophys. Acta-Biomembr. 2012, 1818, 2598–2604. [Google Scholar] [CrossRef] [PubMed] [Green Version]
- Mainali, L.; Pasenkiewicz-Gierula, M.; Subczynski, W.K. Formation of cholesterol Bilayer Domains Precedes Formation of Cholesterol Crystals in Membranes Made of the Major Phospholipids of Human Eye Lens Fiber Cell Plasma Membranes. Curr. Eye Res. 2020, 45, 162–172. [Google Scholar] [CrossRef]
- Buboltz, J.T.; Feigenson, G.W. A novel strategy for the preparation of liposomes: Rapid solvent exchange. Biochim. Biophys. Acta (BBA)-Biomembr. 1999, 1417, 232–245. [Google Scholar] [CrossRef] [Green Version]
- Buboltz, J.T. A more efficient device for preparing model-membrane liposomes by the rapid solvent exchange method. Rev. Sci. Instrum. 2009, 80, 124301. [Google Scholar] [CrossRef]
- Herold, C.; Chwastek, G.; Schwille, P.; Petrov, E.P. Efficient electroformation of supergiant unilamellar vesicles containing cationic lipids on ITO-coated electrodes. Langmuir 2012, 28, 5518–5521. [Google Scholar] [CrossRef]
- Veatch, S.L. Electro-formation and fluorescence microscopy of giant vesicles with coexisting liquid phases. Methods Mol. Biol. 2007, 398, 59–72. [Google Scholar] [CrossRef]
- Schindelin, J.; Arganda-Carreras, I.; Frise, E.; Kaynig, V.; Longair, M.; Pietzsch, T.; Preibisch, S.; Rueden, C.; Saalfeld, S.; Schmid, B.; et al. Fiji: An open-source platform for biological-image analysis. Nat. Methods 2012, 9, 676. [Google Scholar] [CrossRef] [Green Version]
- R Development Core Team. R: A Language and Environment for Statistical Computing; R Development Core Team: Vienna, Austria, 2008. [Google Scholar]
- De Almeida, R.F.M.; Fedorov, A.; Prieto, M. Sphingomyelin/phosphatidylcholine/cholesterol phase diagram: Boundaries and composition of lipid rafts. Biophys. J. 2003, 85, 2406–2416. [Google Scholar] [CrossRef] [Green Version]
- Zhou, Y.; Berry, C.K.; Storer, P.A.; Raphael, R.M. Peroxidation of polyunsaturated phosphatidyl-choline lipids during electroformation. Biomaterials 2007, 28, 1298–1306. [Google Scholar] [CrossRef]
- Breton, M.; Amirkavei, M.; Mir, L.M. Optimization of the Electroformation of Giant Unilamellar Vesicles (GUVs) with Unsaturated Phospholipids. J. Membr. Biol. 2015, 248, 827–835. [Google Scholar] [CrossRef]
- Li, W.; Wang, Q.; Yang, Z.; Wang, W.; Cao, Y.; Hu, N.; Luo, H.; Liao, Y.; Yang, J. Impacts of electrical parameters on the electroformation of giant vesicles on ITO glass chips. Colloids Surf. B Biointerfaces 2016, 140, 560–566. [Google Scholar] [CrossRef] [PubMed]
- Dimitrov, D.S.; Angelova, M.I. Lipid swelling and liposome formation on solid surfaces in external electric fields. In New Trends in Colloid Science; Springer: Berlin/Heidelberg, Germany, 1987; pp. 48–56. [Google Scholar]
- Politano, T.J.; Froude, V.E.; Jing, B.; Zhu, Y. AC-electric field dependent electroformation of giant lipid vesicles. Colloids Surf. B Biointerfaces 2010, 79, 75–82. [Google Scholar] [CrossRef] [PubMed]
- Drabik, D.; Doskocz, J.; Przybyło, M. Effects of electroformation protocol parameters on quality of homogeneous GUV populations. Chem. Phys. Lipids 2018, 212, 88–95. [Google Scholar] [CrossRef] [PubMed]
- Boban, Z.; Puljas, A.; Kovač, D.; Subczynski, W.K.; Raguz, M. Effect of Electrical Parameters and Cholesterol Concentration on Giant Unilamellar Vesicles Electroformation. Cell Biochem. Biophys. 2020, 78, 157–164. [Google Scholar] [CrossRef]
- Hung, W.-C.; Lee, M.-T.; Chen, F.-Y.; Huang, H.W. The Condensing Effect of Cholesterol in Lipid Bilayers. Biophys. J. 2007, 92, 3960. [Google Scholar] [CrossRef] [Green Version]
- Saeedimasine, M.; Montanino, A.; Kleiven, S.; Villa, A. Role of lipid composition on the structural and mechanical features of axonal membranes: A molecular simulation study. Sci. Rep. 2019, 9, 8000. [Google Scholar] [CrossRef] [Green Version]


Publisher’s Note: MDPI stays neutral with regard to jurisdictional claims in published maps and institutional affiliations. |
© 2022 by the authors. Licensee MDPI, Basel, Switzerland. This article is an open access article distributed under the terms and conditions of the Creative Commons Attribution (CC BY) license (https://creativecommons.org/licenses/by/4.0/).
Share and Cite
Boban, Z.; Mardešić, I.; Subczynski, W.K.; Jozić, D.; Raguz, M. Optimization of Giant Unilamellar Vesicle Electroformation for Phosphatidylcholine/Sphingomyelin/Cholesterol Ternary Mixtures. Membranes 2022, 12, 525. https://doi.org/10.3390/membranes12050525
Boban Z, Mardešić I, Subczynski WK, Jozić D, Raguz M. Optimization of Giant Unilamellar Vesicle Electroformation for Phosphatidylcholine/Sphingomyelin/Cholesterol Ternary Mixtures. Membranes. 2022; 12(5):525. https://doi.org/10.3390/membranes12050525
Chicago/Turabian StyleBoban, Zvonimir, Ivan Mardešić, Witold Karol Subczynski, Dražan Jozić, and Marija Raguz. 2022. "Optimization of Giant Unilamellar Vesicle Electroformation for Phosphatidylcholine/Sphingomyelin/Cholesterol Ternary Mixtures" Membranes 12, no. 5: 525. https://doi.org/10.3390/membranes12050525