
A Novel Mock Circuit to Test Full-Flow Extracorporeal Membrane Oxygenation

 , and
, and 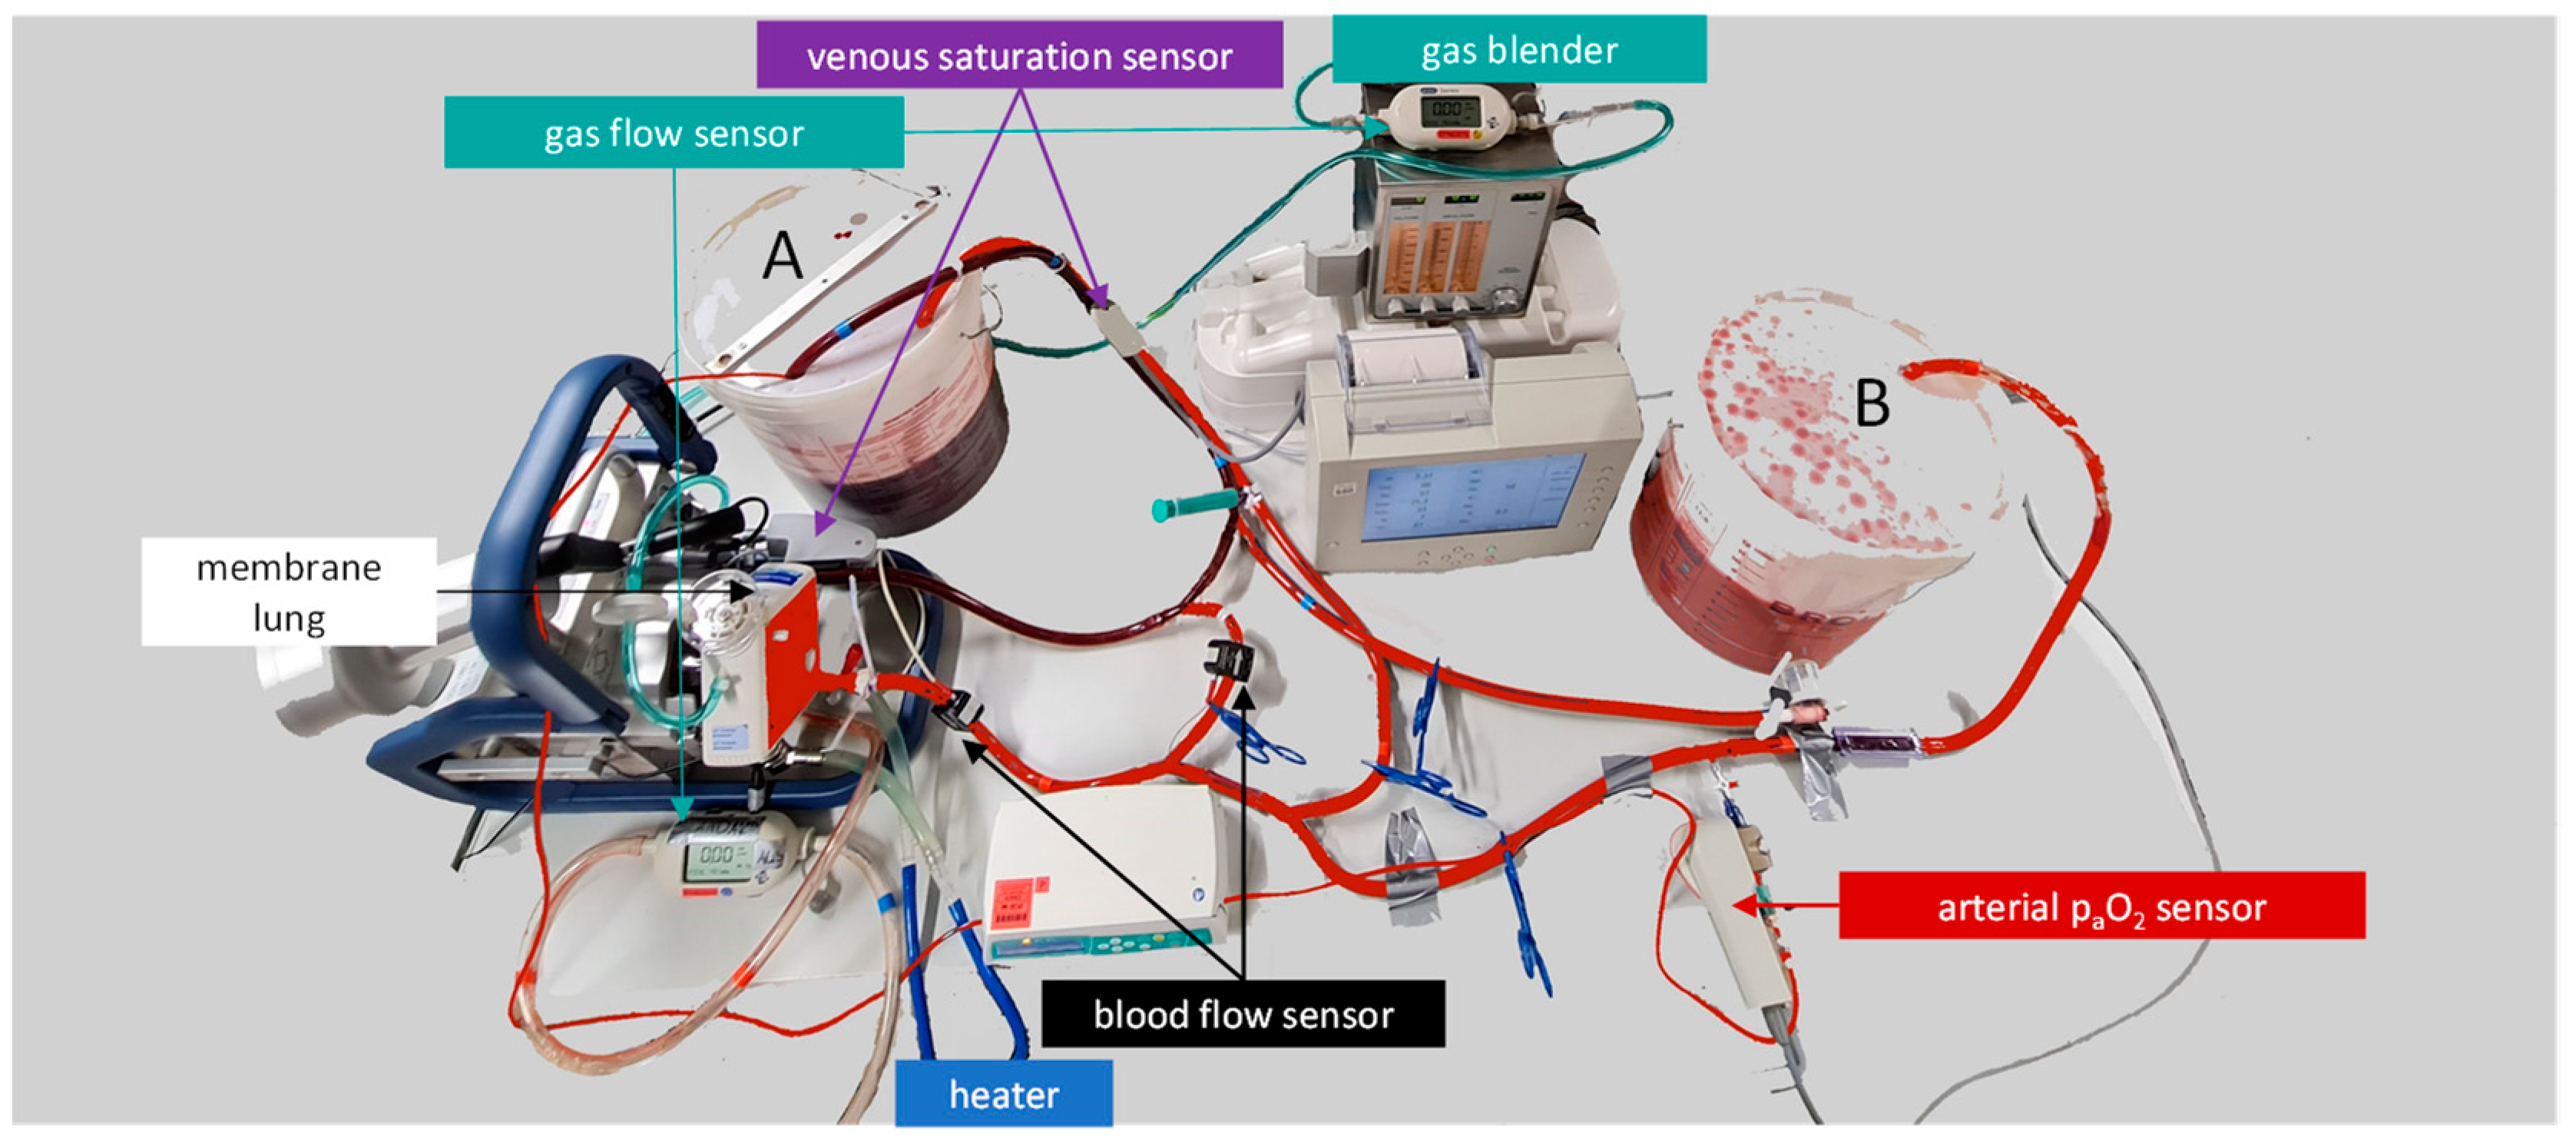
Abstract
:1. Introduction
2. Materials and Methods
2.1. Design of the ECMO Mock Model
2.1.1. Regeneration Sequence
2.1.2. Measuring Sequence
[1/mmHg × mL/dL] − Hb [g/dL] × 1.34 [mL/g] × SvO2)
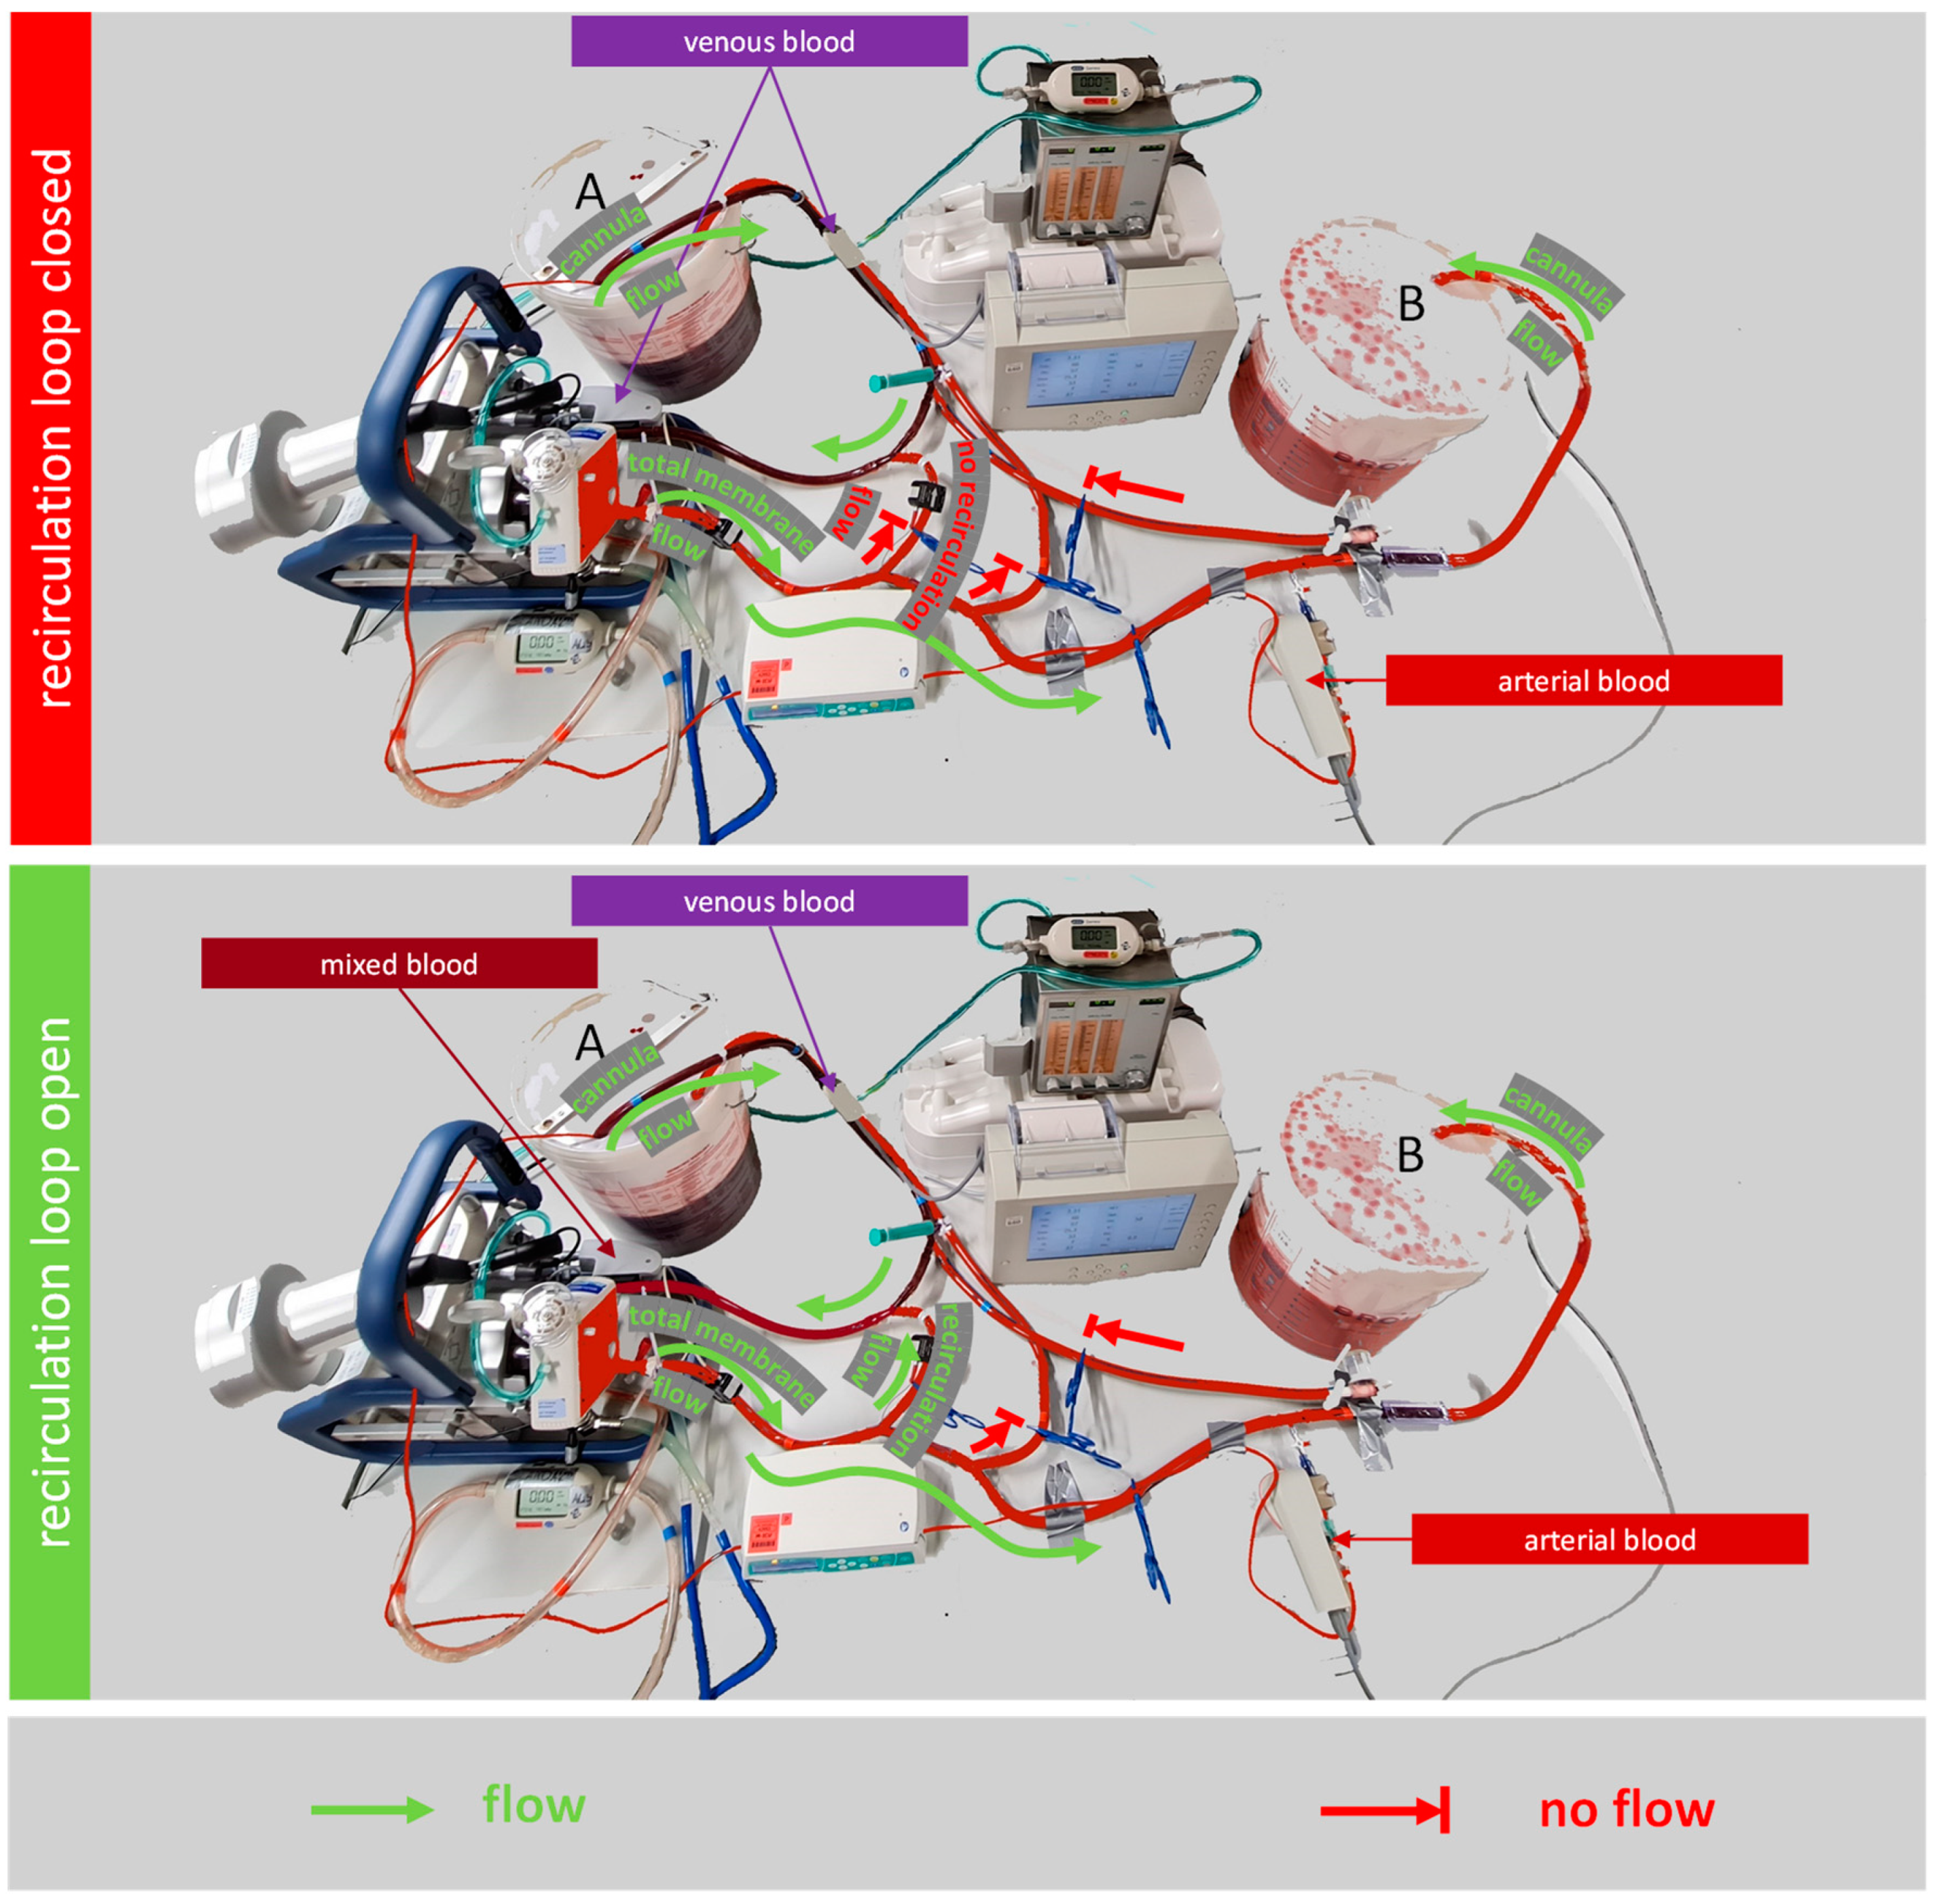
2.2. Testing the Effect of a Recirculation Loop on the Oxygen Transfer Rate
2.3. Statistics
3. Results
3.1. Design of the ECMO Mock Model
3.2. Testing the Effect of a Recirculation Loop on the Oxygen Transfer Rate
4. Discussion
4.1. Design of Our ECMO Mock Model
4.1.1. Limitations of Our Mock Model
4.1.2. Comparison of Our ECMO Mock Model to Other Mock Models
4.2. Testing the Effect of a Recirculation Loop on the Oxygen Transfer Rate
5. Conclusions
Author Contributions
Funding
Institutional Review Board Statement
Informed Consent Statement
Data Availability Statement
Acknowledgments
Conflicts of Interest
References
- Brodie, D.; Bacchetta, M. Extracorporeal Membrane Oxygenation for ARDS in Adults. N. Engl. J. Med. 2011, 365, 1905–1914. [Google Scholar] [CrossRef] [Green Version]
- Zhou, Z.; Kuang, H.; Ma, Y.; Zhang, L. Application of Extracorporeal Therapies in Critically Ill COVID-19 Patients. J. Zhejiang Univ. Sci. B 2021, 22, 701–717. [Google Scholar] [CrossRef]
- Ñamendys-Silva, S.A. ECMO for ARDS Due to COVID-19. Heart Lung 2020, 49, 348–349. [Google Scholar] [CrossRef] [PubMed] [Green Version]
- Bleilevens, C.; Grottke, O.; Tillmann, S.; Honickel, M.; Kopp, R.; Arens, J.; Rossaint, R. Twelve Hours In Vitro Biocompatibility Testing of Membrane Oxygenators. ASAIO J. 2015, 61, 548–555. [Google Scholar] [CrossRef] [PubMed]
- Millar, J.E.; Bartnikowski, N.; von Bahr, V.; Malfertheiner, M.V.; Obonyo, N.G.; Belliato, M.; Suen, J.Y.; Combes, A.; on behalf of the European Extracorporeal Life Support Organisation (EuroELSO) Innovations Workgroup; the National Health Medical Research Council Australia Centre of Research Excellence for Advanced Cardio-respiratory Therapies Improving Organ Support (NHMRC CREACTIONS). Extracorporeal Membrane Oxygenation (ECMO) and the Acute Respiratory Distress Syndrome (ARDS): A Systematic Review of Pre-Clinical Models. Intensive Care Med. Exp. 2019, 7, 18. [Google Scholar] [CrossRef] [PubMed] [Green Version]
- Badheka, A.; Stucker, S.E.; Turek, J.W.; Raghavan, M.L. Efficacy of Flow Monitoring During ECMO. ASAIO J. 2017, 63, 496–500. [Google Scholar] [CrossRef] [PubMed]
- Stephens, A.F.; Wanigasekara, D.; Pellegrino, V.A.; Burrell, A.J.C.; Marasco, S.F.; Kaye, D.M.; Steinseifer, U.; Gregory, S.D. Comparison of Circulatory Unloading Techniques for Venoarterial Extracorporeal Membrane Oxygenation. ASAIO J. 2021, 67, 623–631. [Google Scholar] [CrossRef] [PubMed]
- Bleilevens, C.; Grottke, O.; Groening, S.; Honickel, M.; Kopp, R.; Singh, S.; Arens, J.; Rossaint, R. Septic Porcine Blood Does Not Further Activate Coagulation during in Vitro Membrane Oxygenation. Eur. J. Cardiothorac. Surg. 2017, 51, 449–456. [Google Scholar] [CrossRef] [PubMed] [Green Version]
- Burda, G.; Trittenwein, H.; Carole, H.; Trittenwein, G. Testing of Extracorporeal Membrane Oxygenation Circuit Related Hemolysis Using Long-Term Stored Packed Red Cells and Fresh Frozen Plasma. Artif. Organs 2004, 28, 496–499. [Google Scholar] [CrossRef] [PubMed]
- Schumer, E.; Höffler, K.; Kuehn, C.; Slaughter, M.; Haverich, A.; Wiegmann, B. In-Vitro Evaluation of Limitations and Possibilities for the Future Use of Intracorporeal Gas Exchangers Placed in the Upper Lobe Position. J. Artif. Organs 2018, 21, 68–75. [Google Scholar] [CrossRef]
- Sun, L.; Kaesler, A.; Fernando, P.; Thompson, A.J.; Toomasian, J.M.; Bartlett, R.H. CO2 Clearance by Membrane Lungs. Perfusion 2018, 33, 249–253. [Google Scholar] [CrossRef]
- Schwärzel, L.S.; Jungmann, A.M.; Schmoll, N.; Seiler, F.; Muellenbach, R.M.; Schenk, J.; Dinh, Q.T.; Bals, R.; Lepper, P.M.; Omlor, A.J. A Mock Circulation Loop to Test Extracorporeal CO2 Elimination Setups. Intensive Care Med. Exp. 2020, 8, 52. [Google Scholar] [CrossRef] [PubMed]
- Schwärzel, L.S.; Jungmann, A.M.; Schmoll, N.; Caspari, S.; Seiler, F.; Muellenbach, R.M.; Bewarder, M.; Dinh, Q.T.; Bals, R.; Lepper, P.M.; et al. Comparison of Circular and Parallel-Plated Membrane Lungs for Extracorporeal Carbon Dioxide Elimination. Membranes 2021, 11, 398. [Google Scholar] [CrossRef] [PubMed]
- de Villiers Hugo, J.; Sharma, A.S.; Ahmed, U.; Weerwind, P.W. Quantification of Carbon Dioxide Removal at Low Sweep Gas and Blood Flows. J. Extra Corpor. Technol. 2017, 49, 257–261. [Google Scholar] [PubMed]
- Combes, A.; Schmidt, M.; Hodgson, C.L.; Fan, E.; Ferguson, N.D.; Fraser, J.F.; Jaber, S.; Pesenti, A.; Ranieri, M.; Rowan, K.; et al. Extracorporeal Life Support for Adults with Acute Respiratory Distress Syndrome. Intensive Care Med. 2020, 46, 2464–2476. [Google Scholar] [CrossRef] [PubMed]
- Park, M.; Costa, E.L.V.; Maciel, A.T.; Silva, D.P.e.; Friedrich, N.; Barbosa, E.V.S.; Hirota, A.S.; Schettino, G.; Azevedo, L.C.P. Determinants of Oxygen and Carbon Dioxide Transfer during Extracorporeal Membrane Oxygenation in an Experimental Model of Multiple Organ Dysfunction Syndrome. PLoS ONE 2013, 8, e54954. [Google Scholar] [CrossRef] [PubMed]
- Madhani, S.P.; May, A.G.; Frankowski, B.J.; Burgreen, G.W.; Federspiel, W.J. Blood Recirculation Enhances Oxygenation Efficiency of Artificial Lungs. ASAIO J. 2019, 66, 565–570. [Google Scholar] [CrossRef] [PubMed]
- Schwärzel, L.S.; Jungmann, A.M.; Schmoll, N.; Caspari, S.; Seiler, F.; Muellenbach, R.M.; Bewarder, M.; Thai Dinh, Q.; Bals, R.; Lepper, P.M.; et al. Preclinical Evaluation of a New ECCO2R Setup. ASAIO J. 2022, in press. [Google Scholar] [CrossRef]


Publisher’s Note: MDPI stays neutral with regard to jurisdictional claims in published maps and institutional affiliations. |
© 2022 by the authors. Licensee MDPI, Basel, Switzerland. This article is an open access article distributed under the terms and conditions of the Creative Commons Attribution (CC BY) license (https://creativecommons.org/licenses/by/4.0/).
Share and Cite
Caspari, S.; Schwärzel, L.S.; Jungmann, A.M.; Schmoll, N.; Seiler, F.; Muellenbach, R.M.; Krawczyk, M.; Dinh, Q.T.; Bals, R.; Lepper, P.M.; et al. A Novel Mock Circuit to Test Full-Flow Extracorporeal Membrane Oxygenation. Membranes 2022, 12, 493. https://doi.org/10.3390/membranes12050493
Caspari S, Schwärzel LS, Jungmann AM, Schmoll N, Seiler F, Muellenbach RM, Krawczyk M, Dinh QT, Bals R, Lepper PM, et al. A Novel Mock Circuit to Test Full-Flow Extracorporeal Membrane Oxygenation. Membranes. 2022; 12(5):493. https://doi.org/10.3390/membranes12050493
Chicago/Turabian StyleCaspari, Stefan, Leonie S. Schwärzel, Anna M. Jungmann, Nicole Schmoll, Frederik Seiler, Ralf M. Muellenbach, Marcin Krawczyk, Quoc Thai Dinh, Robert Bals, Philipp M. Lepper, and et al. 2022. "A Novel Mock Circuit to Test Full-Flow Extracorporeal Membrane Oxygenation" Membranes 12, no. 5: 493. https://doi.org/10.3390/membranes12050493