Article

Studying the Effect of Shortening Carbon Nanotubes via Ball Milling on Cellulose Acetate Nanocomposite Membranes for Desalination Applications

by
Nouran A. Elbadawi
1,
Adham R. Ramadan
1 and
Amal M. K. Esawi
2,*
1
Department of Chemistry, The American University in Cairo, New Cairo 11835, Egypt
2
Department of Mechanical Engineering, The American University in Cairo, New Cairo 11835, Egypt
*
Author to whom correspondence should be addressed.
Membranes 2022, 12(5), 474; https://doi.org/10.3390/membranes12050474
Submission received: 31 March 2022 / Revised: 21 April 2022 / Accepted: 25 April 2022 / Published: 27 April 2022

Abstract

:
Studying the effect of different sizes of multi-walled carbon nanotubes (CNTs) on mixed matrix membranes in nanofiltration applications has not been widely reported in the literature. In this study, two different lengths of functionalized CNTs were used to investigate such effect. First, CNTs were shortened by using high-energy ball milling at 400 RPM, with a ball-to-powder weight ratio (BPR) of 120:1. Characterization of the structure of the CNTs was carried out using TEM, XRD, SEM, BET, and Raman Spectroscopy. Second, 0.001 wt % of unmilled and milled CNTs were incorporated into cellulose acetate nanocomposite membranes, Eli-0 (unmilled), and Eli-400 (milled at 400 RPM) to study their effects on the membranes’ morphology, porosity, hydrophilicity, and performance analysis in terms of permeation and salt retention rates of 5000 ppm Na2SO4. Results showed that shortening CNTs enhanced the membranes’ hydrophilicity and affected macrovoid and micropore formation. Furthermore, shortening CNTs resulted in opening their caps and improved the permeation rates with a slight adverse effect on salt retention.

1. Introduction

The availability of natural freshwater resources is decreasing primarily because of the rapid increase in population. The current population is expected to increase from 7.7 billion persons to more than 10 billion in less than 30 years [1]. An estimated 2.2 billion persons currently live without available clean and safe drinking water, according to UNESCO. Furthermore, it is expected that by the year 2050, more than 5 billion persons will face grave water scarcity, which would require the production of fresh water for drinking and irrigation from non-fresh water sources by desalination [2,3]. To date, the number of desalination plants has been estimated to be over 18,000, producing ~89 million cubic meters per day of fresh water, more than 50% of which is produced in the MENA region [4,5]. A multitude of desalination investigations have been conducted to optimize processes for obtaining cheap and efficient fresh water. Only a few technologies are considered viable enough for the large-scale production of fresh water, with membrane technologies such as Reverse Osmosis (RO), Micro, Ultra, and Nanofiltration taking the lead in the global market [6]. This is followed by thermal technologies, including Multi Stage Flash distillation (MSF) and Multi Effect distillation (MED) [7]. The energy requirements for thermal technologies in water desalination are generally higher than those of membrane technologies. For example, the total electrical energy consumption for MSF distillation is 13.5–25.5 kWh/m3, while that of RO is 5–9 kWh/m3 [8]. The high amount of energy required to separate water molecules from salt ions became a key parameter towards the upscaling of novel technologies on a commercial level [6,7]. The next generation of membrane desalination systems could therefore incorporate advanced nanocomposite membranes, offering simultaneously high permeation rates at the lowest operating pressures possible combined with high salt rejection capabilities.
The structure and properties of nanocomposite membranes depend on different variables such as the types of polymer matrices (e.g., polyamides, cellulose acetate), types of solvents (e.g., dimethylformamide, acetone), and the introduction of different additives, particularly nanofillers (e.g., graphene, nanoclays). Each variable can affect the porosity, surface, and cross section morphology of the membranes, thus creating mixed matrix membranes for different applications [9,10,11,12,13,14]. One of the most widely investigated types of nanofillers involves carbon nanotubes (CNTs), and investigations have aimed at understanding their effects on filtration performance, mechanical stability, and morphology changes. CNTs have been added in different amounts to different types of polymer matrices [15,16] and thin film composites [17,18] for a wide range of applications, including RO desalination [19], forward osmosis desalination [20,21], and contaminant filtration [22,23]. The general effects of CNTs on nanocomposite membranes is the change in morphology, porosity, and macrovoid formation, with potentially new channels available for solvent passage through the CNTs in addition to roughness and hydrophilicity changes. However, not enough studies have been carried out on the effect of different CNT sizes/surface areas on the morphology and performance of polymeric membranes in filtration applications. Usually, studies report that high aspect ratios of CNTs lead to superior properties in water treatment [10,24,25], however, very few have discussed how this works. Manawi et al. [26] fabricated polysulphone–CNT membranes with two different CNT aspect ratios (100–500 vs. 4000–20,000) in order to study the effect of the change of aspect ratio on porosity, flux, and mechanical properties. The small CNTs were functionalized by acid treatment, while the large ones were not. Pore sizes (analyzed with scanning electron microscopy (SEM)) and surface roughness (analyzed with atomic force microscopy) showed that the addition of both types of CNTs increased the porosity and roughness of the membranes as compared to the blank membranes, with the larger CNTs having a more pronounced effect. Furthermore, in a test for flux rates, the larger CNTs gave a better performance. Eslami et al. [27] studied the effect of the surface area of closed cap CNTs on NaCl and MgSO4 salt rejection in a gravity-driven permeation setup. Three different CNT shapes were grown by chemical vapor deposition on a Ni-coated porous Si support, giving different density and coverage values per surface area. The study showed that as the effective surface area of CNTs increased, salt rejection increased. The proposed reason was that the salt ions would get attracted to the surface of the CNTs instead of draining out with the permeate. As for the permeation rate, it was found that CNTs with a smaller surface area gave higher rates, but no explanation was offered for this. Trivedi et al. [28] studied the effect of different densities of vertically aligned CNTs in a poly-dimethylsiloxane composite on NaCl solution permeation and rejection rates. Having open caps, the CNTs acted as channels for water permeation, with the highest density exhibiting the highest permeation rate. The study also found that salt rejection rates were independent of the densities, and that they depended mainly on the charges on the surface of the polymeric matrix. Other investigations have studied the effect of CNTs’ aspect ratio on different composite materials for mechanical applications. These studies typically incorporated from two to three ratios of CNTs, and the membranes were prepared by melt mixing or curing. The results were focused on the effects on the electrical, mechanical, rheology, and thermal properties of the composites [29,30]. The common observation was that the addition of CNTs changed the properties of the composites, however, each matrix behaved differently with different preparation conditions and CNT types [29,30,31,32]. Detailed experimental analyses on the role of different sizes of CNTs on polymer-based nanocomposite membranes have not been widely conducted. In this respect, the current study focuses on the effect of varying CNT sizes on membrane morphology, porosity, and hydrophilicity, as well as on membrane performance in terms of permeation and salt rejection rates in nanofiltration applications.

2. Materials and Methods

Elicarb multi-walled carbon nanotubes with an average diameter of 10–12 nm and length > 1 µm (Thomas Swan, Consett, UK) were functionalized, shortened, and used as nanofillers. Cellulose Acetate (CA), with an average molecular weight of 50,000 Da and 39.7 wt % acetyl content (Aldrich, St. Louis, MO, USA), was used as the polymer matrix. Acetone (Merck KGaA, Darmstadt, Germany, purity ≥ 99.5%) was used as solvent, and deionized water as non-solvent. Sodium sulfate (Sigma Aldrich, St. Louis, MO, USA, purity ≥ 99%) was used for salt retention determinations.

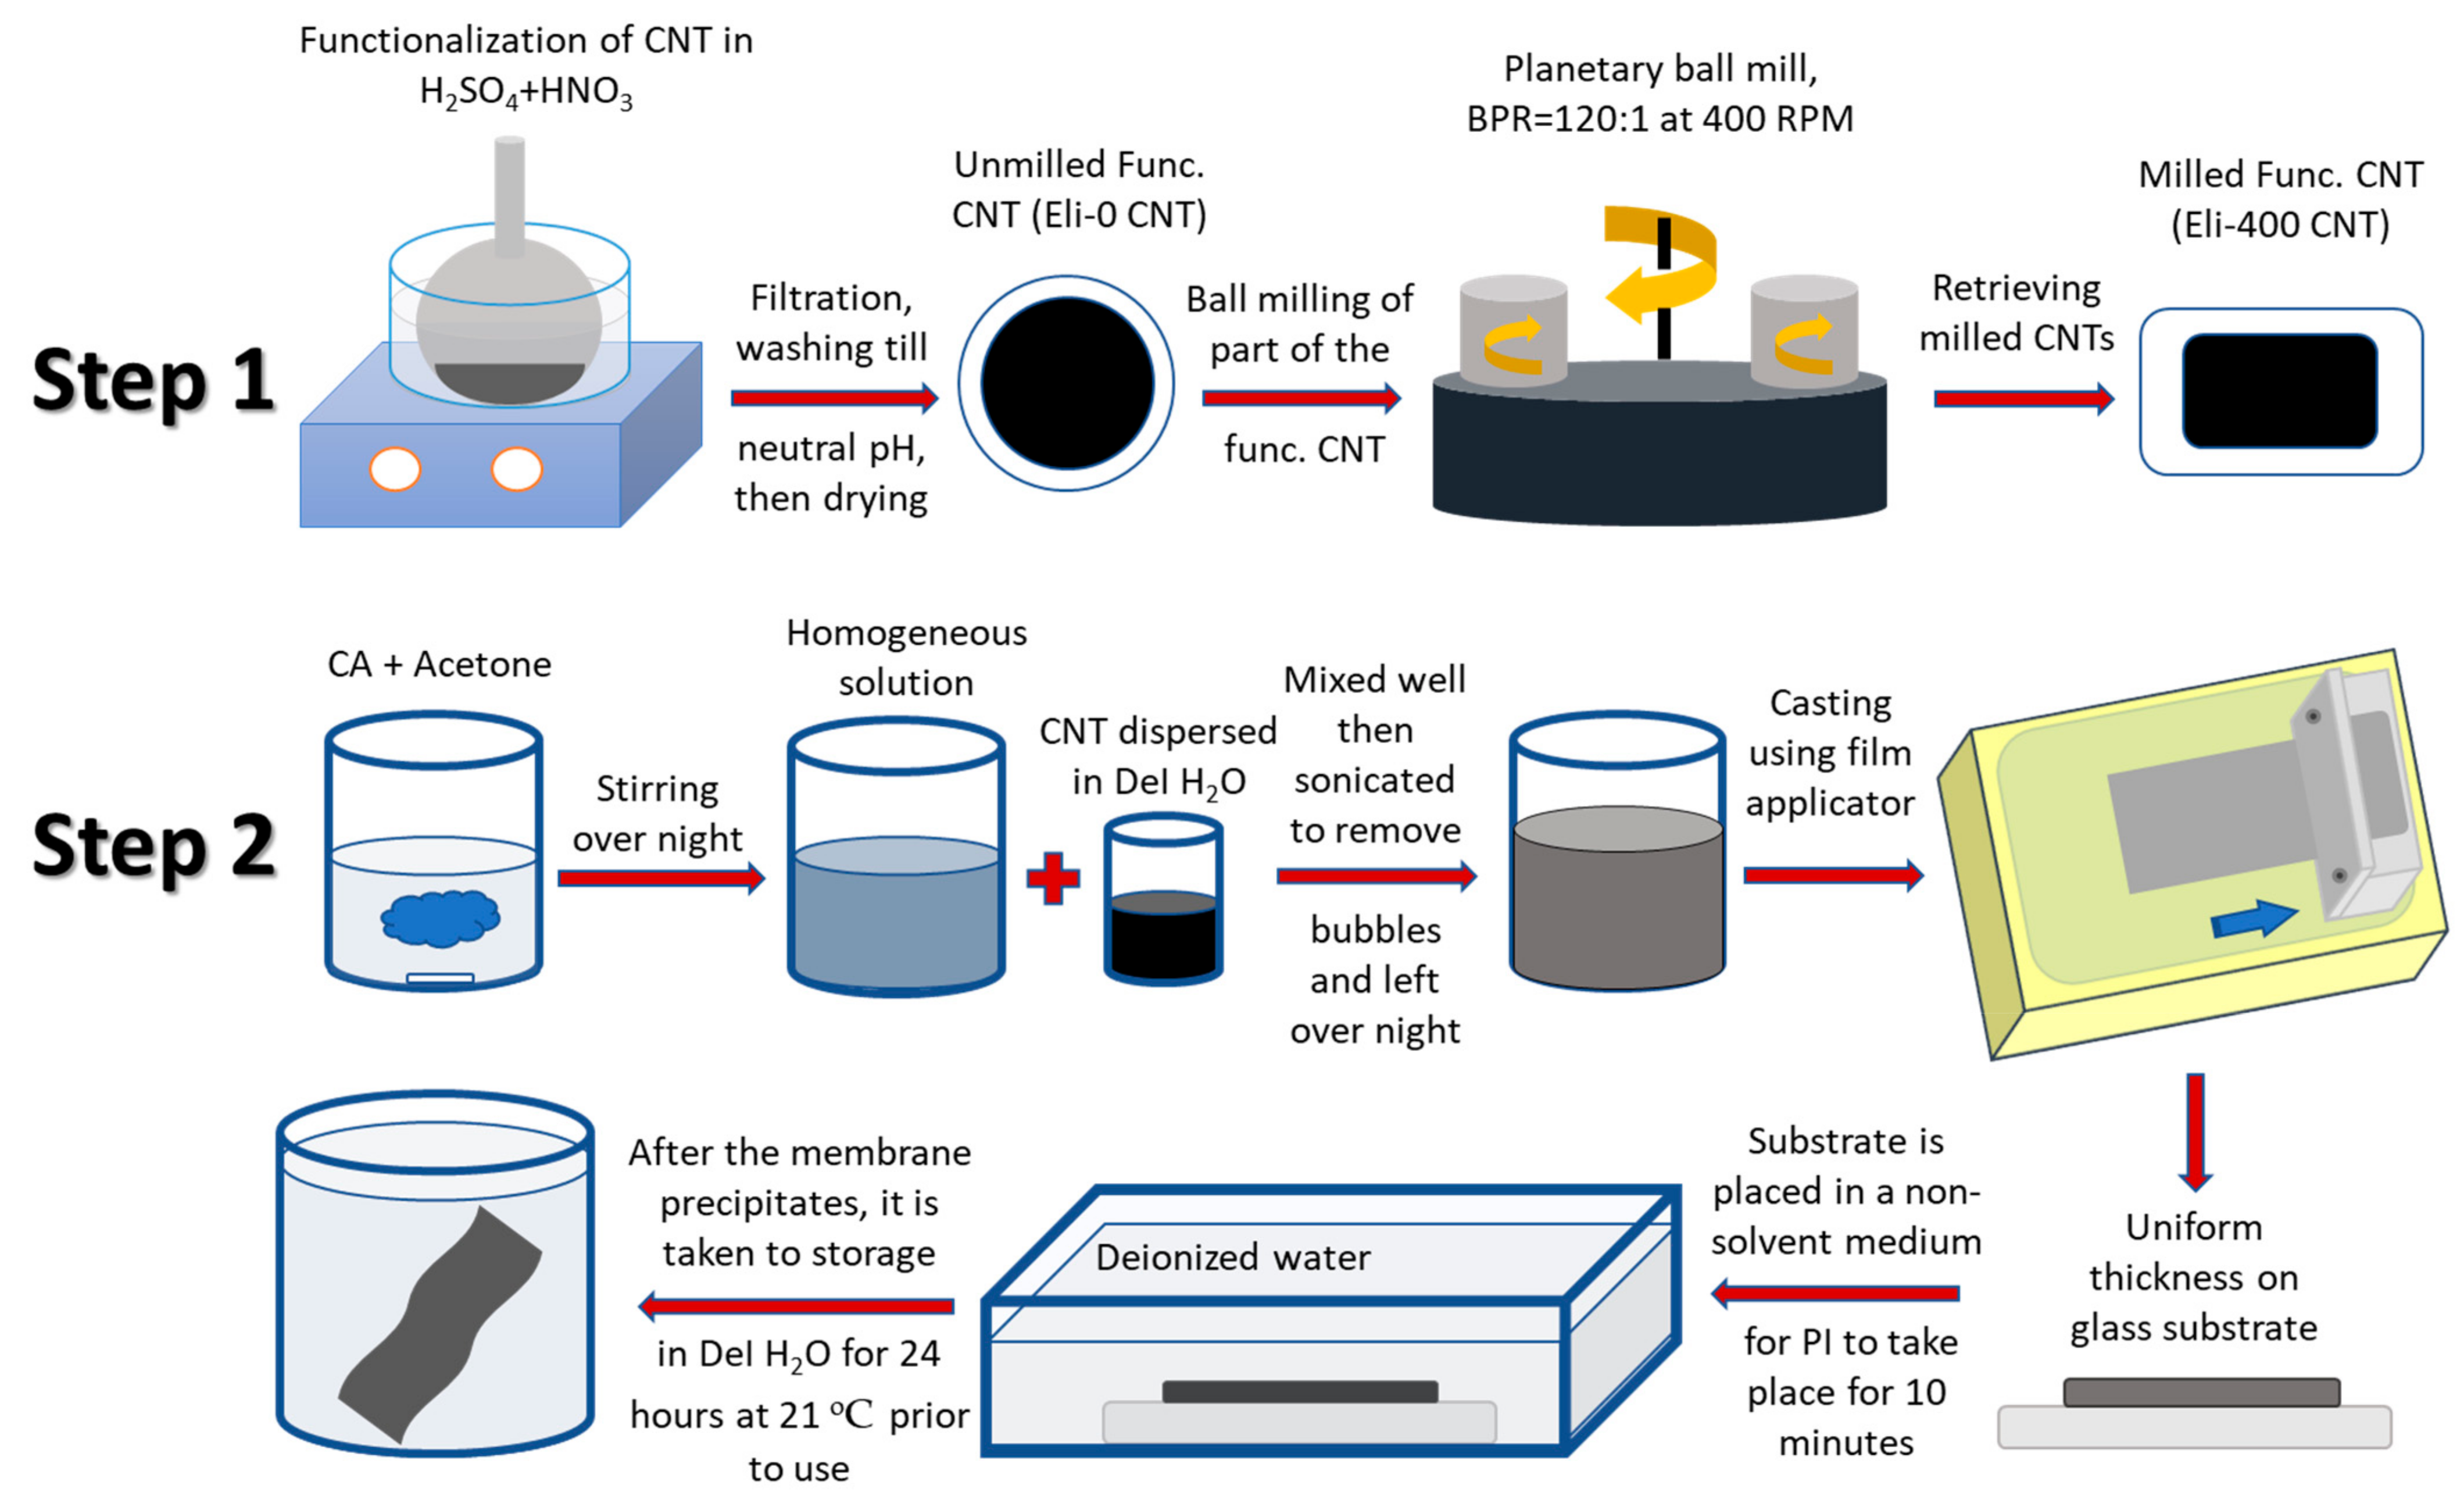
2.1. CNT Functionalization, Shortening, and Characterization

Prior to shortening, the CNTs were functionalized as follows: 3 g of CNTs were placed in a round flask, in 100 mL of a mixture of concentrated acids (H2SO4:HNO3 = 3:1). The mixture was sonicated in an ultrasonic bath at less than 15 °C for 30 min, and then the mixture was refluxed at 90 °C raised to 130 °C over a period of 100 min. The solution was later cooled down to room temperature at 21 °C, and then the CNTs were filtered off using Whatman PTFE filter membrane (0.25 µm) and washed to neutral pH [33]. The success of the functionalization was verified using Nicolet 380 FTIR with the KBr pellet method, where peaks indicating the presence of carboxylic groups were detected.
For shortening the CNTs, a planetary ball mill (PM400, Retsch, Haan, Germany) was used. Milling was conducted using 6 mm diameter stainless steel balls. The ball-to-powder ratio (BPR) was 120:1, and the process was carried out in 125 mL stainless steel jars [34]. Total process time was 1.5 h, with increments of 15 min on and 10 min off to avoid the overheating of the samples; milling speed was set to 400 RPM to effectively produce short-length CNTs.
Characterization of the CNTs was conducted using TEM (JEM-2100, JEOL, Tokyo, Japan) and SEM (Leo Supra 55, Zeiss, Oberkochen, Germany). Sample solutions were prepared in the following manner. About 0.0001 g of CNTs were weighed and put in 50 mL isopropanol. The samples were then sonicated for 15 min at less than 10 °C. For the TEM analysis, the copper grid was suspended in the middle section of the suspension solutions to minimize the amount of agglomerates attached to the grid. As for the SEM, single drops of about 0.1 mL from the middle section of the solution were placed on copper substrates and dried at 50 °C for 5 min. This facilitated the imaging of individual nanotubes. ImageJ software was used to determine the length distributions of the CNT samples. Statistical analysis was carried out for 200 individual nanotubes to check for outliers and length distribution [35]. X-ray diffraction (XRD) was carried out using a D8 Bruker x-ray powder diffractometer at 40 kV and 30 mA using CuKα (λ = 0.1542 nm). BET surface areas were characterized using the N2 adsorption method at 77 K (ASAP 2020, Micromeritics, Norcross, GA, USA), while Raman spectroscopy (Enwave Optronics, Irvine, CA, USA) was used at 785 nm to analyze the change in the bonding properties of the nanotubes. Finally, the Boehm acid base back-titration, the procedure for which is detailed elsewhere [36], was used to evaluate the carboxylic groups found on the nanotube surface using Na2CO3 as base and HCl as acid.

2.2. Membrane Preparation and Characterization

Nanocomposite membranes using CA as a polymer matrix and CNTs as nanofillers were fabricated using wet chemistry. The composition of the cast solution was 15% CA, 0.001% CNTs, and 19% deionized water (DeI water). Acetone was the solvent. Membranes were cast to have a final thickness of around 97 ± 3 µm, and phase inversion (PI) was used to produce the membranes. All samples were prepared in triplicates [37]. Figure 1 shows a schematic diagram of the preparation procedure.
Characterization was conducted as follows: SEM was used to evaluate the morphology of the membranes, along with their final thickness. FTIR using the KBr method was used to identify the type of interaction between the CNTs and the cellulose acetate polymer matrix. Porosity analysis using pore size distribution and BET surface areas was performed using N2 adsorption at 77 K with an ASAP 2020-Micromeretics apparatus. Hydrophilicity analysis was carried out using the sensile drop method to measure the contact angle (Krüss GmbH, Hamburg, Germany) between a drop of distilled water and the surface of a dry, uniformly positioned membrane, and an average of three measurements were taken.

2.3. Separation Analysis

Permeation tests were carried out at 21 °C room temperature, for the samples using a 5000 ppm Na2SO4 salt solution, in a dead-end cell (HP4750 stirred cell, Sterlitech, Auburn, WA, USA) with an active surface area of 14.6 cm2. This salt was selected because it gives higher salt retention rates in comparison to NaCl and MgSO4 [17,38]. The membranes were first subjected to high pressure at 26 bars for 30 min prior to testing, using deionized water to eliminate the compression effect on the samples. The pressure was then reduced to 15 bars, and the permeation rate was evaluated using Equation (1).
J = V A . t . P
where J (in L/m2h·bar) is the permeation rate, V (in L) is the permeate volume, A (in m2) is the active area of the membrane in which separation takes place, t (in h) is the time it takes for the permeate to produce the volume V, and P (in bar) is the applied pressure. Salt retention was evaluated using the conductivity meter (Jenway, Staffordshire, UK) and calibration curve methods. The concentration of the permeate was calculated in ppm, and then using Equation (2), the retention percentage was calculated:
R = 100 × 1 C p C f
where R (%) is the salt retention percentage, Cp (in ppm) is the salt concentration of the permeate, Cf (in ppm) is the salt concentration in the feedwater. All measurements were performed in triplicates for each membrane type.

3. Results

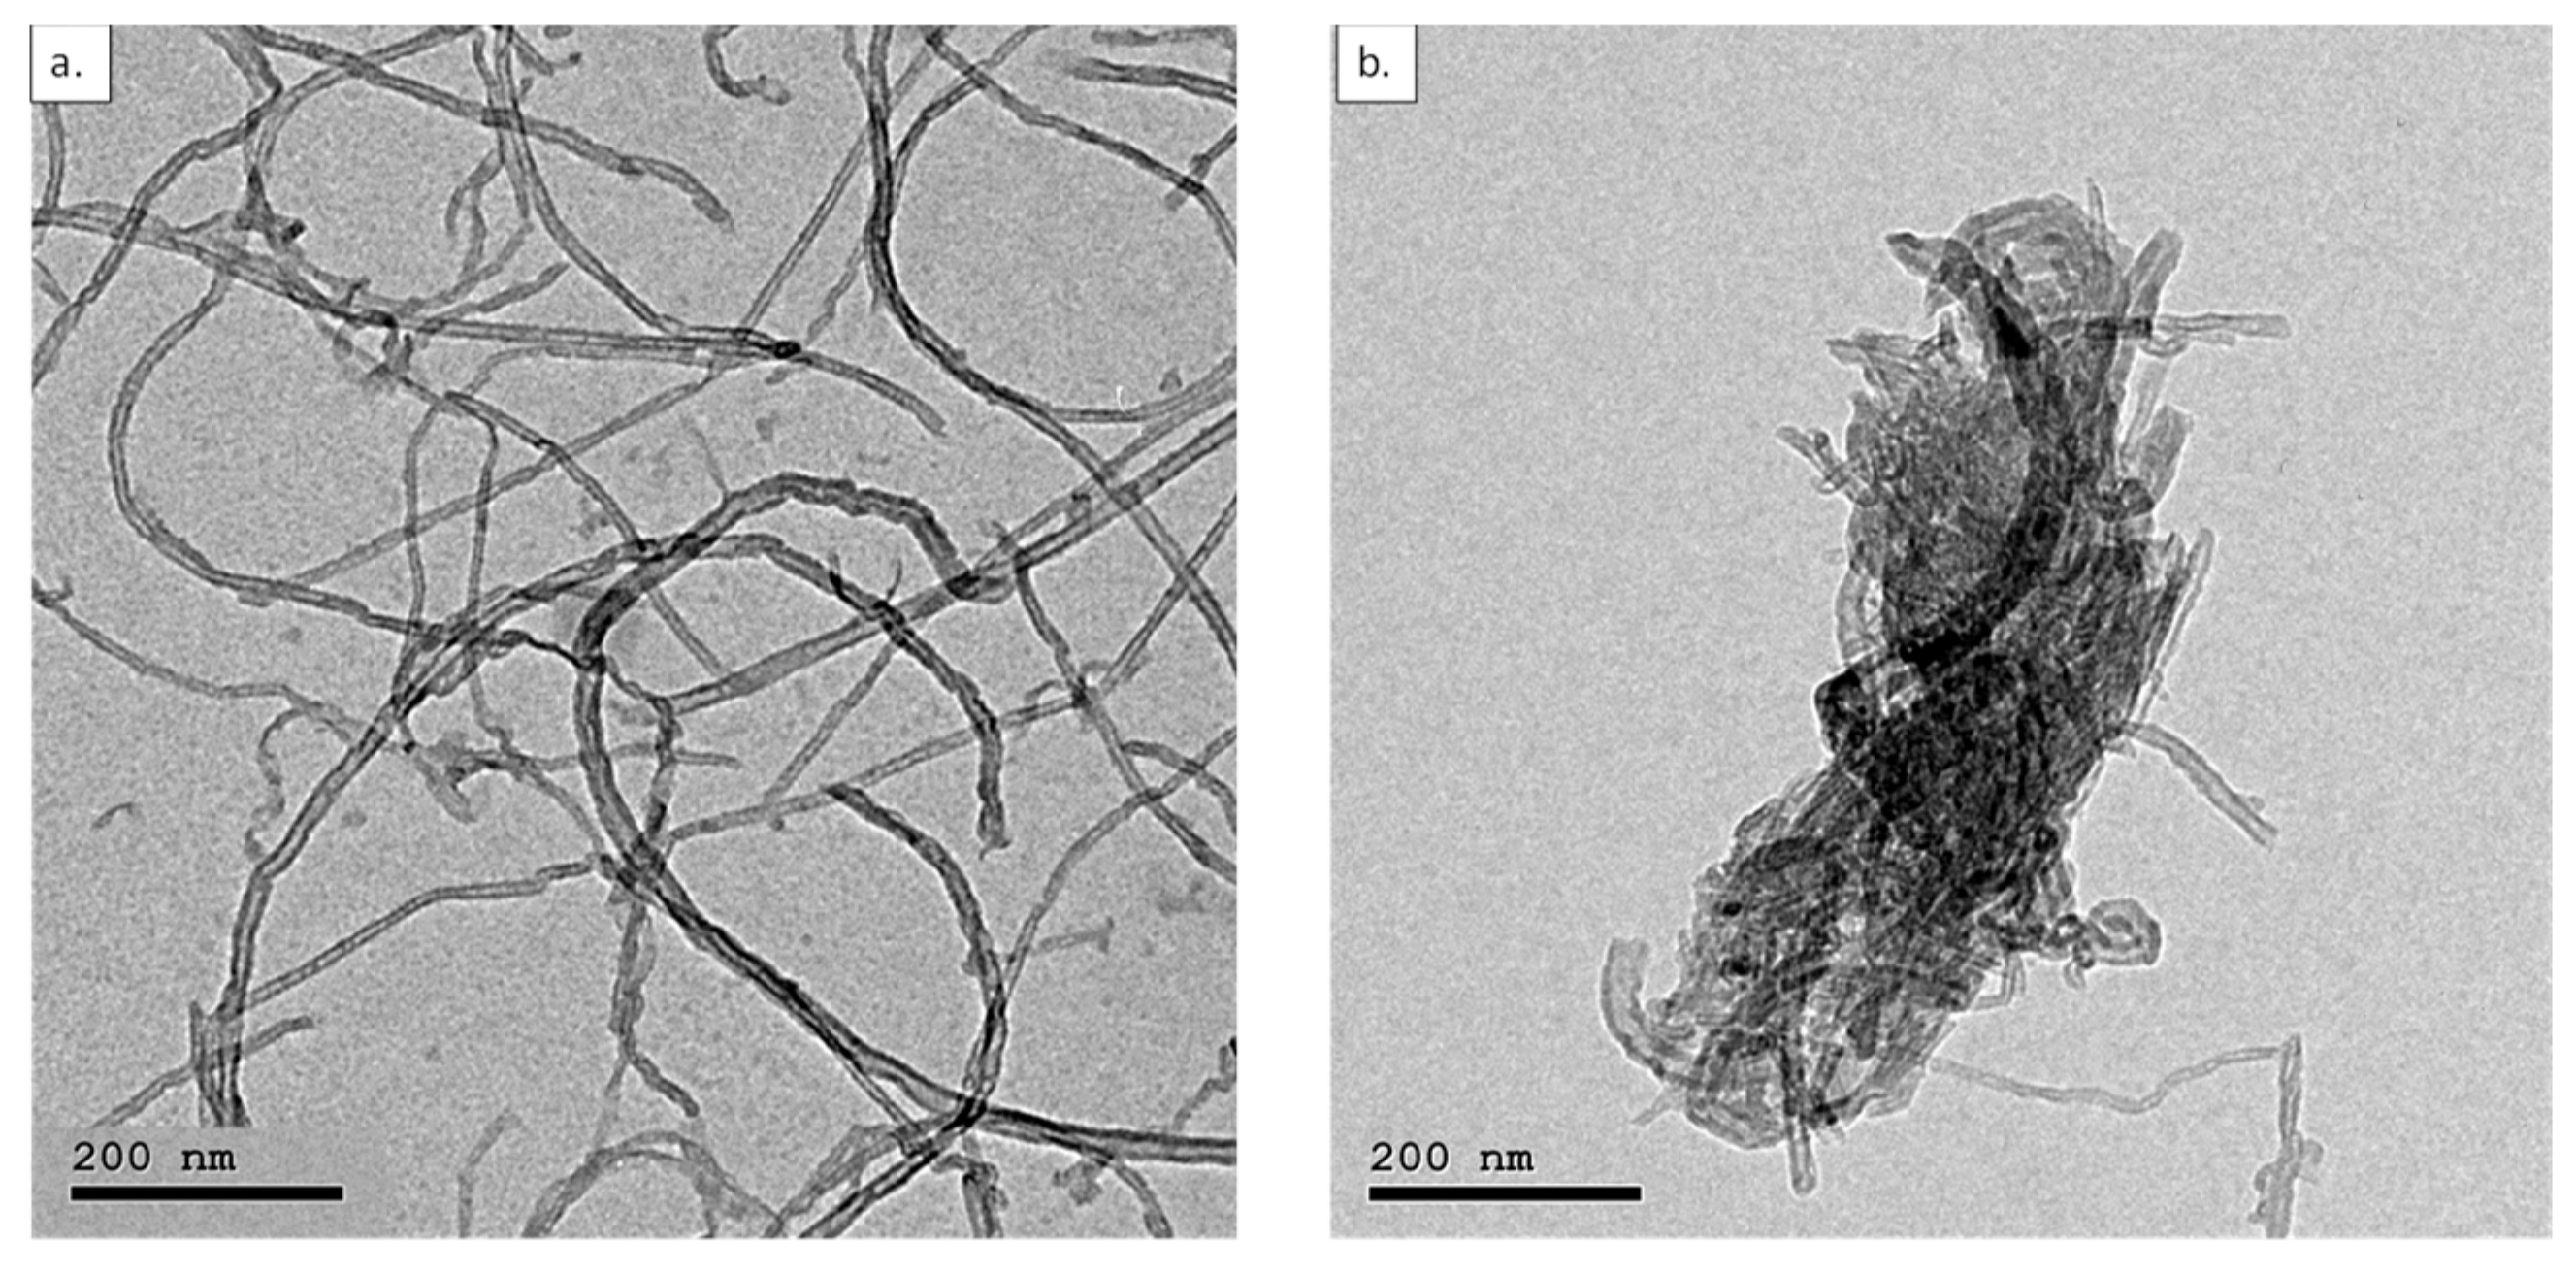
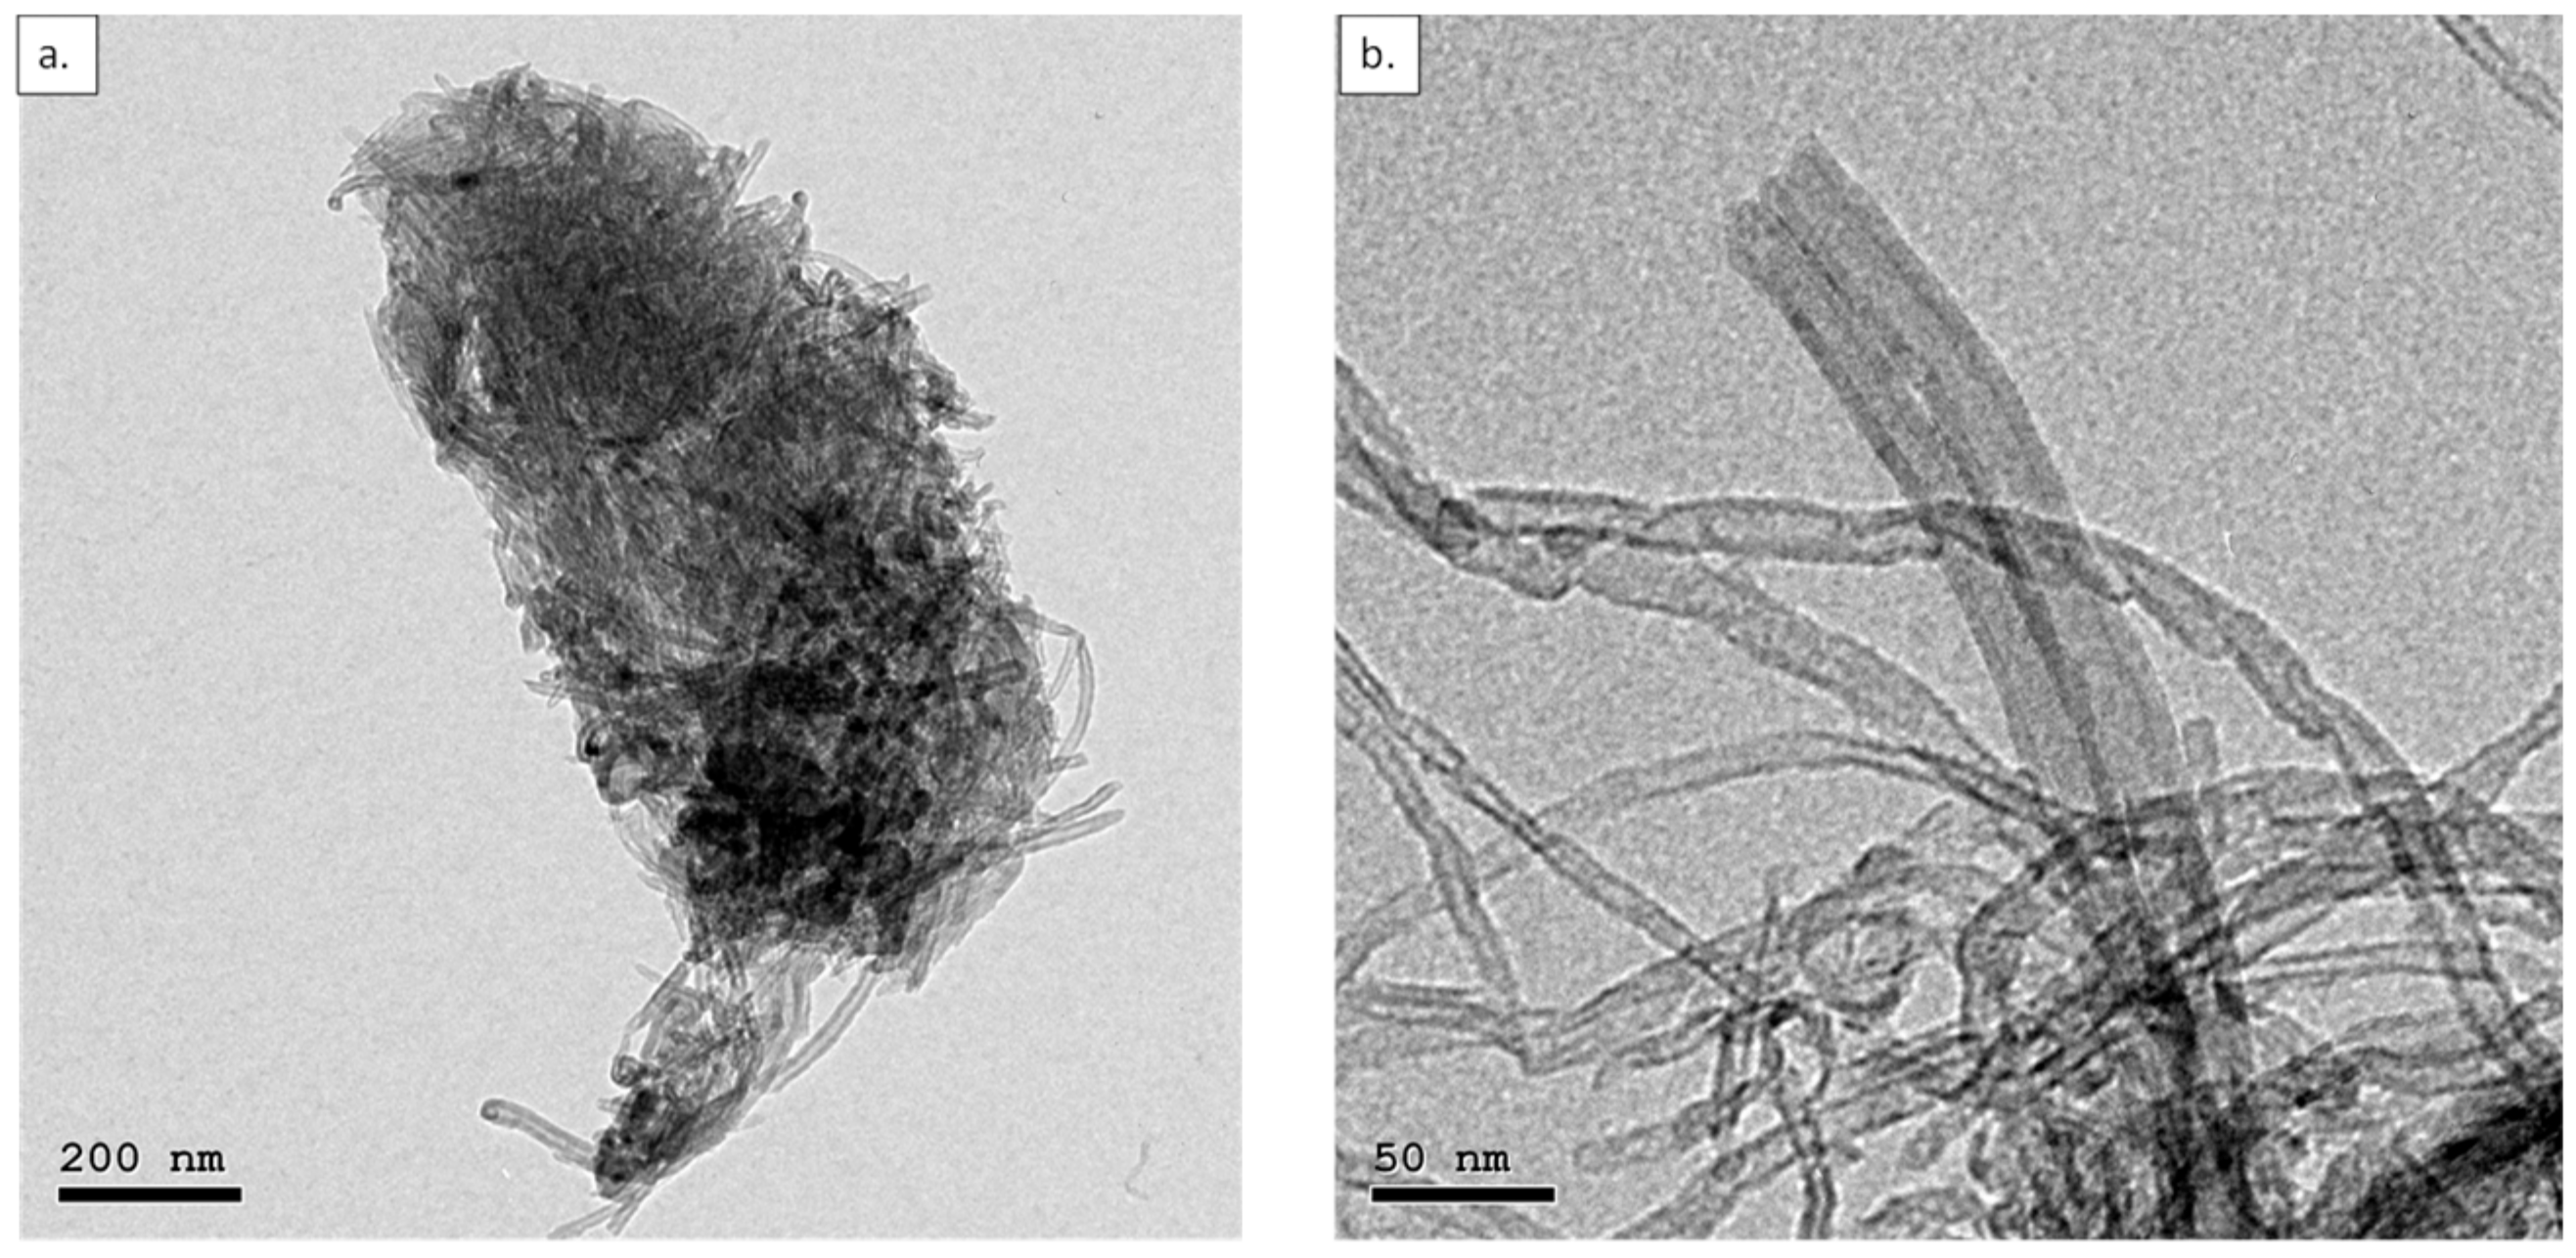
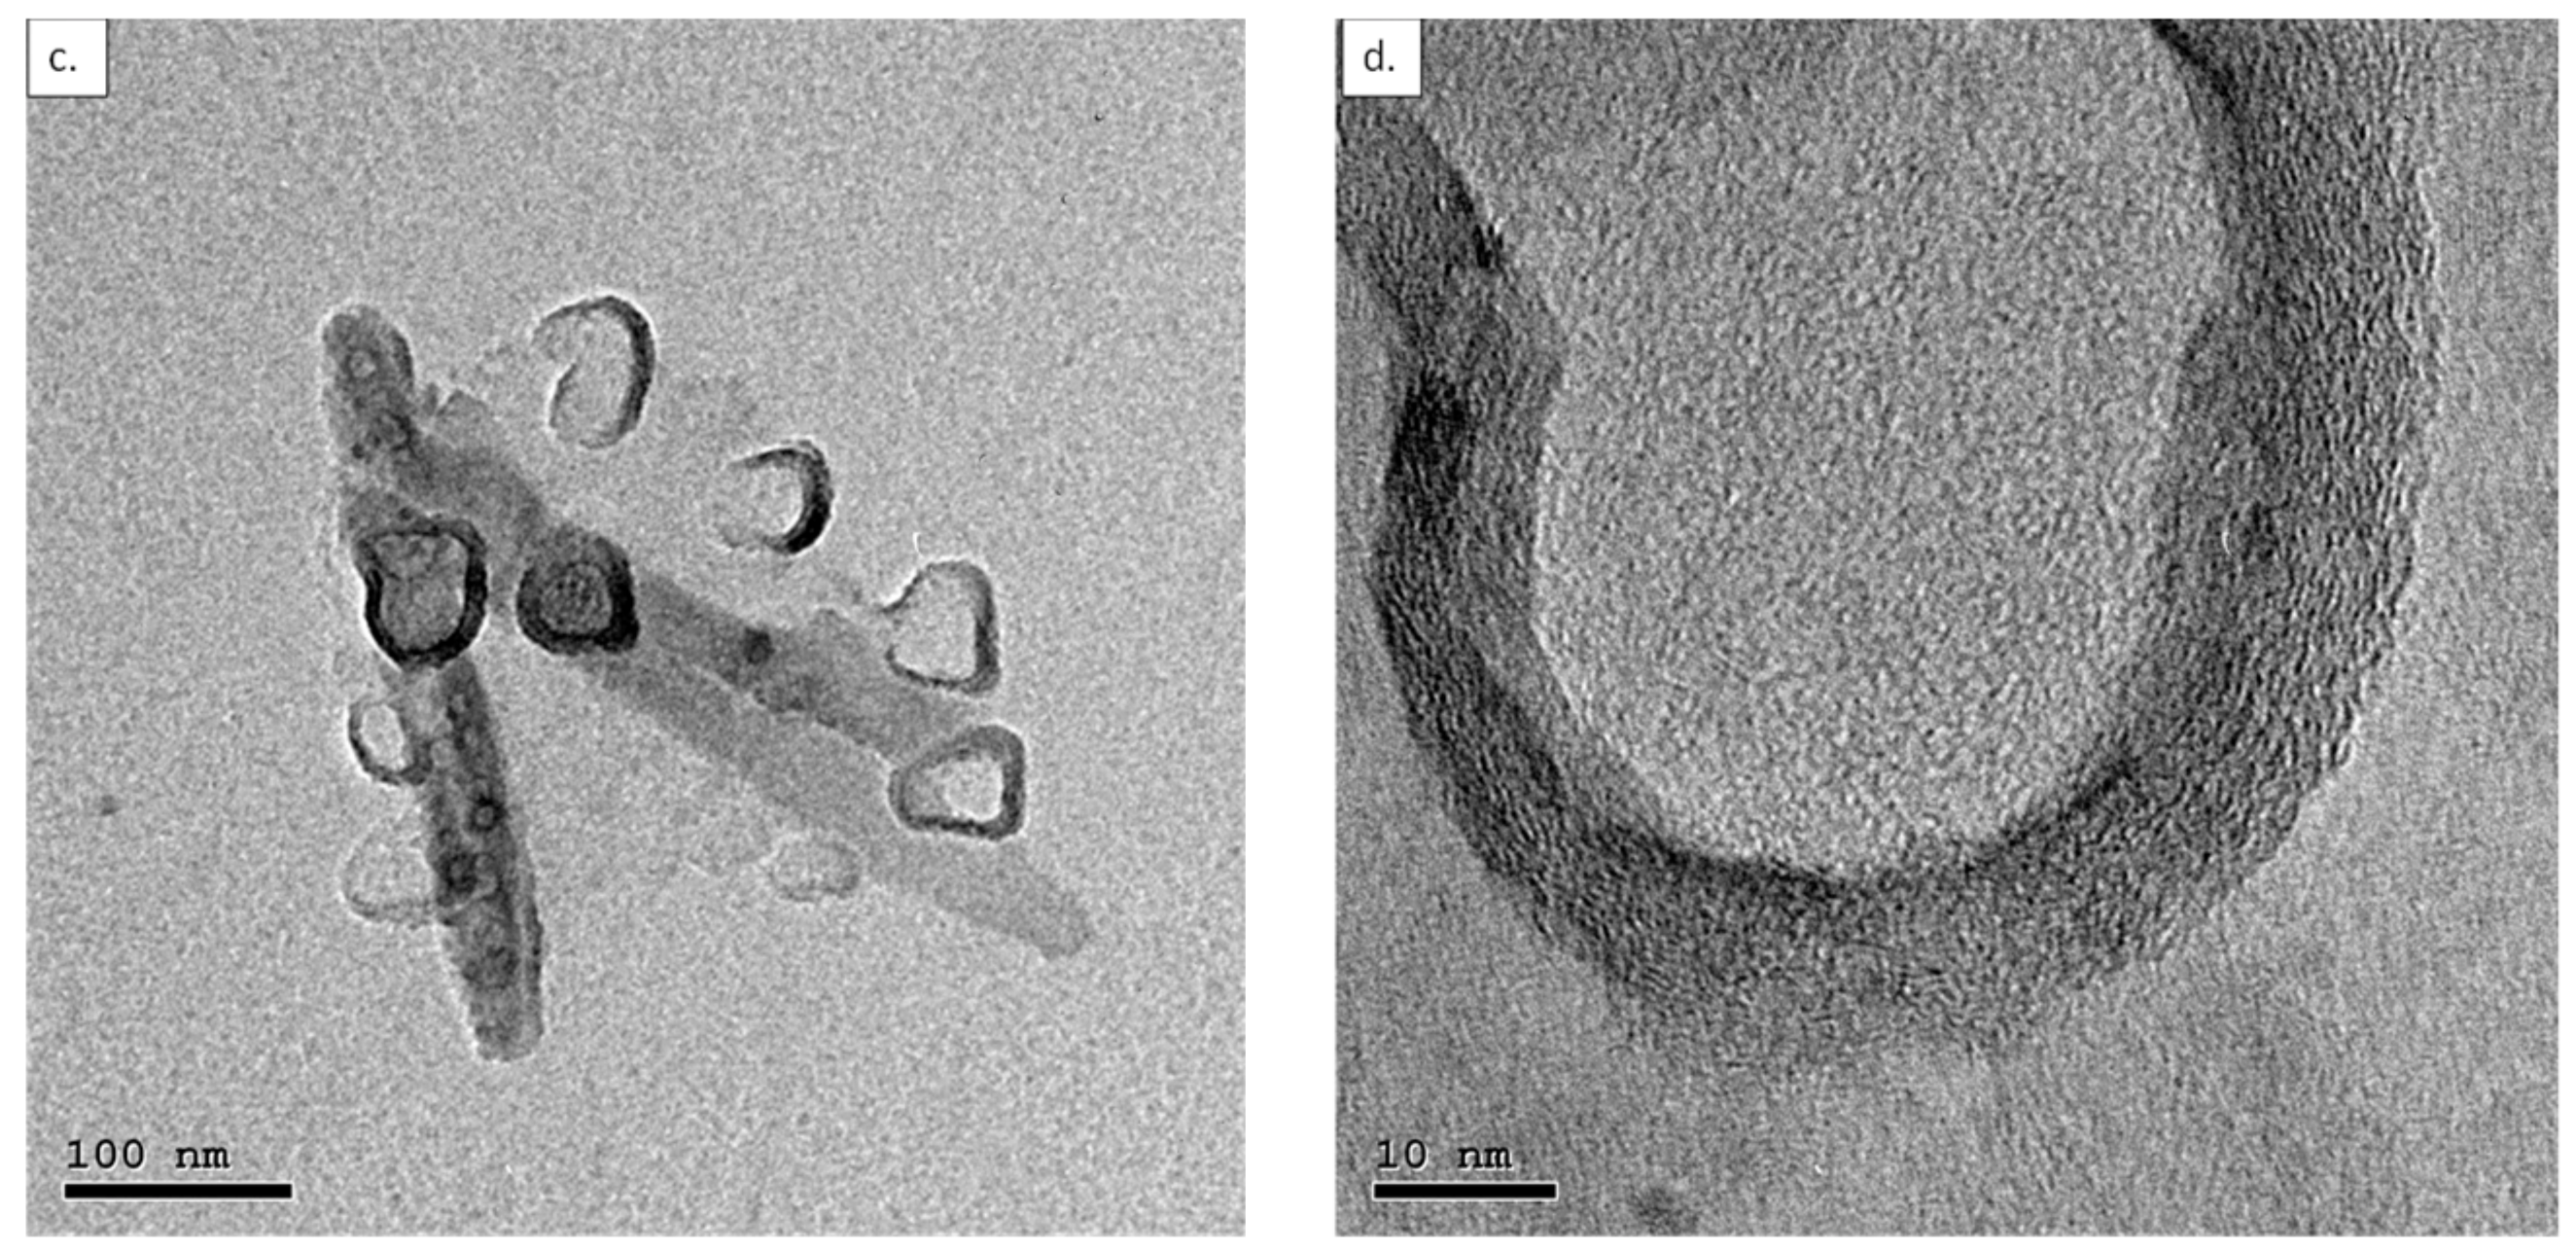
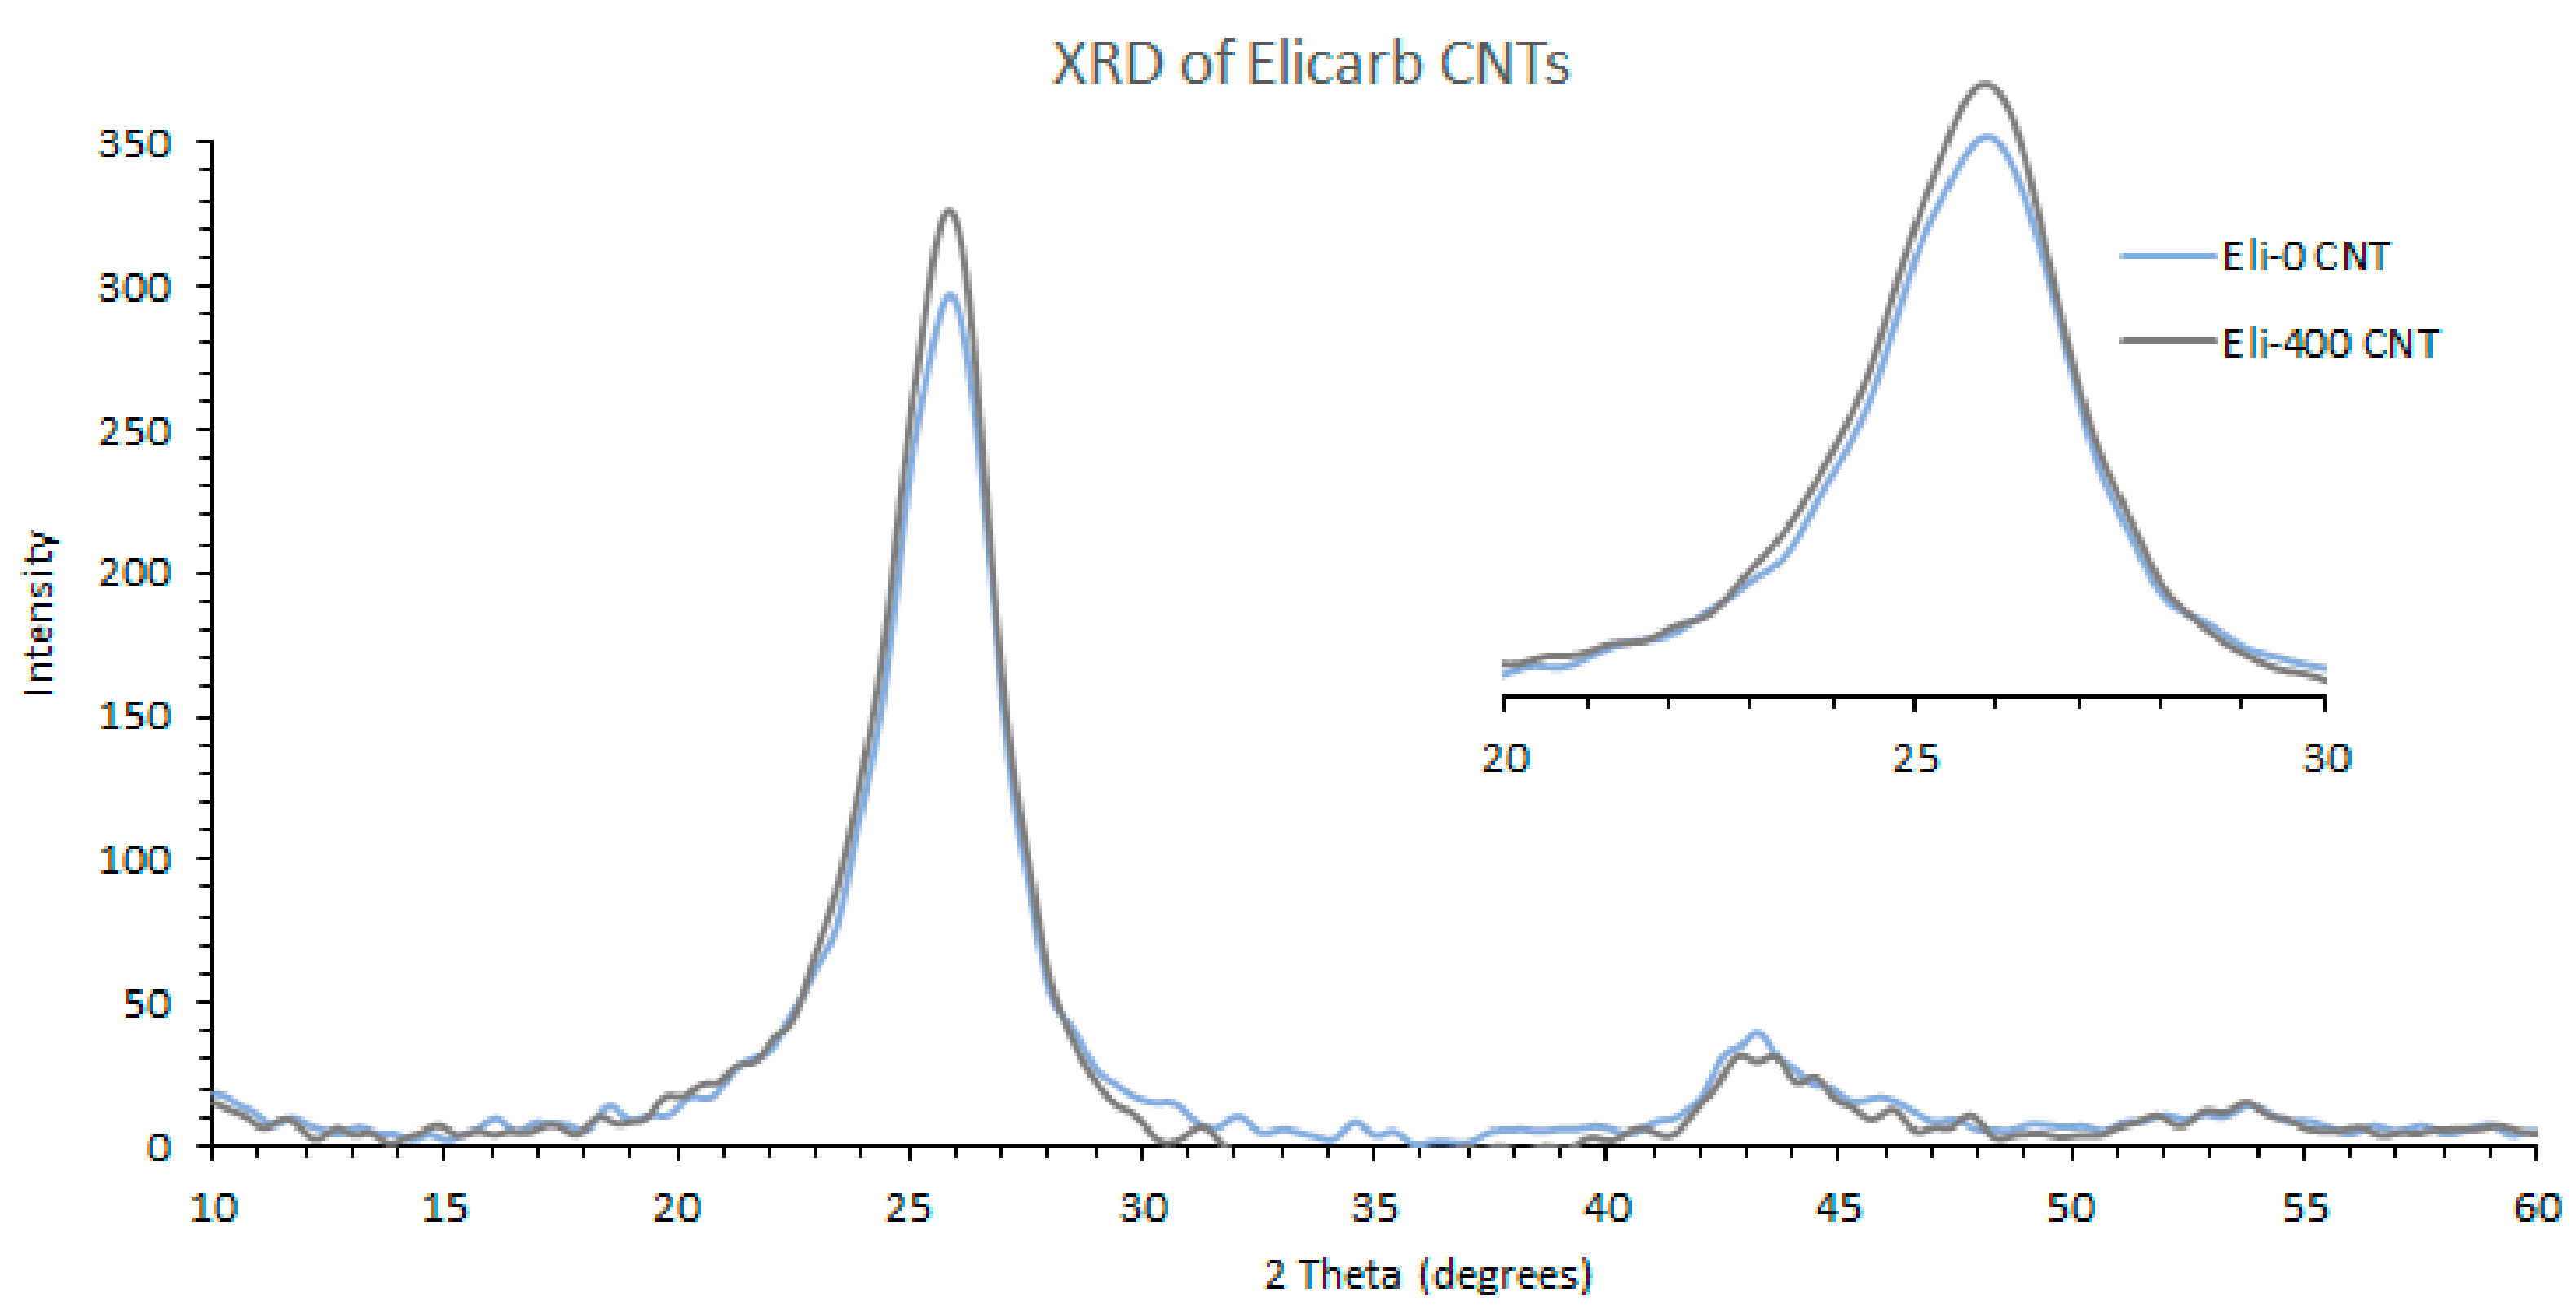
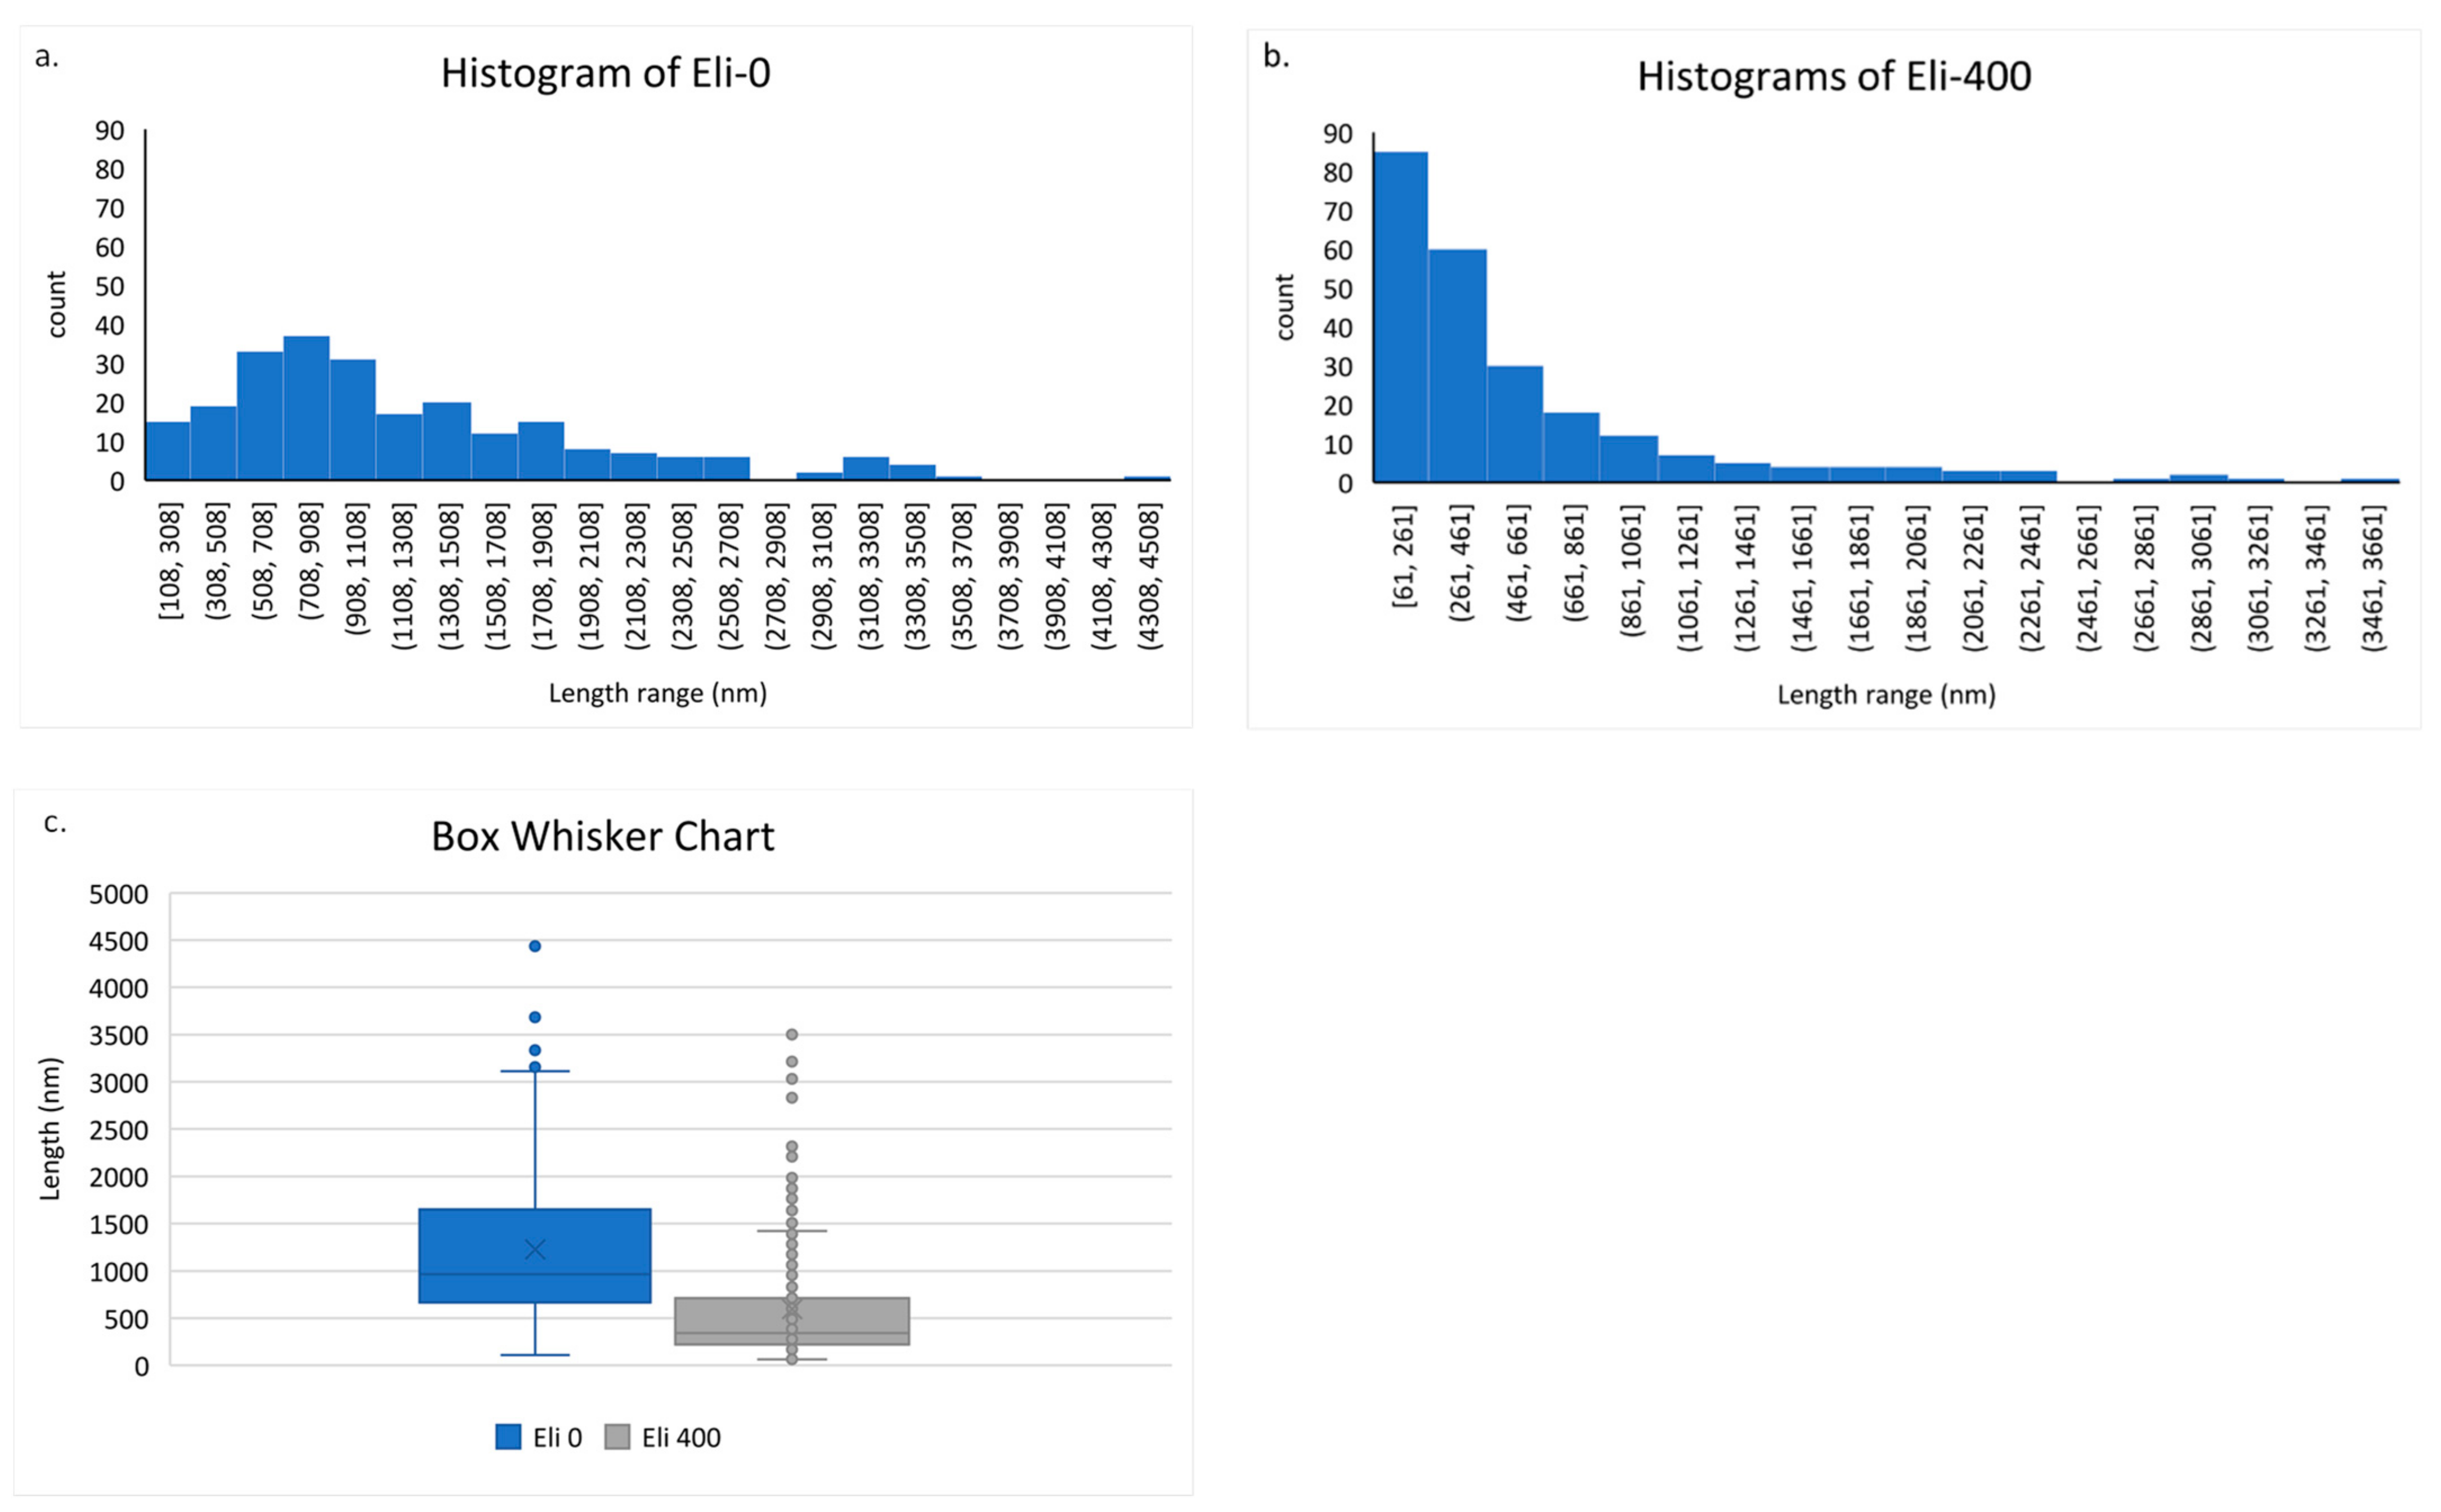
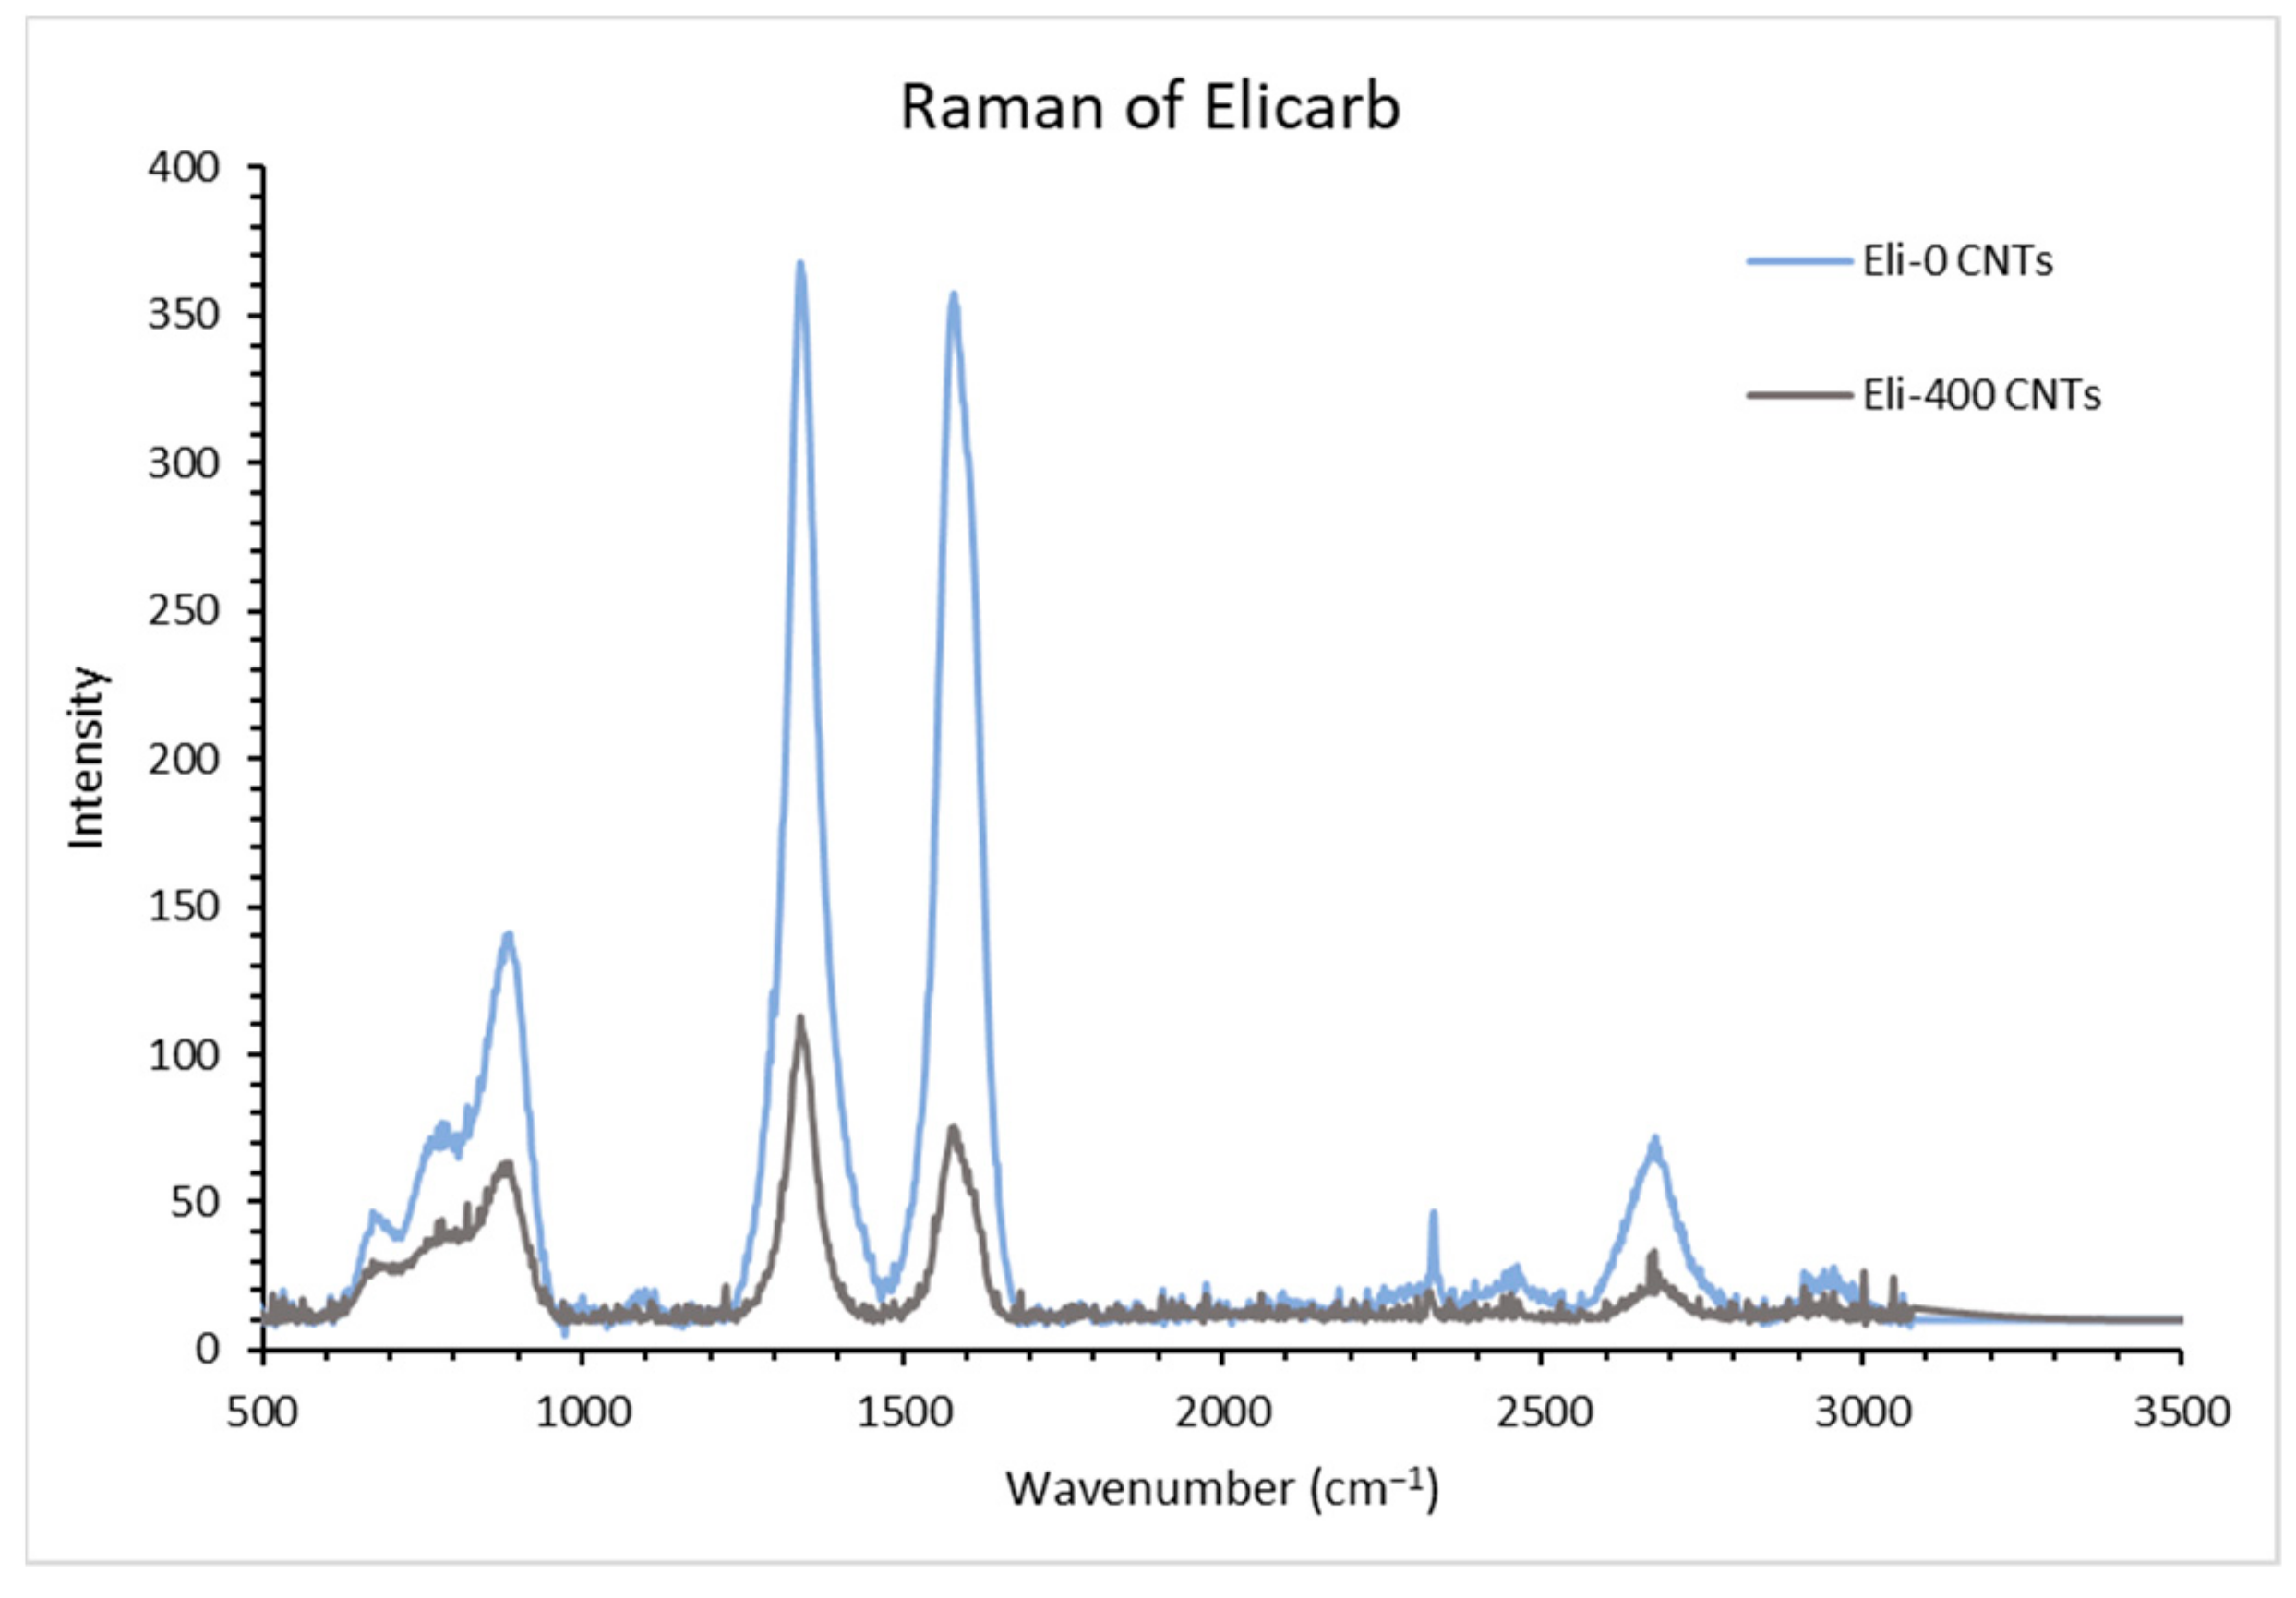
3.1. Characterization of Shortened CNTs

TEM images of CNTs, Figure 2, show the functionalized unmilled Elicarb CNTs (Eli-0) as well as the same CNTs after ball milling at 400 RPM for 1.5 h (Eli-400).
TEM images of Eli-0 and Eli-400 clearly show how ball milling was able to shorten and open the caps of the CNTs. Imaging Eli-400 was challenging because the shortened/damaged CNTs tended to cluster into small bulks. Upon further investigation, it was observed that in addition to cutting the nanotubes into shorter lengths, ball milling caused the partial damage of the CNTs, transforming them into graphene-like sheets, as shown in Figure 3.
Figure 3a shows a cluster of shortened CNTs. Figure 3b is a representation of how ball milling managed to open some of the caps of the CNTs. Figure 3c,d show the damaging effect of the high-speed 400 RPM ball milling on the CNTs, where Figure 3d is a zoomed view of the multi-walled graphene-like sheets present in the circular conformation shown in Figure 3c.
To give a better understanding of the effect of ball milling on the structure of the CNTs, results of the XRD analysis of Elicarb CNTs before and after shortening are displayed in Figure 4.
The three main peaks of CNTs are shown in Figure 4. The first peak at 26° corresponds to the (002) inter-planar spacing of 0.34 nm between the graphene sheets of the multi-wall Elicarb CNTs, while the second and third peaks at 43° and 54° correspond to the (100) and the (400) planes, with d spacings equal to 0.21 and 0.17 nm, respectively [39]. Figure 4 also has a zoomed view of the (002) peak to show the effect of ball milling on the structure of the nanotubes, where the peak became only slightly broadened. The XRD analysis thus indicates that the majority of the CNTs maintained their tubular structure, which agrees with reports in the literature [40].
Length measurements from the SEM images were carried out using ImageJ software and were tabulated. The histogram results and the Box Whisker chart are shown in Figure 5.
Figure 5 gives a clear idea about the effect of using ball milling in shortening CNTs. Figure 5a shows a wide distribution of lengths of unmilled Elicarb, while Figure 5b shows the narrowing of the range of length distribution and a shift to lower values. Figure 5c supports the histogram analysis of the narrowing down of the length distribution due to ball milling.
Statistical analysis using quartile calculations on Excel was performed to give an estimate of the lengths’ population distribution, identify the outliers, and the mean values. Table 1 shows the size distribution.
According to Table 1, 75% of the total nanotubes’ population lengths decreased by an amount of ~56% for Eli-400, while their means decreased by ~61%. As for the BET SA characterization technique, the results show that the surface area of the nanotubes increased after ball milling, indicating more surface exposure due to the shortening and the opening of the caps of the nanotubes.
Raman spectroscopy was used to evaluate the amount of damage that took place on the surface of the CNTs due to the milling process. Important bands to focus on include the G (graphite) band (~1585 cm−1), commonly found in any carbon-based material with sp2 bonding due to the in-plane stretching mode, and the D (defect) band (~1350 cm−1), found when the sp2 bonding in the hexagonal structure exhibits any defects. Figure 6 shows the Raman spectra of the milled and unmilled Elicarb CNTs [41].
Based on the Raman spectra of the milled and unmilled Elicarb CNTs in Figure 6, it is clear that the band intensities decreased due to the damage that took place in the structure of the graphene walls. An interesting feature of the curves was found at about ~880 cm−1. This is suggested to be due to an armchair chirality conformation, associated with semiconductor type nanotubes [42]. The ratio of the intensity of the D and G bands (ID/IG) is usually used as a further indication and verification of the amount of damage of the graphene structure. In Table 2, the recorded values are presented.
As shown in Table 2, the ratio increased as more damage took place because the intensity of the D bands increases with the introduction of more defects, while the intensity of the G band decreases due to the presence of a less ordered structure [40,43]. The Raman results are in agreement with the TEM results.
An additional characterization technique using Boehm back-titration was performed to evaluate the carboxylic groups found on the surface of the CNTs. Titration performed for Eli-0 and Eli-400 gave approximately the same amount of ~0.2 mmol/g for the carboxylic groups. This indicates that ball milling did not affect the amount of acidic sites on the nanotubes.

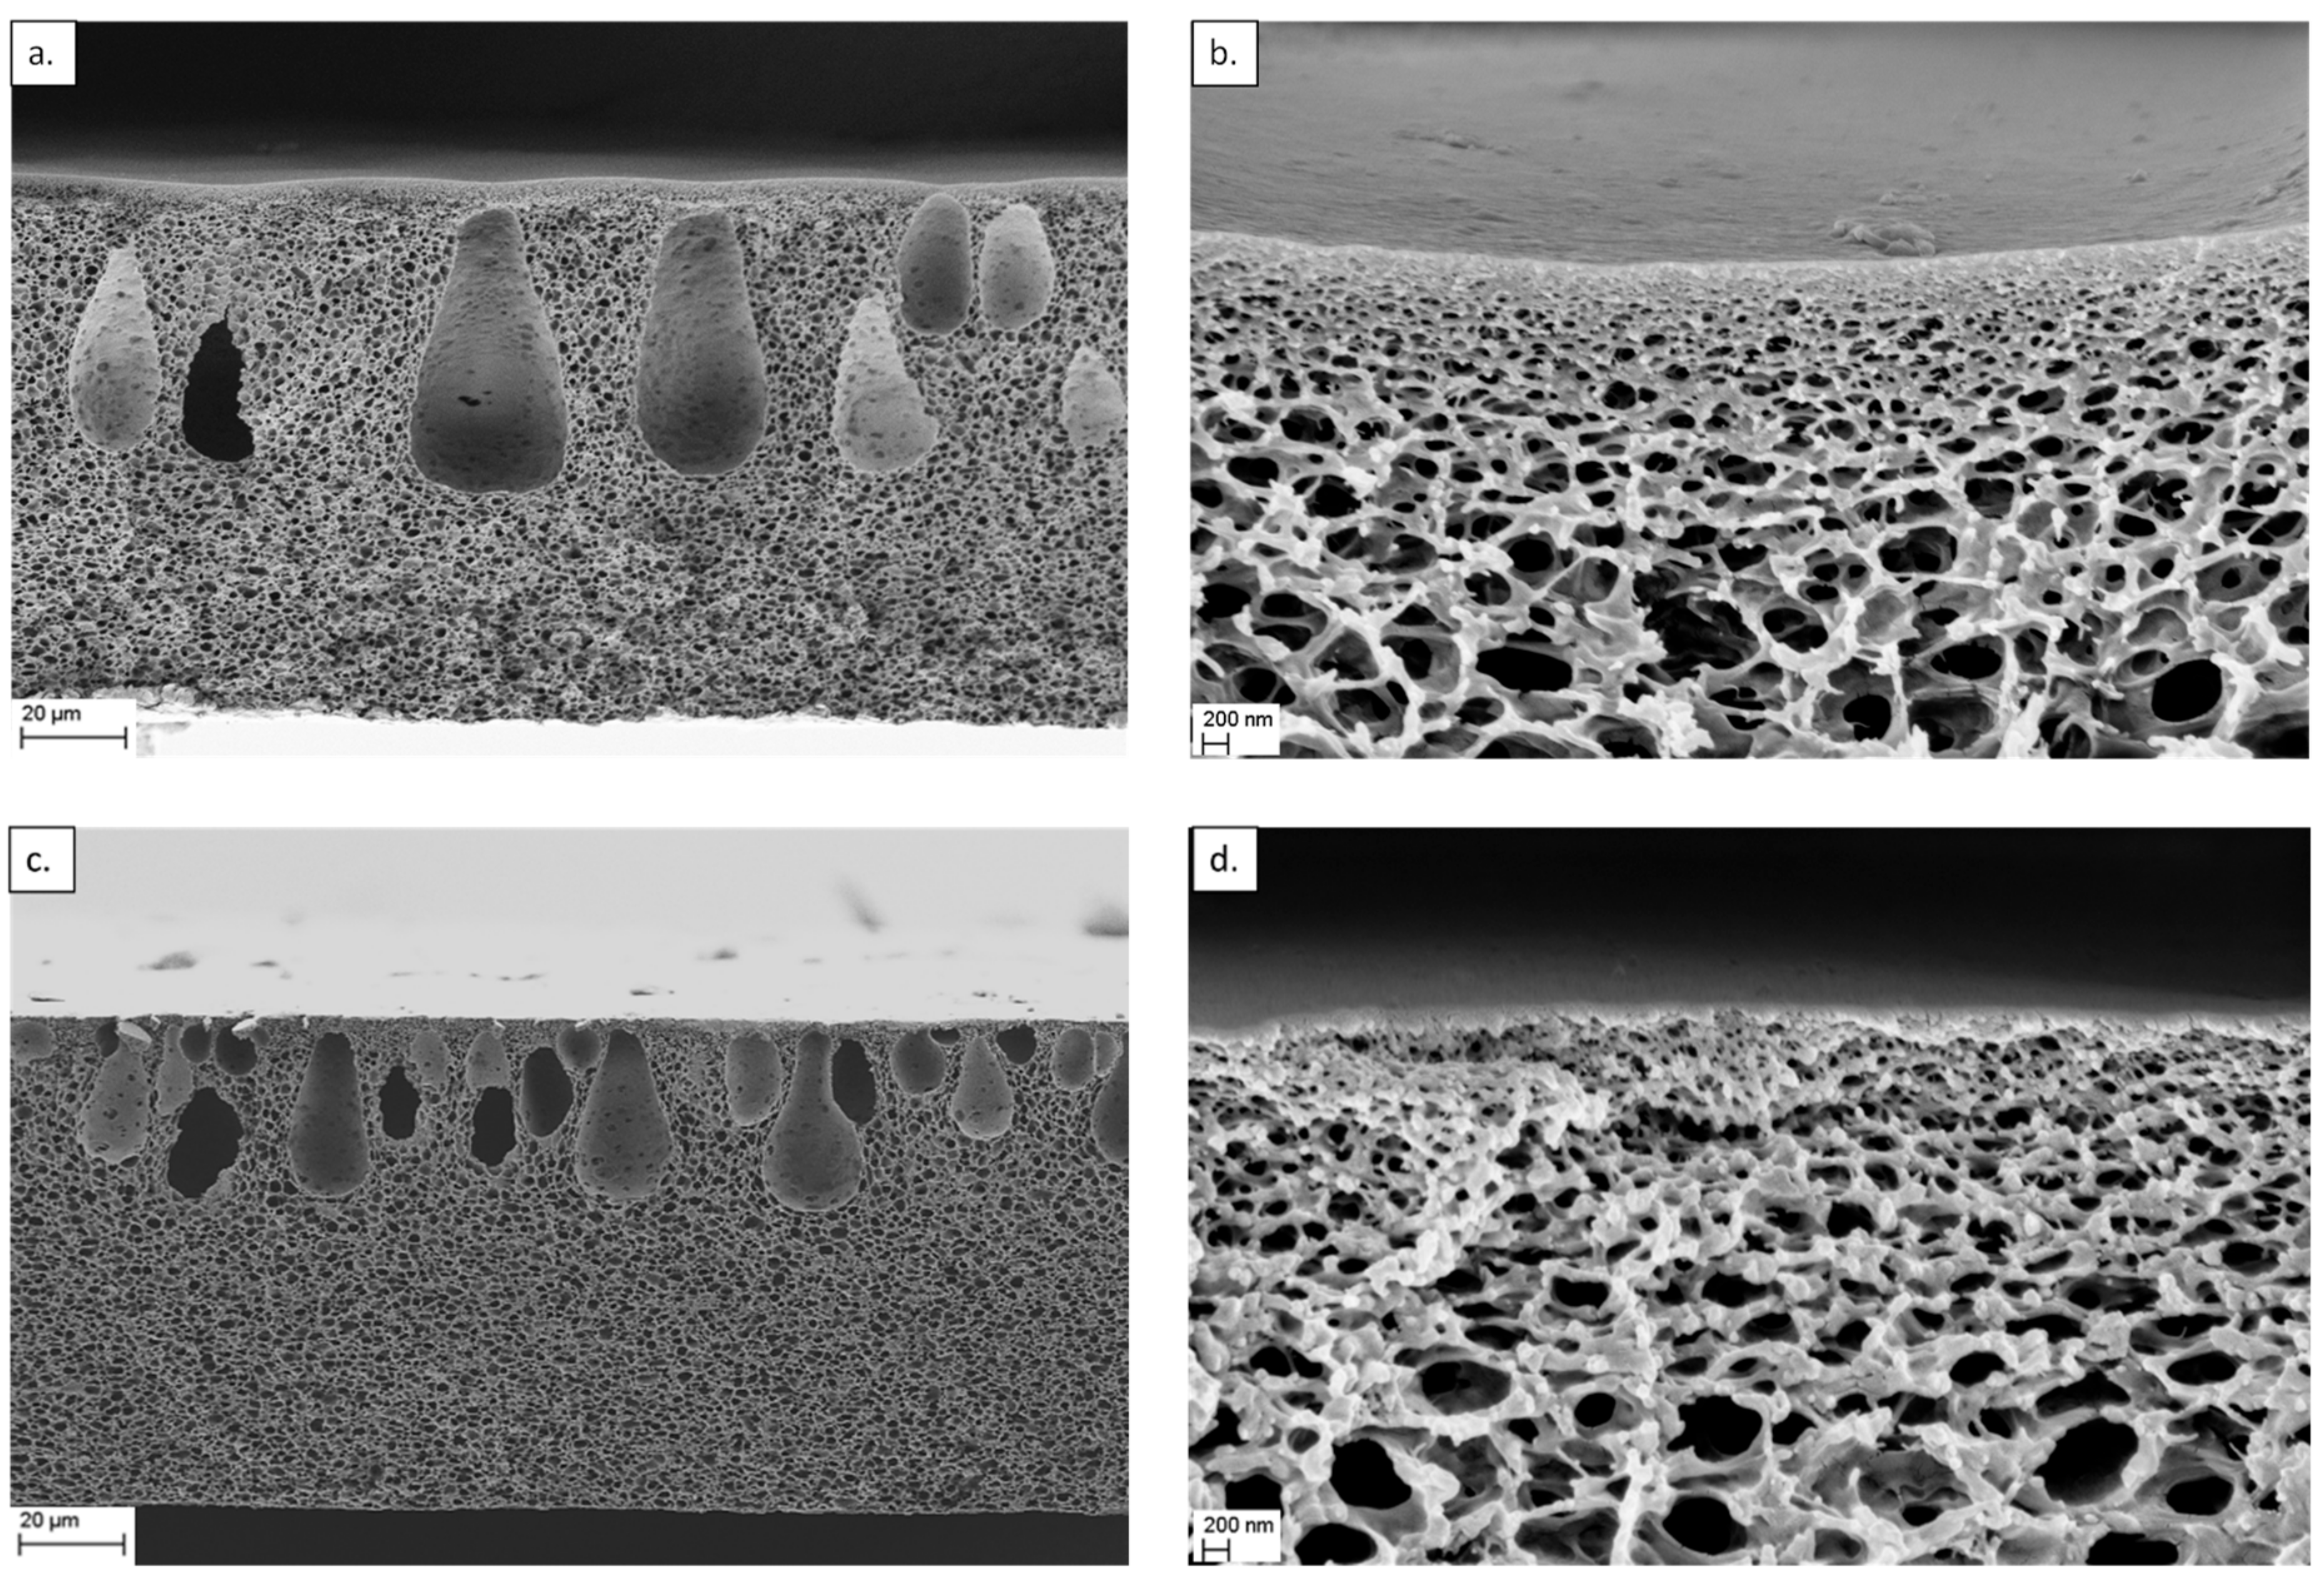
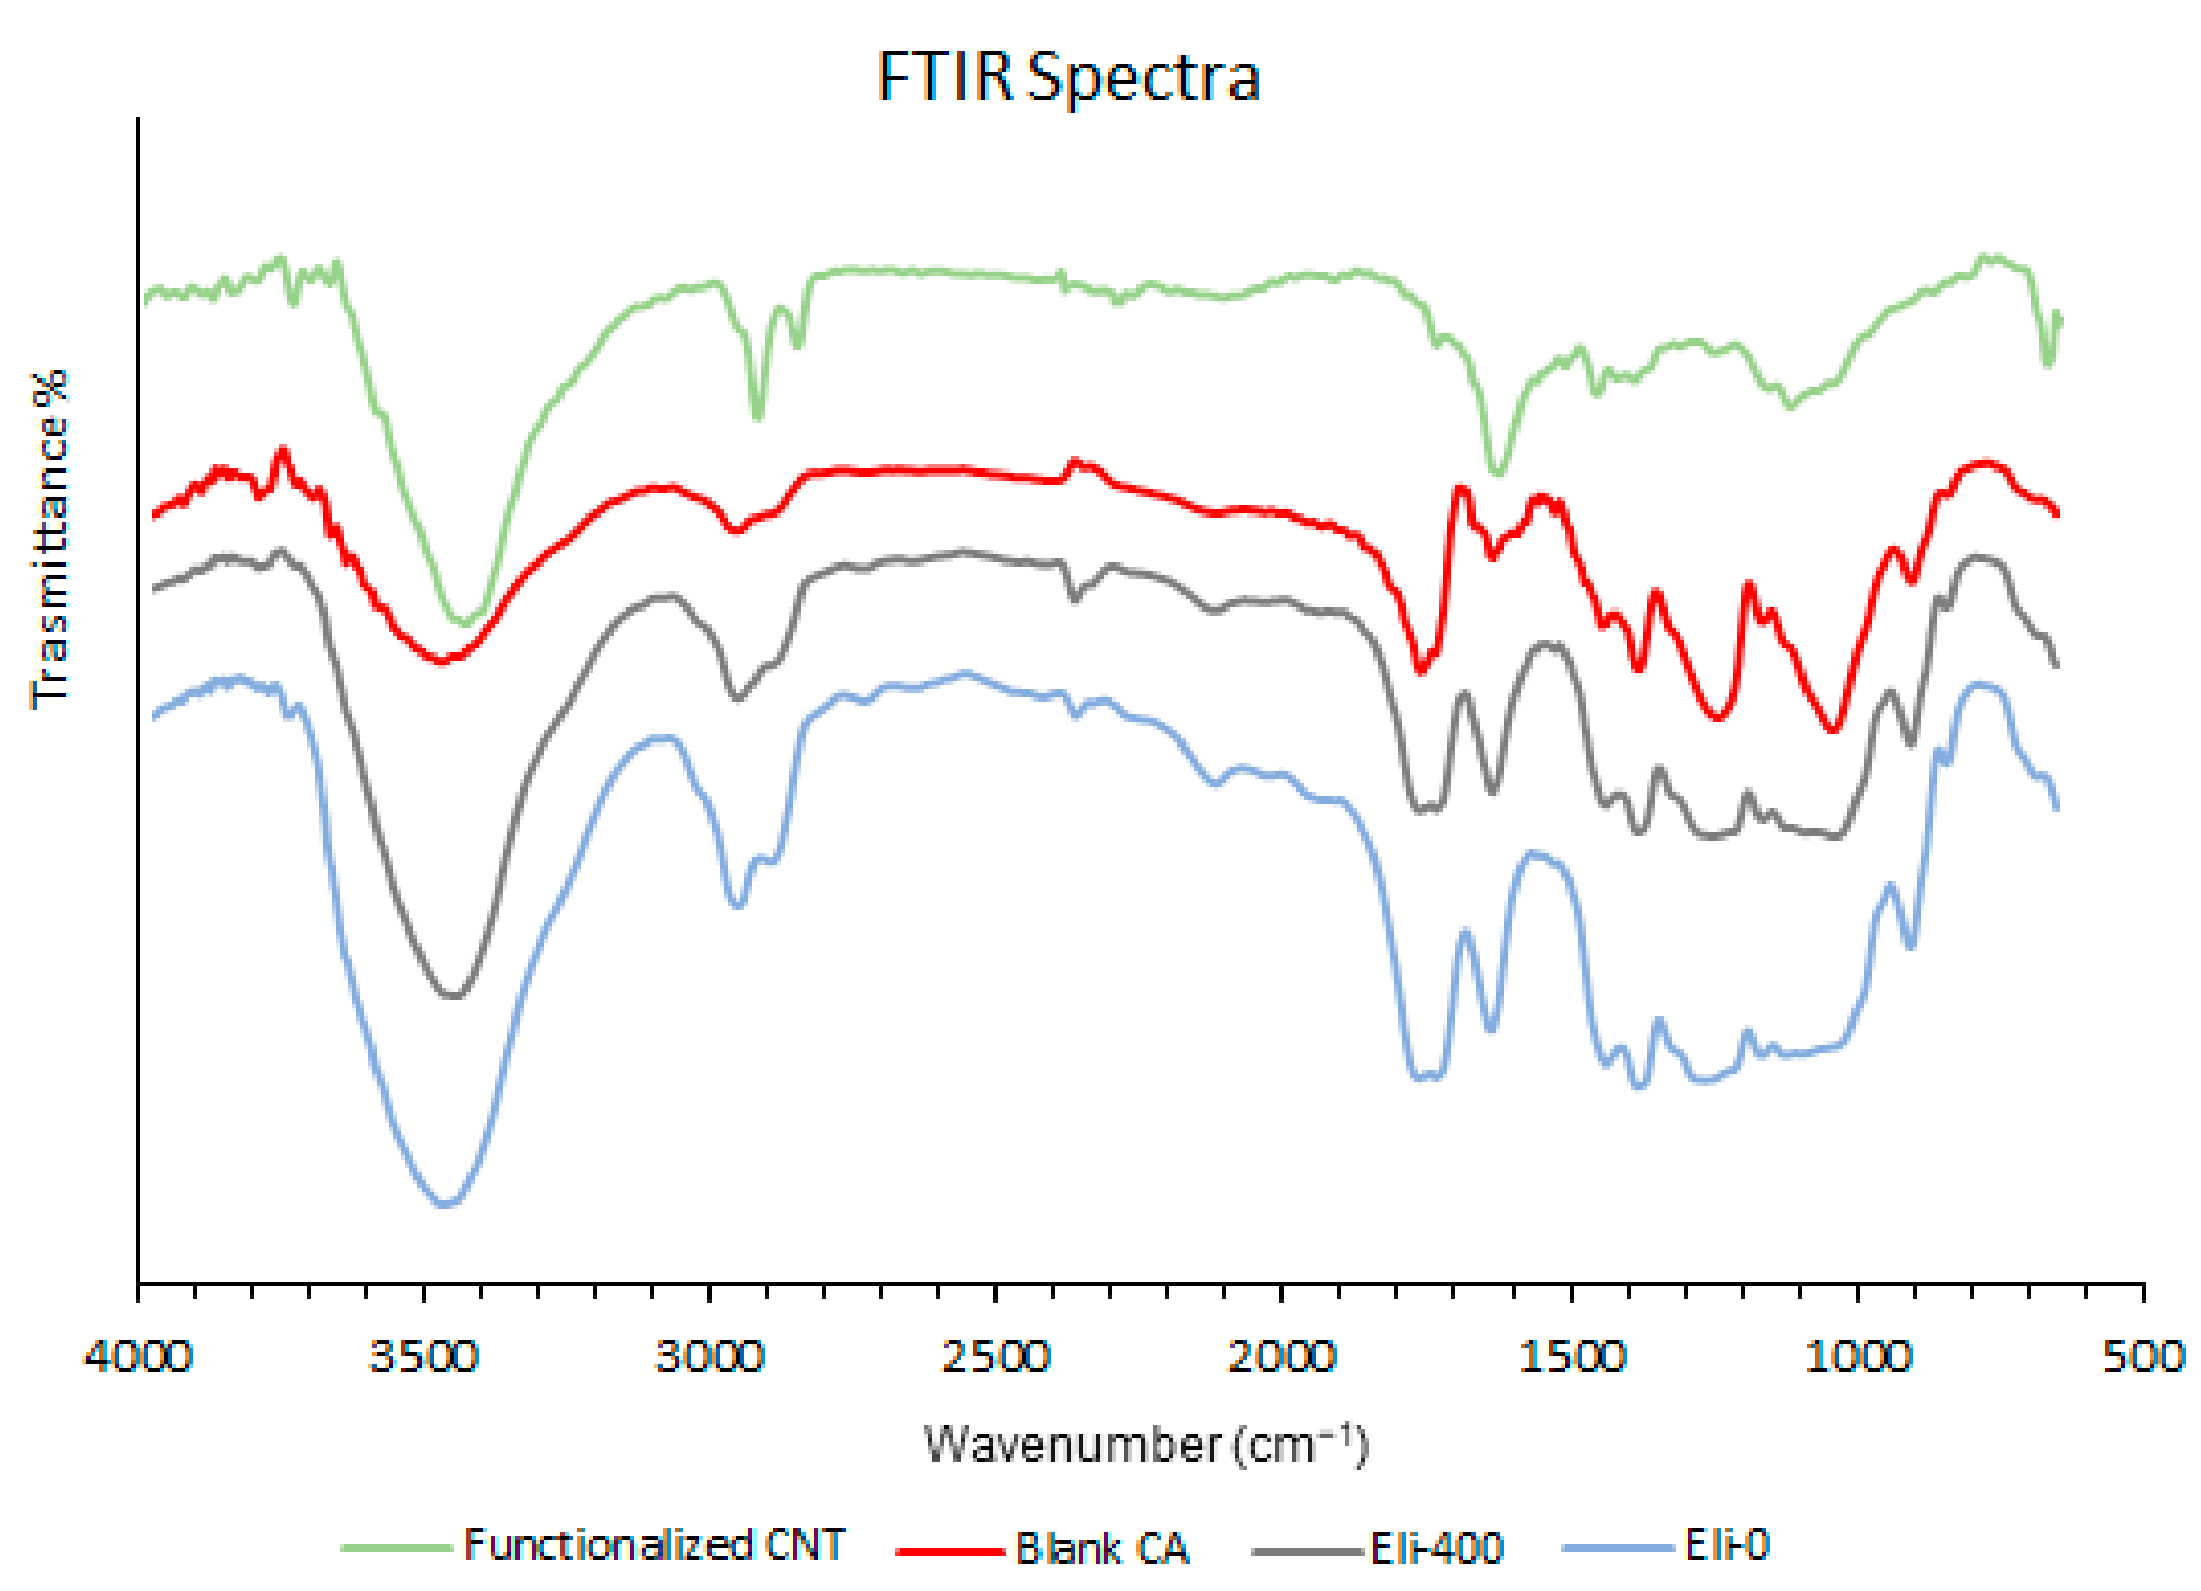
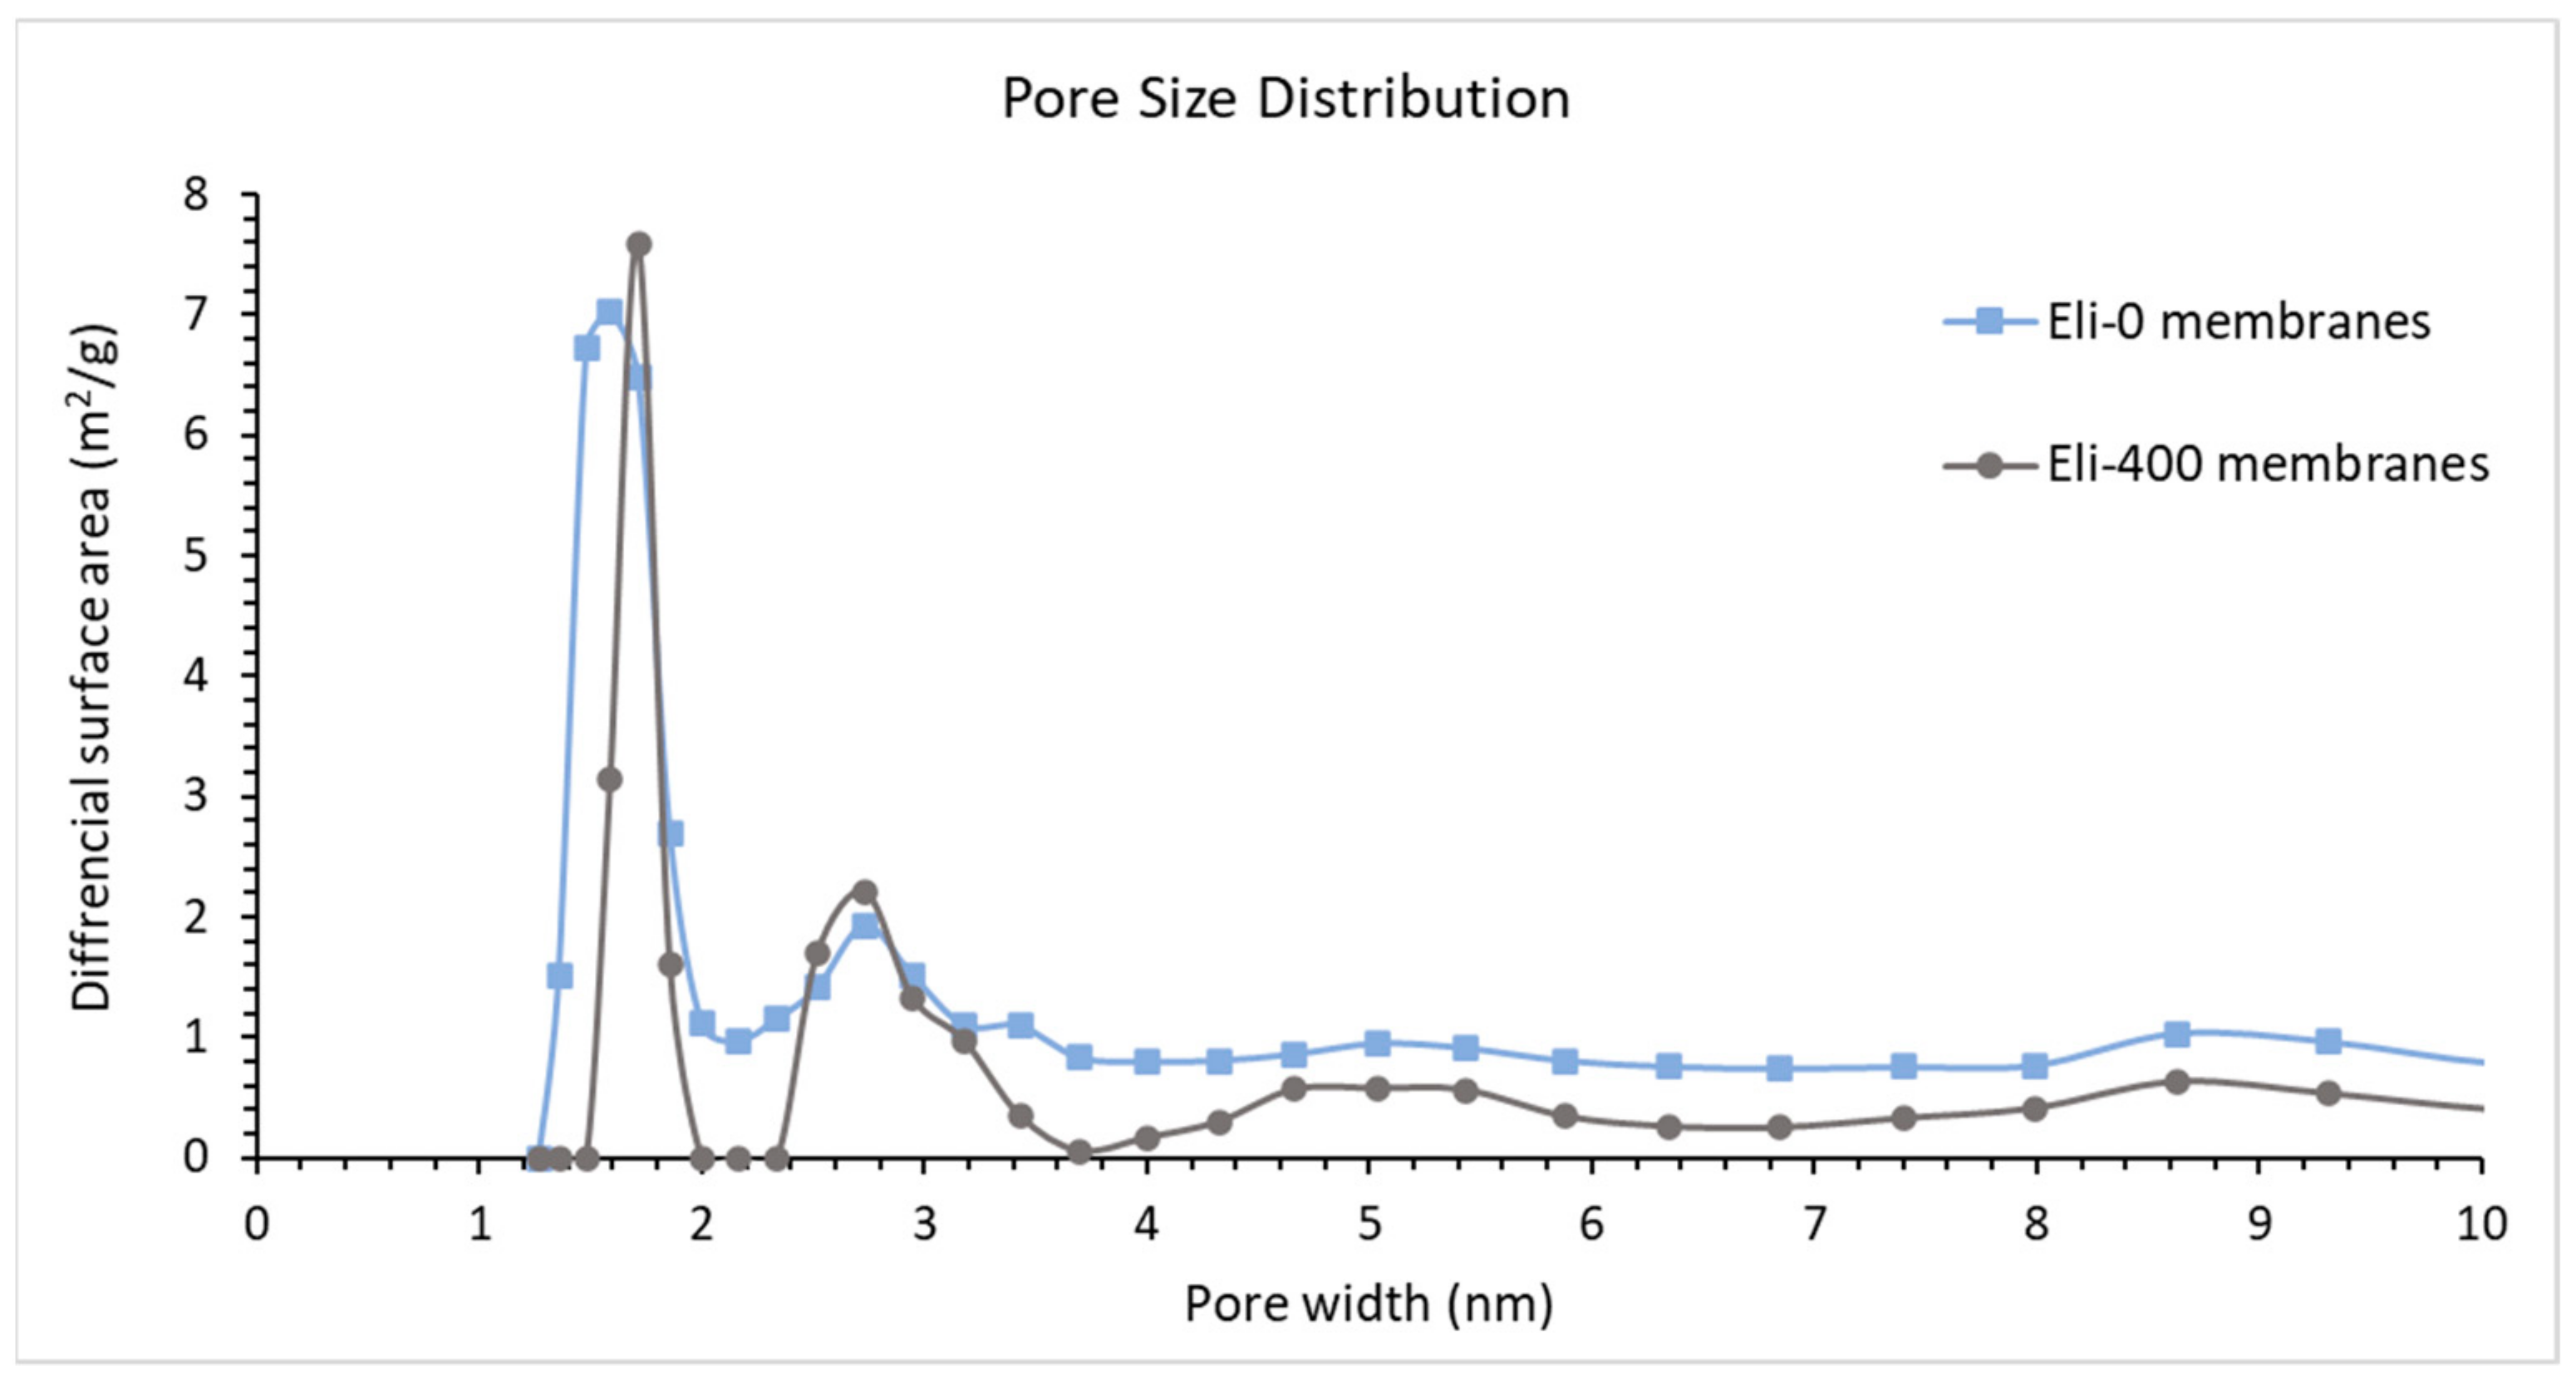
3.2. Characterization of the Nanocomposite Membranes

Characterization of the cross-sectional area of the membranes was conducted by SEM. Sample images are presented in Figure 7. Eli-0 membranes have several classical drop-like macrovoids which extend across the cross section of the membranes. It is clear that shortening the CNTs by mechanical milling has an effect on the membrane pore structure. The morphology of the Eli-400 membranes shows smaller macrovoids which are larger in quantity and are positioned closer to the dense layer of the membrane.
The phase inversion process entails the demixing of the solvent/non-solvent when a cast solution is introduced into the non-solvent bath. The speed at which this process takes place plays a major role in determining the morphology of the cross section of the precipitated membranes, as well as the shapes and sizes of the formed macrovoids [44]. Figure 7a,c show two different shapes of macrovoid structures. Two factors could have contributed to this difference. The first one was the change in viscosity of the casting solution, expected to slow the rate of the demixing process during PI. This was possibly due to the increase in the quantity of the fragments of the carbon nanotubes at the same weight percentage. This promoted better interaction between the polymeric chains on the one hand, and increased the viscosity of the solution on the other, thus preventing macrovoids from expanding in size [45,46]. The second factor had an opposite effect, where the short Eli-400 nanotubes would have a wider dispersion in the membrane cast solution, creating more hydrophilic sites and promoting the demixing of the solvent-non-solvent in the phase inversion step [47]. Consequently, the macrovoids increased in number, but not in size.
Figure 8 shows the FTIR spectra of Eli-0 and Eli-400 nanocomposite membranes in comparison to the spectra of blank cellulose acetate powder and the spectra of functionalized CNTs. The main absorption peaks for the blank cellulose acetate powder were identified at 3460 cm−1 (O-H bonds), 2945 cm−1 (C-H bonds), 1757 cm−1 (C=O bonds), 1632 cm−1 (C-C bonds), 1379 cm−1 (CH2 bonds), 1230 cm−1 (C-O bond), 1032 cm−1 (C-O-C bonds), and 899 cm−1 (C-H bonds) [48]. As for the main absorption peaks for the functionalized CNTs, they were found at 3425 cm−1 (O-H bonds), 2921 and 2850 cm−1 (C-H bonds), 1737 cm−1 (C-O bonds), 1625 cm−1 (C-C bonds), 1454 and 1391 cm−1 (CH2/CH bonds), 1245 cm−1 (O-H bonds), and 1116 cm−1 (C-O bonds) [49].
On comparing the FTIR spectra of both Eli-0 and Eli-400 membranes with the peaks of the blank cellulose acetate powder in Figure 8, it is clear that the location of the main absorption peaks did not show any significant shift, and no new peaks appeared, thus confirming that the type of interaction between the CNTs and the cellulose acetate polymer matrix is a physical interaction (via hydrogen bonding) and not a chemical one. However, the shape of a few peaks changed, particularly down the wavenumber, where they became broader. This is probably because the functionalized CNTs’ absorption overlapped with that of the cellulose acetate in the same regions, making the peaks stronger and broader.
Figure 9 shows the pore size distribution of the nanocomposite membranes in terms of the differential surface areas (m2/g) versus pore width (nm), analyzed using the Direct Density Function method for the pores that were smaller than 10 nm.
Pores that are smaller than 5 nm are believed to play important roles in the salt rejection of membranes, as highlighted in our previous work [37]. Eli-400 membranes have a high pore surface area in this region (~1.7 and ~2.7 nm), while Eli-0 membranes have high surface areas for smaller pores (~1.3 and 1.5 nm) and slightly less surface area for pores at ~2.9 nm. This could explain the dense skin structure in Figure 7b,d, where Eli-0 membranes have a denser top layer with smaller pores compared to the Eli-400 membranes. The BET surface area data for the membranes are displayed in Table 3, along with the contact angle measurements.
The results show that the Eli-400 membranes have a higher BET surface area, which agrees with the finding of the pore size distribution in Figure 9, as well as the fact that Eli-400 CNTs have open caps, as shown previously in Figure 3b. As for the contact angle measurement, the range is narrow, showing that Eli-400 membranes exhibit higher hydrophilicity than Eli-0 membranes. This is possibly due to the better dispersion of the shorter CNTs.

3.3. Permeation and Salt Retention Rates

The results of the performance of the nanocomposite membranes in terms of permeation and salt retention rates, for a 5000 ppm Na2SO4 salt solution at 15 bars, are displayed in Table 4. Furthermore, a collection of all the data above is displayed in the same table to facilitate the comparison and analysis in the discussion section.
Table 4 shows that the permeation rate increased by ~63% for the short open-capped Eli-400 CNT composite membranes compared to the long closed-capped Eli-0 CNT membranes. This had a slight adverse effect on the salt retention rate, which decreased by only 1%.

4. Discussion

The focus of this work was to investigate how the shortening of CNTs using ball milling affects the morphology, porosity, and performance of nanocomposite membranes. The first clear correlation observed was between the BET surface area of the CNTs and the morphology change of the membranes, where a larger surface area of the shortened CNTs was found to indicate more CNTs per unit weight, thus creating more interaction at the CNT–CA polymer interface. Such interactions changed the shape and size of the macrovoids, as explained earlier, as well as the porosity of the dense skin layer. That would also explain the differential pore size distribution values, where Eli-0 membranes showed a high differential surface area, and therefore quantity, for the smaller 1.3 and 1.5 nm micropores, while Eli-400 membranes had a high surface area for the larger 1.7 nm micropores. The second correlation found was between the CNT length and the hydrophilicity of the membranes; the shorter the CNTs, the more hydrophilic the membranes. Although the difference between the two data values is not big, it is still detectable. Enhanced hydrophilicity could possibly be due to the increase in the quantity of the nanotubes per weight, which then allows more carboxylic sites to become available and consequently increases hydrophilicity.
The observed change in membrane morphology was reflected in the performance of the membranes. The permeation rate increased with an increase in the BET surface area of the membranes. CNT morphology could have contributed to this finding in terms of the open caps of the Eli-400. This is expected to allow permeation rates to increase through the channels that became available. This may have also contributed to the increase of the BET surface area of the corresponding membranes in comparison to closed-capped Eli-0 CNT membranes. The increased permeation of Eli-400 membranes was coupled with a minimal change in salt retention performance. This could be explained in light of the comparable pore surface area of the two membranes for pores smaller than 3 nm, and the lower pore surface area for the Eli-400 membrane for pores beyond 3 nm. This is also corroborated by the SEM images of Figure 7, where Eli-0 membranes have a denser top layer with smaller pores compared to the Eli-400 membranes.

5. Conclusions

The same concentration of CNTs of two different lengths was found to affect the polymer matrix morphology, porosity, and accordingly, membrane performance. Shorter CNTs were found to significantly enhance the flux with only a minimum impact on salt rejection. Further ongoing work includes investigating the use of lower ball milling energies to preserve the structure of the CNTs while shortening them, and conducting a more comprehensive comparison between commercial CNTs with different aspect ratios and ball-milled CNTs in order to investigate the effect of the size/surface area/aspect ratio of CNTs on the morphology, porosity, and performance of nanocomposite membranes. This might open up a potential for different applications, including micro and ultrafiltration as well as waste water treatment.

Author Contributions

Conceptualization, A.R.R. and A.M.K.E.; methodology, N.A.E., A.R.R. and A.M.K.E.; investigation, N.A.E.; resources, N.A.E., A.R.R. and A.M.K.E.; data curation, N.A.E.; writing—original draft preparation, N.A.E.; writing—review and editing, A.R.R. and A.M.K.E.; visualization, N.A.E.; supervision, A.R.R. and A.M.K.E.; project administration, A.R.R. and A.M.K.E.; funding acquisition, N.A.E., A.R.R. and A.M.K.E. All authors have read and agreed to the published version of the manuscript.

Funding

This research received no external funding.

Institutional Review Board Statement

Not applicable.

Informed Consent Statement

Not applicable.

Data Availability Statement

Not applicable.

Acknowledgments

Nouran Elbadawi acknowledges the financial support of AUC Jameel fellowship and research support grants. The authors would also like to thank Nahed Yacoub for her assistance with the BET analysis.

Conflicts of Interest

The authors declare no conflict of interest.

References

  1. Berenguel, F.; Lara Galera, A.; Muñoz-Medina, M. Requirements for the construction of new desalination plants into a framework of sustainability. Sustainability 2020, 12, 5124. [Google Scholar] [CrossRef]
  2. The IDA Water Security Handbook. 2020–2021. Available online: https://www.globalwaterintel.com/products-and-services/market-research-reports/ida-water-security-handbook (accessed on 19 January 2021).
  3. World Water Day 2020: Desalination technologies Provide Safe and Sustainable Drinking Water. Available online: https://cordis.europa.eu/article/id/415568-world-water-day-2020-desalination-technologies-provide-safe-and-sustainable-drinking-water (accessed on 17 January 2021).
  4. Sola, I.; Sáez, C.A.; Sánchez-Lizaso, J.L. Evaluating environmental and socio-economic requirements for improving desalination development. J. Clean. Prod. 2021, 324, 129296. [Google Scholar] [CrossRef]
  5. IDA Water Security Handbook, 2019–2020 and GWI DesalData. Available online: https://idadesal.org/e-library/ida-water-security-handbook/ (accessed on 19 January 2021).
  6. Cherif, H.; Belhadj, J. Chapter 15—Environmental Life Cycle Analysis of Water Desalination Processes. In Sustainable Desalination Handbook; Gude, V.G., Ed.; Butterworth-Heinemann: Oxford, UK, 2018. [Google Scholar]
  7. Curto, D.; Franzitta, V.; Guercio, A. A Review of the Water Desalination Technologies. Appl. Sci. 2021, 11, 670. [Google Scholar] [CrossRef]
  8. Do Thi, H.T.; Pasztor, T.; Fozer, D.; Manenti, F.; Toth, A.J. Comparison of Desalination Technologies Using Renewable Energy Sources with Life Cycle, PESTLE, and Multi-Criteria Decision Analyses. Water 2021, 13, 3023. [Google Scholar] [CrossRef]
  9. Yang, Z.; Zhou, Y.; Feng, Z.; Rui, X.; Zhang, T.; Zhang, Z. A review on reverse osmosis and nanofiltration membranes for water purification. Polymers 2019, 11, 1252. [Google Scholar] [CrossRef] [Green Version]
  10. Wang, R.; Chen, D.; Wang, Q.; Ying, Y.; Gao, W.; Xie, L. Recent advances in applications of carbon nanotubes for desalination: A review. Nanomaterials 2020, 10, 1203. [Google Scholar] [CrossRef]
  11. Krystyjan, M.; Khachatryan, G.; Khachatryan, K.; Krzan, M.; Ciesielski, W.; Żarska, S.; Szczepankowska, J. Polysaccharides Composite Materials as Carbon Nanoparticles Carrier. Polymers 2022, 14, 948. [Google Scholar] [CrossRef]
  12. Zhao, Q.; Zhao, D.L.; Chung, T.-S. Nanoclays-Incorporated Thin-Film Nanocomposite Membranes for Reverse Osmosis Desalination. Adv. Mater. Interfaces 2020, 7, 7. [Google Scholar] [CrossRef]
  13. Bayer, T.; Selyanchyn, R.; Fujikawa, S.; Sasaki, K.; Lyth, S.M. Spray-painted graphene oxide membrane fuel cells. J. Membr. Sci. 2017, 541, 347–357. [Google Scholar] [CrossRef]
  14. Ion-Ebrasu, D.; Pollet, B.G.; Caprarescu, S.; Chitu, A.; Trusca, R.; Niculescu, V.; Gabor, R.; Carcadea, E.; Varlam, M.; Vasile, B.S. Graphene inclusion effect on anion-exchange membranes properties for alkaline water electrolyzers. Int. J. Hydrog. Energy 2020, 45, 17057–17066. [Google Scholar] [CrossRef]
  15. El-Din, L.A.N.; El-Gendi, A.; Ismail, N.; Abed, K.A.; Ahmed, A.I. Evaluation of cellulose acetate membrane with carbon nanotubes additives. J. Ind. Eng. Chem. 2015, 26, 259–264. [Google Scholar] [CrossRef]
  16. Nurkhamidah, S.; Rahmawati, Y.; Gumilang, R.; Riswanda, M.; Fahrizal, Y.; Ramadhan, I. Enhanced Performance of Celluloce Acetate/Polyethylene Glycol (CA/PEG) with the Addition of Functionalized Carbon Nanotube (CNT) Prepared by Wet-Dry Method; AIP Publishing: New York, NY, USA, 2019. [Google Scholar] [CrossRef]
  17. Vatanpour, V.; Esmaeili, M.; Farahani, M.H.D.A. Fouling reduction and retention increment of polyethersulfone nanofiltration membranes embedded by amine-functionalized multi-walled carbon nanotubes. J. Membr. Sci. 2014, 466, 70–81. [Google Scholar] [CrossRef]
  18. El-Aassar, A.-H.M. Study on polyamide thin film nano-composite membranes using different types of multi-walled carbon nanotubes at different pH feed solutions. J. Am. Sci. 2016, 12. [Google Scholar] [CrossRef]
  19. Choi, H.-g.; Yoon, S.H.; Son, M.; Celik, E.; Park, H.; Choi, H. Efficacy of synthesis conditions on functionalized carbon nanotube blended cellulose acetate membrane for desalination. Desalination Water Treat. 2016, 57, 7545–7554. [Google Scholar] [CrossRef]
  20. Rashed, A.O.; Esawi, A.M.K.; Ramadan, A.R. Novel polysulfone/carbon nanotube-polyamide thin film nanocomposite membranes with improved water flux for forward osmosis desalination. ACS Omega 2020, 5, 14427–14436. [Google Scholar] [CrossRef]
  21. Jin, H.; Huang, Y.; Wang, X.; Yu, P.; Luo, Y. Preparation of modified cellulose acetate membranes using functionalized multi-walled carbon nanotubes for forward osmosis. Desalination Water Treat. 2016, 57, 7166–7174. [Google Scholar] [CrossRef]
  22. Silva, M.; Hilliou, L.; Amorim, M.T. Fabrication of pristine-multiwalled carbon nanotubes/cellulose acetate composites for removal of methylene blue. Polym. Bull. 2020, 77, 623–653. [Google Scholar] [CrossRef]
  23. Zhang, Q.; Liu, Y.; Su, Y.; Zhang, R.; Fan, L.; Liu, Y.; Ma, T.; Jiang, Z. Fabrication and characterization of antifouling carbon nanotube/polyethersulfone ultrafiltration membranes. RSC Adv. 2016, 6, 35532–35538. [Google Scholar] [CrossRef]
  24. Van der Bruggen, B. The separation power of nanotubes in membranes: A review. Int. Sch. Res. Netw. Nanotechnol. 2012, 2012. [Google Scholar] [CrossRef]
  25. Jose, T.; George, S.C.; MG, M.; Thomas, S. Functionalized MWCNT and PVA nanocomposite membranes for dielectric and pervaporation applications. Chem. Eng. Process Technol. 2015, 6, 1. [Google Scholar]
  26. Manawi, Y.; Wang, K.; Kochkodan, V.; Johnson, D.; Atieh, M.; Khraisheh, M. Engineering the surface and mechanical properties of water desalination membranes using ultralong carbon nanotubes. Membranes 2018, 8, 106. [Google Scholar] [CrossRef] [Green Version]
  27. Eslami, J.; Abdi, Y.; Khamsavi, A.; EbrahimNataj, Z.; Kazemi, A.S. Effect of surface area of carbon nanotubes on membrane performance for effective water desalination. Appl. Phys. A Mater. Sci. Processing 2018, 124, 791. [Google Scholar] [CrossRef]
  28. Trivedi, S.; Alameh, K. Effect of vertically aligned carbon nanotube density on the water flux and salt rejection in desalination membranes. SpringerPlus 2016, 5, 1158. [Google Scholar] [CrossRef] [Green Version]
  29. Guo, J.; Liu, Y.; Prada Silvy, R.; Tan, Y.; Azad, S.; Krause, B.; Pötschke, P.; Grady, B. Aspect ratio effects of multi-walled carbon nanotubes on electrical, mechanical, and thermal properties of Polycarbonate/MWCNT composites. J. Polym. Sci. B Polym. Phys. 2014, 52, 73–83. [Google Scholar] [CrossRef]
  30. Defeng, W.; Wu, L.; Zhou, W.; Sun, Y.; Zhang, M. Relations between the aspect ratio of carbon nanotubes and the formation of percolation networks in biodegradable polylactide/carbon nanotube composites. J. Polym. Sci. Part B Polym. Phys. 2010, 48, 479–489. [Google Scholar]
  31. Martone, A.; Faiella, G.; Antonucci, V.; Giordano, M.; Zarrelli, M. The effect of the aspect ratio of carbon nanotubes on their effective reinforcement modulus in an epoxy matrix. Compos. Sci. Technol. 2011, 71, 1117–1123. [Google Scholar] [CrossRef] [Green Version]
  32. Thomas, S.; De, S.; Hussein, I. Impact of aspect ratio of carbon nanotubes on shear and extensional rheology of polyethylene nanocomposites. Appl. Rheol. 2013, 23. [Google Scholar] [CrossRef]
  33. Gao, C.; Vo, C.D.; Jin, Y.Z.; Li, W.; Armes, S.P. Multihydroxy Polymer-Functionalized Carbon Nanotubes:  Synthesis, Derivatization, and Metal Loading. Macromolecules 2005, 38, 8634–8648. [Google Scholar] [CrossRef]
  34. Papp, I.Z.; Kozma, G.; Puskás, R.; Simon, T.; Kónya, Z.; Kukovecz, Á. Effect of planetary ball milling process parameters on the nitrogen adsorption properties of multiwall carbon nanotubes. Adsorption 2013, 19, 687–694. [Google Scholar] [CrossRef]
  35. Kierkowicz, M.; Pach, E.; Santidrián, A.; Sandoval, S.; Gonçalves, G.; Tobías-Rossell, E.; Kalbáč, M.; Ballesteros, B.; Tobias, G. Comparative study of shortening and cutting strategies of single-walled and multi-walled carbon nanotubes assessed by scanning electron microscopy. Carbon 2018, 139, 922–932. [Google Scholar] [CrossRef]
  36. Schönherr, J.; Buchheim, J.R.; Scholz, P.; Adelhelm, P. Boehm Titration Revisited (Part I): Practical Aspects for Achieving a High Precision in Quantifying Oxygen-Containing Surface Groups on Carbon Materials. C 2018, 4, 21. [Google Scholar] [CrossRef] [Green Version]
  37. El-Badawi, N.; Ramadan, A.R.; Esawi, A.M.K.; El-Morsi, M. Novel carbon nanotube–cellulose acetate nanocomposite membranes for water filtration applications. Desalination 2014, 344, 79–85. [Google Scholar] [CrossRef]
  38. Vatanpour, V.; Madaeni, S.S.; Moradian, R.; Zinadini, S.; Astinchap, B. Fabrication and characterization of novel antifouling nanofiltration membrane prepared from oxidized multiwalled carbon nanotube/polyethersulfone nanocomposite. J. Membr. Sci. 2011, 375, 284–294. [Google Scholar] [CrossRef]
  39. Das, R.; Abd Hamid, S.B.; Ali, M.; Yongzhi, W. Carbon Nanotubes Characterization by X-ray Powder Diffraction—A Review. Curr. Nanosci. 2015, 11, 23–35. [Google Scholar] [CrossRef] [Green Version]
  40. Poirier, D.; Gauvin, R.; Drew, R.A.L. Structural characterization of a mechanically milled carbon nanotube/aluminum mixture. Compos. Part A Appl. Sci. Manuf. 2009, 40, 1482–1489. [Google Scholar] [CrossRef]
  41. Jorio, A.; Saito, R. Raman spectroscopy for carbon nanotube applications. J. Appl. Phys. 2021, 129, 021102. [Google Scholar] [CrossRef]
  42. Zdrojek, M.; Gebicki, W.; Jastrzebski, C.; Melin, T.; Huczko, A. Studies of Multiwall Carbon Nanotubes Using Raman Spectroscopy and Atomic Force Microscopy. Solid State Phenom. 2004, 99, 265–268. [Google Scholar] [CrossRef]
  43. Kumar, A.; Pande, U.; Banerjee, M.K. Effect of high energy ball milling on the structure of iron-multiwall carbon nanotubes (MWCNT) composite. Adv. Mater. Res. 2017, 6, 245–255. [Google Scholar] [CrossRef]
  44. Hołda, A.K.; Vankelecom, I.F.J. Understanding and guiding the phase inversion process for synthesis of solvent resistant nanofiltration membranes. J. Appl. Polym. Sci. 2015, 132. [Google Scholar] [CrossRef]
  45. Choi, H.-G.; Son, M.; Yoon, S.; Celik, E.; Kang, S.; Park, H.; Park, C.H.; Choi, H. Alginate fouling reduction of functionalized carbon nanotube blended cellulose acetate membrane in forward osmosis. Chemosphere 2015, 136, 204–210. [Google Scholar] [CrossRef]
  46. Fadl, E.; Noumir, H.; Morsy, A.; Kandil, S.; Ebrahim, S.; Khalil, M. Development of cellulose acetate membrane performance by carboxylate multiwalled carbon nanotubes. Adv. Nat. Sci. Nanosci. Nanotechnol. 2022, 13, 015006. [Google Scholar] [CrossRef]
  47. Zhang, J.; Xu, Z.; Shan, M.; Zhou, B.; Li, Y.; Li, B.; Niu, J.; Qian, X. Synergetic effects of oxidized carbon nanotubes and graphene oxide on fouling control and anti-fouling mechanism of polyvinylidene fluoride ultrafiltration membranes. J. Membr. Sci. 2013, 448, 81–92. [Google Scholar] [CrossRef]
  48. Jin, X.; Xu, J.; Wang, X.; Xie, Z.; Liu, Z.; Liang, B.; Chen, D.; Shen, G. Flexible TiO2/cellulose acetate hybrid film as a recyclable photocatalyst. RSC Adv. 2014, 4, 12640. [Google Scholar] [CrossRef]
  49. De Menezes, B.R.C.; Ferreira, F.V.; Silva, B.C.; Simonetti, E.A.N.; Bastos, T.M.; Cividanes, L.S.; Thim, G.P. Effects of octadecylamine functionalization of carbon nanotubes on dispersion, polarity, and mechanical properties of CNT/HDPE nanocomposites. J. Mater. Sci. 2018, 53, 14311–14327. [Google Scholar] [CrossRef]
Figure 1. Schematic diagram of the preparation procedure of nanocomposite membranes.
Membranes 12 00474 g001
Figure 2. TEM images of (a) Eli-0 and (b) Eli-400 CNTs at 200 nm scale.
Membranes 12 00474 g002
Figure 3. TEM of Eli-400 CNTs: (a) CNT agglomerate, (b) magnified part of the agglomerate to show the open cap, (c) damaged CNTs, and (d) magnified part of the damaged CNTs showing the graphene walls.
Membranes 12 00474 g003aMembranes 12 00474 g003b
Figure 4. XRD spectrums of unmilled and milled Elicarb CNTs.
Membranes 12 00474 g004
Figure 5. (a) Histogram of length distribution of Eli-0 CNTs, (b) histogram of length distribution of Eli-400 CNTs, and (c) Box Whisker chart of Eli-0 and Eli-400 CNTs.
Membranes 12 00474 g005
Figure 6. Raman spectra of the milled and unmilled Elicarb CNTs.
Membranes 12 00474 g006
Figure 7. SEM of the cross-section of CA nanocomposites with 0.001% (a,b) Eli-0 and (c,d) Eli-400 CNTs at two different magnifications.
Membranes 12 00474 g007
Figure 8. FTIR spectra of functionalized carbon nanotubes, powder cellulose acetate, Eli-0 membrane, and Eli-400 membrane.
Membranes 12 00474 g008
Figure 9. Differential pore areas versus pore width for the two nanocomposite membranes.
Membranes 12 00474 g009
Table 1. Length distribution (nm) and BET surface area (SA) (m2/g) after ball milling of functionalized Elicarb CNTs.
Quartile 1 (25% of Population)Quartile 3 (75% of the Total Population)Quartile 2 (Median)Mean Excluding OutliersBET SA (m2/g)
Eli-0 CNTs6661649965113279
Eli-400 CNTs223710342421113
Table 2. Summarized results of Raman shifting.
DIDGIGID/IG
Eli-0 CNTs1340368.01580357.51.03
Eli-400 CNTs1340112.8158473.91.53
Table 3. BET surface area and contact angle of the membranes.
BET SA of Membranes (m2/g)Contact Angle
Eli-0 membranes5.8 ± 1.364 ± 4
Eli-400 membranes7.2 ± 0.361 ± 1
Table 4. Summary of all data.
CNTs Length (nm)CNT Diameter (nm)CNT BET SA (m2/g)Membranes BET SA (m2/g)Membranes Contact AngleJ Na2SO4 (L/m2h·bar)Salt Retention %
Eli-01132 ± 66111 ± 1795.8 ± 1.364 ± 40.41 ± 0.0197.5 ± 0.3
Eli-400421 ± 29911 ± 11137.2 ± 0.361 ± 10.67 ± 0.0296.5 ± 0.9
Publisher’s Note: MDPI stays neutral with regard to jurisdictional claims in published maps and institutional affiliations.

