3.1. Second Derivative of Prodan Fluorescence Spectra and 3D Imaging Plot for C17PC Bilayer Membrane [9,22]
In the first place, we simply explain how we observe the bilayer phase behavior of phospholipids on the basis of the Prodan fluorescence spectroscopy and how to construct 3D imaging plots from the results of a series of fluorescence spectra obtained. This technique is basically based on the fact that the wavelength λ
max, at which the emission maximum is observed, depends on the polarity of the environment around the Prodan molecule [
12,
13]. Since the microscopic polarity within phospholipid bilayer membranes steeply decreases along the bilayer depth direction from the hydrophilic surface to the hydrophobic core [
23], the λ
max value changes definitely when the location of the Prodan molecules incorporated into a phospholipid bilayer membrane changes slightly in the depth direction with the variation in the packing state due to bilayer phase transitions. More detailed explanation about the relation between the location of Prodan molecule and the bilayer phase states has been given in our previous reports [
14,
22]. As an example,
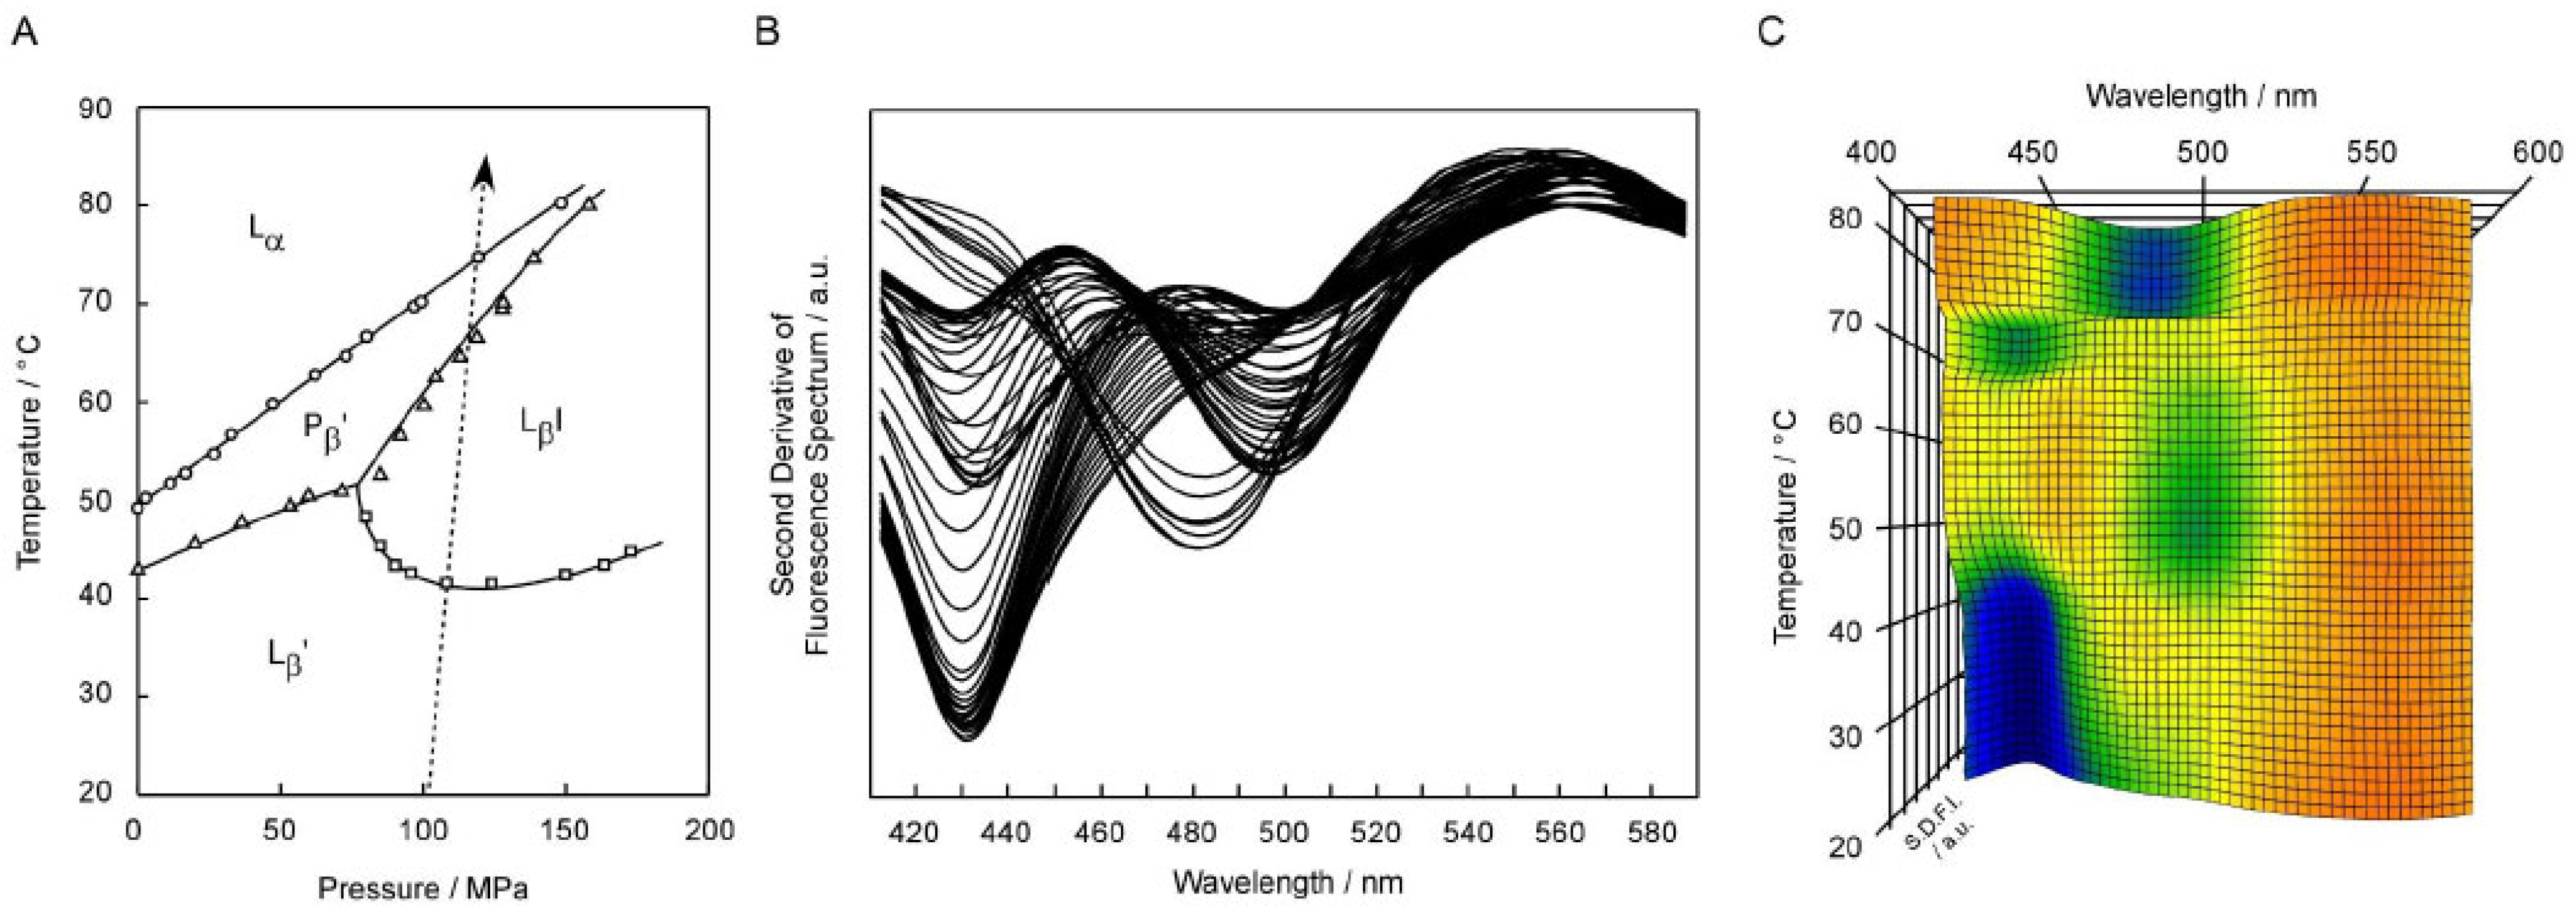
Figure 1 shows the results of the Prodan fluorescence spectra obtained under high pressure (ca. 106–117 MPa) for the C17PC bilayer membrane at every 1 °C in the range from 20 °C to 85 °C. In
Figure 1A, the temperature (
T)–pressure (
P) phase diagram of the C17PC bilayer membrane [
9,
22] is given to indicate the heating process (the arrow in the figure) along which the fluorescence spectroscopic observation was performed. As seen from this figure, all the different four phases, including the pressure-induced L
βI phase, are observed in this heating process.
Figure 1B shows the second derivatives (∂
2F(λ)/∂λ
2) of the original spectra
F(λ) obtained directly from the Prodan fluorescence measurements. The reason we use the second derivative spectra, and not the original spectra, is that emission peaks, including minor peaks if any, are seemingly signalized as compared to those in the original spectra. It should be noted that λ
min is mathematically equivalent to the wavelength λ
max at which fluorescence intensity becomes maximum in the original spectrum. Although this figure is not clear enough to readily grasp how the second derivative spectra change with increasing temperature, this result demonstrates that each spectrum has the minimum either at ca. 430 nm, at ca. 480nm, or at ca. 500 nm, and that the change in the wavelength λ
min at which the intensity of the second derivative spectrum (SDFI) becomes minimum well correlates with the change in the bilayer phase state with increasing temperature. This means that the second derivative spectra exhibit λ
min characteristic of the respective bilayer phase states: 430–440 nm for L
β′ and P
β′ phase, 480–490 nm for the L
α phase and ca. 500 nm for the L
βI phase. Accordingly, it is possible for us to detect the bilayer phase transitions from the change in λ
min.
As mentioned above, it is rather difficult to exactly understand the phase behavior of the C17PC bilayer membrane directly from
Figure 1B, although it contains sufficient information necessary for that purpose. This may not be a purely scientific problem, but is not trivial in practice. Then, we introduced a 3D plot by adding a temperature axis to represent the change in the second derivative spectra with temperature more clearly.
Figure 1C shows the 3D plot thus constructed for the C17PC bilayer membrane by stacking all the second derivative spectra shown in
Figure 1B. In this 3D plot, the wavelength axis and the temperature axis are set horizontally and vertically, respectively, and the fluorescence intensity (i.e., SDFI) is indicated by color from blue (lowest) to red (highest) to depict the intensity in the direction of height (i.e., normal to this sheet plane). Since the λ
min value is significant in the Prodan fluorescence spectroscopic observation of the phospholipid bilayer membranes, as described above, we can easily understand how the bilayer phase state changes with temperature, by locating the blue region (or green region when the minimum is not low enough) in the 3D plot. For example, it can be easily understood from
Figure 1C that the C17PC bilayer membrane exists in the L
β′ state below ca. 42 °C and the phase state changes to the L
βI state above that temperature up to ca. 65 °C, because it can be seen from this 3D plot that below ca. 42 °C a blue region is located about 430 nm, indicative of the L
β′ phase, while a green region is around ca. 500 nm, indicative of the L
βI phase, between ca. 42 °C and ca. 65 °C. We call this type of plot “3D imaging plot”, because it provides us with the information in a visual manner, as is similar to general imaging technology.
3.2. Applicability of Prodan Fluorescence Spectroscopy to CnPC Bilayer Membranes
In a previous study [
22], we have reported that the Prodan fluorescence spectroscopy based on this 3D imaging plot can be applied to the observation of the bilayer phase behavior of C16PC, C17PC and C18PC. However, we do not have enough data to prove that this technique is also applicable to other bilayer membranes of C
nPC with shorter or longer acyl chains. Since the hydrophobic interaction between the acyl chains of the adjacent C
nPC molecules is enhanced by the elongation of the acyl chain, it is expected that the molecular packing will become tighter with increasing in the acyl chain length. Taking into account the fact that Prodan is so sensitive as a membrane probe that it can detect the difference in the packing state arising from the difference in the curvature of the membrane [
24,
25], it would be probable that the change in the packing state arising from an increase or a decrease in the acyl chain length may produce an undesirable effect on the behavior of the Prodan molecules within the bilayer membrane, which may more or less impair the applicability of the Prodan fluorescence spectroscopic observation. Therefore, it is important not only for the practical application but also for scientific data to confirm the availability of this technique experimentally.
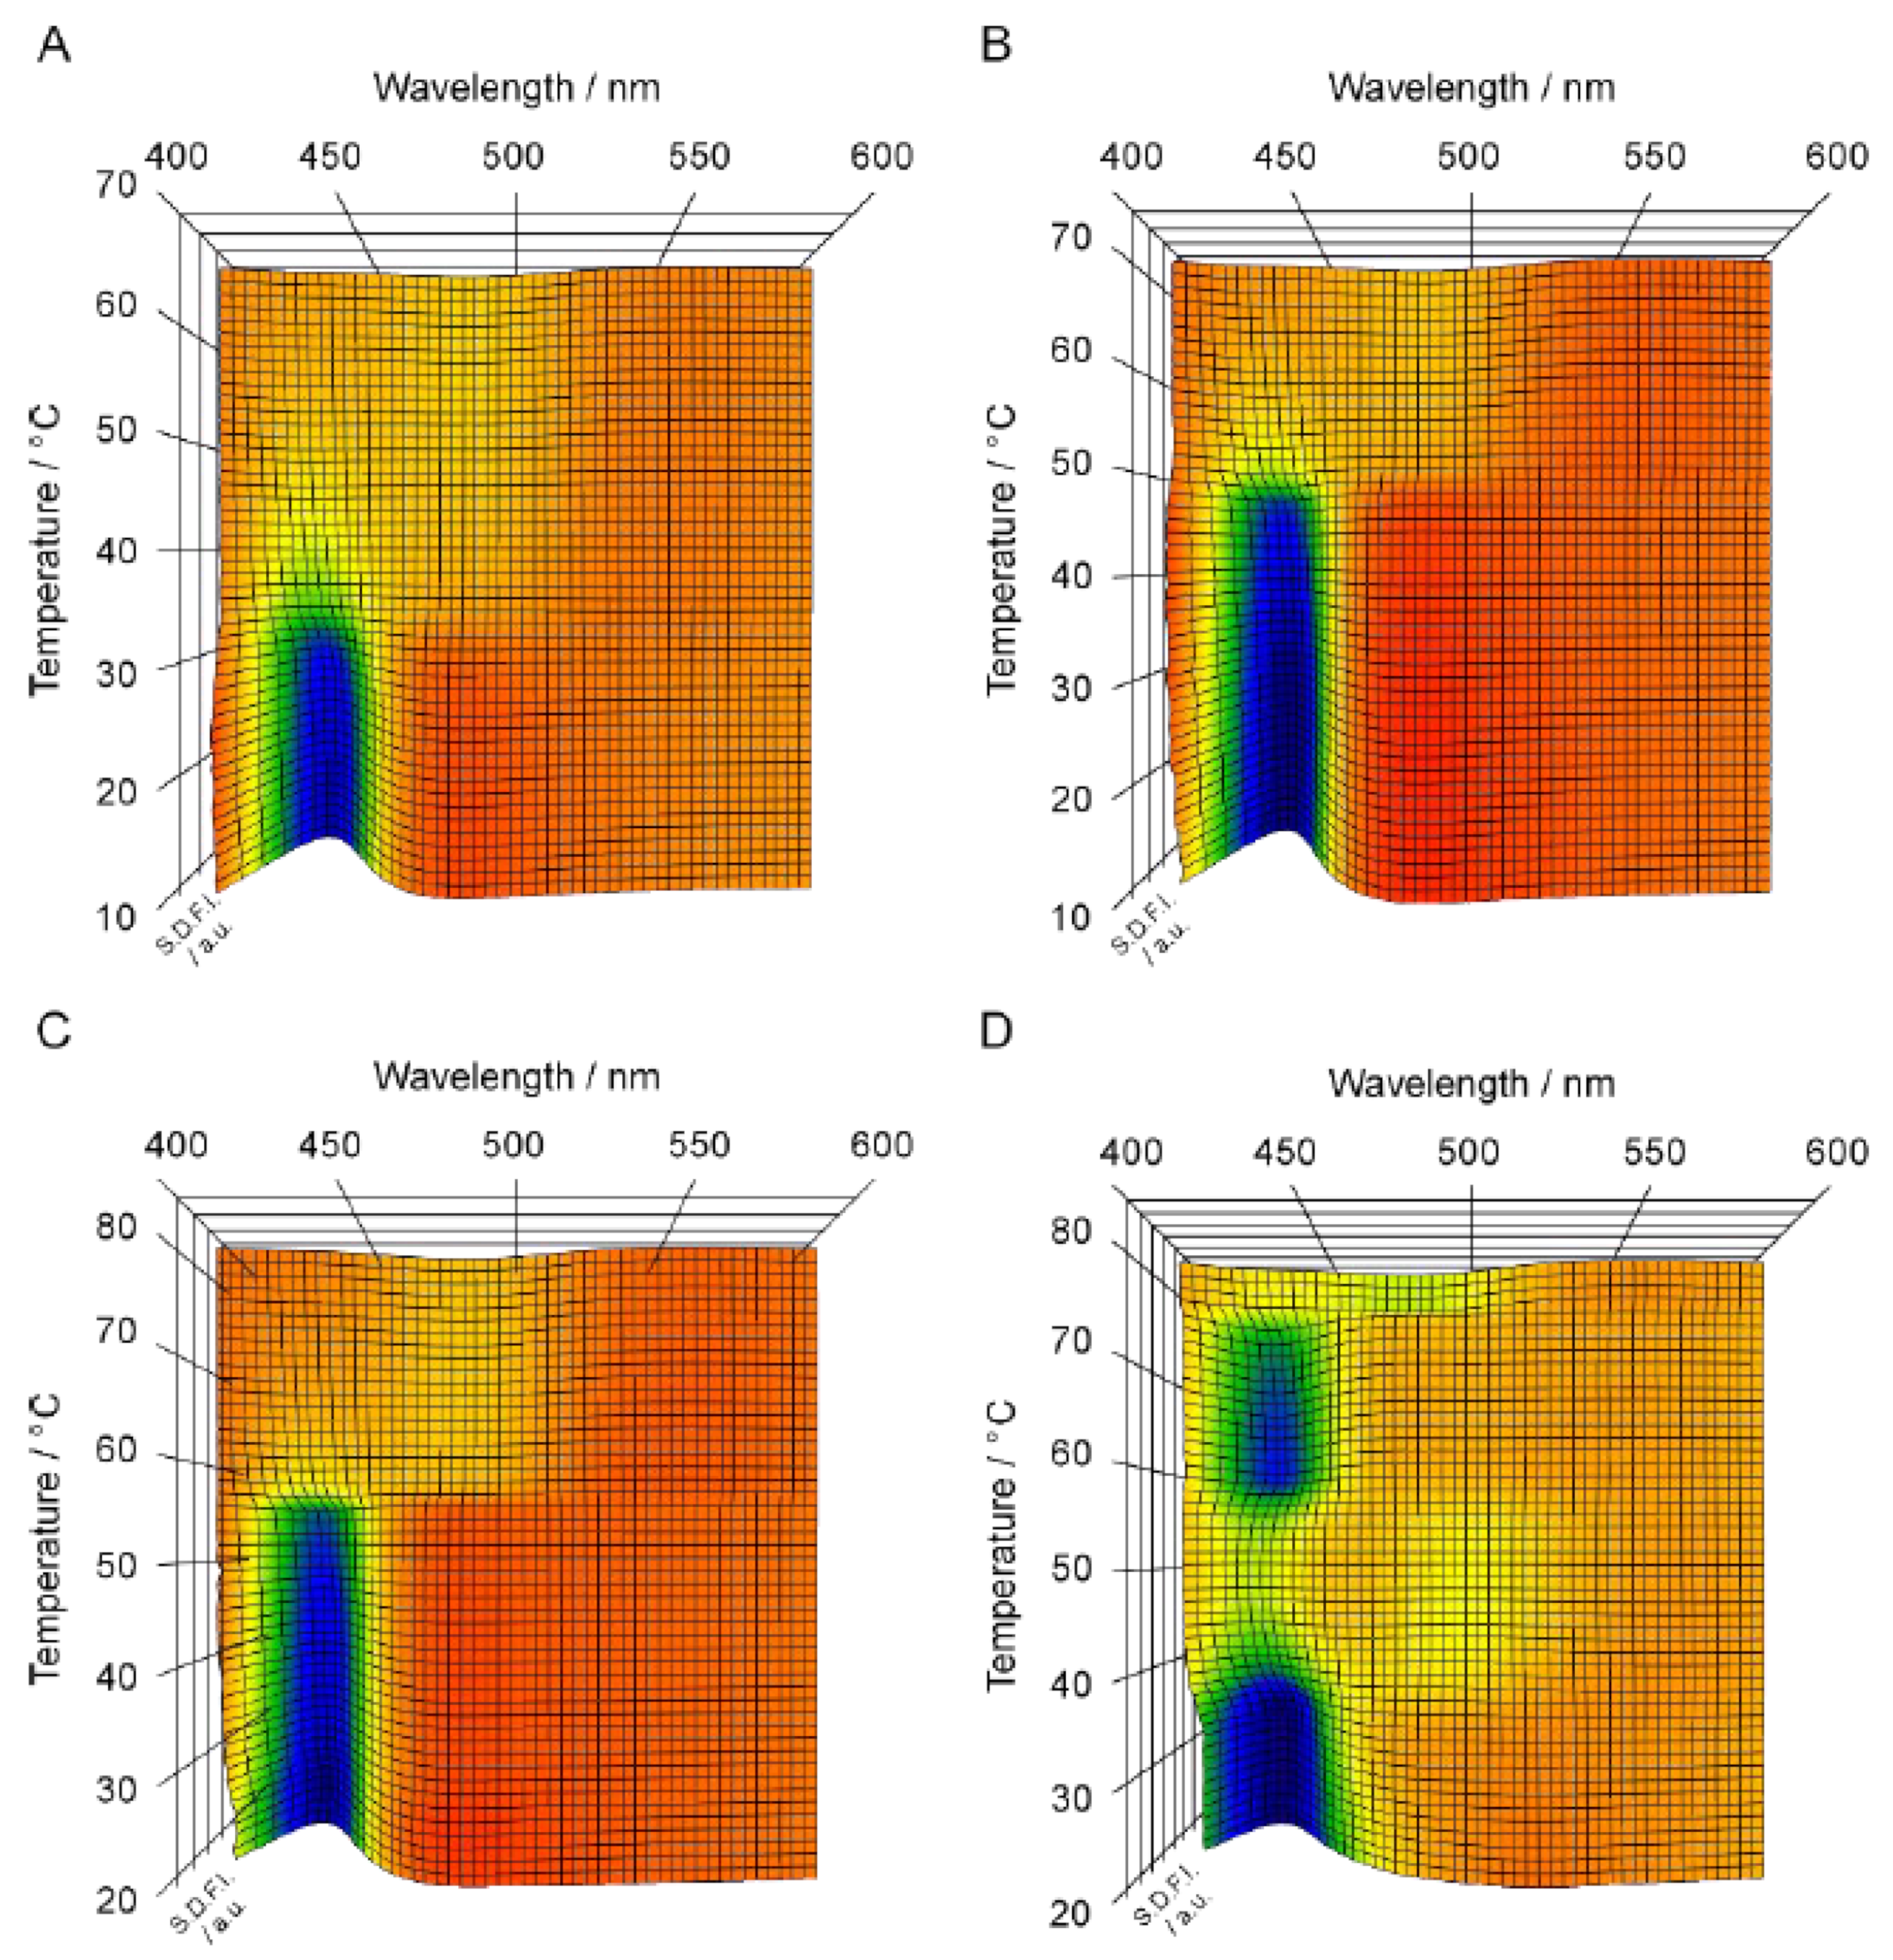
Figure 2 shows the 3D imaging plot (
Figure 2A–D) constructed on the basis of the Prodan fluorescence spectroscopic observation for the C
nPC bilayer membrane with shorter acyl chains (i.e.,
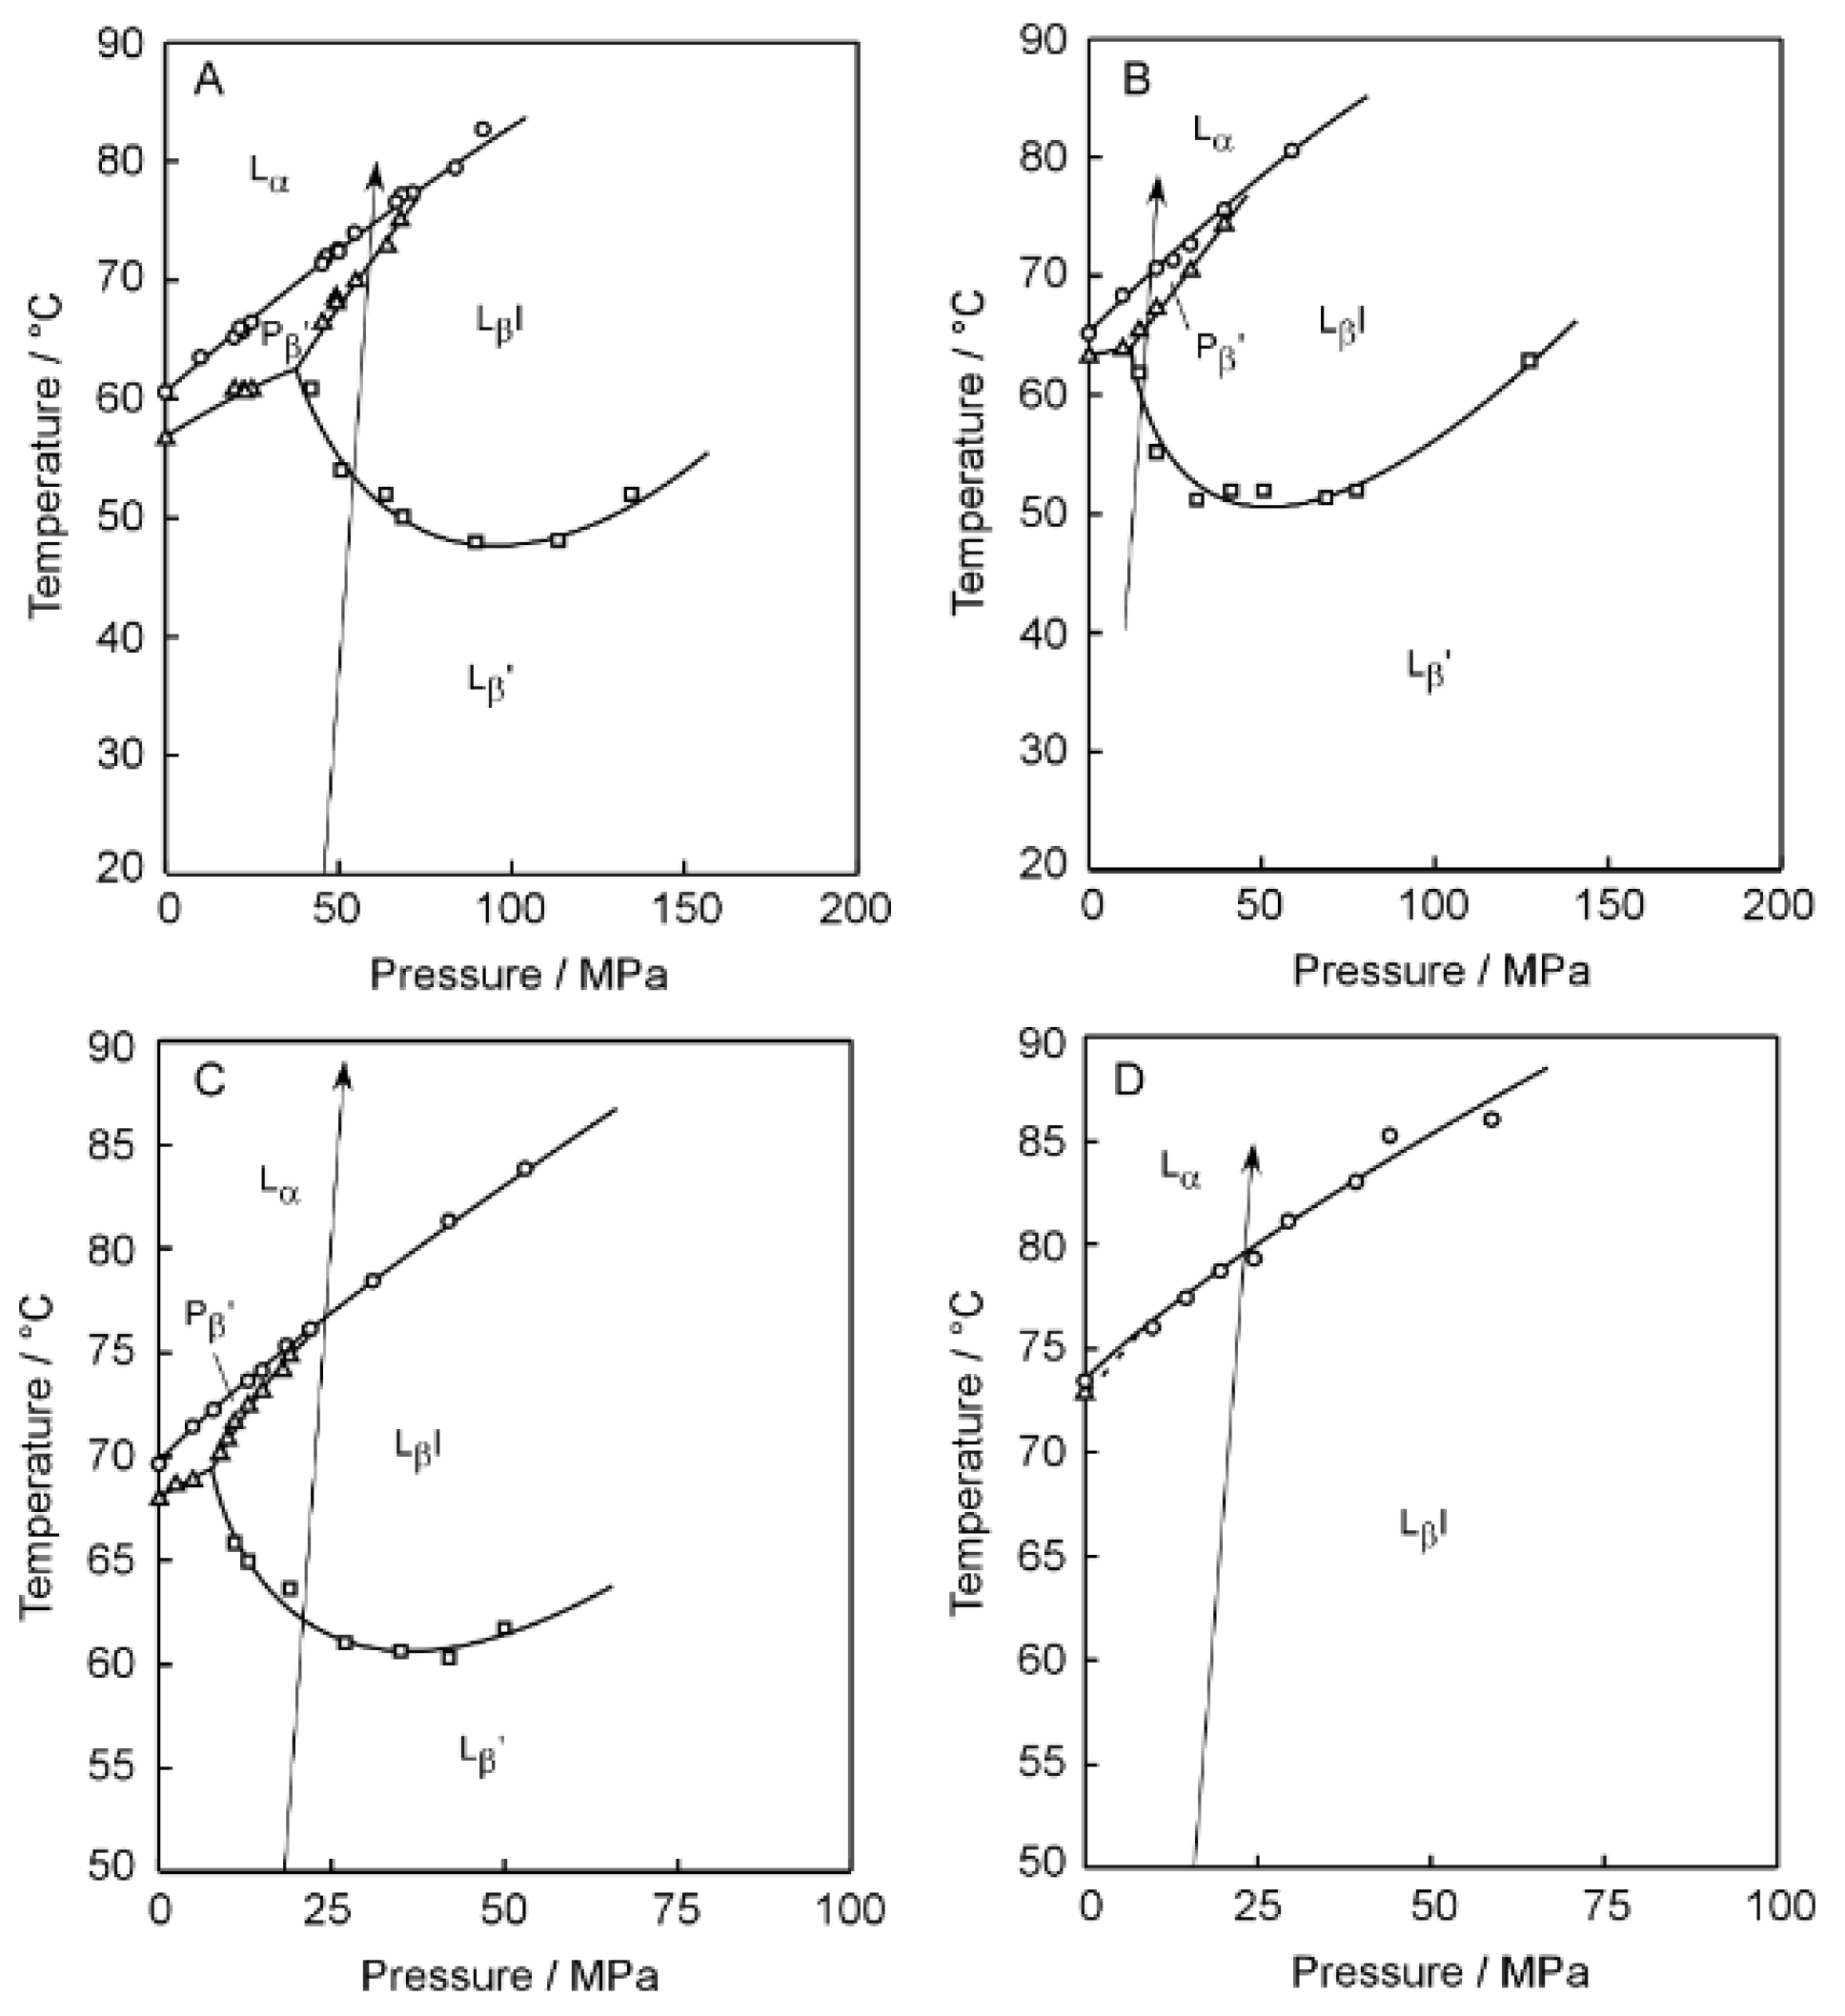
n = 12–15). In
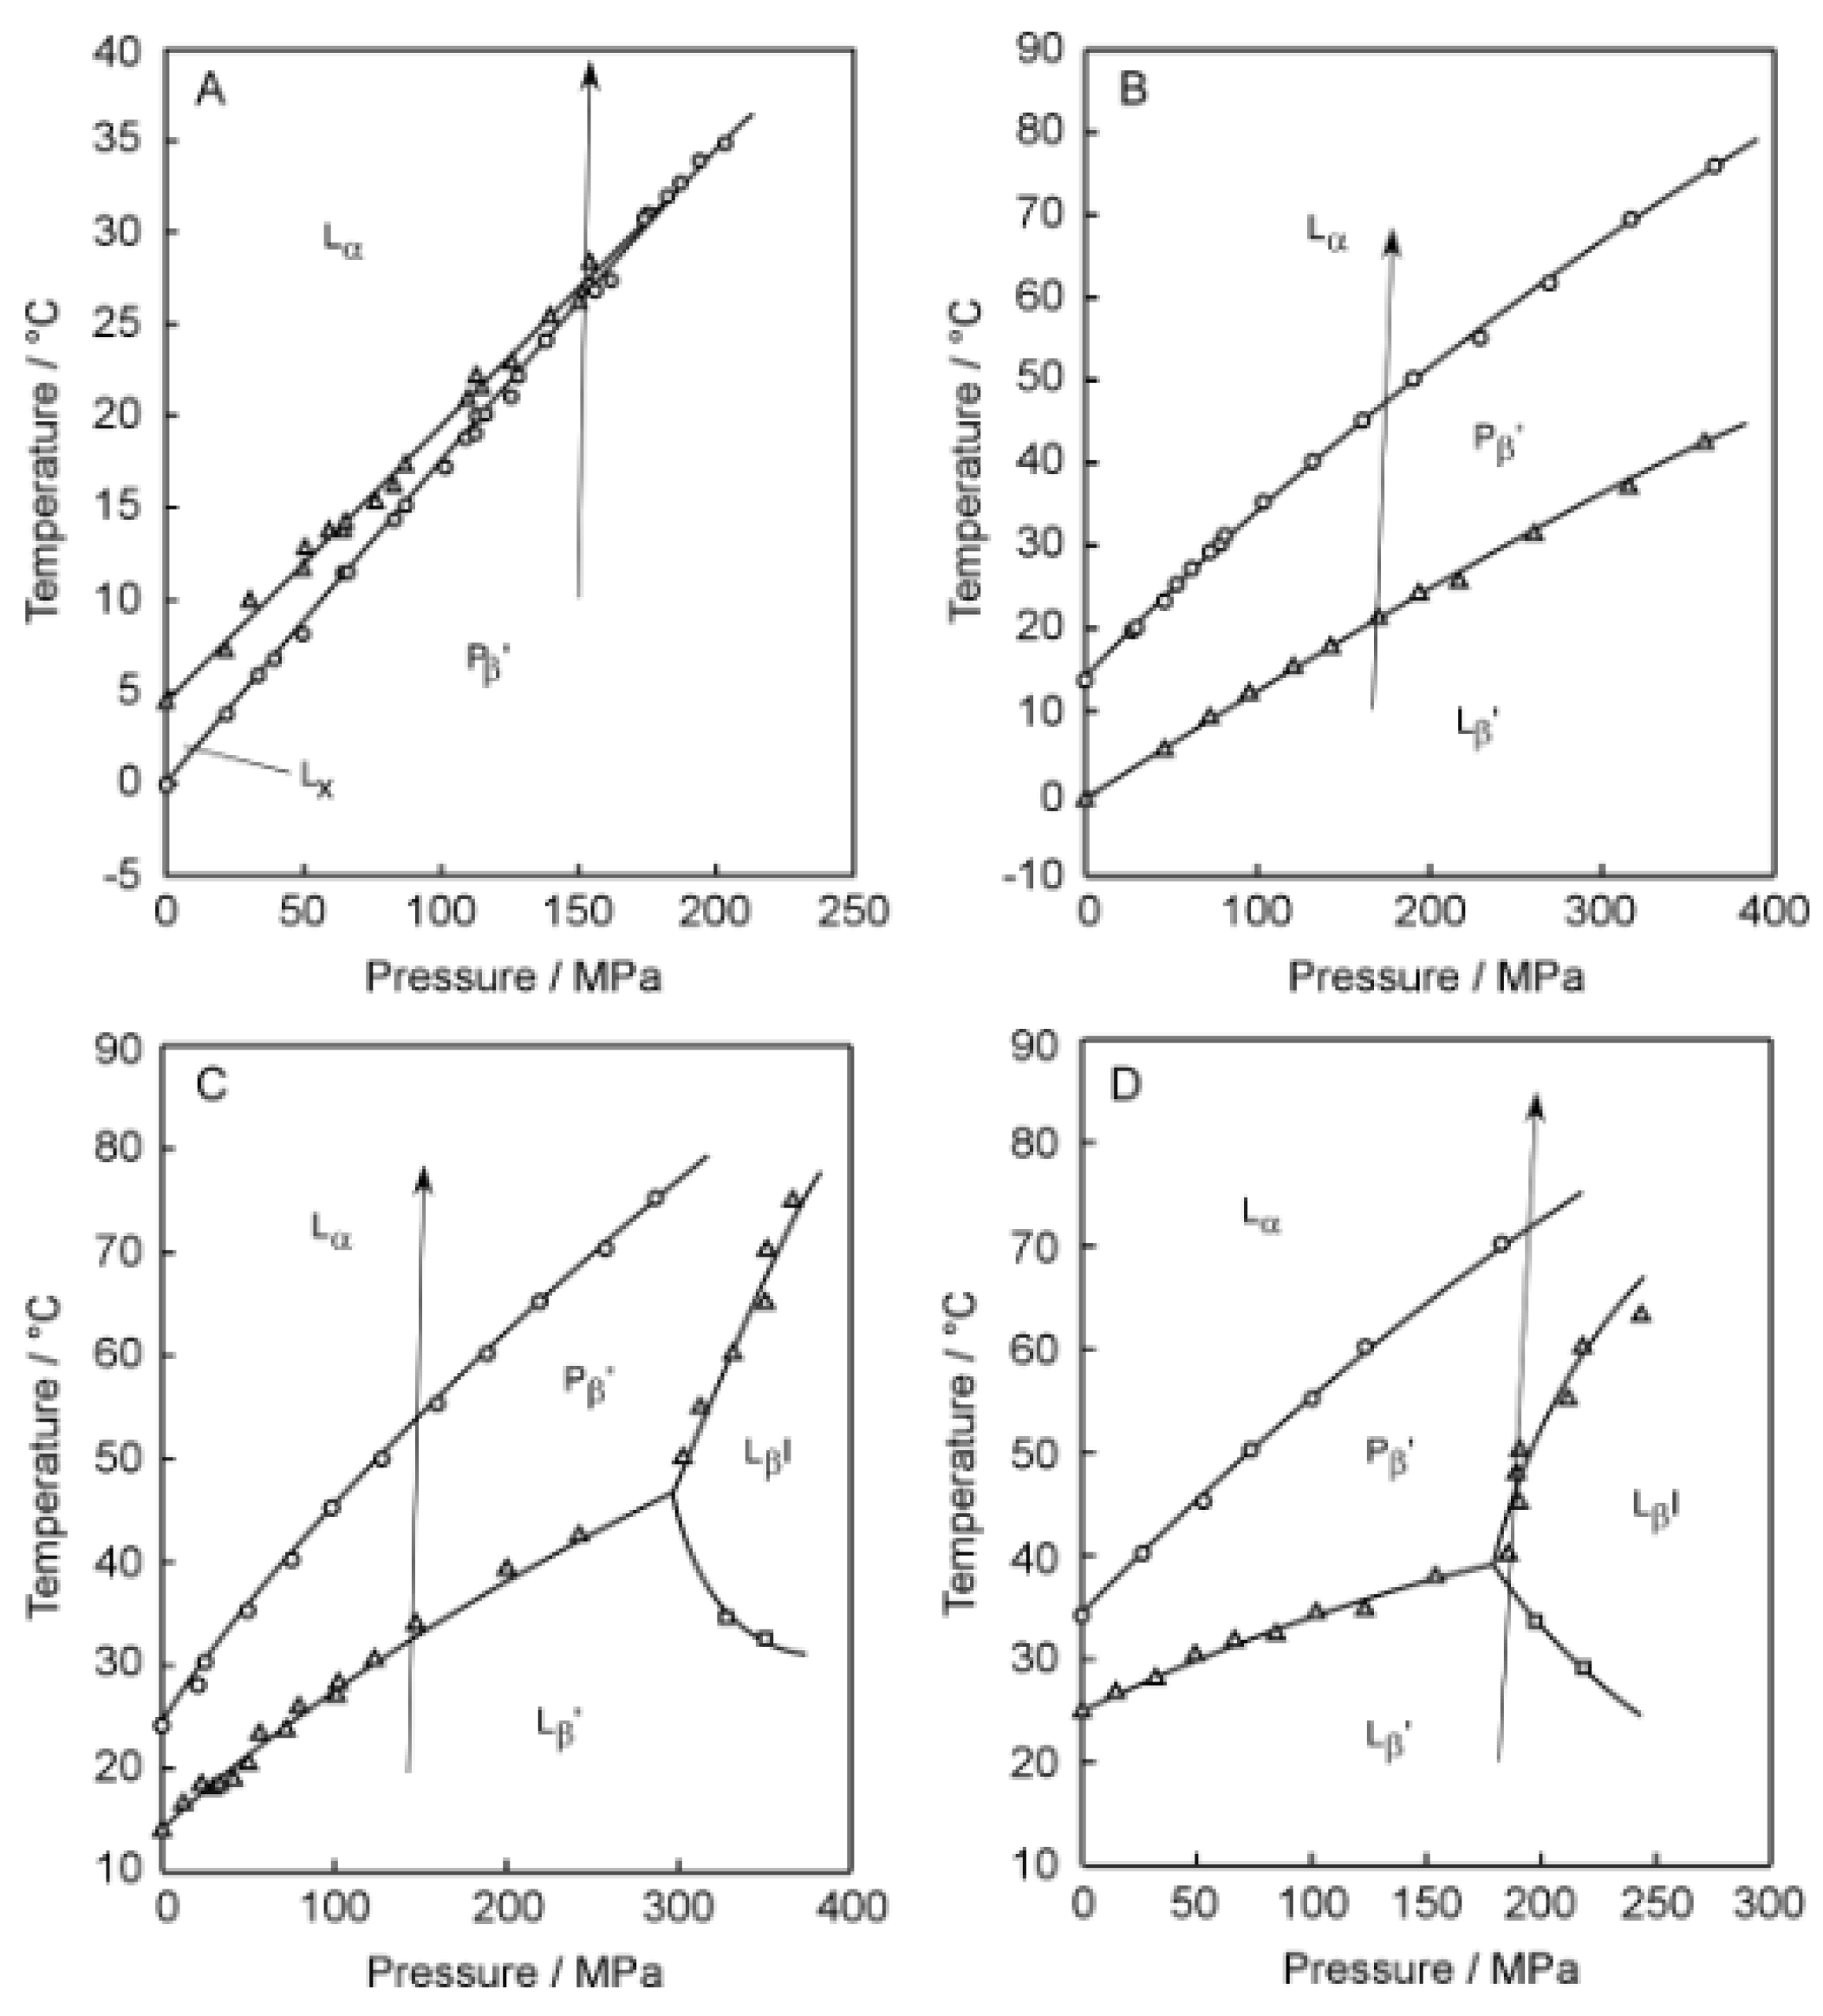
Figure 3, the
T–
P phase diagrams of the corresponding bilayer membranes are given to indicate the heating process along which the Prodan fluorescence spectroscopic observation was carried out to construct the 3D imaging plots shown in
Figure 2. Before discussing the 3D imaging plots for these C
nPC bilayer membranes, we should explain their phase behavior under high pressure on the basis of the diagrams in brief, because the C12PC and the C13PC bilayer membrane exhibit peculiar behavior, which is somewhat different from that of the other C
nPC bilayer membranes in the following two respects. First, the C12PC and the C13PC bilayer membrane do not form the interdigitated structure under high pressure [
4,
26]. As seen from the phase diagrams, this is true at least within the pressure range up to ca. 400 MPa, and there is no previous report demonstrating that the pressure-induced interdigitation occurs in these bilayer membranes above 400 MPa, as far as we know. This is probably due to relatively looser packing of the C12PC or C13PC molecules within the bilayer membrane, which is arising from the weaker hydrophobic interaction between the adjacent hydrocarbon chains. Second, the presence of another phase, generally called L
x phase, is detected during the process of the gel-to-liquid-crystalline transition in the C12PC bilayer membrane [
26,
27]. This is also true for the C13PC bilayer membrane [
28], although the temperature range within which the L
x phase is observed is extremely narrow. The bilayer membrane in this phase exhibits intermediate structural and thermodynamic features between those in the gel phase and in the liquid crystalline phase. The details have been already described in our previous study [
28] as well as in the literature cited there. These facts indicate that the packing state of the C
nPC molecules within the bilayer membrane is altered by the variation in the acyl-chain length more markedly than we envisage.
Taking these peculiarities in the bilayer phase behavior of C
nPC with shorter acyl chains into account, we performed the Prodan fluorescence spectroscopic measurements by setting a suitable heating process under high pressure for each C
nPC bilayer membrane to construct a 3D imaging plot for visualizing the change in the bilayer phase state from P
β′ to L
α for C12PC, from L
β′ to P
β′ and subsequently to L
α for C13PC and C14PC, and from L
β′ to L
βI, subsequently to P
β′ and finally to L
α for C15PC. We should note that the minimum pressure required for inducing the L
βI phase in the C14PC bilayer membrane is too high to carry out the fluorescence spectroscopic measurements, although it has already been confirmed by another optical technique applicable under such higher pressure that the interdigitation occurs in the C14PC bilayer membrane above ca. 300 MPa. For the C12PC bilayer membrane, the 3D imaging plot clearly shows the presence of a blue region around 435 nm in the temperature range below ca. 30 °C. This indicates that the C12PC bilayer membrane exists in a bilayer-gel state in this temperature range, and this is almost consistent with the phase diagram, which signifies that the phase state of the C12PC bilayer membrane below ca. 28 °C at ca. 150MPa is the P
β′ phase. However, no blue or green region can be seen above ca. 30 °C in the 3D imaging plot, although it can barely be recognized from the color gradation that SDFI becomes minimum between 480 nm and 490 nm. From this λ
min value, it would be possible to presume that the C12PC bilayer membrane exists in the L
α phase in this temperature range. However, the fact that no blue or green region was observed means that the position of the SDFI minimum is relatively obscure. Accordingly, taking this into account, the identification of the phase state on the basis of this result alone is not as accurate as in the case of the C17PC bilayer membrane, which exhibits a definite minimum around 480 nm above ca. 75 °C as shown in
Figure 1C.
Similar spectral behavior was observed in the 3D imaging plot for the C13PC and the C14PC bilayer membrane, as shown in
Figure 2B,C. That is, no blue or green region is recognized in the temperature range above the main transition temperature, whereas a blue region can be clearly seen around 435 nm below the main transition temperature. This similarity suggests that the obscurity in the position of the SDFI minimum (i.e., the absence of blue or green regions) in the temperature range above the main transition temperature arises from a common feature to these C
nPC with the relatively shorter acyl chains (i.e.,
n = 12–14). Probably, this is relevant to relatively looser molecular packing of the bilayer membrane due to the relatively weaker hydrophobic interaction between the acyl chains of the adjacent PC molecules with those shorter acyl chains. As described above in the explanation as to how the Prodan fluorescence spectroscopy works as a technique for the observation of the bilayer phase behavior, the change in the λ
min (or λ
max) value with the bilayer transition is mainly due to the migration of the Prodan molecules along the bilayer depth direction within the bilayer membrane when the transition occurs. Taking this into consideration, the obscurity in the SDFI minimum can be interpreted to indicate that the Prodan molecules can move comparatively freely in the bilayer depth direction within the range between the glycerol backbone region and the hydrophilic surface region. In other words, the relatively looser molecular packing of the bilayer membrane allows the relatively free molecular motion of Prodan in the vertical direction within the bilayer membrane and as a result, the vertical distribution of the Prodan molecules becomes relatively uniform without exhibiting any sharp peak indicative of the localization of them at a specific vertical location.
In contrast to the 3D imaging plots for the C12PC, the C13PC and the C14PC bilayer membrane, the imaging plot for the C15PC bilayer membrane (
Figure 2D) shows several relatively clear regions, which makes it easier for us to interpret the changes in the bilayer phase state with temperature. In particular, it is different from those for C
nPCs (
n = 12–14) in the respect that a greenish region was observed in the temperature range above the main transition temperature (ca. 35 °C). This difference is also explainable in terms of the change in the packing state with the elongation of the acyl chains. That is, it can be interpreted to reflect that the packing state of the bilayer membrane becomes slightly tighter with the elongation of the acyl chains by a few methylene groups. On the other hand, it still has several undesirable features with regard to the indication of the bilayer phase state. First, there is no blue or green region indicative of the L
βI phase, though the color gradation suggests that there is a local minimum around 500 nm in the temperature range from ca. 40 °C to ca. 50 °C, where the phase diagram indicates that the C15PC membrane exists in the L
βI phase. As seen from the 3D imaging plot, another local minimum of SDFI lies concomitantly at 433 nm (i.e., greenish region) in this temperature region, which suggests that a part of the Prodan molecules still remain in the vicinity of the glycerol backbone without being squeezed out toward the hydrophilic surface even after the bilayer interdigitation occurs. This may be relevant to the relatively looser packing state of the membrane; that is, relatively weaker hydrophobic interaction between the acyl chains enables a part of Prodan molecules to penetrate into the hydrophobic region between two retrorse acyl chains. Second, it is very difficult to discern the difference between the spectral features indicative of the L
β′ and P
β′ phase, although on the 3D imaging plot the two blue regions of these phases are separated by the presence of the region of the L
βI phase. This is true also for the 3D imaging plot for the C13PC and the C14PC bilayer membrane, where it seems that there is only one blue region because the two regions of the L
β′ and P
β′ phase are continuous. This obscurity arises from a significant disadvantage that Prodan inherently possesses: it is not so sensitive to the change in the bilayer phase state from L
β′ to P
β′, which produces no or a very slight difference in the λ
min (or λ
max) value (at most ca. 3 nm). Therefore, we should consider that it is virtually impossible to distinguish the bilayer phase states of L
β′ and P
β′ only on the basis of the 3D imaging plot. Note that this does not mean the inability of Prodan to detect the difference between the bilayer phase states of L
β′ and P
β′. We can determine the pretransition point correctly by taking slight differences in the fluorescence intensity and the lineshape of the spectrum into consideration to analyze the Prodan fluorescence spectra in more detail [
9].
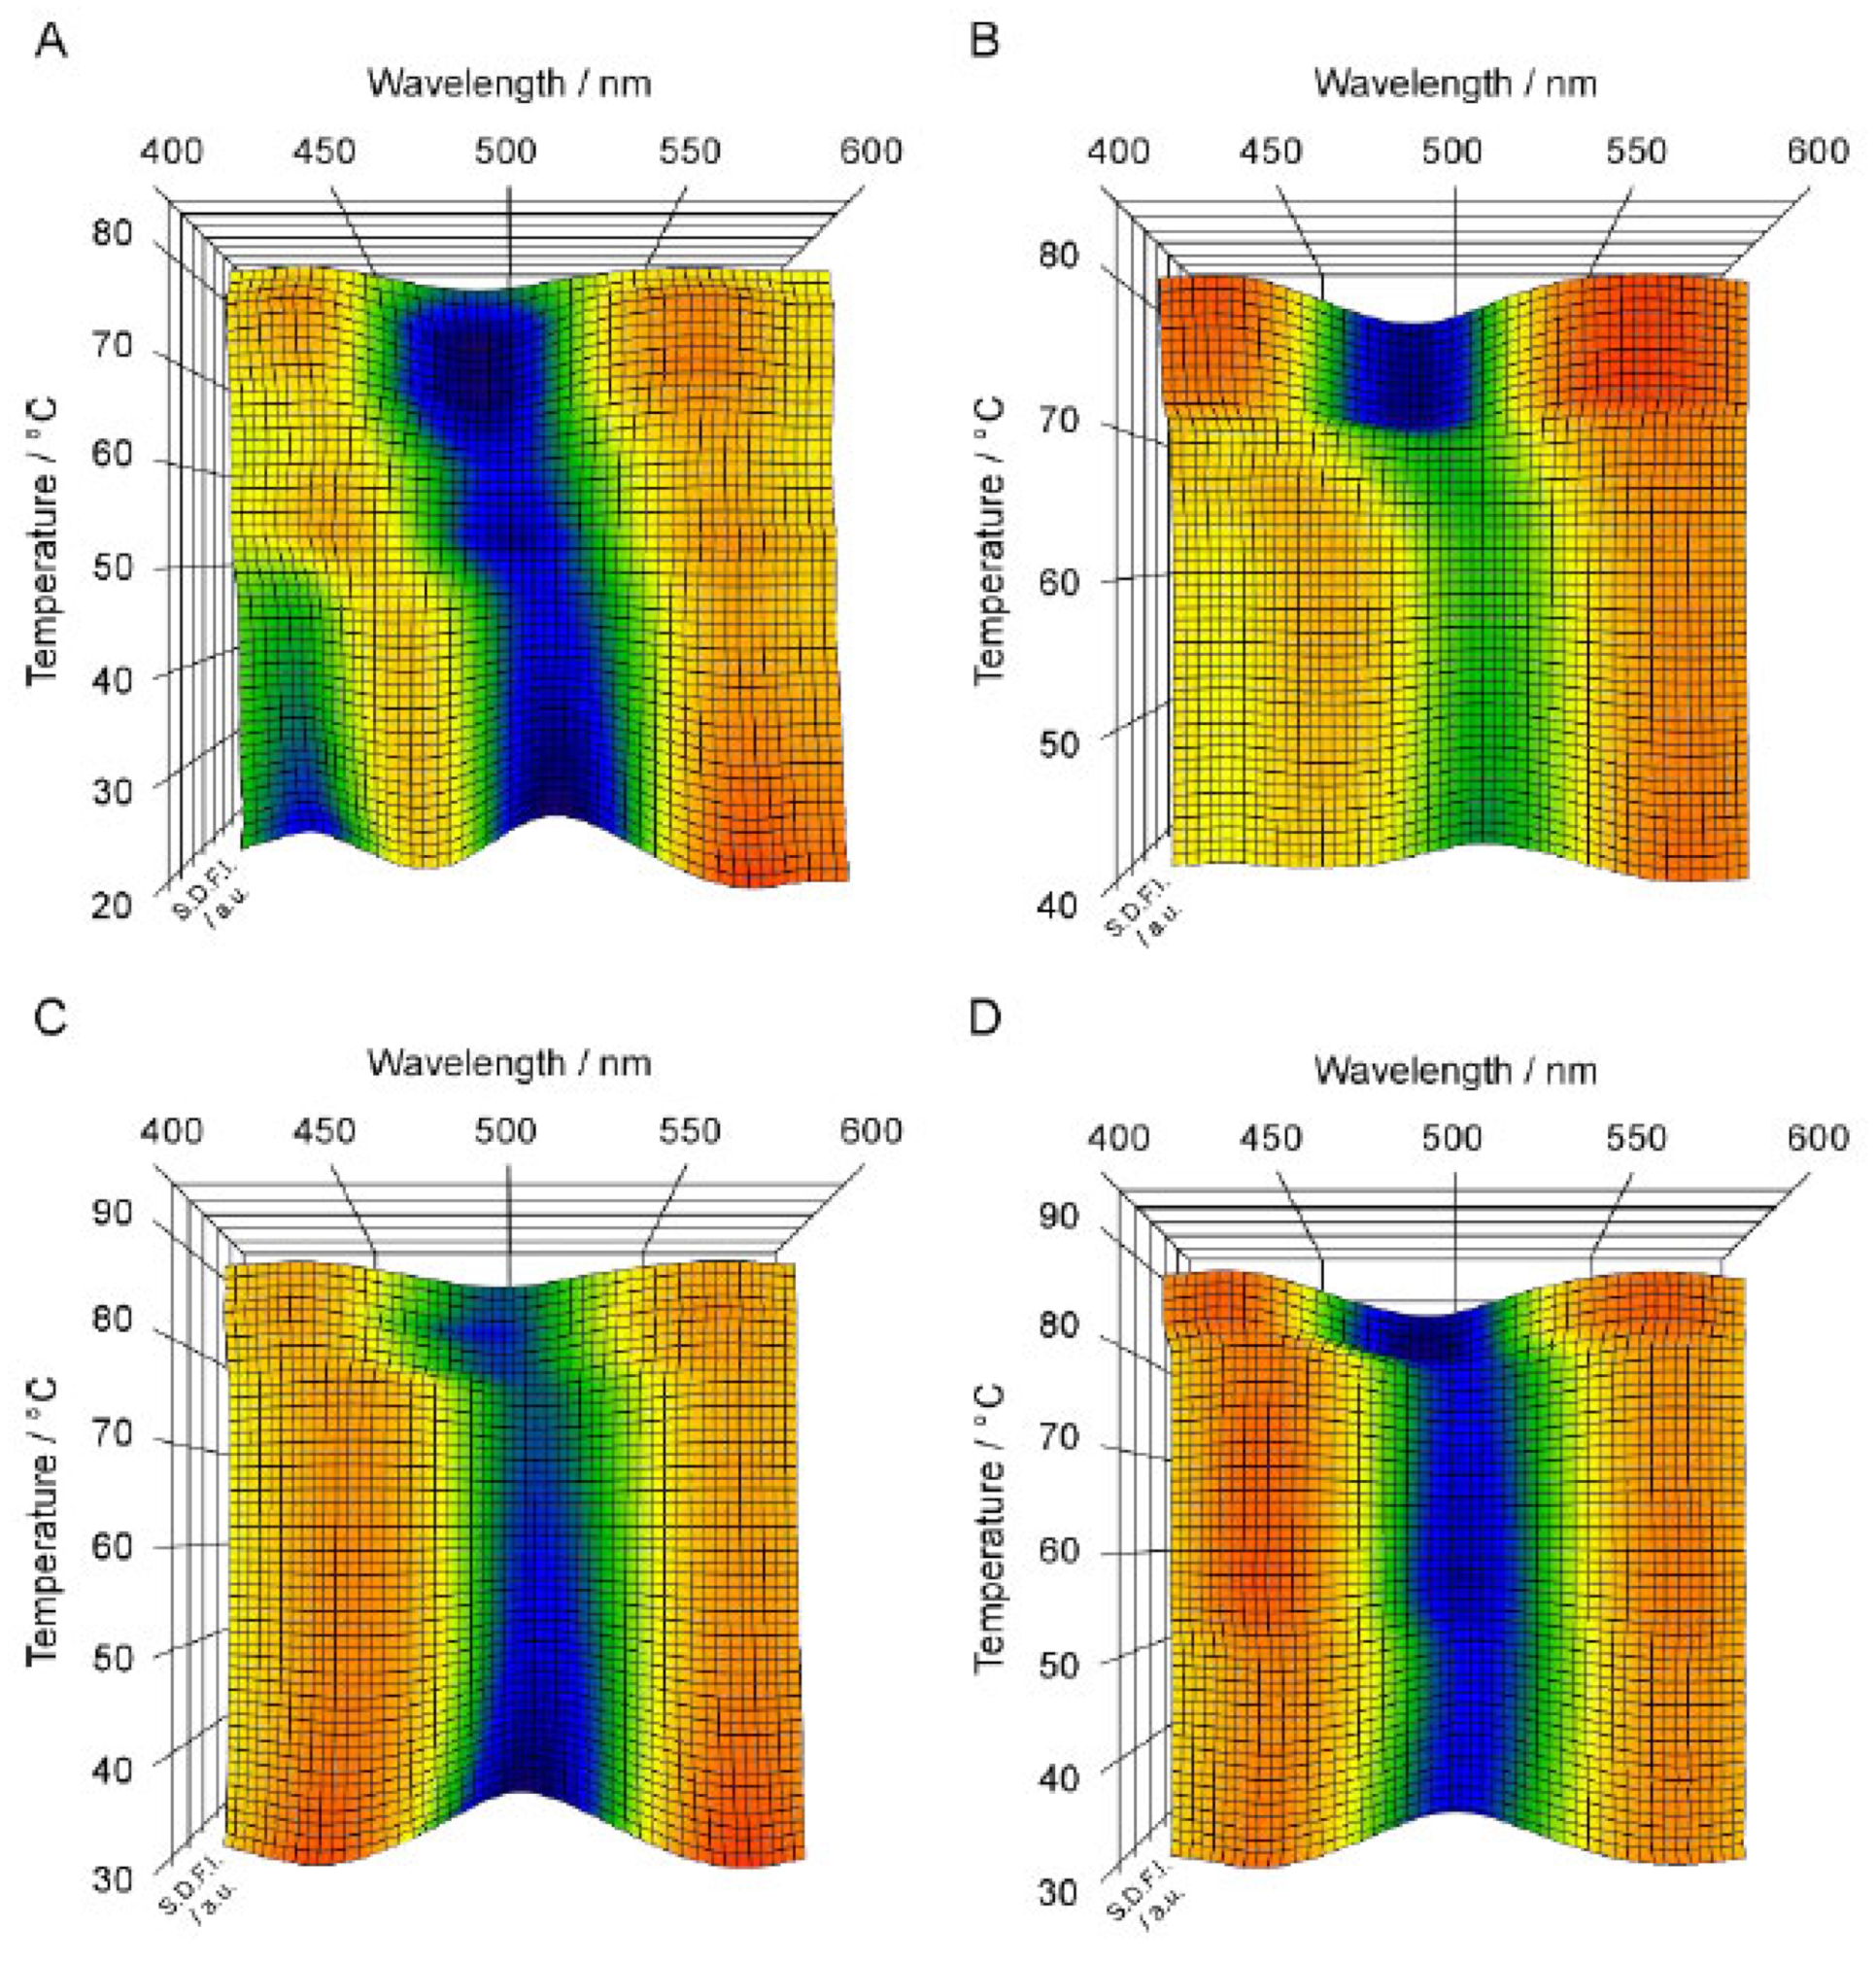
Figure 4A–D and
Figure 5A–D show the 3D imaging plots for the C
nPC bilayer membrane with relatively longer acyl chains (i.e.,
n = 19–22) as well as the
T–
P phase diagrams for the indication of the heating process, respectively. Here, we should note that only the C22PC bilayer membrane exhibits peculiarly different phase behavior as compared to that of the other C
nPC bilayers: it forms the interdigitated structure under atmospheric and high pressure at relatively lower temperatures and undergoes only one transition from the L
βI phase to L
α phase in the heating process [
29,
30]. It should be also noted that the sequence of the phases that we observed is somewhat different because of the shrinkage of the P
β′ phase region with the increase in the acyl chain length as follows: L
β′, L
βI, P
β′ and L
α for C19PC and C20PC; L
β′, L
βI, and L
α for C21PC; and L
βI and L
α for C22PC. As is obvious from
Figure 4, the overall appearance of the 3D imaging plots for the C
nPC bilayer membranes with longer acyl chains (
n = 19–22) is evidently different from the results for the C
nPC bilayer membranes with shorter acyl chains (
n = 12–15): clear blue or green regions appear irrespective of the phase sequence in the whole temperature range measured in the imaging plots for the longer C
nPC bilayer membranes whereas the orange area is relatively vast as a whole for the shorter C
nPC bilayer membranes. This suggests that Prodan has a good ability to detect the change in the packing state of the bilayer membranes arising from the elongation of the acyl chains.
A notable feature of the 3D imaging plot for the C19PC bilayer membrane is, as seen from
Figure 4A, that two local minima are observed as clear blue regions at ca. 430 nm and at ca. 510 nm in the temperature range of the L
β′ phase. The former λ
min value is indicative of the L
β′ phase, but no bilayer phase state is known to be indicated by the latter λ
min value. Since this λ
min value is apparently greater than that for the L
βI phase (i.e., ca. 500 nm), it is thought to arise from the Prodan molecules present in a more hydrophilic environment. This means that the λ
min value of 510 nm indicates the possibility that the Prodan molecules are excluded to the interbilayer water phase near the bilayer surface, and thus means that it is not directly relevant to a certain specific bilayer phase state. Our previous study [
22] has demonstrated that a similar tendency is observed for the C18PC bilayer membrane. However, the SDFI at ca. 510 nm was apparently lower than that at ca. 430 nm, which is definitely different from the result for the C19PC bilayer membrane. Taking this into account, the exclusion of the Prodan molecules from the bilayer membrane is considered to result from the tighter packing state of the longer-chain C
nPC bilayer membrane; that is, the increase in the packing density brought about by the elongation of the acyl chains makes it harder for the Prodan molecules to transfer themselves into the bilayer membrane. This tendency is confirmed more markedly in the 3D imaging plots for the C20PC and the C21PC bilayer membrane, which display no blue or green region at ca. 430 nm but show a clear blue region around 510 nm in the temperature range where the bilayer membrane exists in the L
β′ phase (
Figure 4B,C). This indicates that the tighter molecular packing of the bilayer membrane due to the further increase in the acyl chain length hamper the incorporation of the Prodan molecules into the bilayer membrane more strongly, and as a result, almost all Prodan molecules are finally excluded from the bilayer membrane at the acyl chain length of 21. This means that the Prodan fluorescence spectroscopy is not suitable for the observation of the behavior of the L
β′ and the P
β′ phase for the longer C
nPC bilayer membranes (
n = 19–21).
In contrast to this disadvantageous feature, Prodan can detect the bilayer phase states of L
βI and L
α sensitively for these longer C
nPC bilayer membranes (
n = 19–22), as is obvious from the fact that each imaging plot shown in
Figure 4 clearly shows a blue or green region around 500 nm in the temperature range of the L
βI phase and a blue region at 490–500 nm in the temperature range of L
α region. It is especially interesting that the imaging plots for the C19PC, the C20PC and the C21PC bilayer membrane clearly show the changes in the bilayer phase state from L
β′ (at ca. 510 nm) to L
βI (at ca. 500 nm) and finally to L
α (at ca. 490 nm) as the change in the location of the blue or green region, except for the P
β′ phase that should appear in the middle of this heating process for the C19PC and the C20PC bilayer membrane. As described above, the blue region at ca. 510 nm indicates that almost all Prodan molecules exist in the interbilayer water phase. Therefore, this consecutive change in the location of the blue region means that the Prodan molecules moves from the outside of the bilayer membrane into the bilayer membrane to be localized at specific vertical positions for the bilayer phase states of L
βI and L
α, namely the hydrophilic surface region and the region near the phosphate group, when the bilayer membrane undergoes the transitions from L
β′ to L
βI, (P
β′) and L
α in sequence. Judging from this migration behavior of the Prodan molecules, it seems reasonable to speculate that the Prodan molecules excluded from the bilayer membrane in the L
β′ state are not dispersed randomly throughout the interbilayer water phase, but rather are localized in the vicinity of the bilayer surface, which enables the almost all Prodan molecules to move quickly into the bilayer membrane at the transition from the L
β′ phase to the L
βI phase. It is unfortunate that the behavior of the Prodan molecules in the bilayer membrane in the P
β′ state was not captured by the 3D imaging plots for the C19PC and the C20PC bilayer membrane. This may be due to the fact that the temperature range where the bilayer membrane can exist in the P
β′ state was too narrow to observe the spectral feature specific for the P
β′ phase, but it is hardly expected that the λ
min value of 430–440 nm will be obtained for the P
β′ state of the C19PC and the C20PC bilayer membrane because there is a strong tendency for the Prodan molecules to be excluded from the bilayer membrane in the gel state.
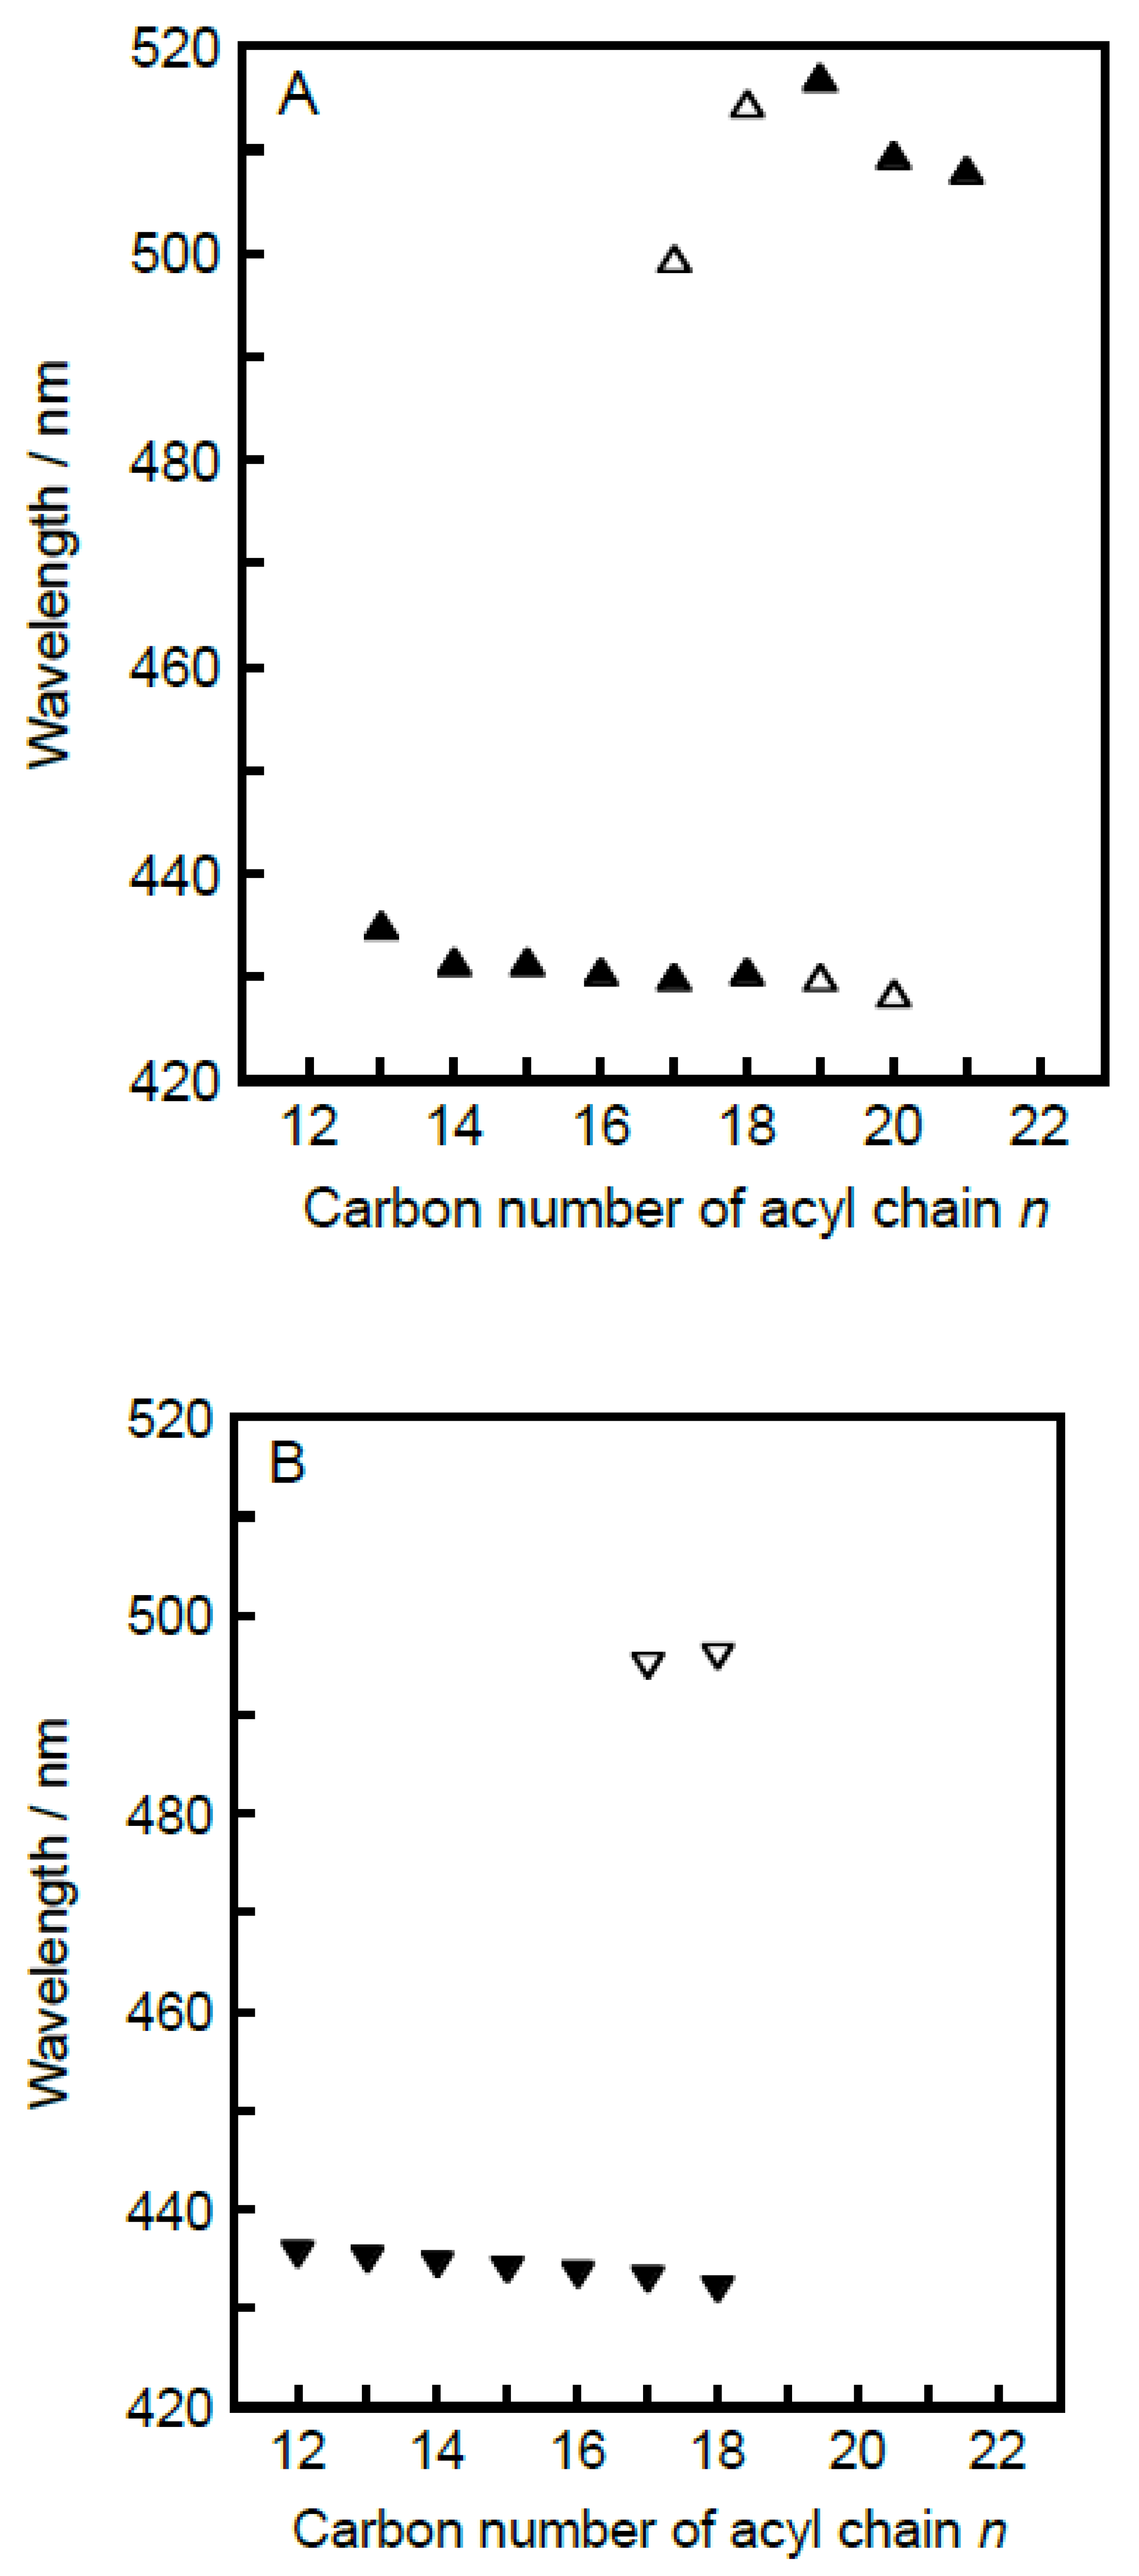
3.3. Acyl-Chain Length Dependence of λmin Value Characteristic for Each Bilayer Phase
To make it clear how the spectral features that Prodan exhibits as a membrane probe change with the variation in the acyl-chain length of the constituent C
nPC molecules, the λ
min values characteristic for respective bilayer phase states were plotted against the acyl-chain length
n in
Figure 6. Several rough tendencies can be seen on the whole in the acyl-chain length dependence of the λ
min values, which provides us with significant information about the applicability of the Prodan fluorescence spectroscopy to the observation of the bilayer phase behavior of C
nPCs. First, we look at the λ
min behavior relating to the bilayer gel phases, shown in
Figure 6A,B. In many of our previous studies using the Prodan fluorescence technique [
9,
13,
14,
17,
22,
24,
25], we have regarded the λ
min (or λ
max) value of 430–440 nm as a wavelength characteristic for the bilayer phase state of L
β′, L
β or P
β′(i.e., bilayer gel state).
Figure 6A,B demonstrates that this rule is applicable to the C
nPC bilayer membrane in the case of
n ≤ 20, though the λ
min value of ca. 430 nm was obtained from a minor peak for
n = 19 or 20. On the other hand, this rule is not applicable to the C
nPC bilayer membrane with
n = 21 or 22. With regard to the latter case (i.e.,
n = 22), it is of little significance to discuss this inapplicability, because the phase is different: the C22PC bilayer membrane does not exist in the L
β′ or P
β′ state below the main-transition temperature but does in the L
βI state even at the atmospheric pressure, as mentioned above. Therefore, there is no plot at
n = 22 in
Figure 6A,B. Taking this into account, we may consider that it is only for C21PC that the above rule is not valid. As described above, this invalidity is presumed to result from relatively tighter molecular packing of the C21PC bilayer membrane in the gel state: the enhancement of the hydrophobic interaction between the adjacent acyl chains with increasing acyl-chain length brings about the tighter molecular packing, which causes almost all the Prodan molecules to be excluded from the bilayer membrane. This means that the bilayer phase behavior of C21PC cannot be suitably observed by the Prodan fluorescence technique.
As a second feature, the λmin value for the bilayer gel-states tends to decrease very slightly with increases in the acyl-chain length in the n-range of 12–20, which implies that the local environment around individual Prodan molecules becomes slightly more hydrophobic as the acyl chain increases in length. In addition, the second peak appearing as a minor peak at ca. 510 nm for n ≥ 17 becomes more pronounced with increasing in the acyl-chain length: it turns to the main peak at n = 19 and finally it only remains as a main peak at n = 21. These two tendencies can be explained by supposing the so-called exclusion effect, though they may seem inconsistent with each other. As already described above, the appearance of the minor peak at ca. 510 nm suggests that a certain amount of Prodan molecules are present near the bilayer surface region in the bulk water phase. Thus, the latter tendency indicates that more Prodan molecules tend to be squeezed out from the bilayer membrane as the molecular packing state of the bilayer membrane in the gel state becomes tighter with increasing acyl-chain length (n ≥ 17). The former tendency is also explainable in terms of the exclusion effect as follows. This exclusion effect is expected to work not only on the Prodan molecules but also on the water molecules existing around the headgroups of the CnPC molecules. Taking this into consideration, the exclusion effect could also cause a reduction in the number of the water molecules that can come closer to the glycerol backbone region, where most Prodan molecules are presumed to be localized within the gel-state bilayer membrane. Eventually, the local environment around the headgroup region inside the gel-state bilayer membrane would be somewhat less hydrophilic with increasing acyl-chain length.
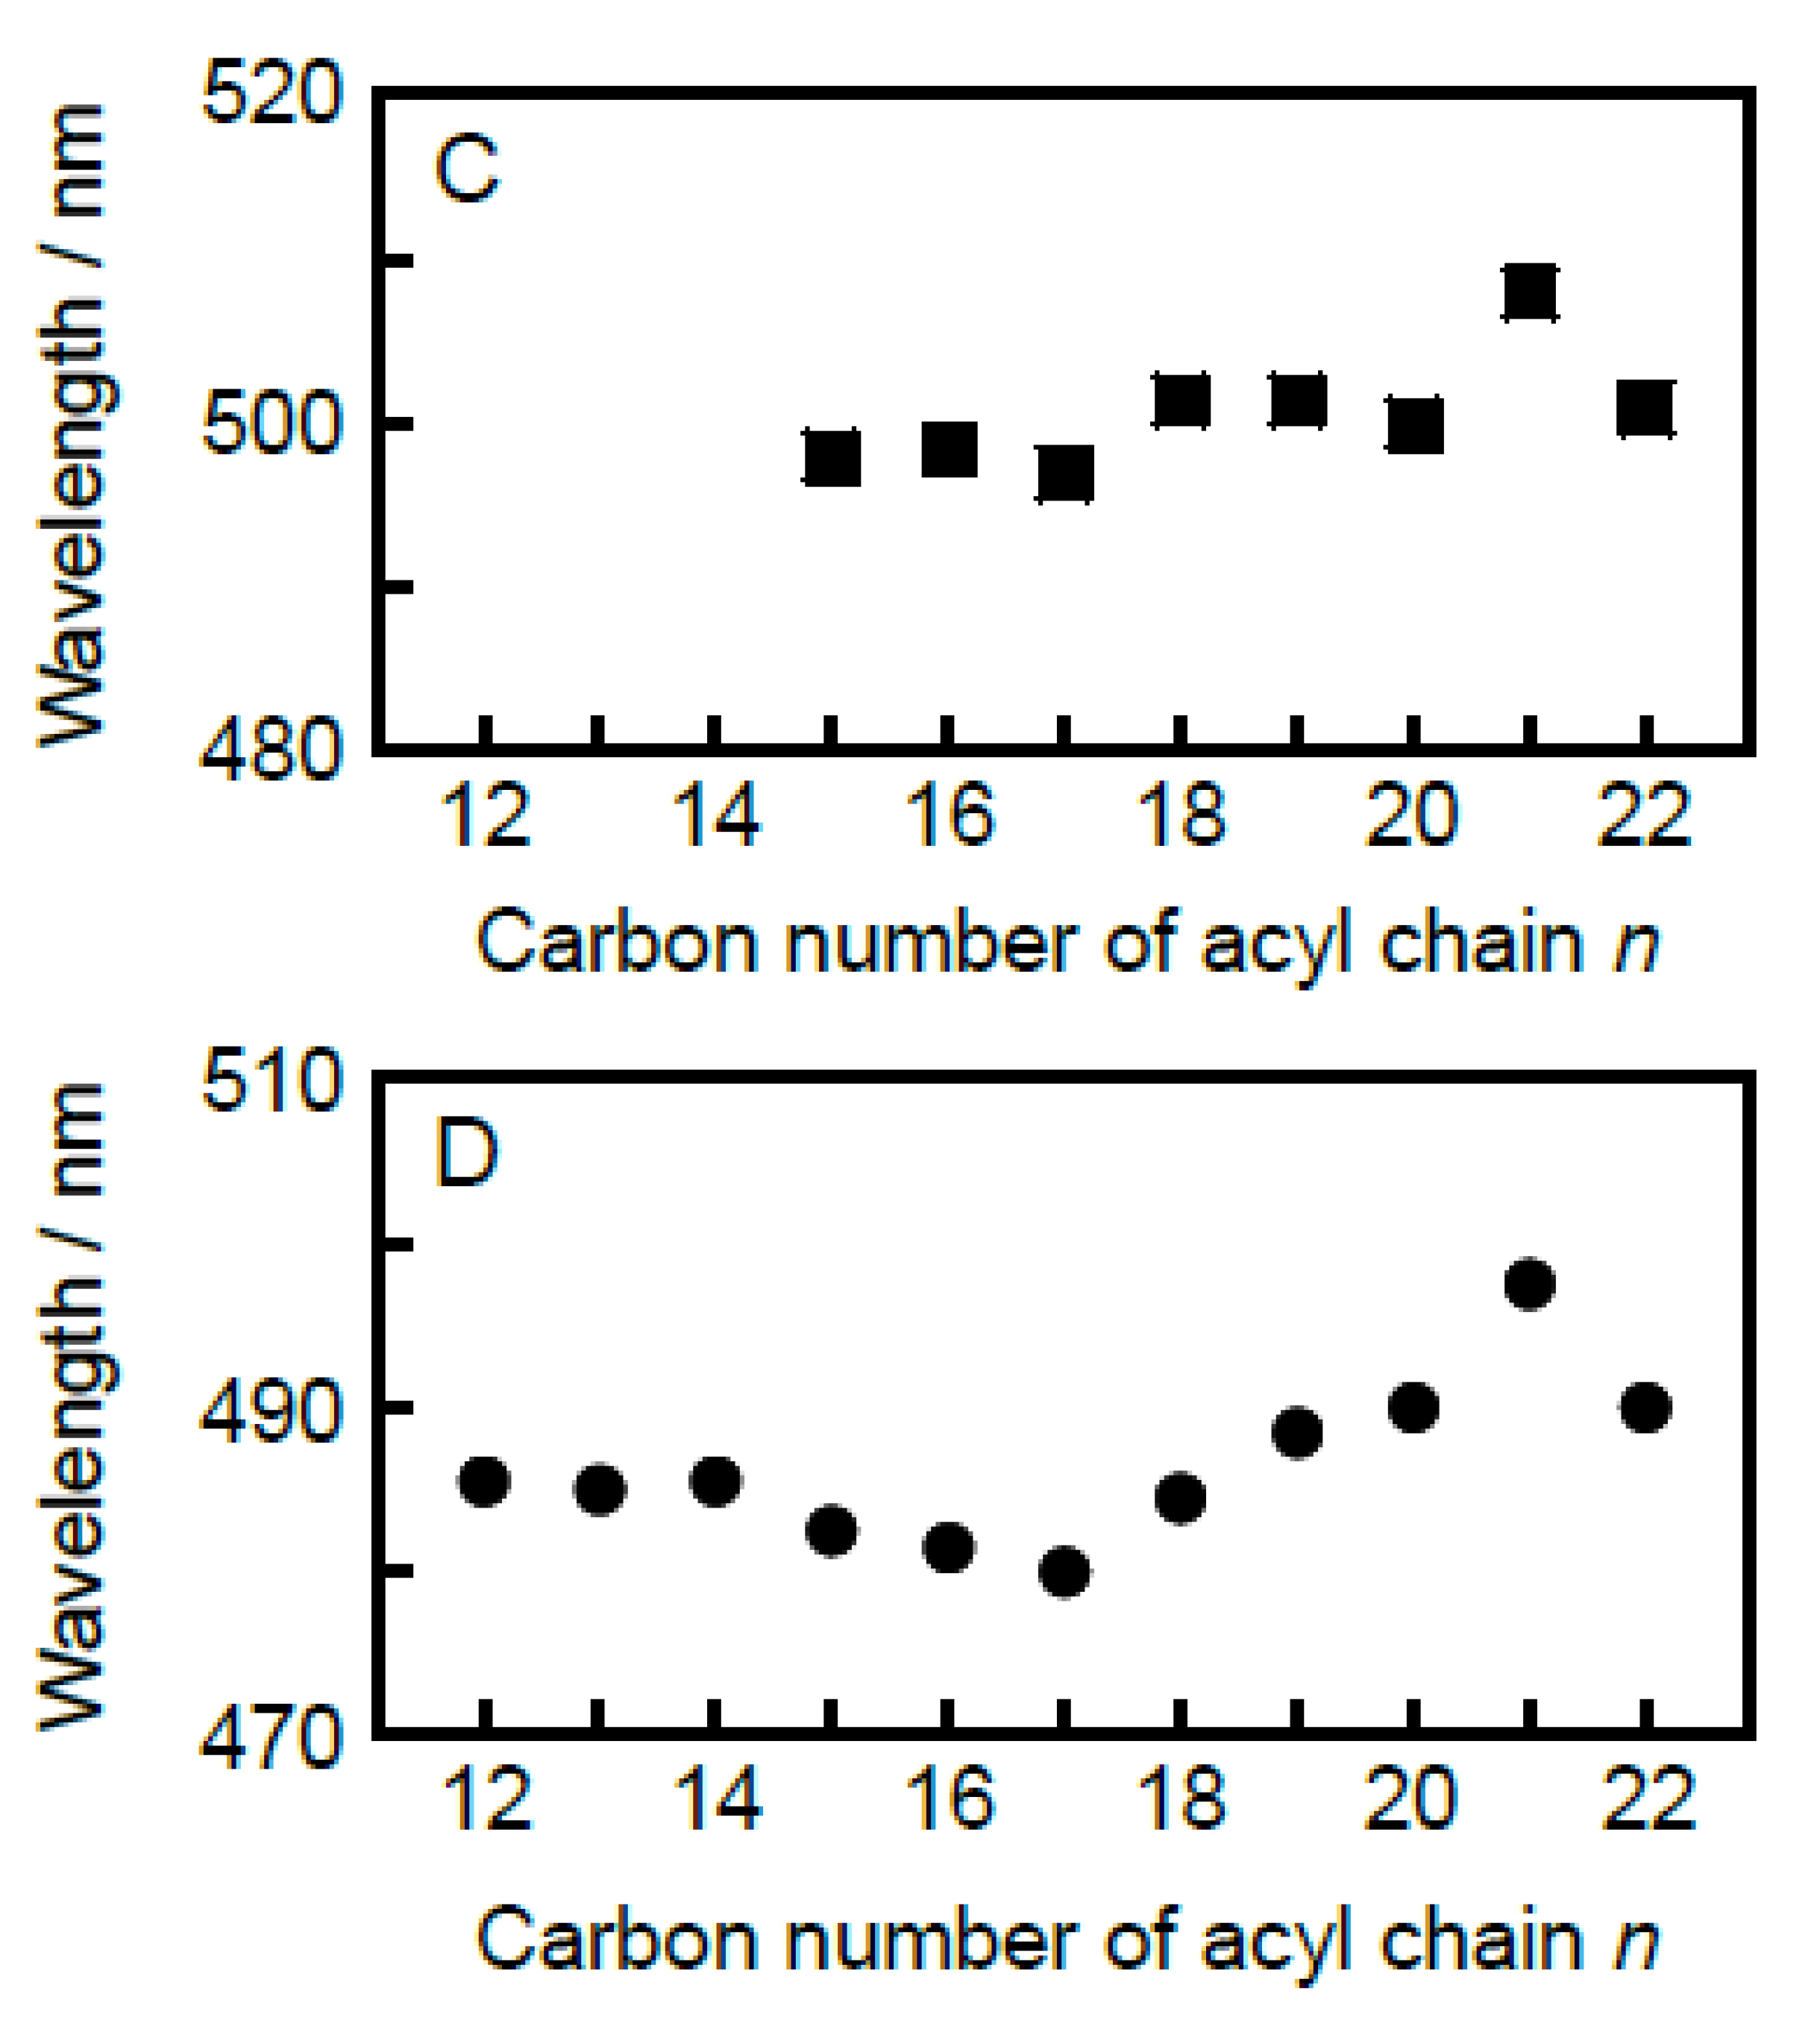
In the last place, we discuss the behavior of Prodan molecules within the bilayer membrane in the L
α or the L
βI state. As seen from
Figure 6C,D, the λ
min (or λ
max) value of 480–490 nm and that of ca. 500 nm can be regarded as a wavelength characteristic of the L
α within the
n-range of 12–22 and of the L
βI phase within the
n-range of 15–22, respectively, though both λ
min values at
n = 21 are somewhat high. In particular, no significant
n-dependence of the λ
min value is found for the L
βI phase (
Figure 6C), suggesting that the behavior of the Prodan molecules within the membrane with the interdigitated structure is hardly affected by the change in the length of the acyl chains. This is quite reasonable, because the Prodan molecules are pushed out to the membrane surface region near the bulk water phase by the alternately interpenetrated acyl chains as the bilayer interdigitation occurs. As for the λ
min value for the L
α phase,
Figure 6D suggests that the
n-dependence of λ
min comprises at least two mutually opposing effects: the value decreases slightly with increasing achy-chain length up to
n = 17, but it conversely increases with increasing achy-chain length at
n ≥ 17. This biphasic
n-dependence is also explainable on the basis of the same concept as is applied to speculate on the behavior of the Prodan molecules within the gel-state bilayer membrane. That is, the tighter packing state arising from the increase in the acyl-chain length will cause the reduction in the number of the water molecules around the headgroups of the C
nPC molecules, which can give rise to the slight decrease in the λ
min value with increasing acyl-chain length up to
n = 17. Meanwhile, as the acyl chain further increases in length, the exclusion effect will be also exerted on the Prodan molecules themselves, and as a result, the most probable vertical location of the Prodan molecules within the bilayer membrane shifts more or less toward the outside of the bilayer membrane (i.e., more hydrophilic region), which brings about a slight increase in the λ
min value. It should be noted that the original spectra, as shown in
Figure 2, exhibit a comparatively broad peak with comparatively low intensity for the L
α-state bilayer membrane of C
nPC with relatively shorter acyl chains (i.e.,
n = 12–15). Taking this into account, it might be better for us not to emphasize the significance of the tendency for the λ
min value to decrease with increasing acyl-chain length in the
n-range below 17.
It is also interesting to note that the n value at which the reversal in the n-dependence of λmin for the Lα phase occurs agrees with the n value at which the minor peak at ca. 510 nm begins to be observed for the gel-state bilayer membrane. In our speculation, as already described repeatedly, these spectral features of the Prodan fluorescence arise from the same origin: Prodan molecules begin to be excluded from the bilayer membrane at n = 17. Taking this into account, this agreement seems to support the consistency of our speculation, but we should consider the origin of the exclusion effect more carefully. If our speculation is true, this agreement means that the Prodan molecules tend to be excluded from the bilayer membrane irrespective of the bilayer phase states, namely either Lα phase or Lβ′ (or Pβ′) phase, when the acyl-chain length exceeds 17. In the case of the bilayer-gel state, it is understandable that the spatial restriction due to tighter packing state with increasing acyl-chain length will cause the exclusion effect. On the other hand, considering the fact that the packing density of the bilayer membrane in the Lα state is intrinsically loose as compared to that of the gel-state bilayer membrane, it does not seem probable that the spatial restriction will similarly cause the exclusion effect on the Prodan molecules in the Lα-state bilayer membrane within the same range of the acyl-chain length. However, as seen from the change in color of the Lα region on the 3D imaging plot with the increase in the acyl-chain length, the peak position becomes more obvious and the peak intensity becomes higher as the acyl-chain length increases, which indicates that the vertical location of the Prodan molecules within the bilayer membrane tends to be fixed. Taking this tendency into account, the packing density of the CnPC bilayer membrane with relatively longer acyl chains (n ≥ 17) may be tight enough, even in the Lα state, to produce the exclusion effect, when it is looked at from the viewpoint of the molecular behavior of Prodan. In order to clarify this experimentally, more detailed thermodynamic and structural investigation on the behavior of the Prodan molecules within the bilayer membrane is required.


