
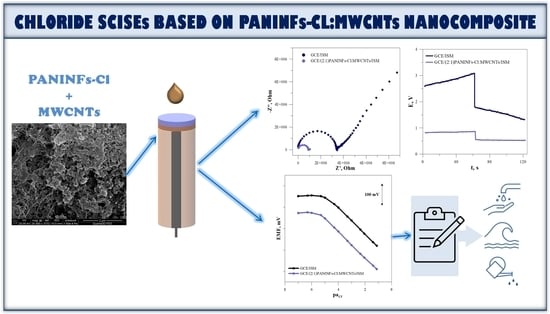
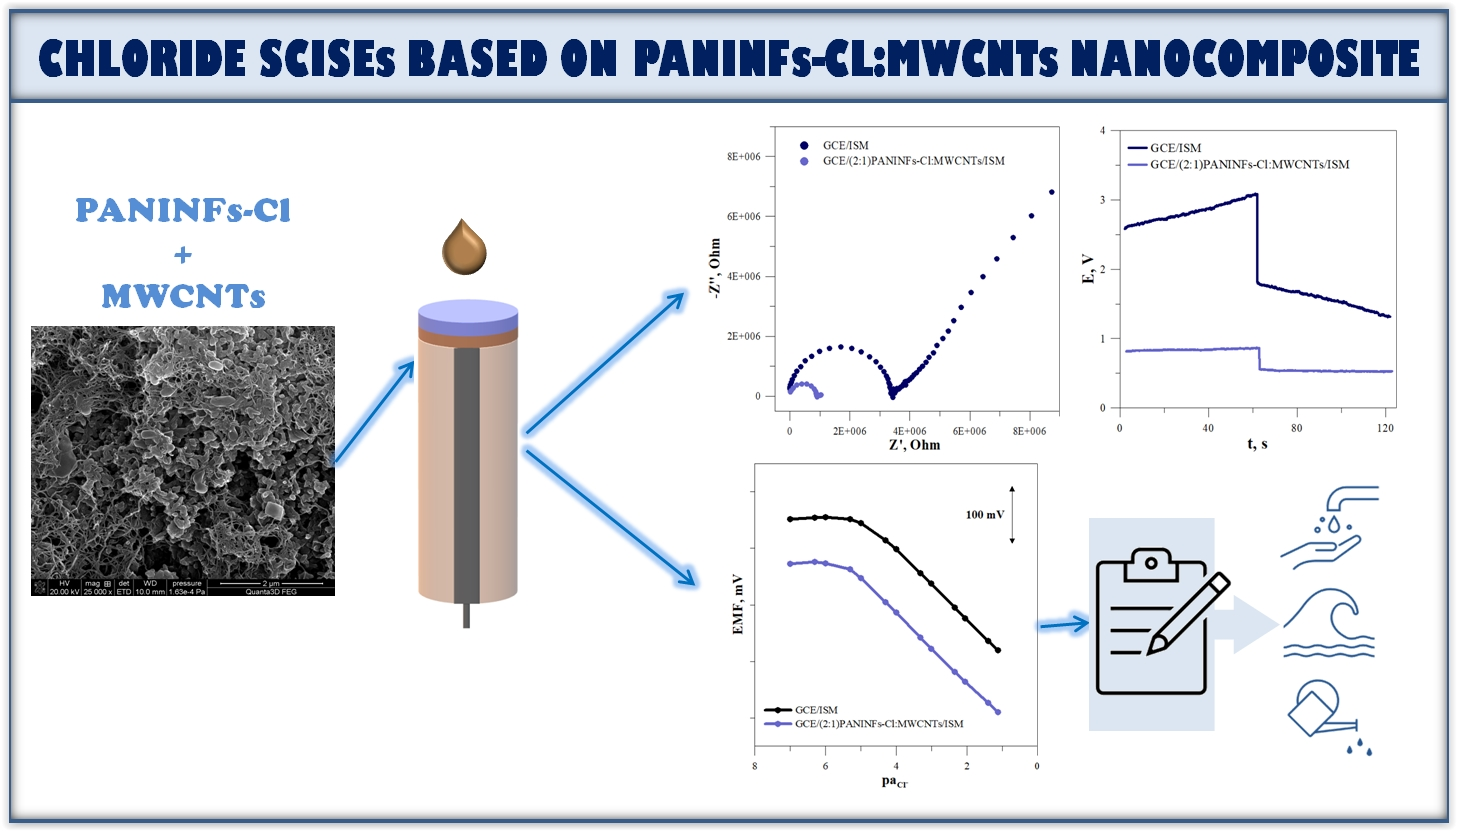
Chloride Ion-Selective Electrode with Solid-Contact Based on Polyaniline Nanofibers and Multiwalled Carbon Nanotubes Nanocomposite

Abstract
:
1. Introduction
2. Materials and Methods
2.1. Apparatus
2.2. Reagents
2.3. Preparation of Intermediate Solid-Contact Layers
2.4. Preparation of the Ion-Selective Membrane
2.5. Preparation of Solid-Contact Ion-Selective Electrodes
3. Results and Discussion
3.1. Characterization of Solid-Contact Materials
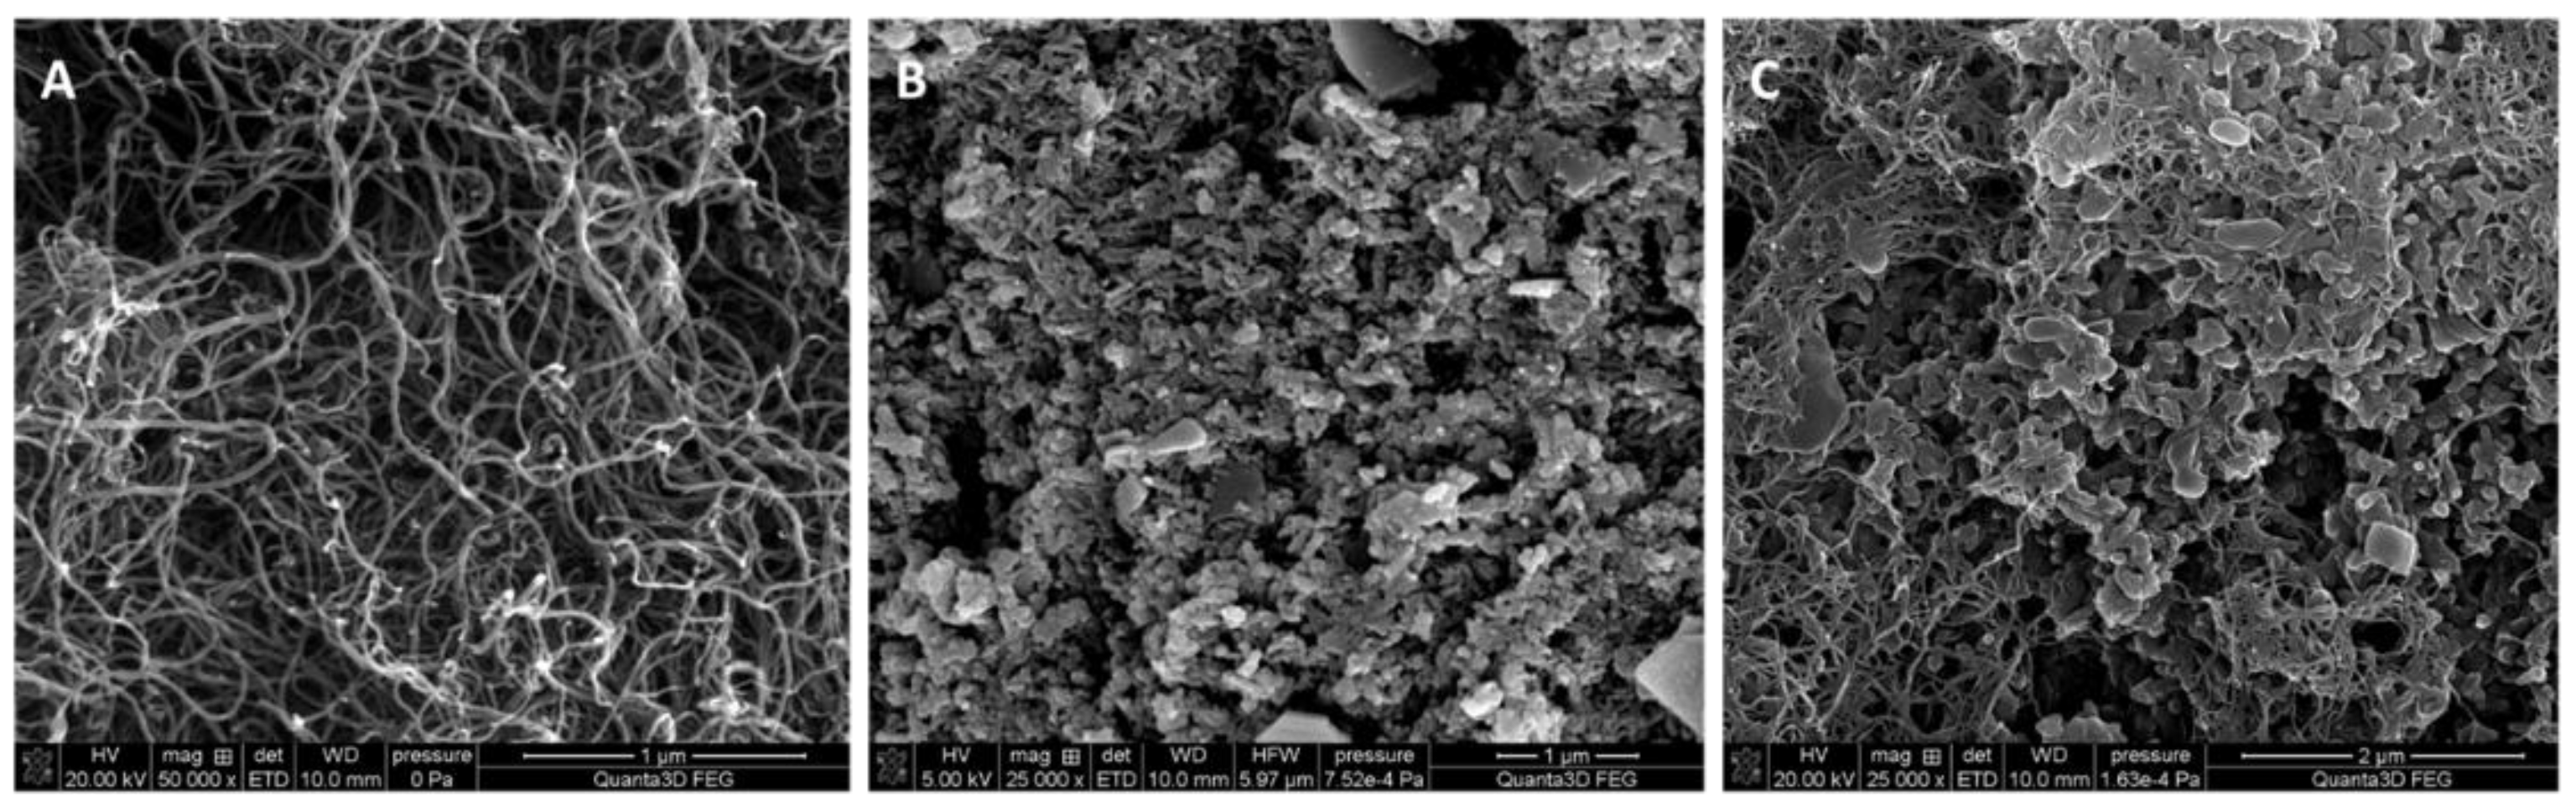
3.1.1. SEM Images
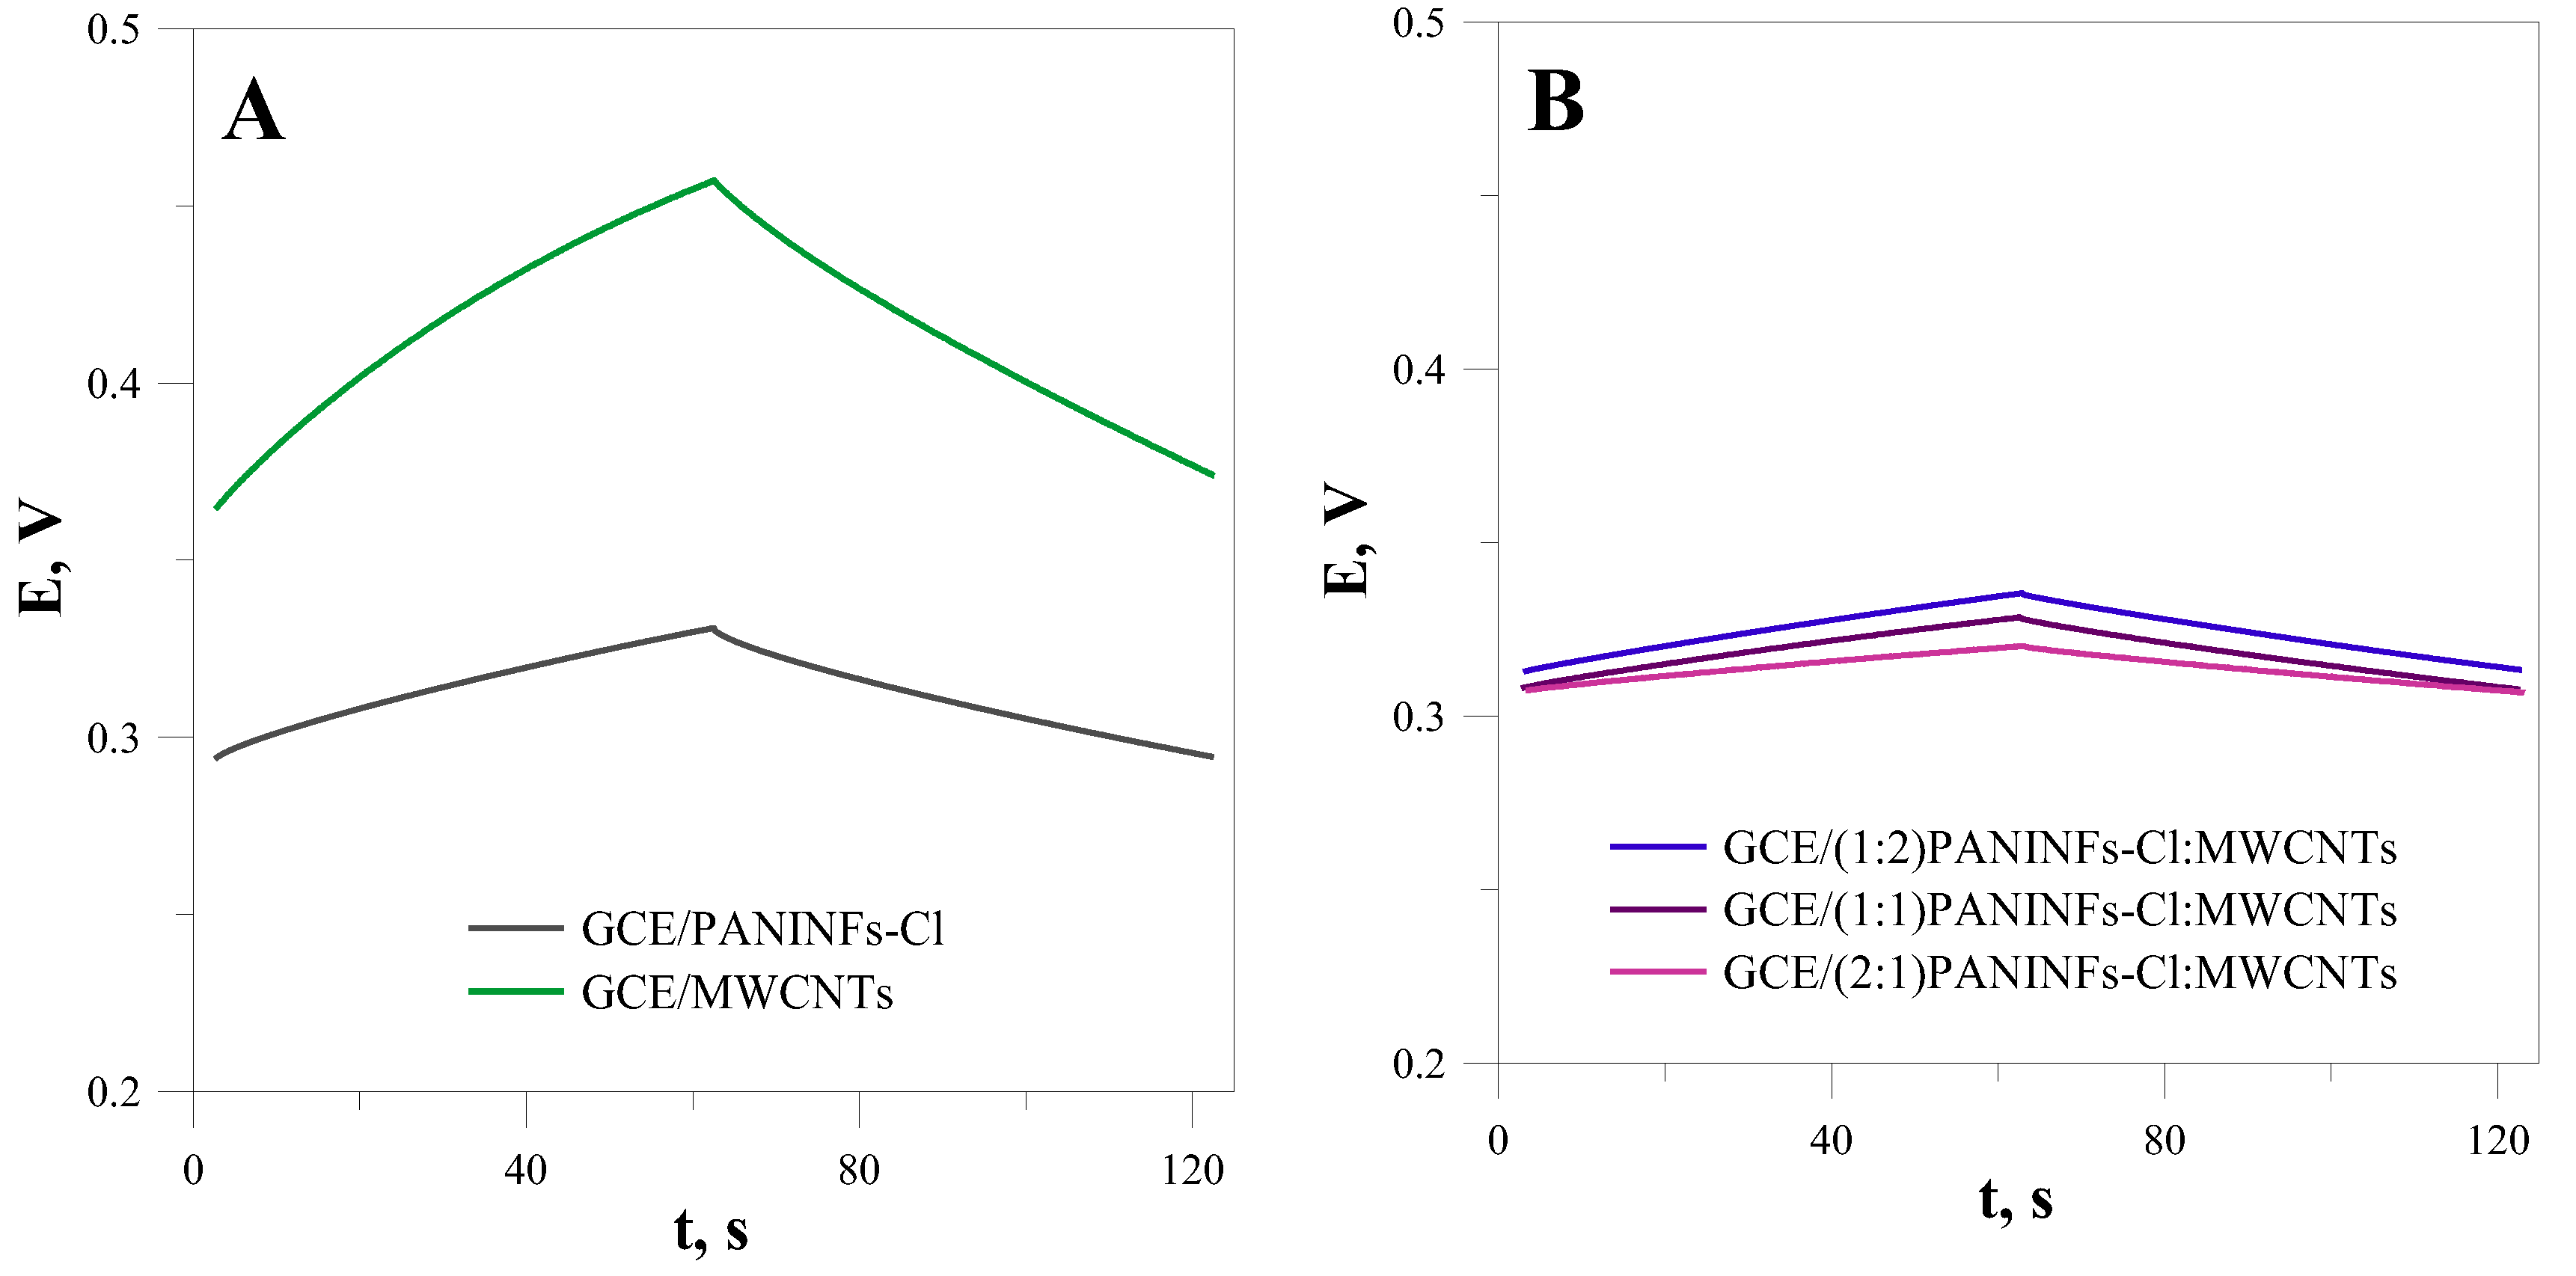
3.1.2. Chronopotentiometric Tests of the Intermediate Layer
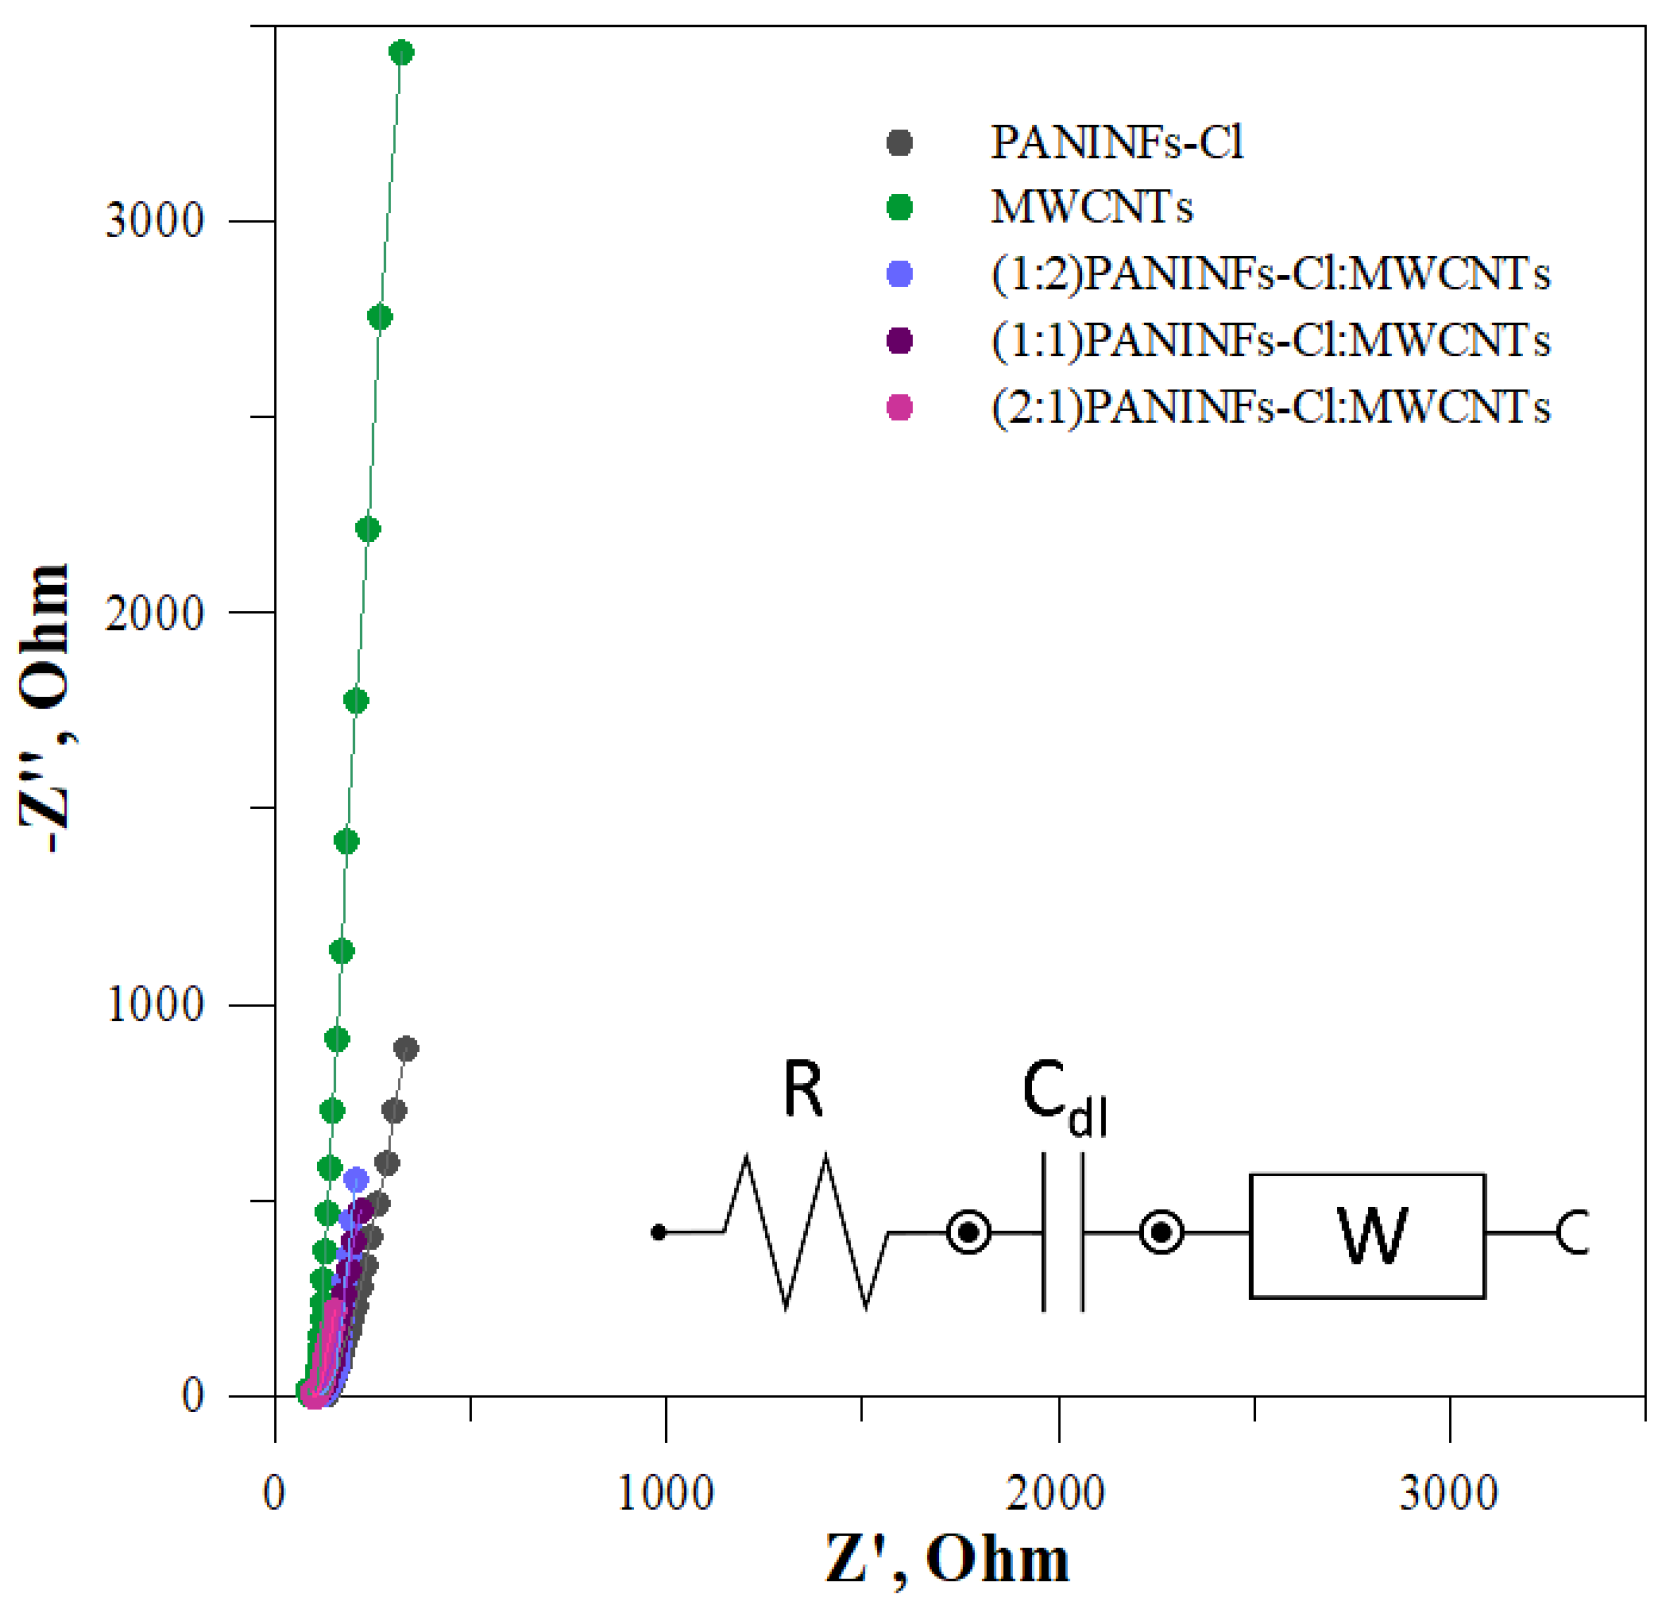
3.1.3. Initial Electrochemical Impedance Spectroscopy Tests of the Intermediate Layer
3.2. Characterization of Ion-Selective Electrodes
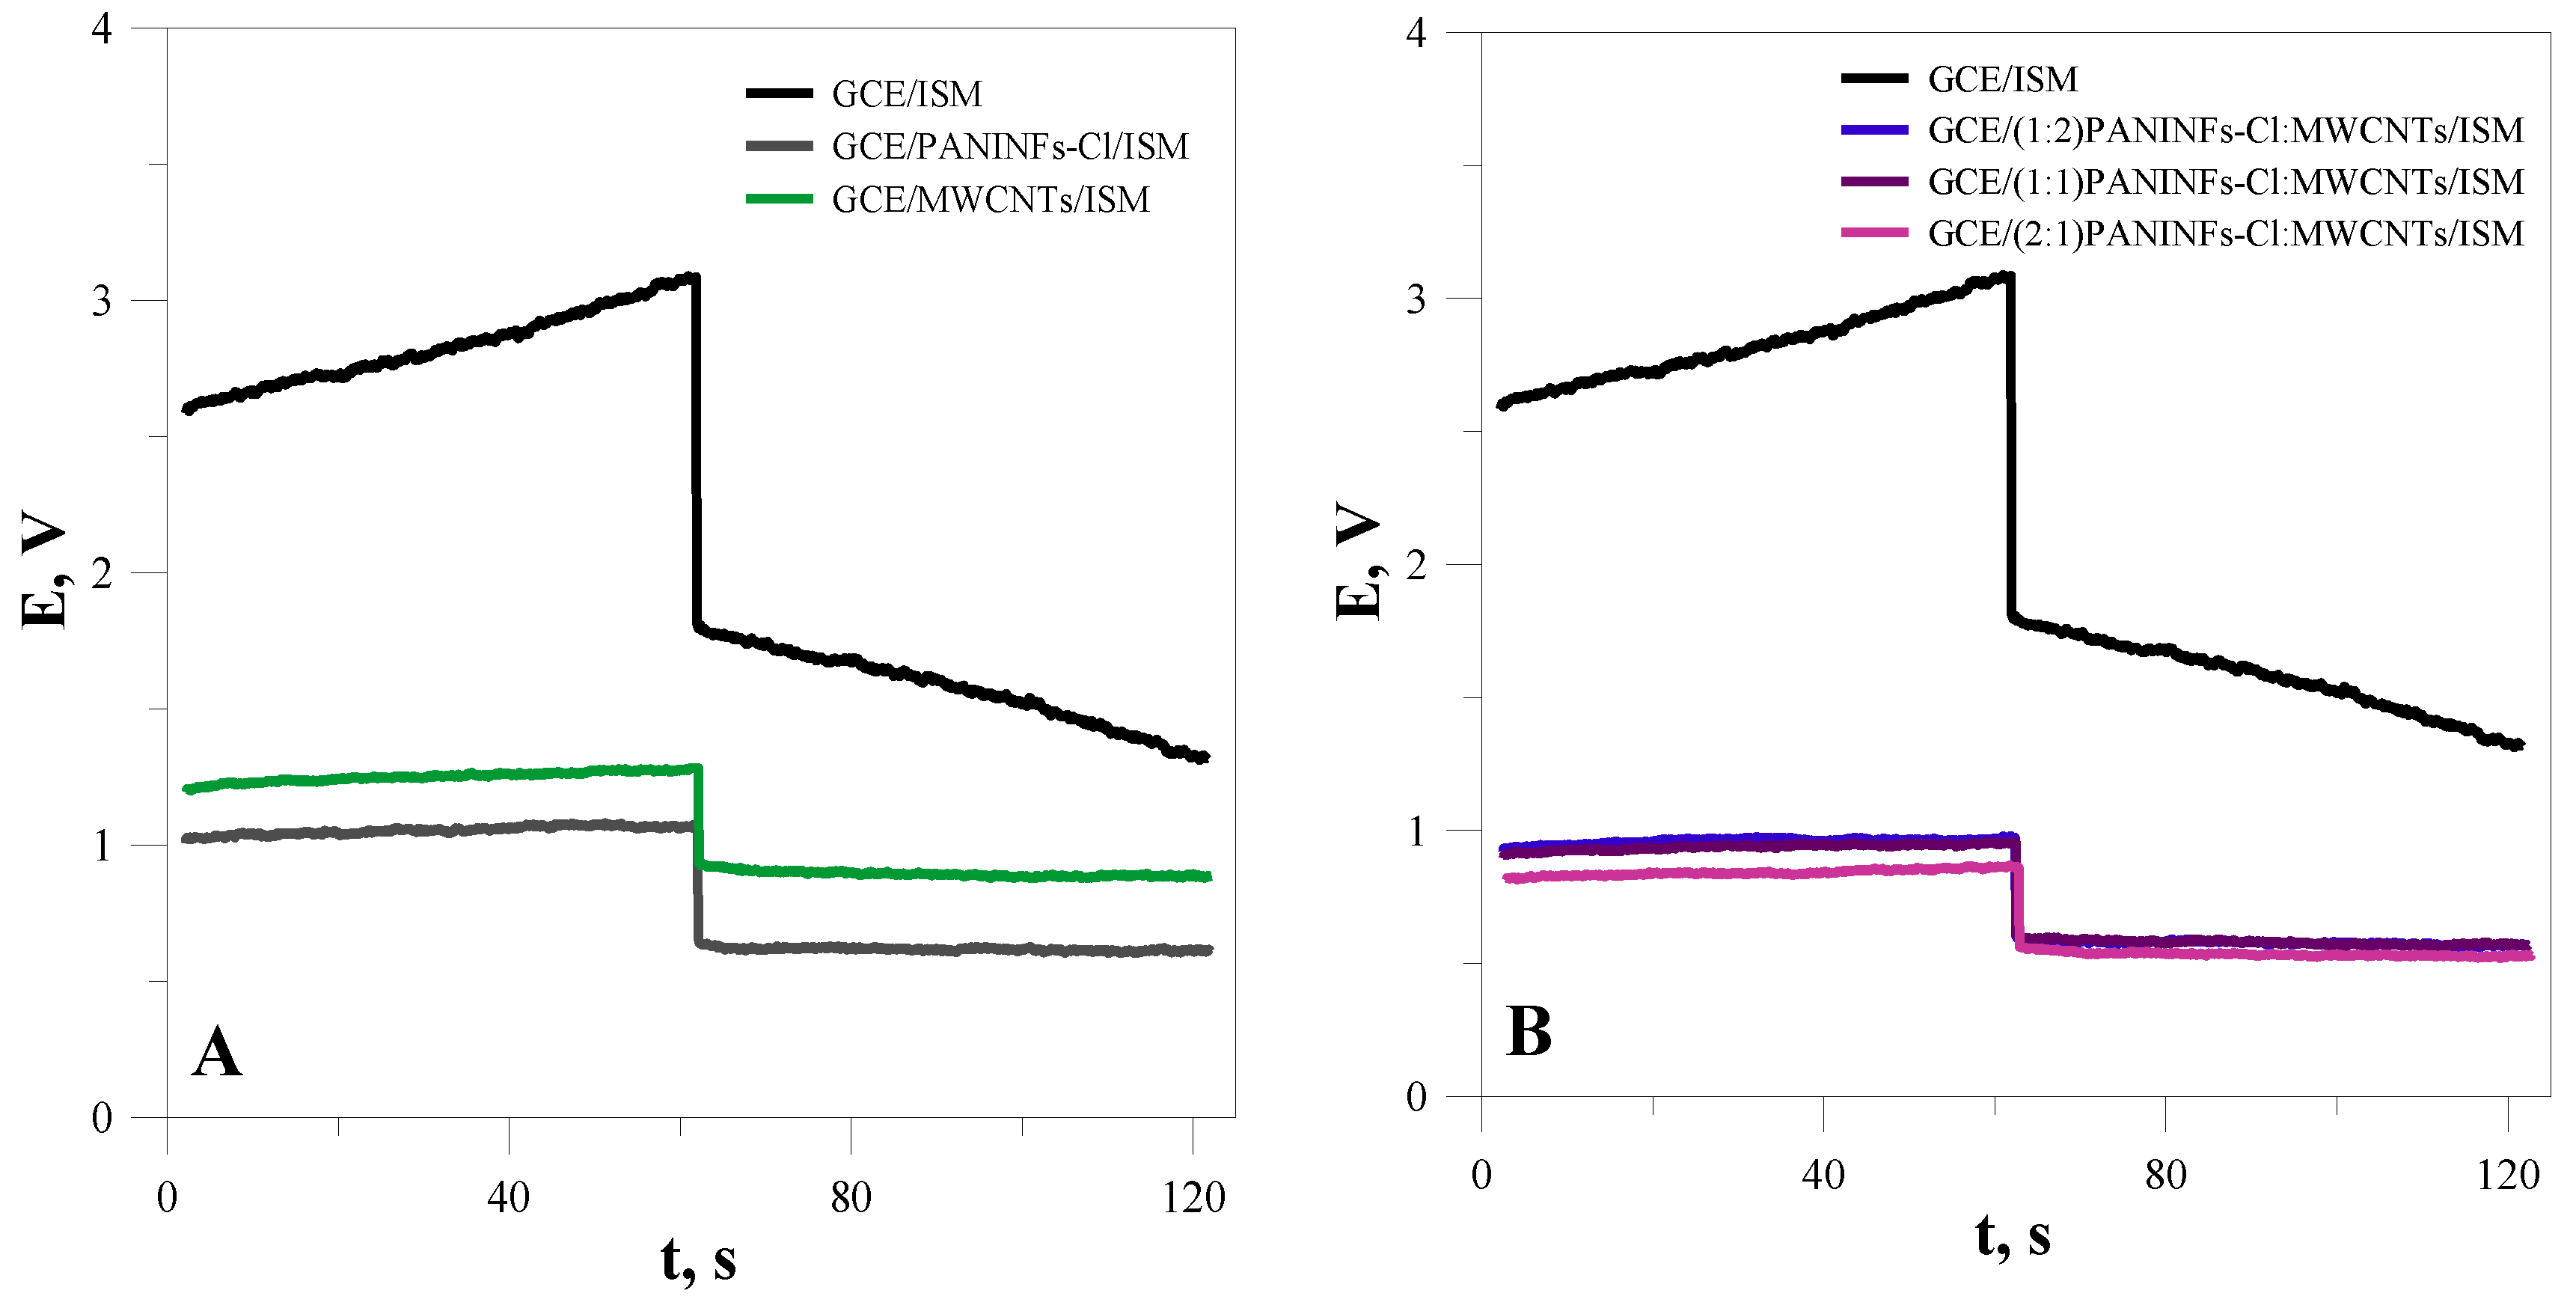
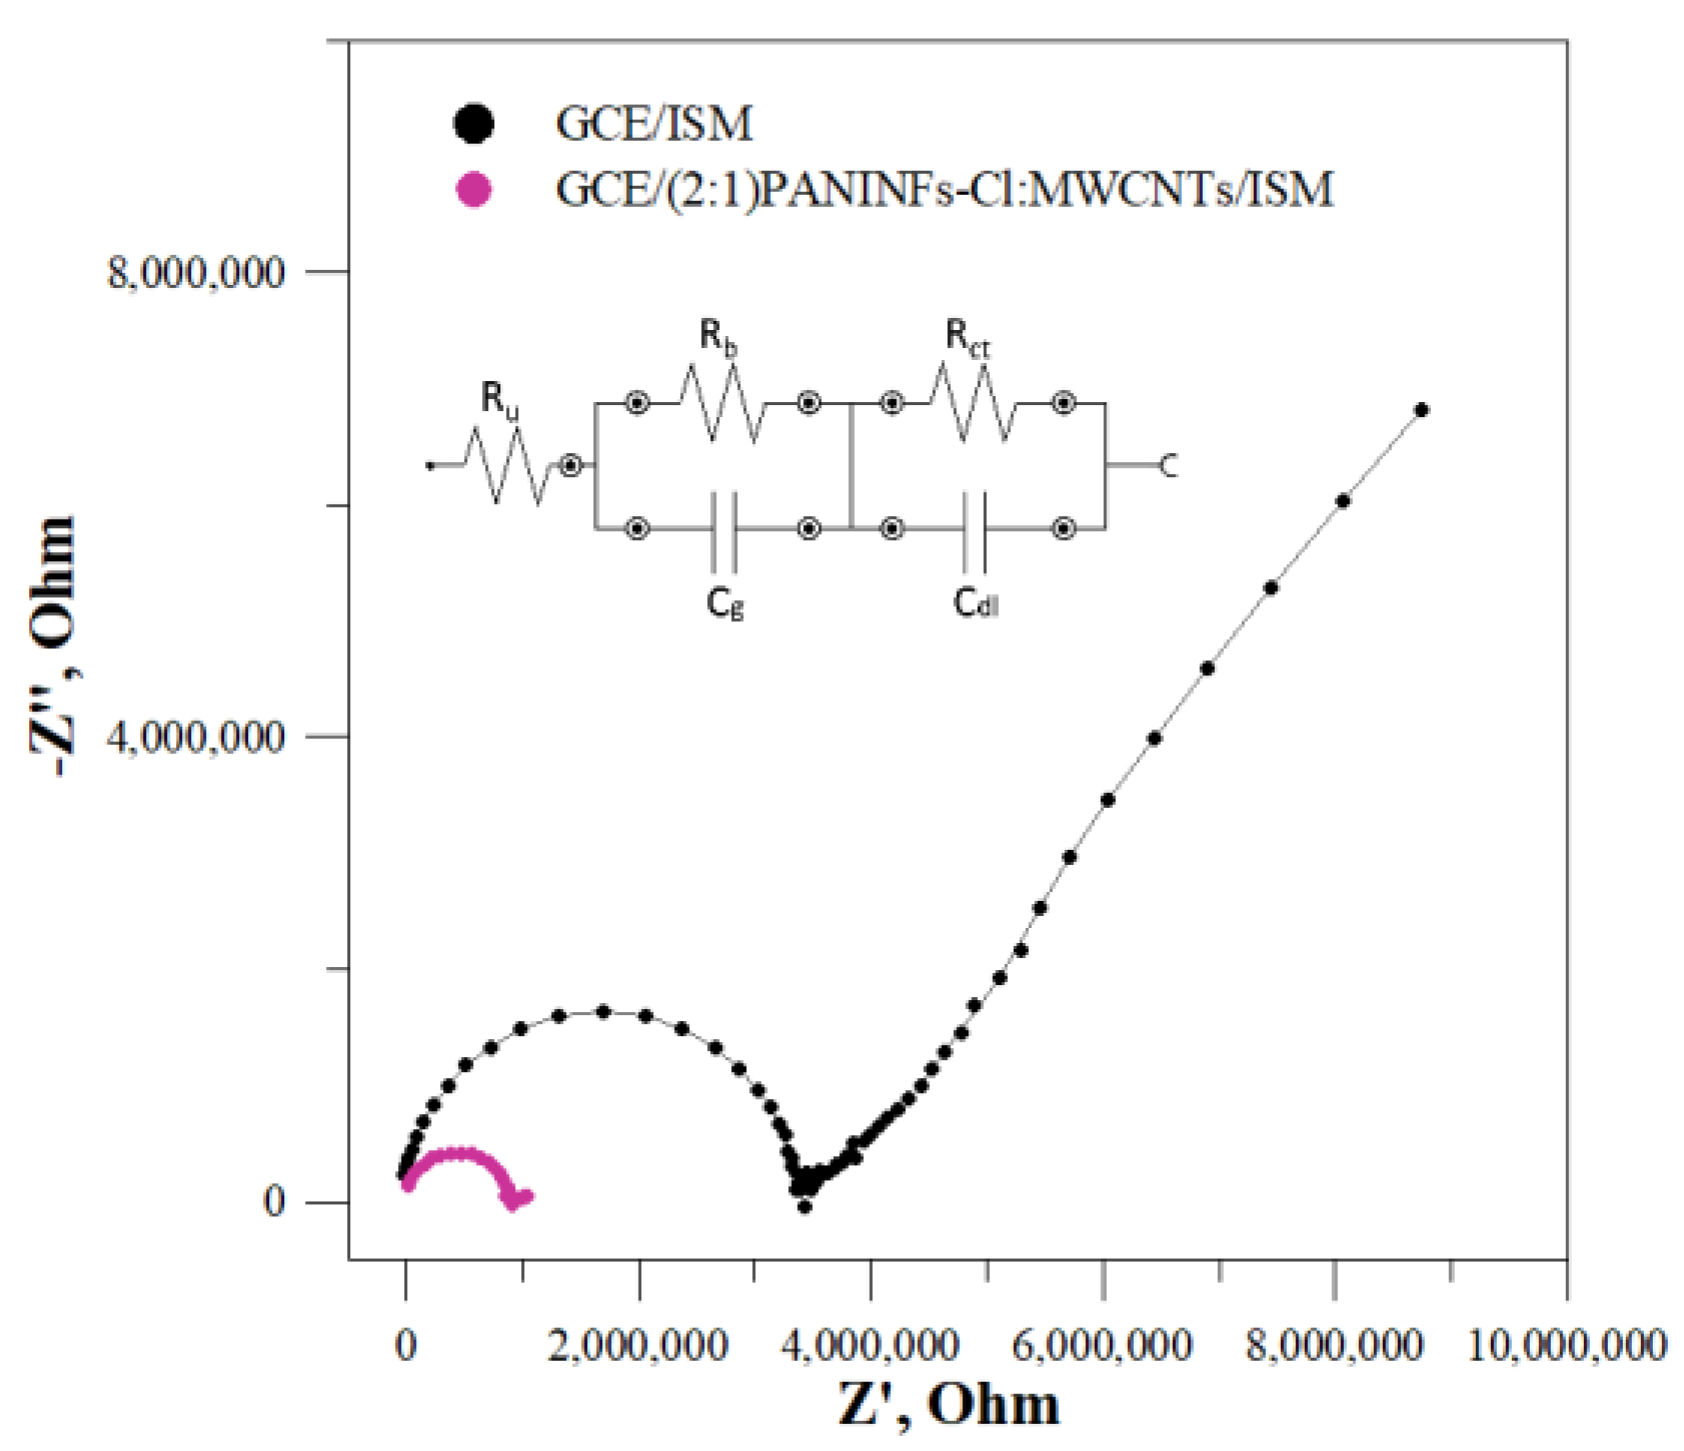
3.2.1. Electrical Parameters of Ion-Selective Electrodes
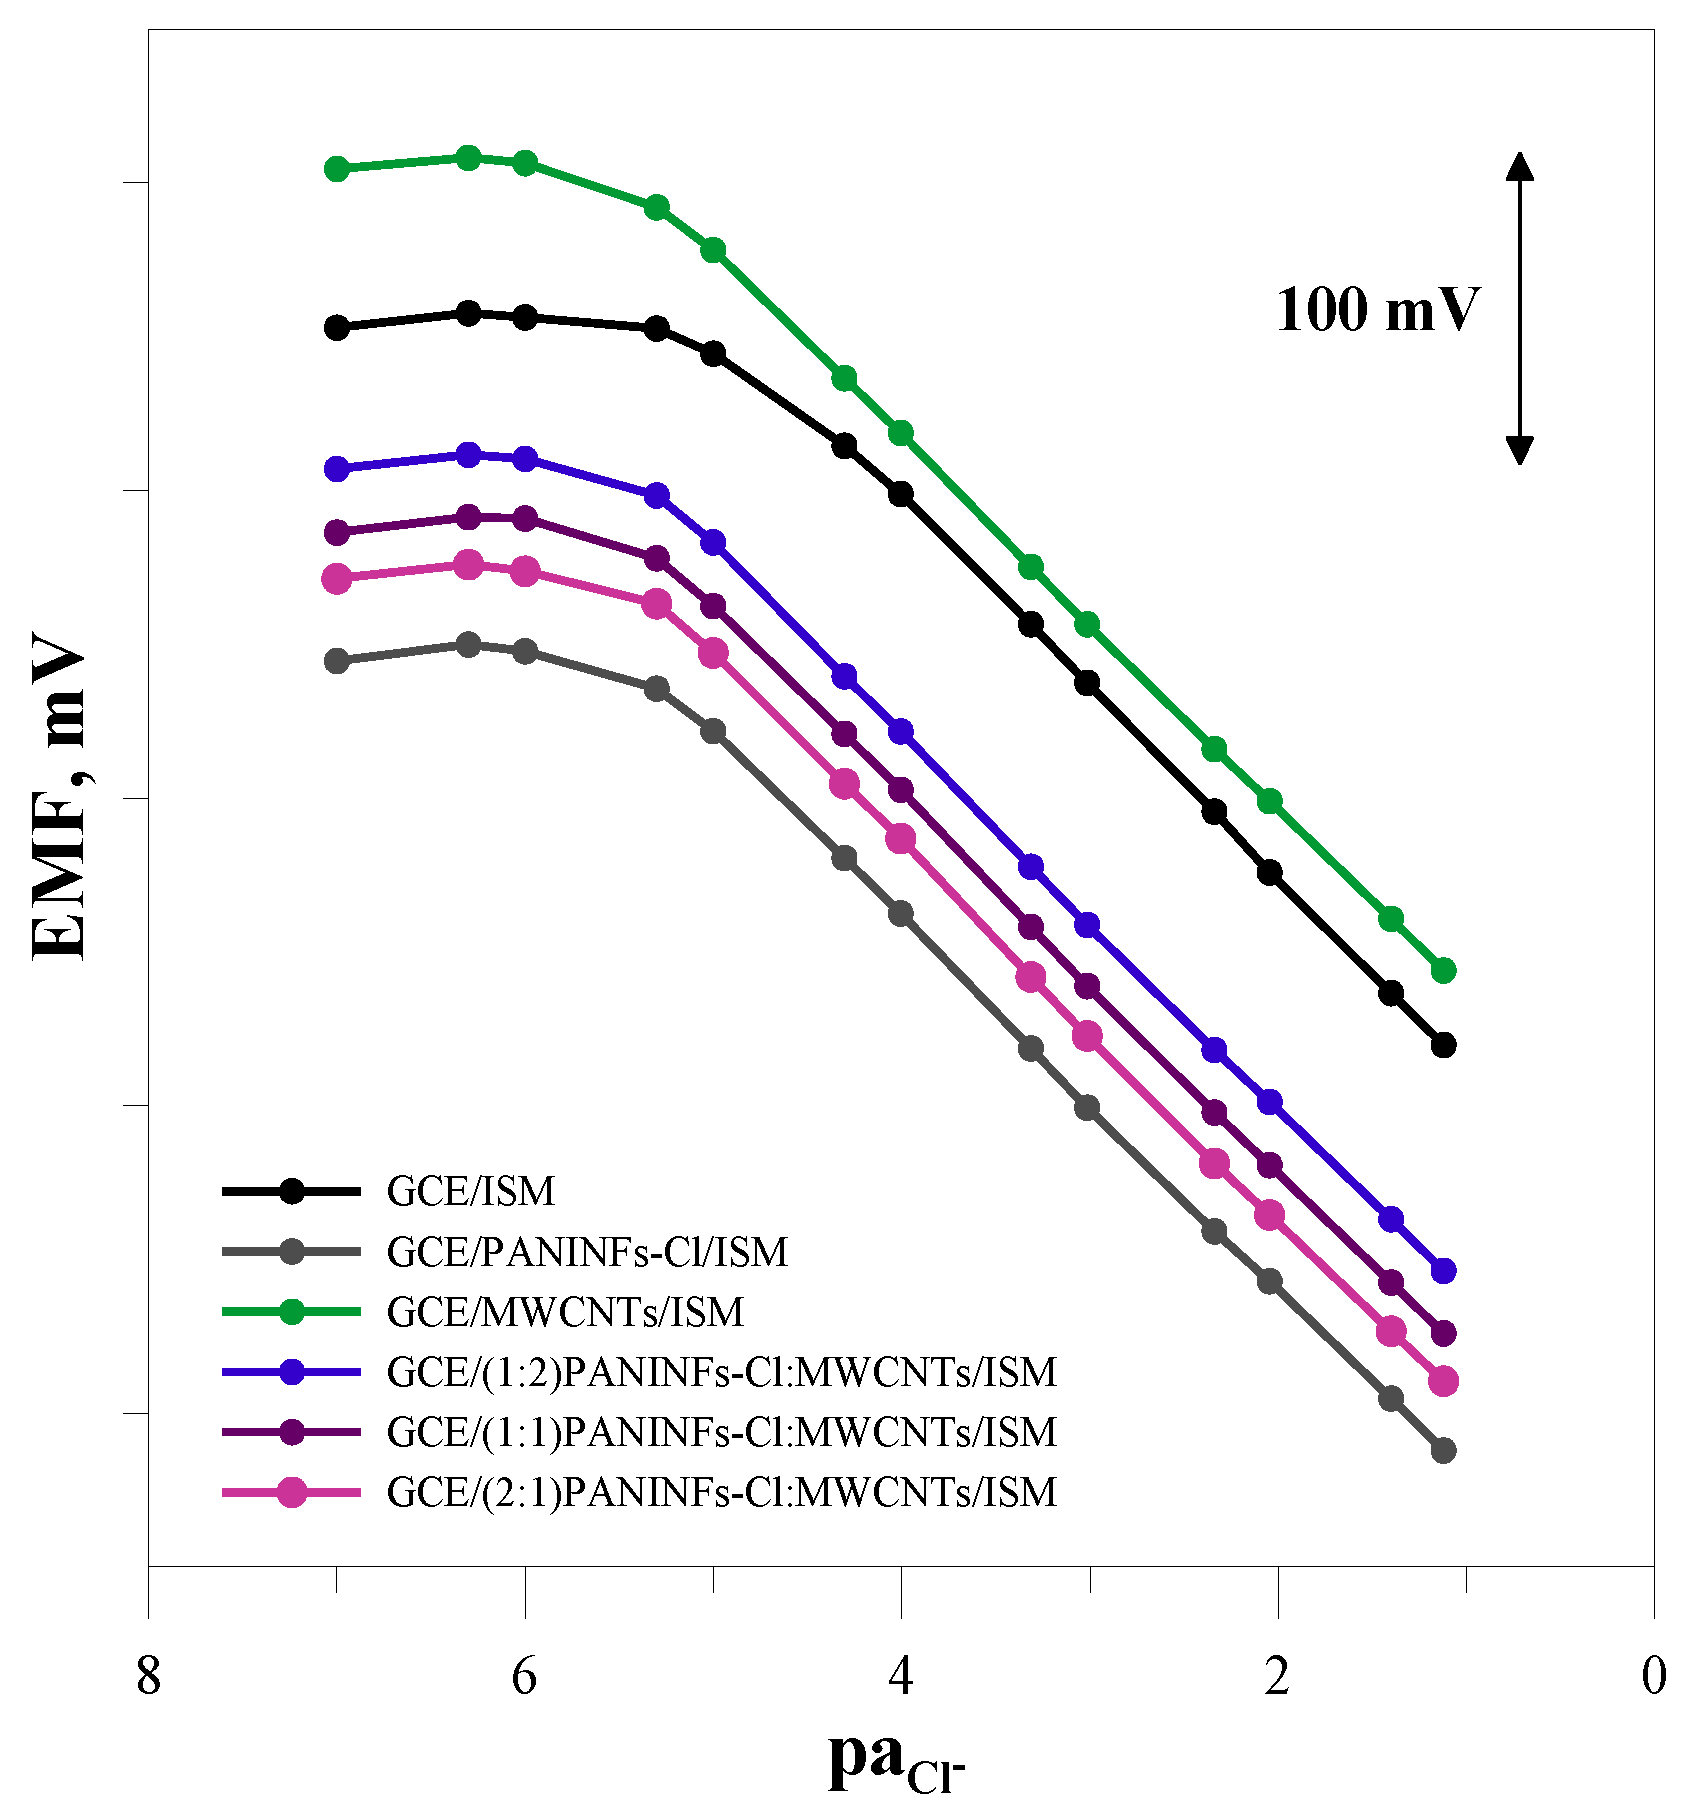
3.2.2. Potentiometric Response
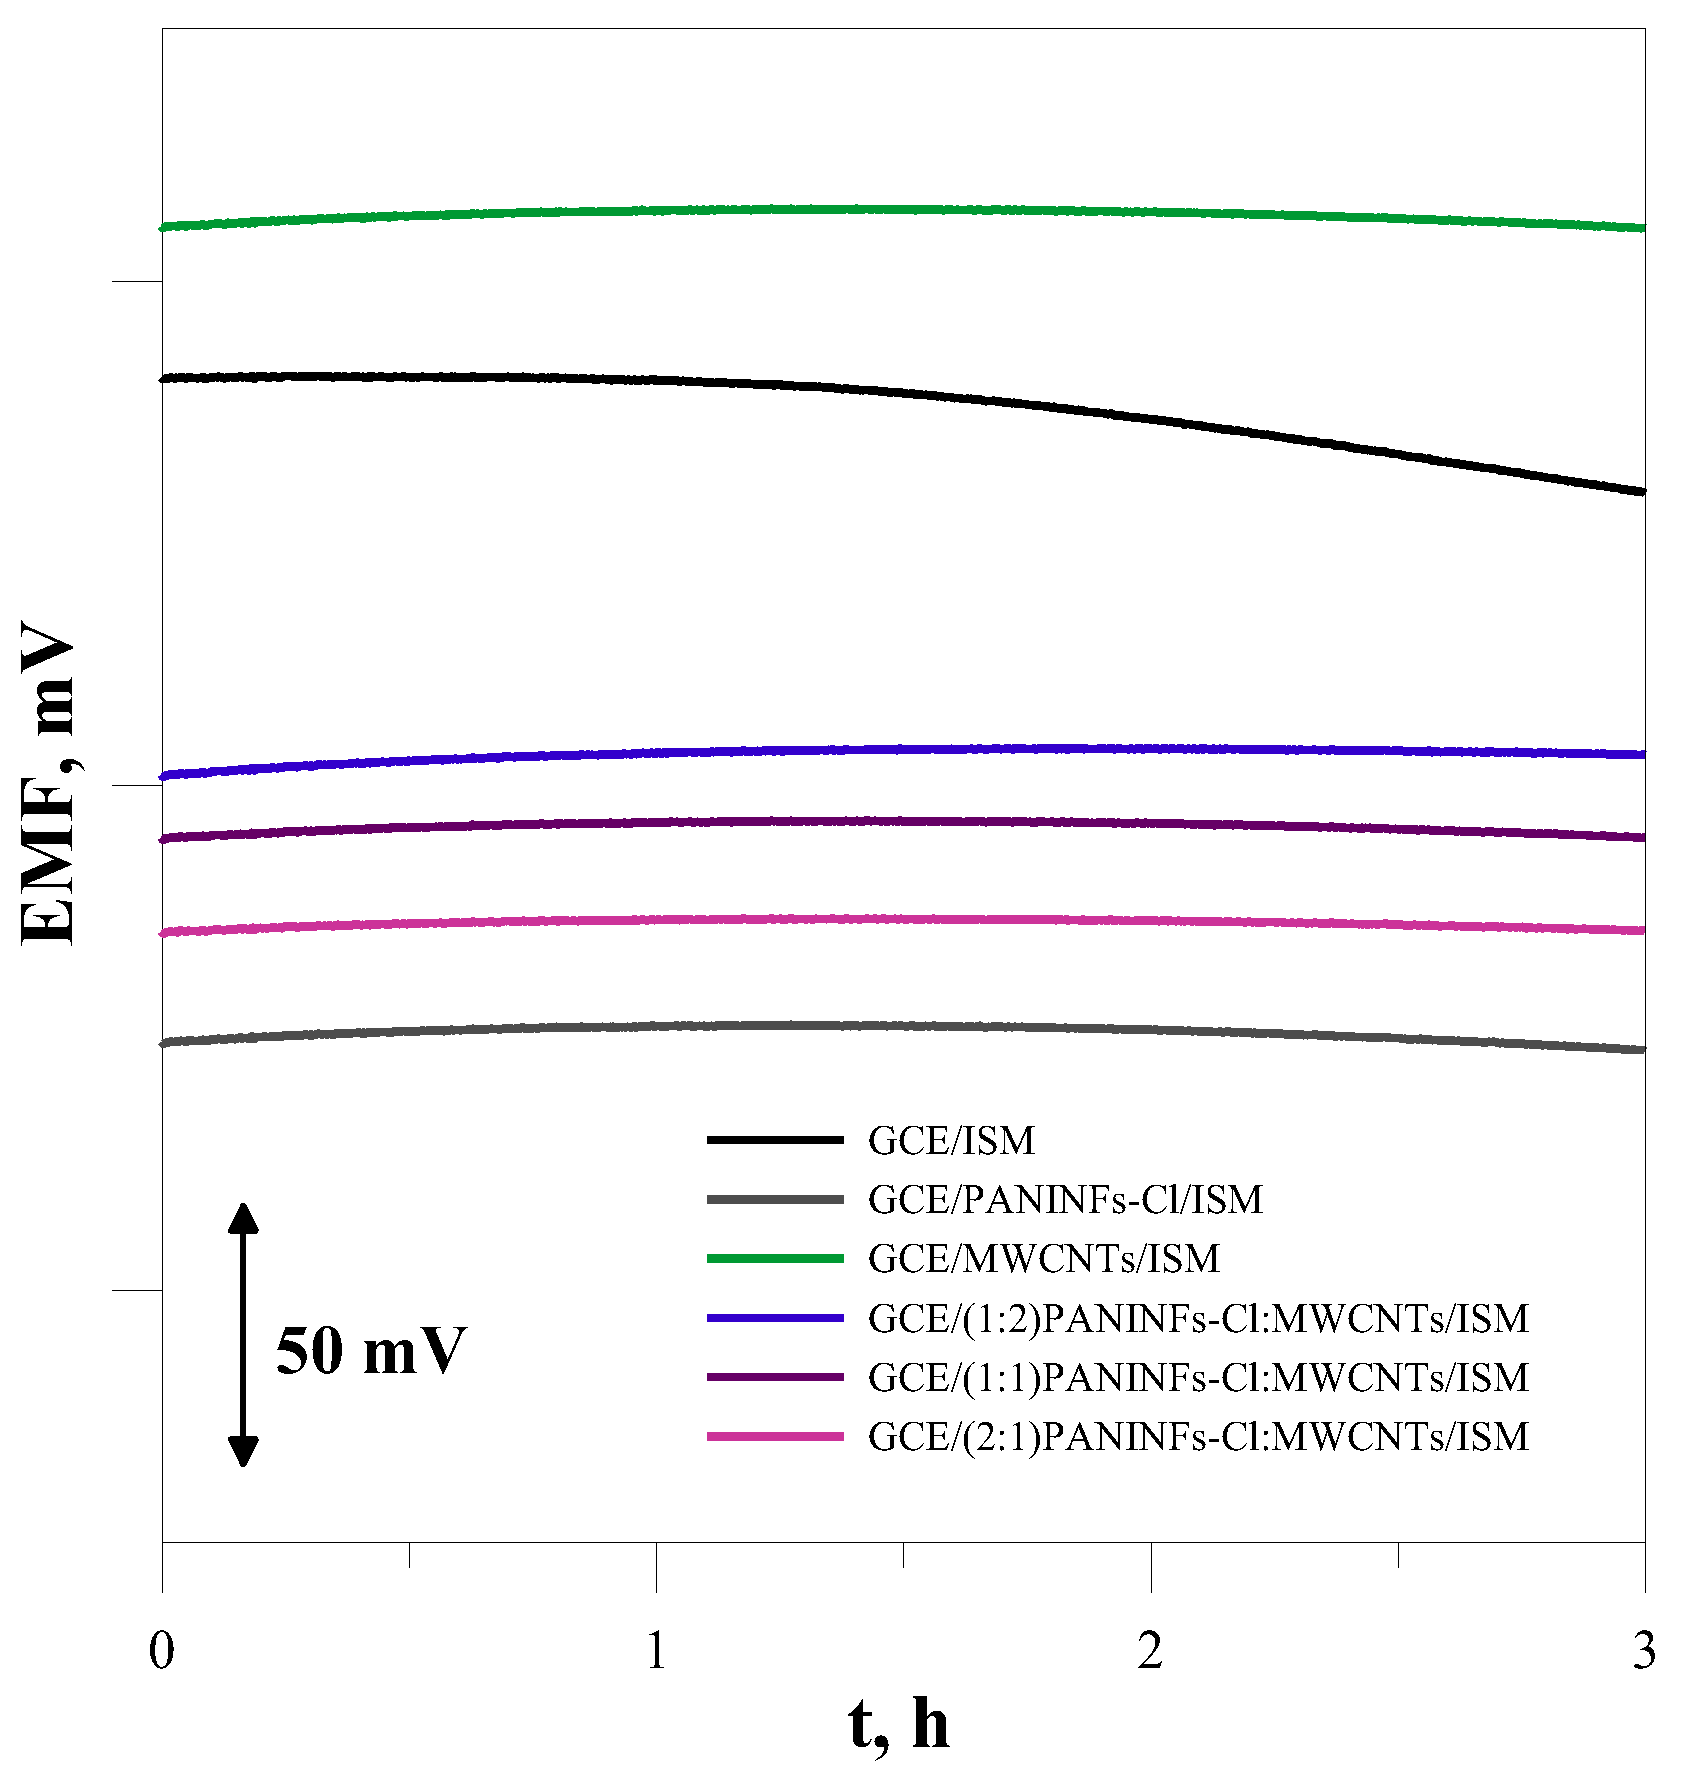
3.2.3. Short-Term Stability and Reversibility of the Electrode Potential
3.2.4. Selectivity
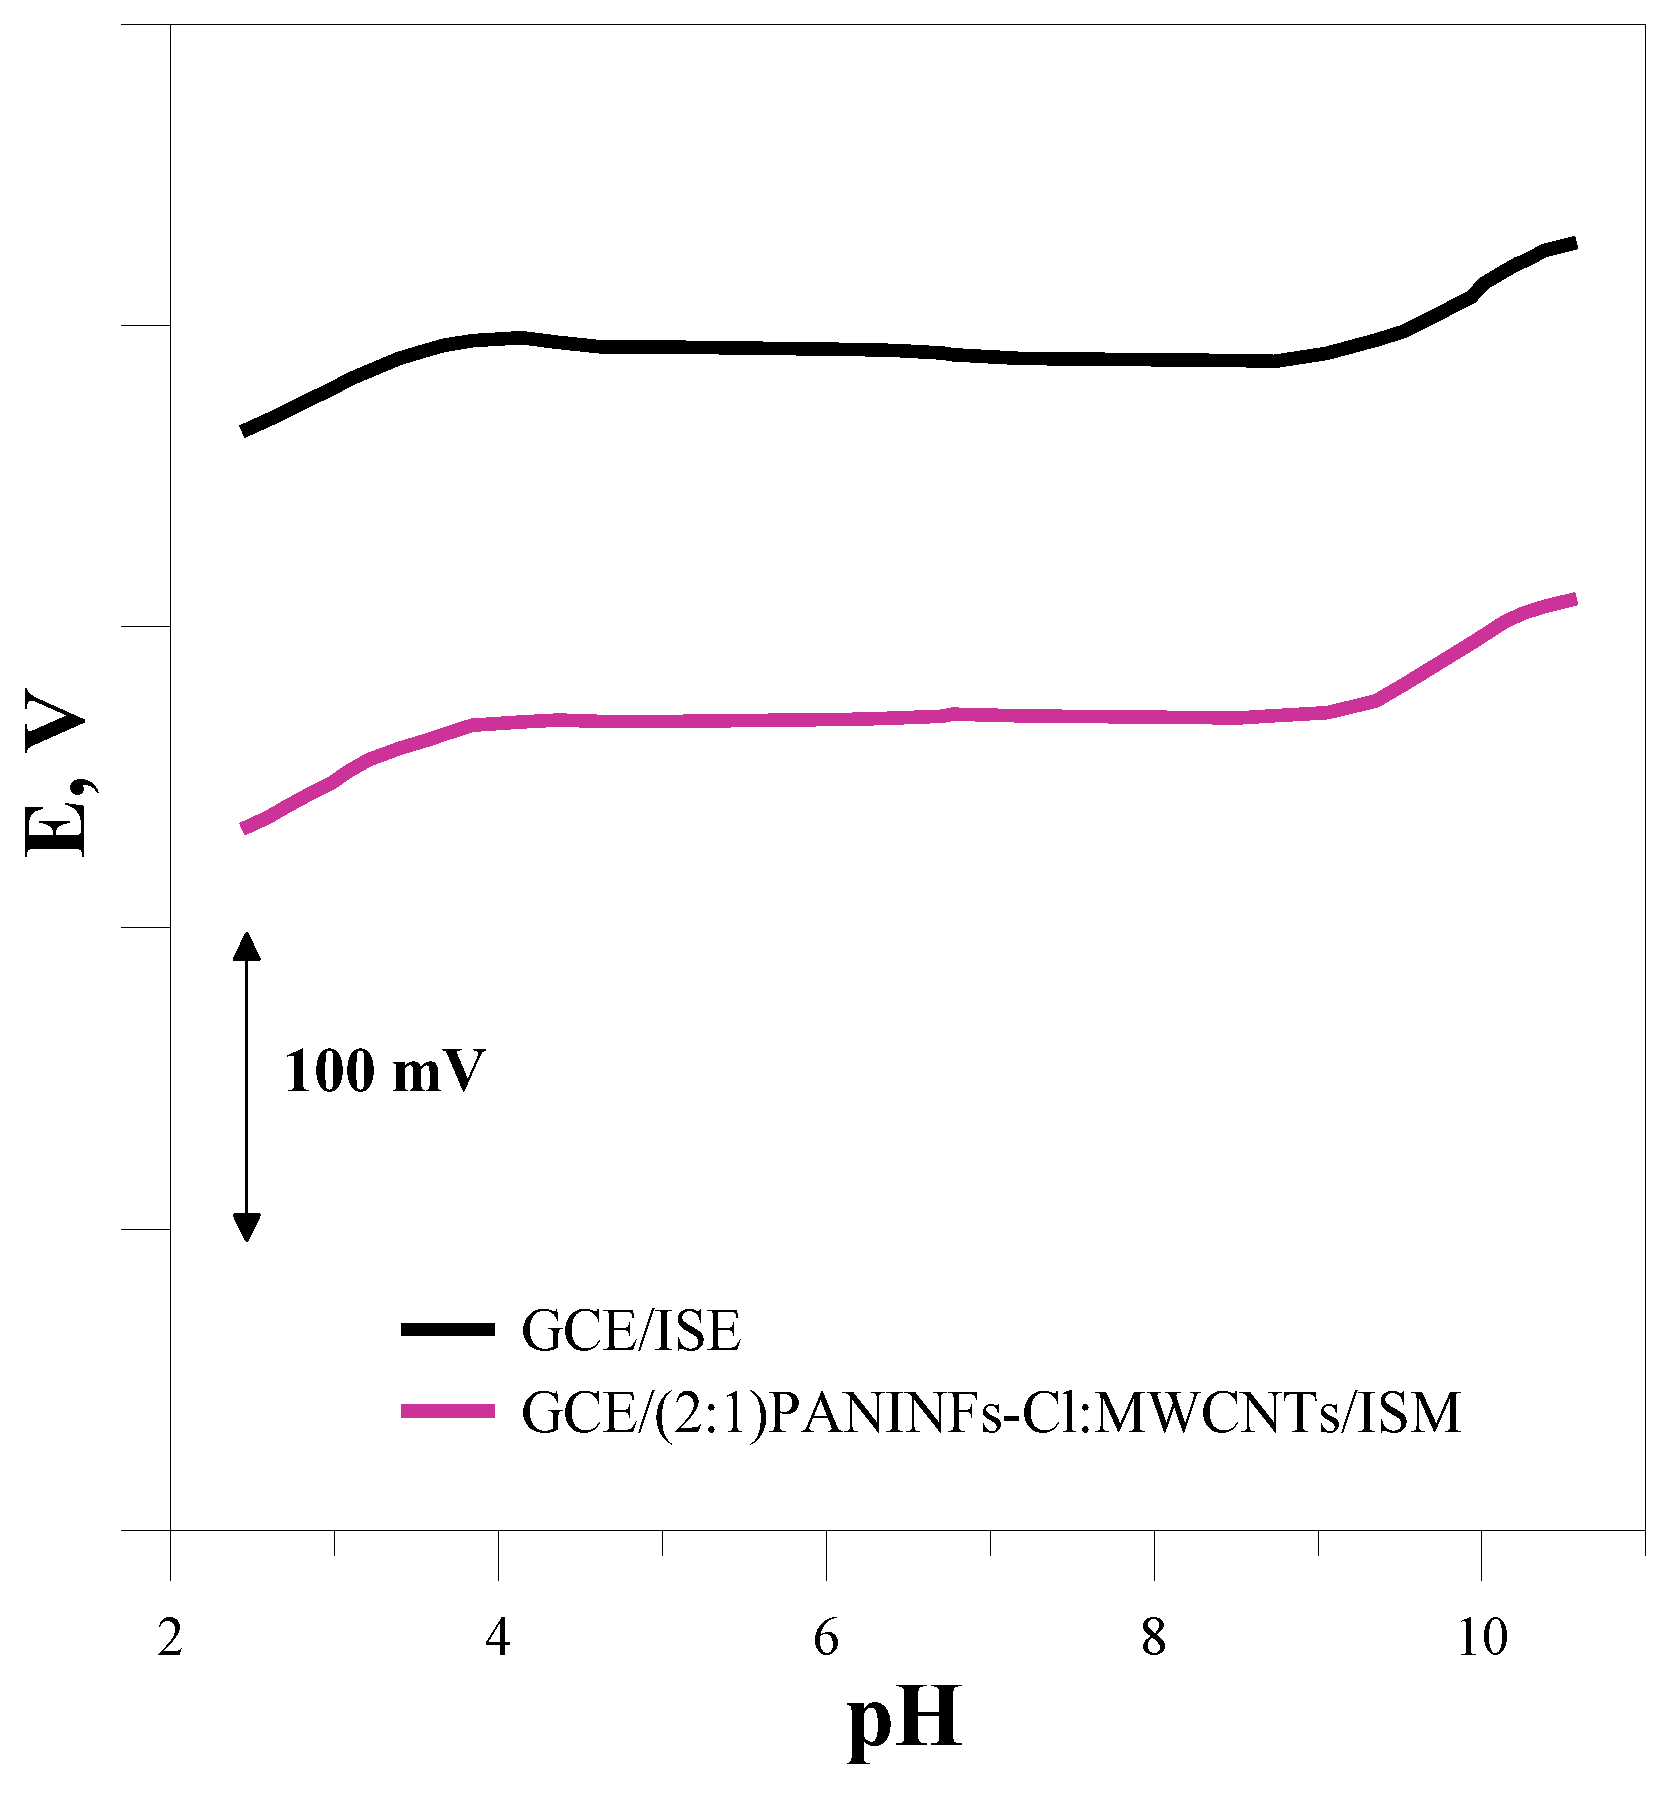
3.2.5. pH Range
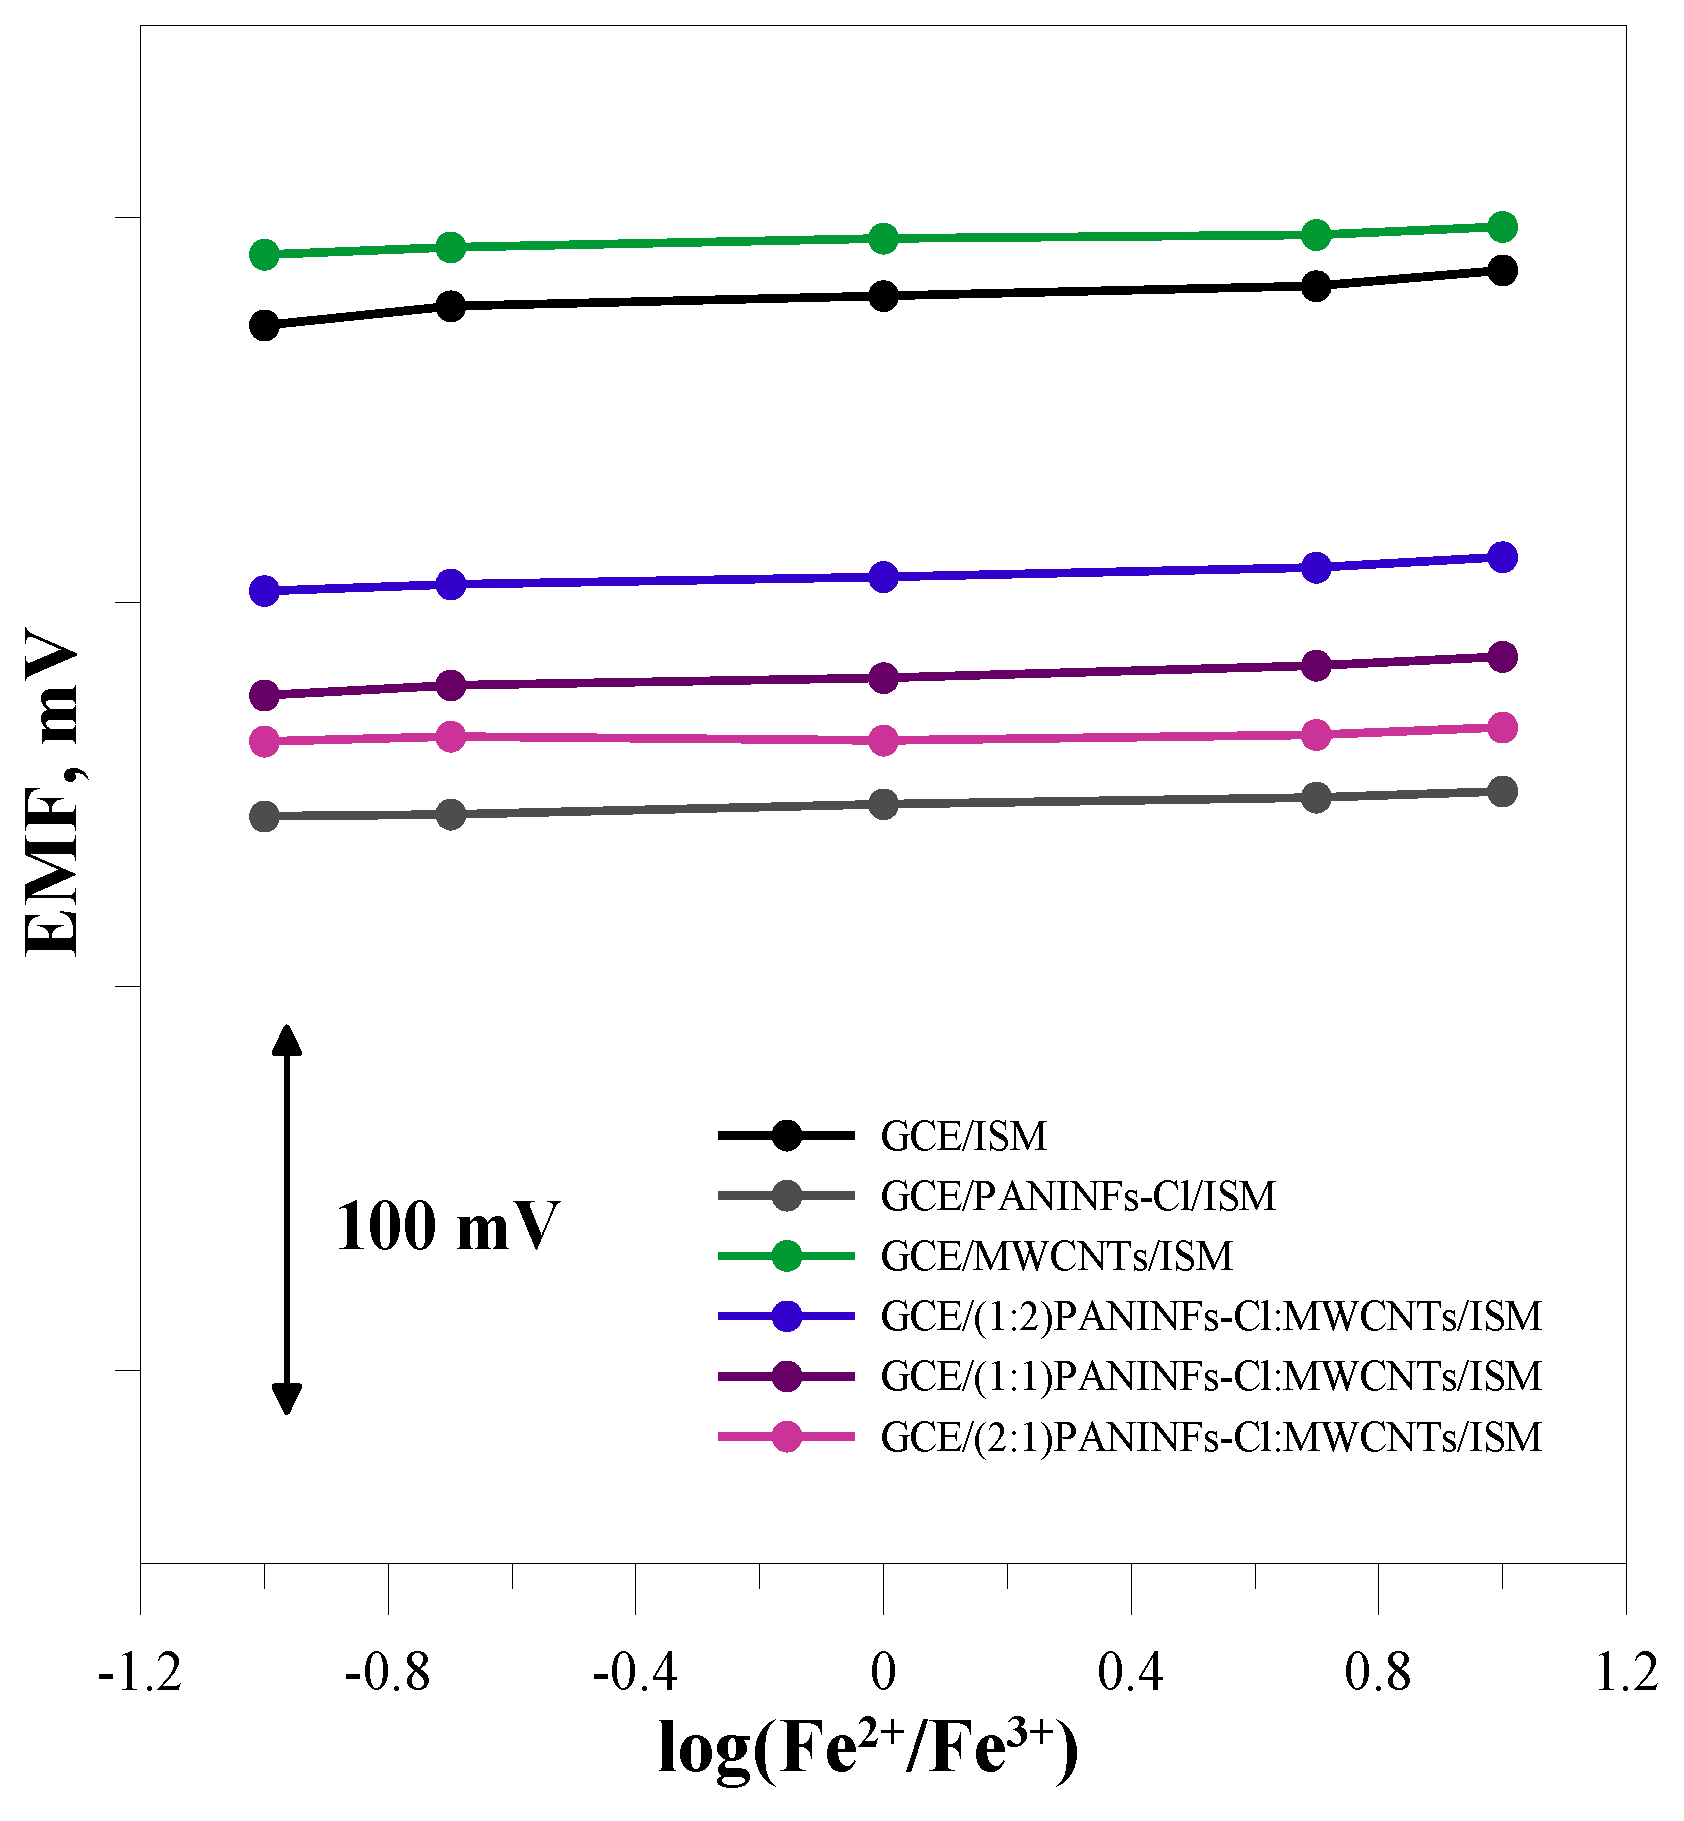
3.2.6. Redox Sensitivity
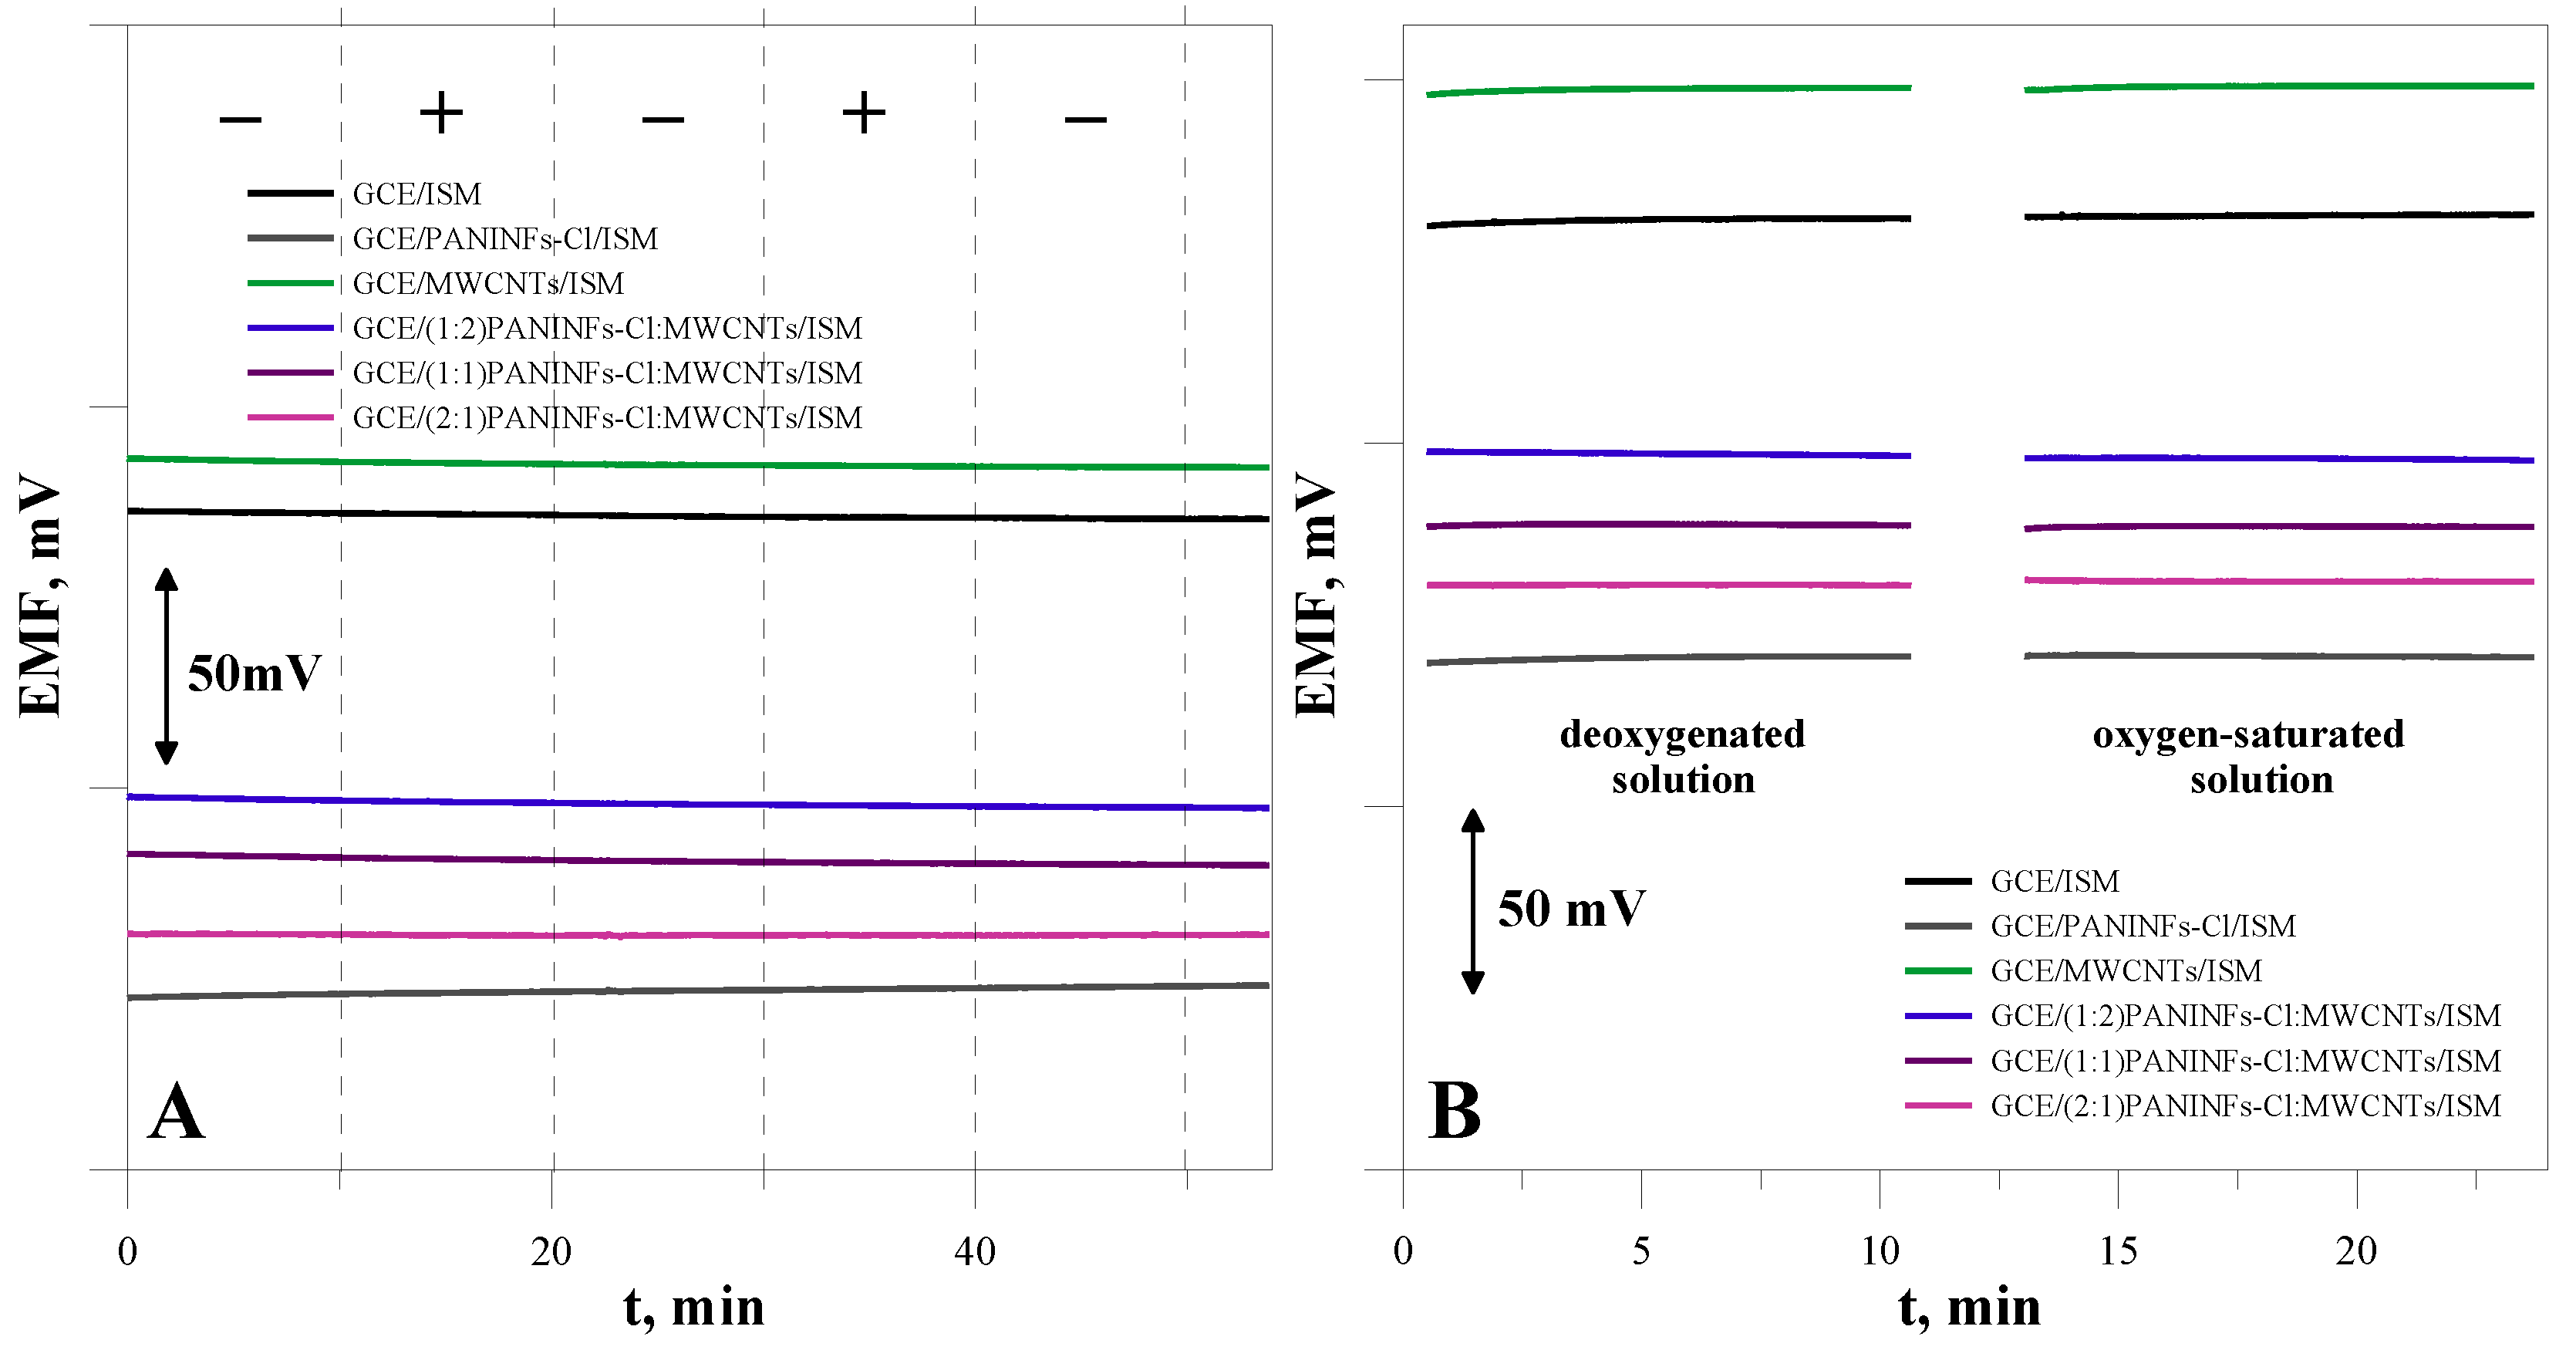
3.2.7. Sensitivity to Light and Oxygen
3.3. Determination of Chlorides in Real Samples Using the Proposed Electrode
4. Conclusions
Author Contributions
Funding
Institutional Review Board Statement
Informed Consent Statement
Data Availability Statement
Conflicts of Interest
References
- Ke, X. Micro-Fabricated Electrochemical Chloride Ion Sensors: From the Present to the Future. Talanta 2020, 211, 120734. [Google Scholar] [CrossRef] [PubMed]
- Turck, D.; Castenmiller, J.; de Henauw, S.; Hirsch-Ernst, K.I.; Kearney, J.; Knutsen, H.K.; Maciuk, A.; Mangelsdorf, I.; McArdle, H.J.; Pelaez, C.; et al. Dietary Reference Values for Chloride. EFSA J. 2019, 17, e05779. [Google Scholar] [CrossRef] [PubMed]
- de Graaf, D.B.; Abbas, Y.; Bomer, J.G.; Olthuis, W.; van den Berg, A. Sensor-Actuator System for Dynamic Chloride Ion Determination. Anal. Chim. Acta 2015, 888, 44–51. [Google Scholar] [CrossRef] [PubMed]
- Angst, U.; Elsener, B.; Larsen, C.K.; Vennesland, Ø. Potentiometric Determination of the Chloride Ion Activity in Cement Based Materials. J. Appl. Electrochem. 2010, 40, 561–573. [Google Scholar] [CrossRef]
- Junsomboon, J.; Jakmunee, J. Determination of Chloride in Admixtures and Aggregates for Cement by a Simple Flow Injection Potentiometric System. Talanta 2008, 76, 365–368. [Google Scholar] [CrossRef]
- Lopez-Moreno, C.; Perez, I.V.; Urbano, A.M. Development and Validation of an Ionic Chromatography Method for the Determination of Nitrate, Nitrite and Chloride in Meat. Food Chem. 2016, 194, 687–694. [Google Scholar] [CrossRef]
- Cuartero, M.; Crespo, G.; Cherubini, T.; Pankratova, N.; Confalonieri, F.; Massa, F.; Tercier-Waeber, M.L.; Abdou, M.; Schäfer, J.; Bakker, E. In Situ Detection of Macronutrients and Chloride in Seawater by Submersible Electrochemical Sensors. Anal. Chem. 2018, 90, 4702–4710. [Google Scholar] [CrossRef] [Green Version]
- Díaz, P.; González, Z.; Granda, M.; Menéndez, R.; Santamaría, R.; Blanco, C. Evaluating Capacitive Deionization for Water Desalination by Direct Determination of Chloride Ions. Desalination 2014, 344, 396–401. [Google Scholar] [CrossRef] [Green Version]
- Oka, S.; Sibazaki, Y.; Tahara, S. Direct Potentiometric Determination of Chloride Ion in Whole Blood. Anal. Chem. 1981, 53, 588–593. [Google Scholar] [CrossRef]
- De Clercq, H.L.; Mertens, J.; Massart, D.L. Analysis of Chloride in Milk with a Specific Ion Electrode. J. Agric. Food Chem. 1974, 22, 153–154. [Google Scholar] [CrossRef]
- Chapman, B.R.; Goldsmith, I.R. Determination of Chloride, Sodium and Potassium in Salted Foodstuffs Using Ion-Selective Electrodes and the Dry Sample Addition Method. Analyst 1982, 107, 1014–1018. [Google Scholar] [CrossRef] [PubMed]
- Capuano, E.; van der Veer, G.; Verheijen, P.J.J.; Heenan, S.P.; van de Laak, L.F.J.; Koopmans, H.B.M.; van Ruth, S.M. Comparison of a Sodium-Based and a Chloride-Based Approach for the Determination of Sodium Chloride Content of Processed Foods in the Netherlands. J. Food Compos. Anal. 2013, 31, 129–136. [Google Scholar] [CrossRef]
- Düzgün, A.; Zelada-Guillén, G.A.; Crespo, G.A.; Macho, S.; Riu, J.; Rius, F.X. Nanostructured Materials in Potentiometry. Anal. Bioanal. Chem. 2010, 399, 171–181. [Google Scholar] [CrossRef] [PubMed]
- Lindner, E.; Gyurcsányi, R.E. Quality Control Criteria for Solid-Contact, Solvent Polymeric Membrane Ion-Selective Electrodes. J. Solid State Electrochem. 2009, 13, 51–68. [Google Scholar] [CrossRef]
- Bieg, C.; Fuchsberger, K.; Stelzle, M. Introduction to Polymer-Based Solid-Contact Ion-Selective Electrodes—Basic Concepts, Practical Considerations, and Current Research Topics. Anal. Bioanal. Chem. 2017, 409, 45–61. [Google Scholar] [CrossRef]
- Bobacka, J.; Ivaska, A.; Lewenstam, A. Potentiometric Ion Sensors. Chem. Rev. 2008, 108, 329–351. [Google Scholar] [CrossRef]
- Hu, J.; Stein, A.; Bühlmann, P. Rational Design of All-Solid-State Ion-Selective Electrodes and Reference Electrodes. Trends Anal. Chem. 2016, 76, 102–114. [Google Scholar] [CrossRef]
- Bobacka, J. Potential Stability of All-Solid-State Ion-Selective Electrodes Using Conducting Polymers as Ion-to-Electron Transducers. Anal. Chem. 1999, 71, 4932–4937. [Google Scholar] [CrossRef]
- Crespo, G.A. Recent Advances in Ion-Selective Membrane Electrodes for in Situ Environmental Water Analysis. Electrochim. Acta 2017, 245, 1023–1034. [Google Scholar] [CrossRef]
- Cuartero, M.; Crespo, G.A. All-Solid-State Potentiometric Sensors: A New Wave for in Situ Aquatic Research. Curr. Opin. Electrochem. 2018, 10, 98–106. [Google Scholar] [CrossRef]
- Michalska, A. All-Solid-State Ion Selective and All-Solid-State Reference Electrodes. Electroanalysis 2012, 24, 1253–1265. [Google Scholar] [CrossRef]
- Legin, A.; Makarychev-Mikhailov, S.; Kirsanov, D.; Mortensen, J.; Vlasov, Y. Solvent Polymeric Membranes Based on Tridodecylmethylammonium Chloride Studied by Potentiometry and Electrochemical Impedance Spectroscopy. Anal. Chim. Acta 2004, 514, 107–113. [Google Scholar] [CrossRef]
- Pimenta, A.M.; Araújo, A.N.; Montenegro, M.C.B.S.M.; Pasquini, C.; Rohwedder, J.J.R.; Raimundo, I.M. Chloride-Selective Membrane Electrodes and Optodes Based on an Indium(III) Porphyrin for the Determination of Chloride in a Sequential Injection Analysis System. J. Pharm. Biomed. Anal. 2004, 36, 49–55. [Google Scholar] [CrossRef] [PubMed]
- Kim, W.; Sung, D.D.; Cha, G.S.; Park, S.B. Chloride-Selective Membranes Prepared with Different Matrices Including Polymers Obtained by the Sol-Gel Method. Analyst 1998, 123, 379–382. [Google Scholar] [CrossRef]
- Alizadeh, T.; Rafiei, F.; Akhoundian, M. A Novel Chloride Selective Potentiometric Sensor Based on Graphitic Carbon Nitride/Silver Chloride (g-C3N4/AgCl) Composite as the Sensing Element. Talanta 2022, 237, 122895. [Google Scholar] [CrossRef]
- Gupta, V.K.; Goyal, R.N.; Sharma, R.A. Chloride Selective Potentiometric Sensor Based on a Newly Synthesized Hydrogen Bonding Anion Receptor. Electrochim. Acta 2009, 54, 4216–4222. [Google Scholar] [CrossRef]
- Nazarov, V.A.; Taryba, M.G.; Zdrachek, E.A.; Andronchyk, K.A.; Egorov, V.V.; Lamaka, S.V. Sodium- and Chloride-Selective Microelectrodes Optimized for Corrosion Studies. J. Electroanal. Chem. 2013, 706, 13–24. [Google Scholar] [CrossRef]
- Chango, G.; Palacio, E.; Cerdà, V. Potentiometric Chip-Based Multipumping Flow System for the Simultaneous Determination of Fluoride, Chloride, PH, and Redox Potential in Water Samples. Talanta 2018, 186, 554–560. [Google Scholar] [CrossRef]
- Sandhu, S.S.; Chang, A.Y.; Fernando, P.U.A.I.; Morales, J.F.; Tostado, N.; Jernberg, J.; Moores, L.C.; Wang, J. MIP-202 Catalyst-Integrated Solid-Contact Potentiometric Chloride Sensor for Versatile Multiphasic Detection of a Sulfur Mustard Simulant. Sens. Actuators B Chem. 2023, 375, 132818. [Google Scholar] [CrossRef]
- Yin, T.; Qin, W. Applications of Nanomaterials in Potentiometric Sensors. Trends Anal. Chem. 2013, 51, 79–86. [Google Scholar] [CrossRef]
- Michalska, A.; Hulanicki, A.; Lewenstam, A. All Solid-State Hydrogen Ion-Selective Electrode Based on a Conducting Poly(Pyrrole) Solid Contact. Analyst 1994, 119, 2417–2420. [Google Scholar] [CrossRef]
- Konopka, A.; Sokalski, T.; Michalska, A.; Lewenstam, A.; Maj-Zurawska, M. Factors Affecting the Potentiometric Response of All-Solid-State Solvent Polymeric Membrane Calcium-Selective Electrode for Low-Level Measurements. Anal. Chem. 2004, 76, 6410–6418. [Google Scholar] [CrossRef] [PubMed]
- Han, W.-S.; Park, M.-Y.; Chung, K.-C.; Cho, D.-H.; Hong, T.-K. Enhanced Electrochemical Performance of Poly(Aniline) Solid-Contact PH Electrodes Based on Alkyldibenzylamine. Anal. Sci. 2000, 16, 1145–1149. [Google Scholar] [CrossRef] [Green Version]
- Liang, R.; Yin, T.; Qin, W. A Simple Approach for Fabricating Solid-Contact Ion-Selective Electrodes Using Nanomaterials as Transducers. Anal. Chim. Acta 2015, 853, 291–296. [Google Scholar] [CrossRef] [PubMed]
- Zhang, L.; Wei, Z.; Liu, P. An All-Solid-State NO3- Ion-Selective Electrode with Gold Nanoparticles Solid Contact Layer and Molecularly Imprinted Polymer Membrane. PLoS ONE 2020, 15, e0240173. [Google Scholar] [CrossRef] [PubMed]
- Yin, T.; Han, T.; Li, C.; Qin, W.; Bobacka, J. Real-Time Monitoring of the Dissolution of Silver Nanoparticles by Using a Solid-Contact Ag+-Selective Electrode. Anal. Chim. Acta 2020, 1101, 50–57. [Google Scholar] [CrossRef] [PubMed]
- Paczosa-Bator, B.; Cabaj, L.; Piech, R.; Skupień, K. Platinum Nanoparticles Intermediate Layer in Solid-State Selective Electrodes. Analyst 2012, 137, 5272–5277. [Google Scholar] [CrossRef]
- Pietrzak, K.; Krstulović, N.; Blažeka, D.; Car, J.; Malinowski, S.; Wardak, C. Metal Oxide Nanoparticles as Solid Contact in Ion-Selective Electrodes Sensitive to Potassium Ions. Talanta 2022, 243, 123335. [Google Scholar] [CrossRef]
- Pietrzak, K.; Wardak, C.; Malinowski, S. Application of Polyaniline Nanofibers for the Construction of Nitrate All-solid-state Ion-selective Electrodes. Appl. Nanosci. 2021, 11, 2823–2835. [Google Scholar] [CrossRef]
- Available online: https://www.sigmaaldrich.cn/deepweb/assets/sigmaaldrich/product/documents/523/464/24894.pdf (accessed on 20 October 2022).
- Sundfors, F.; Bobacka, J. EIS Study of the Redox Reaction of Fe(CN)63-/4- at Poly(3,4-Ethylenedioxythiophene) Electrodes: Influence of Dc Potential and COx: CRed Ratio. J. Electroanal. Chem. 2004, 572, 309–316. [Google Scholar] [CrossRef]
- Bakker, E.; Pretsch, E.; Bühlmann, P. Selectivity of Potentiometric Ion Sensors. Anal. Chem. 2000, 72, 1127–1133. [Google Scholar] [CrossRef] [PubMed]
- Vázquez, M.; Bobacka, J.; Ivaska, A.; Lewenstam, A. Influence of Oxygen and Carbon Dioxide on the Electrochemical Stability of Poly(3,4-Ethylenedioxythiophene) Used as Ion-to-Electron Transducer in All-Solid-State Ion-Selective Electrodes. Sens. Actuators B Chem. 2002, 82, 7–13. [Google Scholar] [CrossRef]
- Lindfors, T. Light Sensitivity and Potential Stability of Electrically Conducting Polymers Commonly Used in Solid Contact Ion-Selective Electrodes. J. Solid State Electrochem. 2009, 13, 77–89. [Google Scholar] [CrossRef]
- ELMETRON. Available online: https://elmetron.com.pl/index_eng.html (accessed on 20 October 2022).
- HACH. Available online: https://www.hach.com/intellical-isecl181-chloride-cl-ion-selective-electrode-ise-1-m-cable/product?id=7640513801 (accessed on 20 October 2022).
- Hannainst. Available online: https://www.hannainst.com/hi4107-chloride-combination-ion-selective-electrode.html (accessed on 20 October 2022).
- Vernier. Available online: https://www.vernier.com/product/chloride-ion-selective-electrode/ (accessed on 20 October 2022).
- Thermofisher. Available online: https://www.thermofisher.com/order/catalog/product/9417SC (accessed on 20 October 2022).


| Layer Material | C, mF | R, kΩ |
|---|---|---|
| PANINFs-Cl | 1.82 | 0.64 |
| MWCNTs | 0.68 | 0.61 |
| (1:2)PANINFs-Cl:MWCNTs | 2.70 | 0.37 |
| (1:1)PANINFs-Cl:MWCNTs | 3.01 | 0.31 |
| (2:1)PANINFs-Cl:MWCNTs | 7.16 | 0.21 |
| Layer Material | R [Ω] | Cdl (mF) | W (mOhm × s(1/2)) | χ2 |
|---|---|---|---|---|
| PANINFs-Cl | 123.0 | 2.10 | 4.78 | 0.089 |
| MWCNTs | 95.0 | 0.59 | 5.76 | 0.092 |
| (1:2)PANINFs-Cl:MWCNTs | 108.0 | 3.12 | 7.95 | 0.096 |
| (1:1)PANINFs-Cl:MWCNTs | 103.0 | 3.40 | 8.59 | 0.054 |
| (2:1)PANINFs-Cl:MWCNTs | 101.0 | 7.01 | 13.6 | 0.058 |
| Electrode | C, mF | ΔE/Δt, mV s−1 | R, MΩ |
|---|---|---|---|
| GCE/ISM | 0.013 | 7.7 | 8.01 |
| GCE/PANINFs-Cl/ISM | 0.12 | 0.81 | 4.11 |
| GCE/MWCNTs/ISM | 0.10 | 0.96 | 3.49 |
| GCE/(1:2)PANINFs-Cl:MWCNTs/ISM | 0.28 | 0.36 | 3.66 |
| GCE/(1:1)PANINFs-Cl:MWCNTs/ISM | 0.26 | 0.34 | 3.48 |
| GCE/(2:1)PANINFs-Cl:MWCNTs/ISM | 0.32 | 0.31 | 2.97 |
| Electrode | Slope, mV dec−1 | Linear Range, mol L−1 | Limit of Detection, mol L−1 | Long-Term Stability E0 ± SD, mV | |||
|---|---|---|---|---|---|---|---|
| 1. Week | 2. Month | 1. Week | 2. Month | 1. Week | 2. Month | ||
| GCE/ISM | −59.7 | −59.6 | 5 × 10⁻⁵–1 × 10⁻¹ | 1 × 10⁻⁴–1 × 10⁻¹ | 6.3 × 10⁻⁶ | 1.9 × 10⁻⁵ | 205.0 ± 56 |
| GCE/PANINFs-Cl/ISM | −59.6 | −60.2 | 5 × 10⁻⁶–1 × 10⁻¹ | 1 × 10⁻⁵–1 × 10⁻¹ | 2.6 × 10⁻⁶ | 6.5 × 10⁻⁶ | 69.0 ± 8.5 |
| GCE/MWCNTs/ISM | −60.3 | −60.2 | 5 × 10⁻⁶–1 × 10⁻¹ | 5 × 10⁻⁶–1 × 10⁻¹ | 2.8 × 10⁻⁶ | 4.8 × 10⁻⁶ | 225.2 ± 6.3 |
| GCE/(1:2)PANINFs-Cl:MWCNTs/ISM | −61.1 | −60.1 | 5 × 10⁻⁶–1 × 10⁻¹ | 5 × 10⁻⁶–1 × 10⁻¹ | 2.7 × 10⁻⁶ | 4.8 × 10⁻⁶ | 126.4 ± 6.1 |
| GCE/(1:1)PANINFs-Cl:MWCNTs/ISM | −61.2 | −60.5 | 5 × 10⁻⁶–1 × 10⁻¹ | 5 × 10⁻⁶–1 × 10⁻¹ | 2.7 × 10⁻⁶ | 3.8 × 10⁻⁶ | 105.7 ± 3.5 |
| GCE/(2:1)PANINFs-Cl:MWCNTs/ISM | −61.3 | −61.1 | 5 × 10⁻⁶–1 × 10⁻¹ | 5 × 10⁻⁶–1 × 10⁻¹ | 2.3 × 10⁻⁶ | 3.6 × 10⁻⁶ | 89.5 ± 1.8 |
| Electrode | 10−4 mol L−1 | 10−3 mol L−1 | Potential Drift, mV h−1 | ||
|---|---|---|---|---|---|
| Mean, mV | SD, mV | Mean, mV | SD, mV | ||
| GCE/ISM | 438.83 | 13.24 | 402.58 | 7.85 | 7.60 |
| GCE/PANINFs-Cl/ISM | 310.78 | 4.21 | 250.12 | 2.78 | 0.56 |
| GCE/MWCNTs/ISM | 470.10 | 3.82 | 405.58 | 2.26 | 0.08 |
| GCE/(1:2)PANINFs-Cl:MWCNTs/ISM | 370.48 | 3.17 | 310.81 | 2.39 | 0.35 |
| GCE/(1:1)PANINFs-Cl:MWCNTs/ISM | 350.39 | 2.19 | 290.98 | 1.87 | 0.09 |
| GCE/(2:1)PANINFs-Cl:MWCNTs/ISM | 335.26 | 1.42 | 270.80 | 0.71 | 0.03 |
| Sample | Chloride Content Found by Proposed ISE, mmol L−1 | Chloride Content Found by Classic Mohr’s Method, mmol L−1 |
|---|---|---|
| Tap water | 0.737 ± 0.016 | 0.745 |
| Mineral water | 0.311 ± 0.018 | 0.302 |
| River water | 1.07 ± 0.026 | 1.01 |
| Name of Electrode | Producer | Ion-Sensitive Membrane Type | Slope, mV dec−1 | Linear Range, mol L−1 | Detection Limit, mol L−1 | Interfering Ions with logK ≥ −2 | Response Time, s | pH Range | Ref. |
|---|---|---|---|---|---|---|---|---|---|
| Chloride ISE GCE/(2:1)PANINFs-Cl:MWCNTs/ISM | - | PVC | −61.3 | 5 × 10⁻⁶–1 × 10⁻¹ | 2.56 × 10⁻⁶ | Br- | <10 | 4–9 | This work |
| Chloride electrode ECl-01 | ELMETRON | Polycrystalline | −56 ± 3 | 5 × 10⁻⁵–1 | - | Br−, S2O32−, I−, S2- | 30–60 | 2–11 | [45] |
| Intellical ISECL181 chloride ISE (Cl⁻) | HACH | Solid-state crystal membrane | - | 3 × 10⁻⁶–1 | - | - | - | - | [46] |
| ISE Hanna HI 4107 | MERA | Semiconductor, combined | - | 1 × 10⁻⁵–1 | - | - | - | 2–11 | [47] |
| Chloride ISE | VERNIER | - | −56 ± 3 | 3 × 10⁻⁵–1 | - | CN–, Br–, I–, OH–, S2–, NH3 | - | 2–12 | [48] |
| Orion™ Chloride Electrode 9417SC | THERMOFISHER | - | - | 1 × 10⁻⁵–1 | - | - | - | - | [49] |
Publisher’s Note: MDPI stays neutral with regard to jurisdictional claims in published maps and institutional affiliations. |
© 2022 by the authors. Licensee MDPI, Basel, Switzerland. This article is an open access article distributed under the terms and conditions of the Creative Commons Attribution (CC BY) license (https://creativecommons.org/licenses/by/4.0/).
Share and Cite
Pietrzak, K.; Morawska, K.; Malinowski, S.; Wardak, C. Chloride Ion-Selective Electrode with Solid-Contact Based on Polyaniline Nanofibers and Multiwalled Carbon Nanotubes Nanocomposite. Membranes 2022, 12, 1150. https://doi.org/10.3390/membranes12111150
Pietrzak K, Morawska K, Malinowski S, Wardak C. Chloride Ion-Selective Electrode with Solid-Contact Based on Polyaniline Nanofibers and Multiwalled Carbon Nanotubes Nanocomposite. Membranes. 2022; 12(11):1150. https://doi.org/10.3390/membranes12111150
Chicago/Turabian StylePietrzak, Karolina, Klaudia Morawska, Szymon Malinowski, and Cecylia Wardak. 2022. "Chloride Ion-Selective Electrode with Solid-Contact Based on Polyaniline Nanofibers and Multiwalled Carbon Nanotubes Nanocomposite" Membranes 12, no. 11: 1150. https://doi.org/10.3390/membranes12111150