Article

Power Generation Performance of Reverse Electrodialysis (RED) Using Various Ion Exchange Membranes and Power Output Prediction for a Large RED Stack

1
Graduate School of Science and Technology for Innovation, Yamaguchi University, 2-16-1 Tokiwadai, Ube, Yamaguchi 755-8611, Japan
2
Blue Energy Center for SGE Technology (BEST), Yamaguchi University, 2-16-1 Tokiwadai, Ube, Yamaguchi 755-8611, Japan
*
Author to whom correspondence should be addressed.
Membranes 2022, 12(11), 1141; https://doi.org/10.3390/membranes12111141
Submission received: 17 October 2022 / Revised: 5 November 2022 / Accepted: 8 November 2022 / Published: 13 November 2022
(This article belongs to the Special Issue State-of-the-Art Membrane Science and Technology in Japan 2021, 2022)

Abstract

:
Reverse electrodialysis (RED) power generation using seawater (SW) and river water is expected to be a promising environmentally friendly power generation system. Experiments with large RED stacks are needed for the practical application of RED power generation, but only a few experimental results exist because of the need for large facilities and a large area of ion-exchange membranes (IEMs). In this study, to predict the power output of a large RED stack, the power generation performances of a lab-scale RED stack (40 membrane pairs and 7040 cm2 total effective membrane area) with several IEMs were evaluated. The results were converted to the power output of a pilot-scale RED stack (299 membrane pairs and 179.4 m2 total effective membrane area) via the reference IEMs. The use of low-area-resistance IEMs resulted in lower internal resistance and higher power density. The power density was 2.3 times higher than that of the reference IEMs when natural SW was used. The net power output was expected to be approximately 230 W with a pilot-scale RED stack using low-area-resistance IEMs and natural SW. This value is one of the indicators of the output of a large RED stack and is a target to be exceeded with further improvements in the RED system.

1. Introduction

Recently, salinity gradient energy (SGE), which is generated when two salt solutions with different concentrations are mixed, has attracted attention as a renewable energy source. Reverse electrodialysis (RED) is a technology that converts SGE into electrical energy using ion exchange membranes (IEMs) [1,2]. RED power generation uses the electrochemical potential created by IEMs to generate electricity and has access to a nearly inexhaustible supply of seawater (SW) and river water (RW), thus eliminating issues regarding depletion of energy sources. As RED power generation is largely unaffected by weather conditions and has a high operating rate, it has great potential as a new power generation method.
A RED stack comprises alternating layers of cation exchange membranes (CEM) and anion exchange membranes (AEM) between two electrodes. Gaskets with spacer nets are placed between the membranes to maintain a constant distance between the membranes, create a flow path, and agitate the solutions. An electric potential difference is generated by alternately supplying high- and low-concentration solutions between the membranes. When an external load resistance is connected to the two electrodes, ionic diffusion from the high-concentration side to the low-concentration side is converted to an electric current by a redox reaction at the electrodes; hence, the RED stack generates electricity, i.e., converts SGE to electricity.
In REDs, where ion diffusion plays a leading role, the selective transport of ions through IEMs is important for power generation in the RED system [3]. Therefore, evaluations of small (lab-scale) RED stack power generation performance using various membranes have been conducted [4,5,6,7,8,9,10,11,12,13,14,15,16,17,18,19,20,21,22]. Even if limited to commercial membranes, Neosepta ® CMX, AMX (Astom Corp., Yamaguchi, Japan) [6,12,14,18,21,22], Fuji V1, Fuji V2, Fuji-CEM, Fuji-AEM (FUJIFILM Manufacturing Europe B.V., Tilburg, The Netherlands) [10,11,15,18,19,20,21,22], Selemion® CSO, AMV (AGC Inc., Tokyo, Japan) [6,18,21], Fumasep® FKS, FAS, (FUMATECH BWT GmbH, Bietigheim-Bissingen, Germany) [5,6,10], PC-SK, PC-SA (PC Cell GmbH, Heusweiler, Germany) [17], Ralex® CMH, AMH (MEGA AS, Straz Pod Ralskem, Czech Republic) [6,7], and many other commercial membranes have been tested. However, performance evaluations with large (pilot-scale) RED stacks are required for practical use. Tedesco et al. have demonstrated 65 W with 5 M NaCl and 0.03 M NaCl in the RED stack with 125 CEM PR1/AEM PR1 (FUJIFILM Manufacturing Europe B.V., The Netherlands, with a total effective membrane area of 48.4 m2) membrane pairs [23] and 309 W with 215 mS cm−1 NaCl and 3.5 mS cm−1 NaCl in the RED stack with 500 CEM PR1/AEM PR1 (with a total effective membrane area of 193.6 m2) membrane pairs [24]. Nam et al. achieved 309 W with natural SW and treated wastewater in the RED stack with 1000 CEM Type-I/AEM Type-I (FUJIFILM Manufacturing Europe B.V., The Netherlands, with a total effective membrane area of 250 m2) membrane pairs [25]. Mehdizadeh et al. achieved 39 W with 53 mS cm−1 NaCl and 1.3 mS cm−1 NaCl in the RED stack with 200 Neosepta® CMX/AMX (Astom Corp., Japan, with a total effective membrane area of 40 m2) membrane pairs [26] and 263 W with 1 M NaCl and water treatment plant surface water (0.34 mS cm−1) in the RED stack with 299 Neosepta® CIMS/ACS-8T (Astom Corp., Japan, with a total effective membrane area of 179.4 m2) membrane pairs [27]. Although it is important to compare the performance of RED stacks using different IEMs with different properties, it is difficult to evaluate the relationship between membrane properties such as membrane resistance, ion selectivity, and RED performance in pilot-scale RED systems with large membrane areas. Therefore, only a few studies have been conducted on the performance of pilot-scale RED stacks using various types of IEMs. We evaluated the performance of the pilot-scale RED stack using the CIMS and ACS-8T [27]. By evaluating the performance of lab-scale stacks using various commercial IEMs, including CIMS/ACS-8T, and determining the performance ratio between commercial CEMs/AEMs and CIMS/ACS-8T, we can estimate the pilot-scale RED performance using these IEMs.
The objective of this study is to predict the power output of a pilot-scale RED stack with various commercial IEMs from experiments using a lab-scale RED stack. We evaluated and analyzed the power generation performance of a lab-scale RED stack with 40 membrane pairs and a total membrane area of 7040 cm2 using five types of CEM/AEMs with different membrane properties, including reference membranes; CIMS and ACS-8T. Model SW, model concentrated SW (RO brine), and natural SW were used as feed solutions. To discuss the differences in the open-circuit voltage of the lab-scale RED stack, the membrane potential of each IEM was measured. This study suggests that the output of pilot-scale RED could be more than doubled by changing CIMS/ACS-8T to IEMs with low-area-resistance.

2. Experimental Section

2.1. Membranes

CEM and AEM pairs: Neosepta® CSE/ASE, Neosepta® CMX/AMX, Neosepta® CIMS/ACS-8T, C-2/A-2 (ASTOM Corp., Japan), and Fumasep® FKS-20/FAS-20 (FUMATECH BWT GmbH, Germany) were used as CEM/AEM for lab-scale RED stacks. CSE/ASE and CMX/AMX are the current- and previous-generation standard membranes, respectively. The CIMS/ACS-8T are monovalent ion-selective membranes. C-2/A-2 and FKS-20/FAS-20 exhibited low-area-resistance. Membrane properties were measured in the same way as previously described [28,29]. The basic properties of the membranes used in this study are listed in Table 1. For the monovalent ion-selective membranes, CIMS and ACS-8T, the membrane potentials were measured with the selective side facing the high-concentration solution. For all basic membrane properties and membrane potential measurements, all reagents were of analytical grade, and solutions were prepared using ion-exchanged water.

2.2. Solutions for RED Power Generation Test

A 50 mS cm−1 (≈0.516 M, M = mol dm−3) NaCl solution and 90 mS cm−1 (≈1.18 M) NaCl solution were used as model SW and model RO brine, respectively, because we had used RO brine from Mamizu Pia (Fukuoka, Japan) in a previous study, and its conductivity was approximately 90 mS cm−1 [30]. 0.30, 0.45, 1.50, 2.24, and 3.40 mS cm−1 (≈2.3, 3.7, 13.5, 20.3, and 31.1 mM) NaCl solutions were used as model river water (RW). To evaluate the power generation performance of the RED stack using actual solutions, SW collected at an SW desalination plant (Chatan, Okinawa, Japan) was used as the high-concentration solution (HS) and surface water from a water treatment plant (Chatan, Okinawa, Japan) was used as the low-concentration solution (LS). The electrical conductivity and ionic composition of natural SW and surface water are listed in Table 2. Natural SW and surface water were filtered using a filtration system (AF-4, ZEOLITE Co. Ltd., Fukuoka, Japan) to remove impurities before use. Surface water was adjusted to conductivities of 0.45, 1.50, 2.24, and 3.40 mS cm−1 by adding natural SW. 3.0 M NaCl solution was used as the electrode solution in both the model and natural solutions. All NaCl solutions used for RED power generation tests were prepared using 95% NaCl purchased from Diasalt Corporation (Nagasaki, Japan) and tap water.

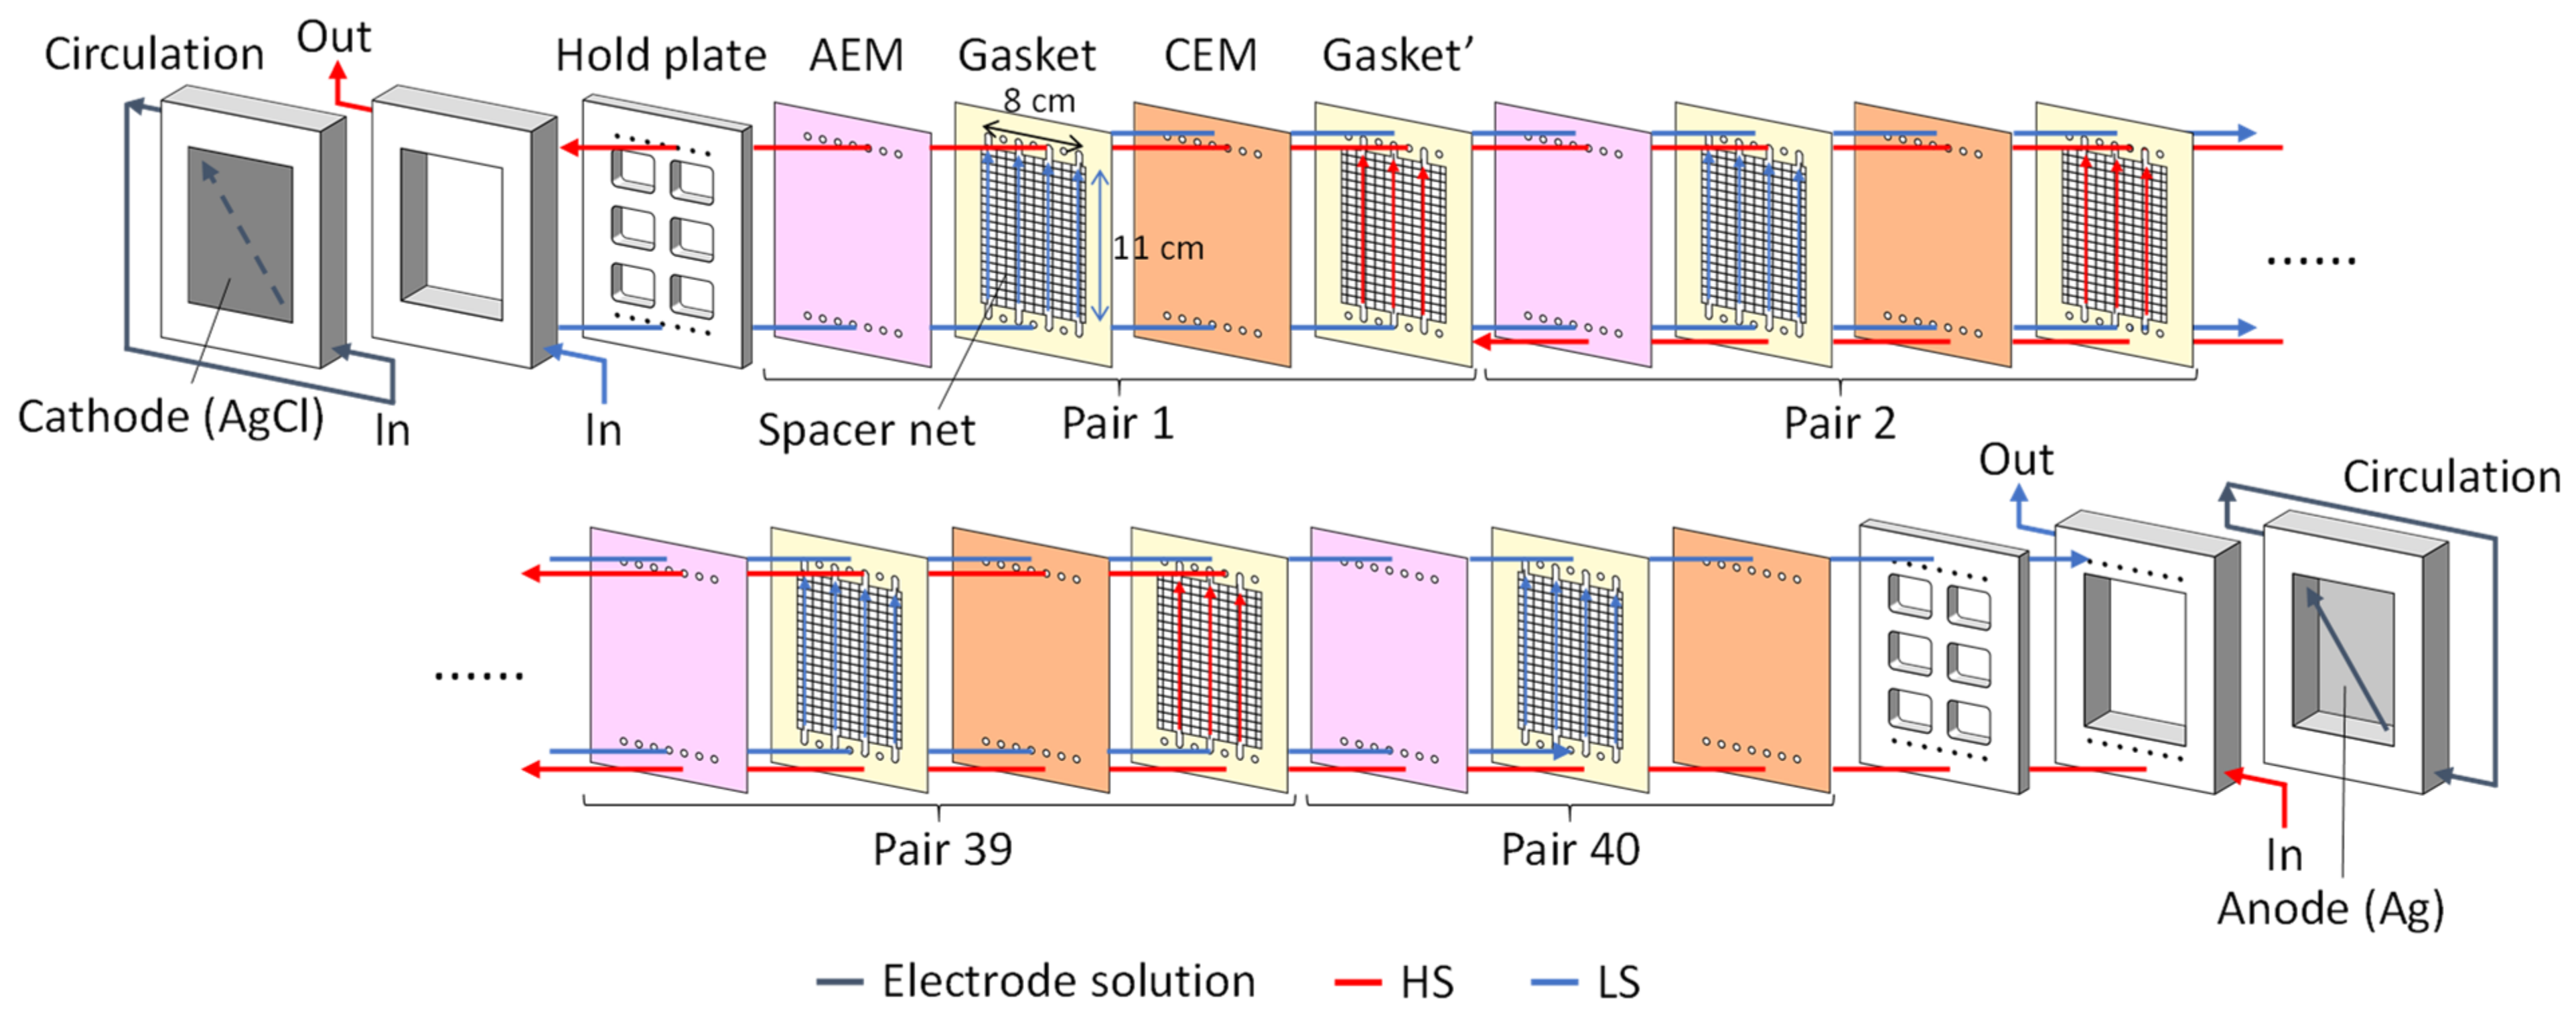
2.3. Construction of the Lab-Scale RED Stack

Figure 1 shows a schematic of the lab-scale RED stack. Forty pairs of CEMs/AEMs were used for the RED stack. The monovalent ion-selective membranes, CIMS, and ACS-8T were stacked alternatively with the ion-selective surface facing the HS. The effective area of the membrane in contact with the solution per IEM was 88 cm2 (11 cm × 8 cm). The total effective membrane area of the RED stack was 7040 cm2 (88 cm2 × 80). To maintain the inter-membrane distance and prevent solution leakage, a gasket with an integrated spacer of 200 μm thickness was placed between the CEM and AEM. Ag and AgCl were used as cathode and anode, respectively.

2.4. Evaluation of Power Generation Characteristics

Figure S1 shows a flow diagram of the RED stack performance evaluation. Solutions were fed to the RED stack using a magnet pump (MD-30RZ-N, IWAKI Co., Ltd., Tokyo, Japan), and the linear flow velocity (vLS) in the LS channel inside the RED was set to 2.0 cm s−1 (0.77 L min−1). The linear flow velocity was calculated using the following equation:
v LS = Q LS d L N
where QLS is the flow rate in the LS channel, d is the distance between membranes (200 μm), L is the width of the flow channel (8 cm), and N is the number of membrane pairs (40). The flow rate of the HS channel was set such that the pressure at the HS channel inlet was 3 kPa higher than that at the LS channel inlet. The pressures of the HS and LS channels were measured using a digital pressure gauge (KDM30, Krone Corporation, Tokyo, Japan).
An electronic load device (PLZ164W, Kikusui Electronics Corporation, Kanagawa, Japan) was connected to the electrodes of the RED stack, and the current (I) was varied from 0 A at a rate of 0.2 A min−1 to measure the voltage (V)–I curve. V in the RED stack is expressed as follows:
V = V OC R int I
where VOC is the open-circuit voltage and Rint is the internal resistance of the RED stack. VOC is defined as the voltage at zero current in the V-I curve. Contrastingly, assuming that the intramembrane diffusion potential is negligible, VOC can be calculated from the Nernst equation [31].
V OC ,   theory = 2 t ave N R T F ln γ HS c HS γ LS c LS
t ave = t CEM + t AEM 2
where tCEM and tAEM are the transport numbers of the CEM and AEM, respectively; tave is the average of the transport numbers of CEM and AEM; R is the gas constant (8.314 J mol−1 K−1); T is the absolute temperature; F is the Faraday constant (96,485 C mol−1); γHS is the activity coefficient of NaCl in HS; γLS is the activity coefficient of NaCl in LS; cHS is the concentration of NaCl in HS; and cLS is the concentration of NaCl in LS. VOC, theory was calculated using T = 298 K and tave = 0.98, and the activity coefficient values from Table S1. Although Rint is ideally obtained from the slope of the V-I curve (see Equation (2)), the slope of the actual V-I curve in the RED performance test was not constant and decreased with increasing current because the higher the current, the higher the conductivity of the solution on the LS side owing to ionic diffusion. Therefore, Rint was defined in this study as the slope of the V-I curve at the current value when the maximum output (Pmax) was obtained. From Equation (2), and P = V I , Pmax is given by [32]
P max = V OC 2 4 R int
The maximum output density (PDmax), which is the maximum output per membrane area, was calculated using the following equation:
P D max = P max 2 A N
where A is the effective membrane area (88 cm2).

3. Results and Discussion

3.1. Model SW and Model RW

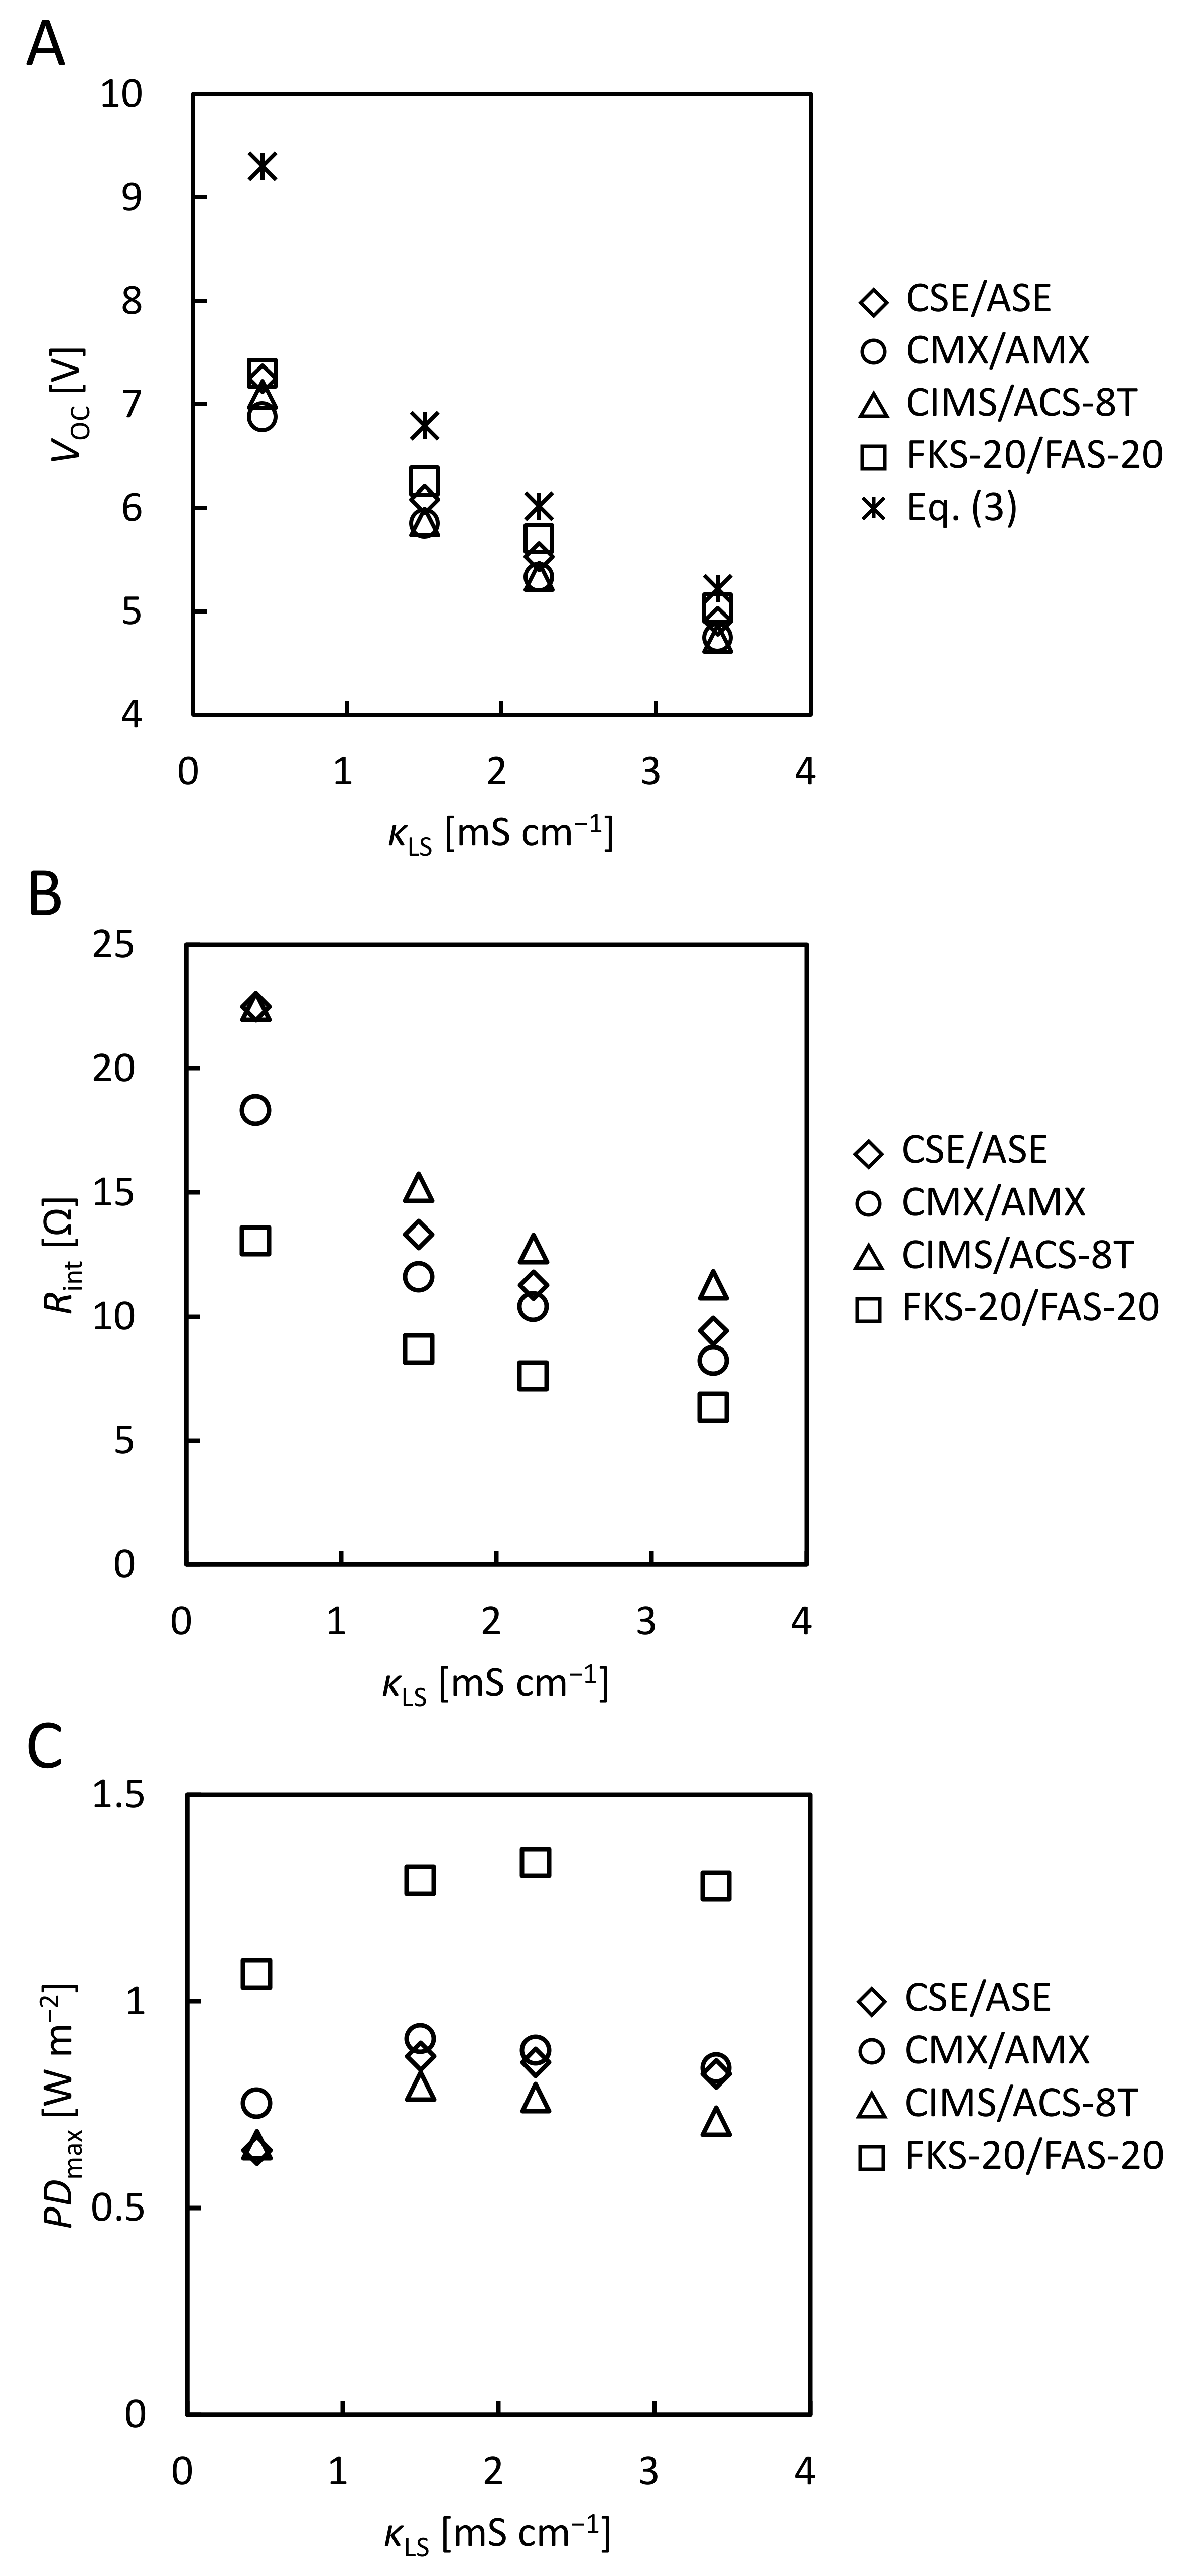
3.1.1. Comparison of the Open Circuit Voltage

The open-circuit voltage (VOC) and internal resistance of the RED stack (Rint) are important factors for analyzing the performance of the RED stack. The conductivity of SW or RO brine as an HS depends on the site location of the RED plant. Therefore, examining the effect of conductivity at the LS channel on VOC and Rint is an important factor when considering the operating conditions for obtaining a high RED output.
Figure S2 shows the V-I curves of the RED stacks with various membrane pairs using model SW and model RW. Figure 2A shows the LS conductivity (κLS) dependence of VOC obtained from the voltage at zero current in these V-I curves. For all IEM pairs, VOC decreased as κLS increased because the concentration ratio cHS/cLS in Equation (3) decreased with an increase in κLS. The VOC increased in the following IEMs pair order: CMX/AMX < CIMS/ACS-8T < CSE/ASE < FKS-20/FAS-20. VOC per pair of CIMS/ACS-8T was 0.18, 0.15, 0.13, and 0.12 V at κLS = 0.45, 1.50, 2.24, and 3.40 mS cm−1, respectively. In previous studies, VOC per CIMS/ACS-8T pair using a pilot-scale RED stack at various feed flow rates was 0.14~0.17 V using 50 mS cm−1 NaCl as HS and 0.34 mS cm−1 surface water as LS [27]. The VOC per CIMS/ACS-8T pair using the lab-scale RED stack in this study showed almost the same values as those obtained using the pilot-scale RED stack.
The experimental values of VOC for all IEM pairs were lower than the values calculated from Equation (3) for all the κLS values. In particular, VOC was much lower than VOC,theory, at a smaller κLS. To examine the cause of the deviation between VOC and VOC,theory, the membrane potential of a diffusion dialysis system consisting of an IEM, and 50 and 1.5 mS cm−1 NaCl solution was measured, as shown in Figure S3A. The absolute values of the membrane potential were approximately 88 mV for all the CEMs and 80 mV for all the AEMs. In previous studies, the absolute value of the membrane potential of CMX was higher than that of AMX [33,34]. The difference in the absolute values of the membrane potential between CEM and AEM is expected to be due to the junction potential between the salt bridges (3 M KCl) and the measurement solutions (50 and 1.5 mS cm−1 NaCl solutions) [29]. The membrane potential generated when 40 pairs of CEMs/AEMs are stacked (total ϕm), can be calculated using the following equation:
Total   ϕ m = 40 ϕ m , CEM + ϕ m , AEM
where ϕm,CEM and ϕm,AEM are the membrane potentials of the CEM and AEM, respectively. The calculated total ϕm is shown in Figure S3B. The calculated values of all IEM pairs used in this study were slightly lower than the ideal membrane potential (≈6.8 V) calculated using Equation (3). Here, the junction potential mentioned above was canceled out when |ϕm,CEM| and |ϕm,AEM| were added together. There were few differences in the total ϕm between the IEM pairs. This indicates that the effect of the difference in the membrane properties listed in Table 1 on the membrane potential is small under the measurement conditions. The deviation between the total ϕm (≈6.8 V) and VOC of the stack using the IEMs pairs at κLS = 1.50 mS cm−1 (5.9~6.3 V) was not negligible. The possible causes of the deviation are as follows: In the case of the membrane potential in the diffusion dialysis system, there is no spacer on the membrane surfaces, and the solutions in contact with the membrane were well stirred. However, there is a spacer on the membrane surfaces in the feed channels of the RED stack. Hence, the effect of concentration polarization on the decrease in the membrane potential in the stack [27] will be higher than that in the diffusion dialysis system. FKS-20/FAS-20 had the highest VOC among all CEM/AEM pairs, indicating that FKS-20/FAS-20 may have the lowest osmotic water flow, which is a cause of the decrease in the membrane potential due to the external concentration gradient.

3.1.2. Comparison of the Internal Resistance

The V-I curves in Figure S2 show that the slope is not straight and decreases as the current increases, although the V-I curve is theoretically straight (see Equation (2)). This is due to the increase in the concentration of the LS channel in the stack because of the diffusion of ions from the HS to the LS when an electric current is generated, resulting in a decrease in the Rint of the RED stack. Hence, in this study, Rint was defined as the slope of the V-I curve at the current when Pmax was obtained, as described in Section 2.4.
Figure 2B shows the κLS dependence of Rint. For all the IEM pairs, Rint decreased as κLS increased, which was due to the decrease in LS resistance. The value of Rint ranged from 6 Ω to 23 Ω. In a previous study, the RED stack with a comparable effective membrane area (100 cm2 × 50 FKD/FAD (FUMATECH BWT GmbH, Bietigheim-Bissingen, Germany) pairs = 10,000 cm2 and 200 μm inter-membrane distance) using 30 g NaCl L−1 (≈0.51 M NaCl) as HS and 1 g NaCl L−1 (≈0.017 M NaCl) as LS showed a Rint value of approximately 18 Ω [35]. The stack had the same inter-membrane distance (200 μm) and almost the same membrane resistance (CEM; FKD 2.14 Ω cm2 and AEM; FAD 0.89 Ω cm2 [6]) as those of our stack. Hence, the stack resistance per pair of CEM/AEM (0.345 Ω) [6] was almost the same as that of our stack (0.15–0.575 Ω). The Rint increased in the following IEM pairs order: FKS-20/FAS-20 < CMX/AMX < CSE/ASE CIMS/ACS-8T. The stack using FKS-20/FAS-20 had the lowest Rint among all the stacks. This is attributed to the lowest area resistance of FKS-20/FAS-20 in all IEM pairs. In contrast, the highest Rint value was obtained when the CIMS/ACS-8T pair was used. In previous studies, the Rint of CIMS/ACS-8T was higher than that of CMX/AMX [29], which is consistent with the current tendency. This will be due to the fact that membrane resistance was measured by the alternating current (AC) method; on the other hand, direct current was generated in a RED stack. Owing to the monovalent ion-selective surface of CIMS and ACS-8T, the resistance was higher for direct current than for alternating current.
The RED stack comprised one electrode pair and many cell pairs. The cell comprised the flow channels of the HS, LS, CEM, and AEM. Hence, to analyze the dependence of the electrical resistance of each component on Rint, the internal resistance of the RED stack (Rint,cal,) was calculated from the summation of the resistances due to the electrode, HS, LS, CEM, and AEM, including the spacer shadow effect [36]:
R int ,   cal = R el + ( R HS + R LS + R CEM + R AEM )
R HS = β sol N d A κ HS
R LS = β sol N d A κ LS
R CEM = β mem N R A ,   CEM A
R AEM = β mem N R A ,   AEM A
where Rel is the electrode resistance; RHS and RLS are the resistances of the channels at HS and LS, respectively; RCEM and RAEM are the resistances of the CEM and AEM, respectively; βsol is the spacer shadow effect in the solution compartment (1.93); βmem is the spacer shadow effect on the membrane (1.10); κHS is the conductivity of HS. Details of the calculation of βsol and βmem are provided in the Supplementary Materials.
Figure S4 shows the κLS dependence of Rint,cal. For all IEM pairs at all values of κLS, RLS occupied the highest proportion of Rint,cal. The second highest proportion in Rint,cal was RCEM + RAEM, and the contribution of Rel and RHS to Rint,cal was low. The experimental values at κLS = 0.45 mS cm−1 were lower than Rint,cal values in all IEM pairs. As mentioned above, the conductivity of the LS channel inside the RED cells will be higher than that of the LS channel inlet because of ionic diffusion via the IEMs. Simultaneously, the conductivity of the HS channel decreases; however, the contribution of RLS is much larger than that of RHS. Therefore, Rint was lower than Rint,cal due to the increase in the conductivity of the LS channel. At κLS ≥ 1.50 mS cm−1, the Rint values of CSE/ASE, CMX/AMX, and FKS-20/FAS-20 were lower than Rint,cal, while those of CIMS/ACS-8T were almost the same as Rint,cal. This will be due to the fact that the former three IEM pairs had lower resistance than CIMS/ACS-8T (see Figure 2B); hence, the RED stack had a higher electric current than CIMS/ACS-8T. Owing to the high current, the resistance of the LS channel is lower than that calculated.

3.1.3. Comparison of the Maximum Power Density

Figure 2C shows the κLS dependence of the PDmax. For CSE/ASE, CMX/AMX, and CIMS/ACS-8T, PDmax was maximal around κLS = 1.50 and 2.24 mS cm−1. For FKS-20/FAS-20, PDmax was maximal around κLS = 2.24, and 3.50 mS cm−1. This is due to the decrease in VOC and Rint with increasing κLS (see Equation (5)). PDmax increased in the following IEM pairs order: CIMS/ACS-8T < CSE/ASE < CMX/AMX < FKS-20/FAS-20. The small PDmax in CIMS/ACS-8T is due to the small VOC and high Rint, while the large PDmax in FKS-20/FAS-20 is due to the large VOC and low Rint. 1.3 W m−2 was especially obtained with FKS-20/FAS-20 at κLS = 2.24 mS cm−1. In the past, 1.2 W m−2 has been reported with the RED stack having a comparable effective membrane area (100 cm2 × 25 FKD/FAD pairs = 5000 cm2 and 200 μm inter-membrane distance) using 30 g NaCl L−1 (≈0.51 M NaCl) as HS and 1 g NaCl L−1 (≈0.017 M NaCl) as LS [37]. The value in this study, 1.3 W m−2, to our best knowledge, is the highest power density in the world at lab-scale RED stacks (effective membrane area of 5000~7000 cm2). This will be due to the lower membrane resistance of FKS-20/FAS-20 (0.93 Ω cm2 at CEM/AEM pair) compared to FKD/FAD (3.03 Ω cm2 [6] at CEM/AEM pair) in the previous study. Compared to CIMS/ACS-8T (0.77 W m−2), FKS-20/FAS-20 had 1.7 times higher PDmax at κLS = 2.24 mS cm−1.
When using model SW as HS and model RW as LS, the values of VOC were lower than the theoretical values at all κLS. This is due to the concentration polarization on the membrane surface in the RED stack. FKE-20/FAS-20 had the highest VOC in all CEMs/AEMs used in this study, which indicates FKS-20/FAS-20 may have the lowest osmotic water flow. Rint was lowest with FKS-20/FAS-20. This is attributed to the low-area-resistance and large current flow. When using FKS-20/FAS-20, the highest VOC and the lowest Rint produced the highest output.

3.2. Model RO Brine and Model RW

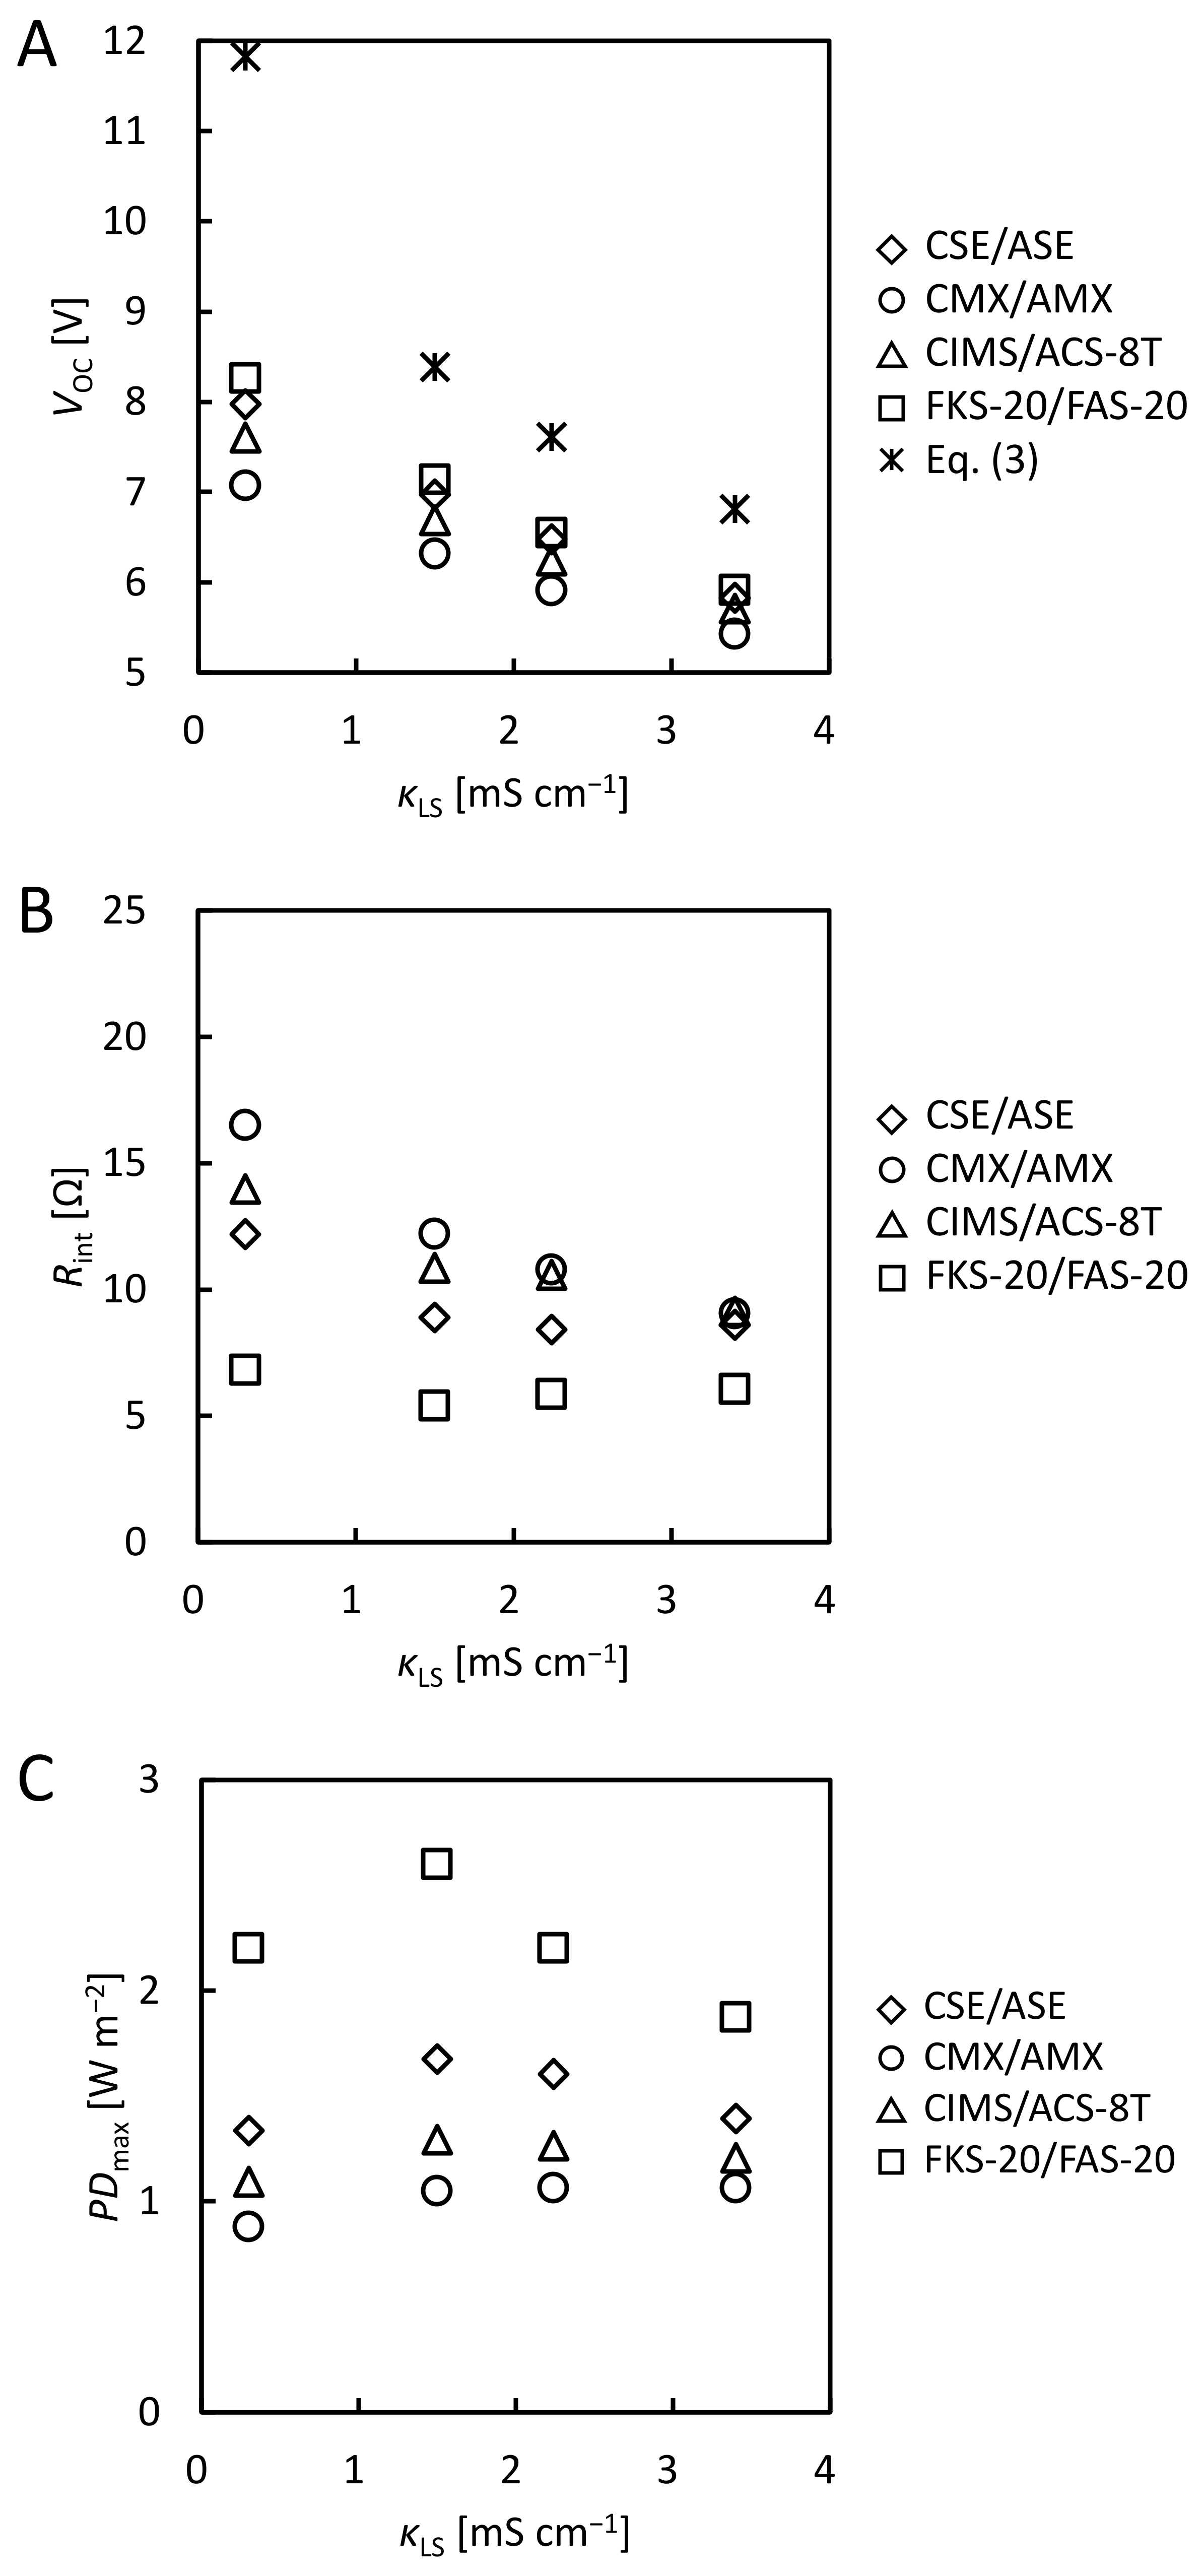
3.2.1. Comparison of the Open Circuit Voltage

Figure S5 shows the V-I curves of the RED stacks using the model RO brine and model RW with various membrane pairs. Figure 3A shows the κLS dependence of VOC obtained from the V-I curves. For all IEM pairs, VOC decreased as κLS increased owing to a decrease in cHS/cLS (see Equation (3)). For all IEM pairs, because cHS/cLS of model RO brine was larger than that of model SW, the VOC for model RO brine was larger than that for model SW. VOC increased in the following IEM pairs order: CMX/AMX < CIMS/ACS-8T < CSE/ASE < FKS-20/FAS-20, which is of the same order as VOC using model SW (Figure 2A). The VOC per pair of CIMS/ACS-8T was 0.19, 0.17, 0.16, and 0.14 V at κLS = 0.30, 1.50, 2.24, and 3.40 mS cm−1, respectively. In a previous study, the VOC per pair of CIMS/ACS-8T using a pilot-scale RED stack at various feed flow rates was 0.17~0.18 V using 90 mS cm−1 NaCl as HS and 0.34 mS cm−1 surface water as LS [27]. This indicates that not only the use of model SW but also model RO brine as HS, the VOC per pair of CIMS/ACS-8T using the lab-scale RED stack in this study showed almost the same values as those using the pilot-scale RED stack. VOC obtained from the experiment in all IEM pairs was 20% to 40% lower than VOC, theory calculated from Equation (3) (11.8, 8.4, 7.6, and 6.8 V).
To examine the cause of the differences in VOC between IEM pairs and the deviation between VOC and VOC,theory, the membrane potential of a diffusion dialysis system consisting of an IEM, and 90 and 1.50 mS cm−1 NaCl solutions was measured and is shown in Figure S6A. The absolute values of the membrane potential were approximately 102 mV for all the CEMs and 91 mV for all the AEMs. The membrane potential generated when 40 pairs of CEMs/AEMs were stacked (total ϕm) is shown in Figure S6B. The calculated values of all IEM pairs (≈7.7 V) were lower than the ideal membrane potential (8.4 V) calculated using Equation (3). This could be attributed to a decrease in the transport number of IEMs owing to the use of a high concentration of NaCl solution (≈1.2 M), and the concentration ratio at the two membrane surfaces will decrease because of the external concentration polarization caused by osmotic water flow. CIMS/ACS-8T had the highest total ϕm in all IEM pairs; however, VOC was lower than that of CSE/ASE and FKS-20/FAS-20. The difference between the VOC of the RED stack and the total ϕm in the diffusion dialysis system will be due to the difference in the concentration polarization between the RED stack [27] and the diffusion dialysis system mentioned in Section 3.1.1.

3.2.2. Comparison of the Internal Resistance

Figure 3B shows the κLS dependence of Rint obtained from the slope of the V-I curve (Figure S5) at the current when Pmax was obtained. Rint decreased with κLS due to a decrease in the conductivity of the LS side in the RED stack. Rint increased in the following IEM pairs order: FKS-20/FAS-20 < CSE/ASE < CIMS/ACS-8T < CMX/AMX. Rint of FKS-20/FAS-20 were 5.4~6.8 Ω and the values were 30~59% lower than the other IEM pairs. This is attributed to the lowest area resistance of FKS-20/FAS-20 in all the IEM pairs and the increase in the conductivity of the LS channel due to the high current (see Figure S5). Additionally, the κLS dependence of Rint of FKS-20/FAS-20 showed strange trends that were different from other IEM pairs, that is, Rint increased with the increase of κLS at κLS ≥ 1.5 mS cm−1. This will be due to the following reason: Rint was calculated at the current when Pmax was obtained. At κLS = 1.5 mS cm−1, FKS-20/FAS-20 showed the current value of 0.58 A at Pmax, while the current values were about 0.52 A and 0.47 A at Pmax at κLS = 2.24 and 3.40 mS cm−1, respectively. Thus, the high current will decrease the resistance of LS channel. Therefore, FKS-20/FAS-20 showed the lowest Rint at κLS = 1.5 mS cm−1. All IEM pairs except for FKS-20/FAS-20 had almost the same Rint value for each other at κLS = 3.40 mS cm−1. This is because at the high conductivities, the contribution of the resistance of HS and LS channels on Rint will be larger than that of the membrane resistance. Except for the CMX/AMX at κLS = 1.50, 2.24, and 3.40 mS cm−1, Rint values in all the IEM pairs were lower than those with model SW. Model RO brine has lower resistance than model SW, and the increase in κLS caused by ion diffusion from the HS channel will be greater than from model SW due to the concentration difference, resulting in above lower Rint values. When model SW was used in CMX/AMX, internal leakage in the RED stack may have occurred, which caused an increase in κLS and a decrease in Rint.
The κLS dependence of the calculated values (Rint,cal) is shown in Figure S7. At κLS = 0.30 mS cm−1, Rint,cal is large (≈60 Ω) because of the low conductivity of the LS channel. For the same reason as the model SW, the experimental values were much lower than Rint,cal at κLS = 0.30 mS cm−1. At κLS ≥ 1.50 mS cm−1, the Rint,cal values were not much different from those of model SW because the contribution of the RHS to Rint,cal was low. However, the experimental values (Rint) using the model RO brine were lower than the values of Rint,cal because of the increase in the conductivity of the LS channel caused by ion diffusion from the HS channel.

3.2.3. Comparison of the Maximum Power Density

Figure 3C shows the κLS dependence of the PDmax. For all IEM pairs, PDmax reached maximum values around κLS = 1.50 and 2.24 mS cm−1. Owing to an increase in the concentration ratio of HS and LS, the maximum PDmax with the model RO brine was larger than that with the model SW for all IEM pairs. PDmax increased in the following IEM pairs order: CMX/AMX < CIMS/ACS-8T < CSE/ASE < FKS-20/FAS-20. FKS-20/FAS-20 showed maximum PDmax (2.6 W m−2) at κLS = 1.50 mS cm−1 because of the lowest area resistances in all the IEM pairs (see Table 1). Additionally, compared to CIMS/ACS-8T (1.3 W m−2), FKS-20/FAS-20 showed 2.0 times larger PDmax at κLS = 1.50 mS cm−1. In the case of model SW, CMX/AMX showed the second highest PDmax; however, in the case of the model RO brine, they had the lowest PDmax. This is due to the lowest VOC and highest Rint of the IEM pair.
When using model RO brine as HS and model RW as LS, the values of VOC were lower than the values of VOC,theory, and the difference between VOC and VOC,theory was larger than when model SW was used as HS. This is due to the large difference in concentration between HS and LS, resulting in a large osmotic water flow and a large concentration polarization at the membrane surface. FKE-20/FAS-20 area resistance is low, showing the largest VOC and the lowest Rint in all CEMs/AEMs, and produced the highest output.

3.3. Natural SW and Surface Water

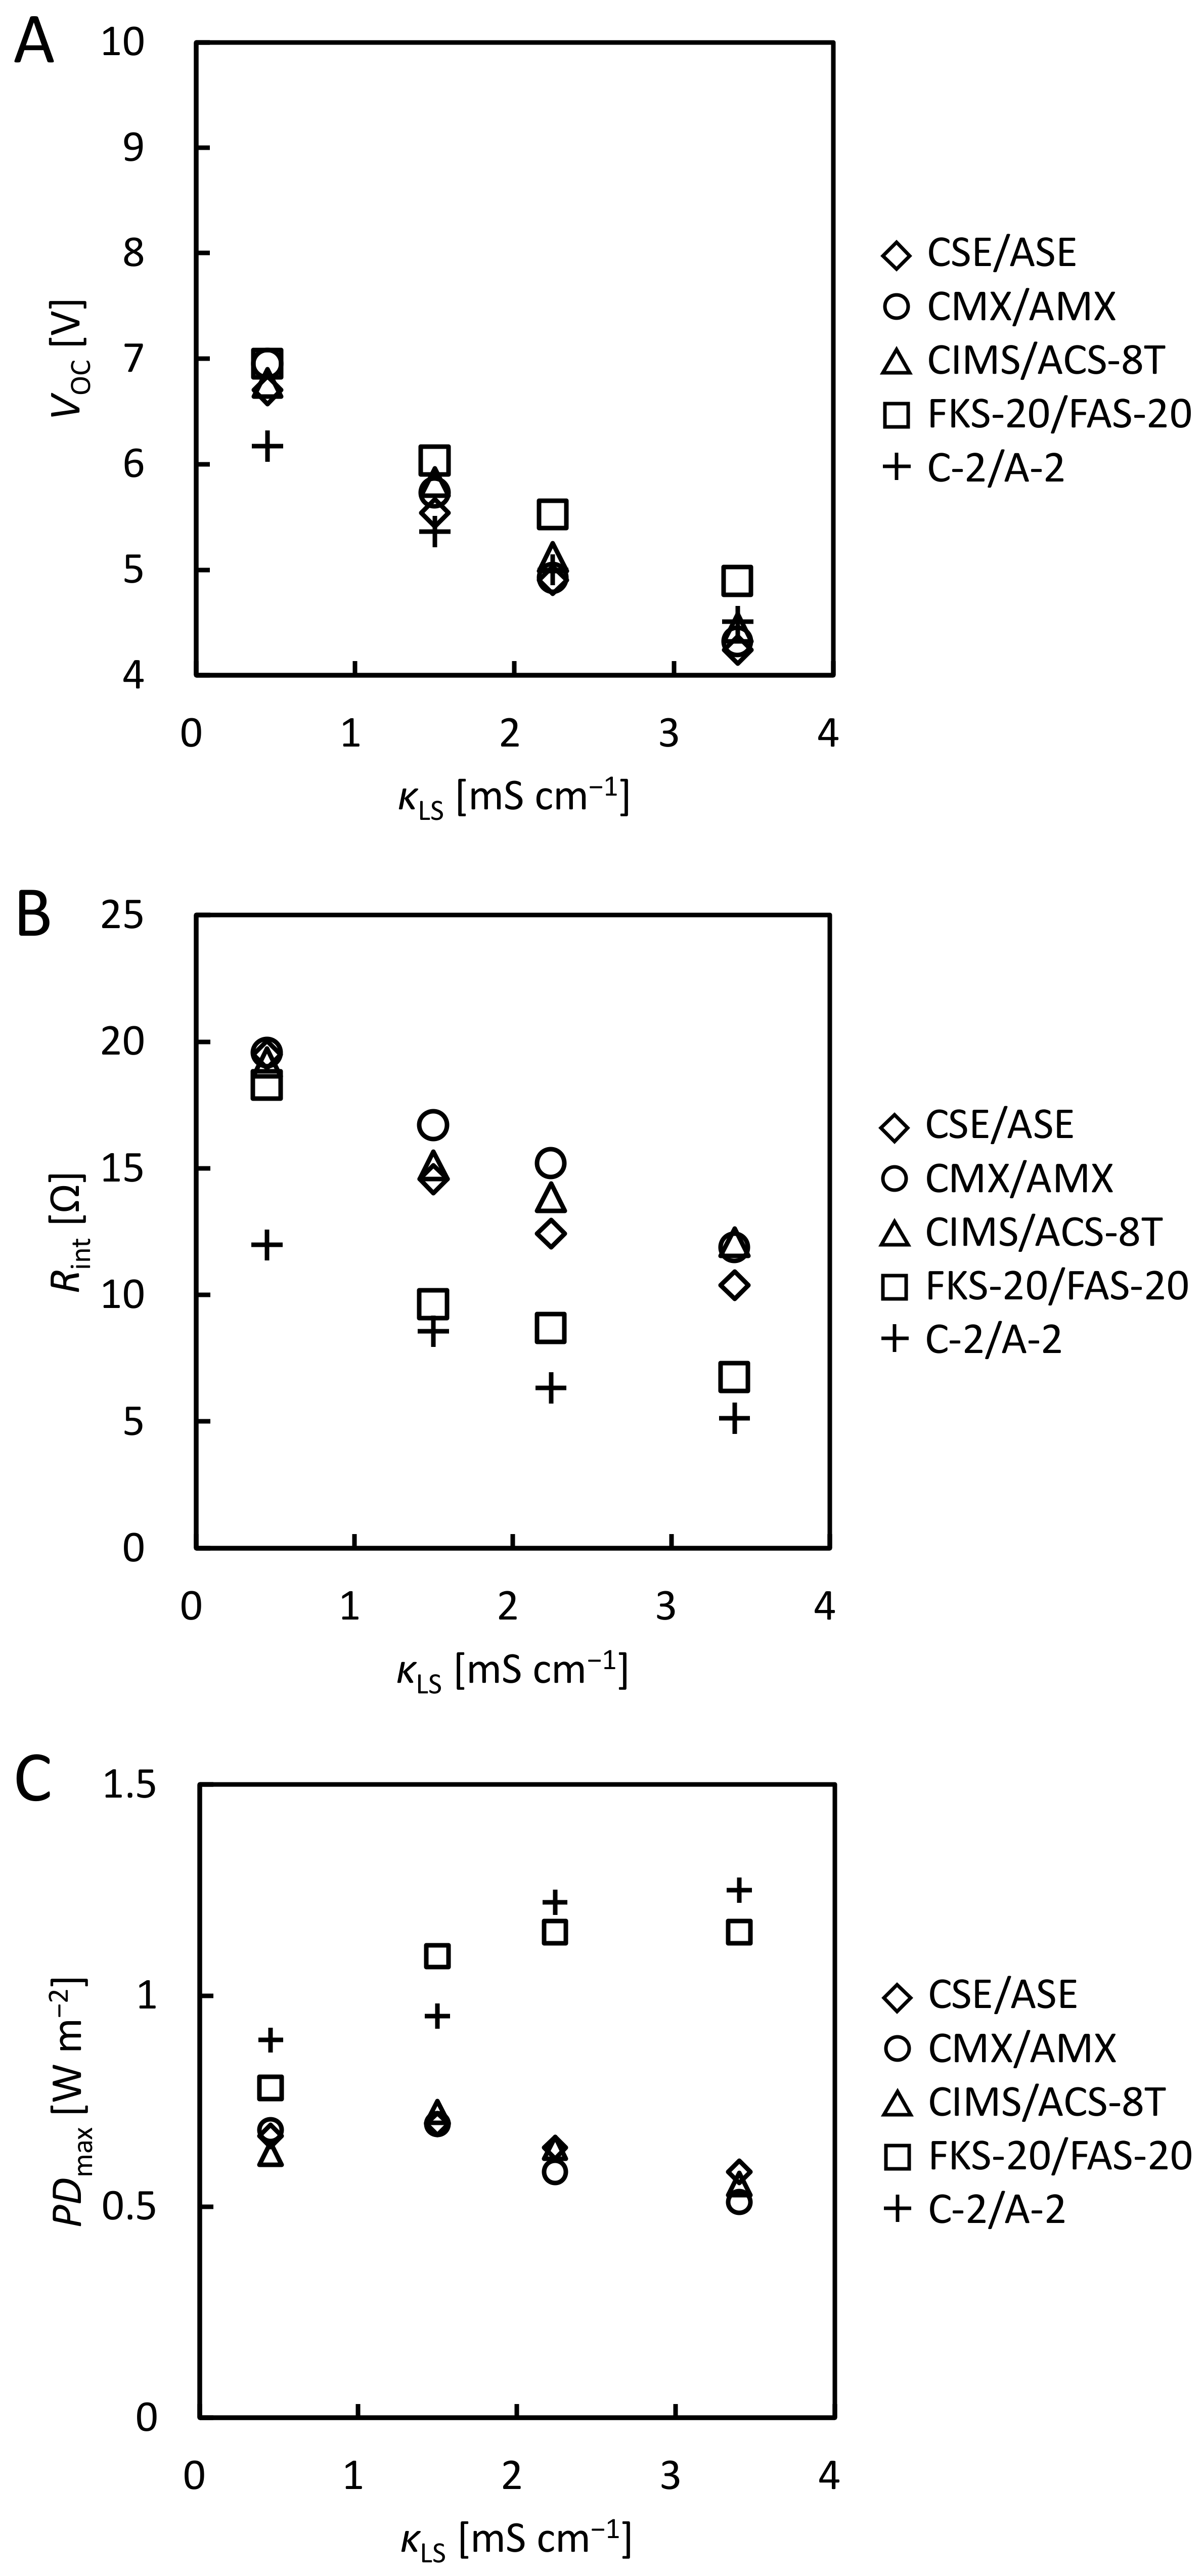
3.3.1. Comparison of the Open Circuit Voltage

Figure S8 shows the V-I curves of the RED stacks using natural SW and surface water with various membranes. Figure 4A shows the κLS dependence of VOC obtained from the V-I curves. For all IEM pairs, VOC decreased as κLS increased owing to a decrease in cHS/cLS (see Equation (3)). The values using natural SW were 1~14% smaller than those using model SW. Natural SW contains K+, Mg2+, Ca2+, and SO42−, in addition to Na+ and Cl contained in the model SW. In particular, the presence of divalent ions causes a decrease in VOC [11,18,19,20,38,39]. Although the order of VOC for the IEM pairs varied with the value of κLS, FKS-20/FAS-20 had the highest VOC (7.0, 6.0, 5.5, and 4.9 V) at all κLS value. This is the same as for the model SW and the model RO brine, which may be ascribed to the low osmotic water flow. VOC of the other IEMs pairs differed little (about 6.8, 5.6, 5.0, and 4.4 V) except for C-2/A-2 at κLS = 0.45 and 1.50 mS cm−1. C-2/A-2 is thinner than other IEMs (see Table 1) and may cause high osmotic water flow, which caused a concentration polarization and the low VOC. Almost equal VOC of CMX/AMX and CIMS/ACS-8T is consistent with the result that there was little difference in VOC when natural SW and distilled water were supplied to the RED stack (10 membrane pairs, 200 μm inter-membrane distance, 1760 cm2 total effective membrane area) using CMX/AMX and CIMS/ACS-8T [29]. VOC per pair of CIMS/ACS-8T using the lab-scale stack was 0.17, 0.15, 0.13, and 0.11 V at κLS = 0.45, 1.5, 2.2, and 3.4 mS cm−1, respectively. In a previous study, VOC per CIMS/ACS-8T pair using a pilot-scale RED stack at various feed flow rates was 0.15~0.17 V using 52 mS cm−1 natural SW as HS and 0.34 mS cm−1 surface water as LS [27].

3.3.2. Comparison of the Internal Resistance

Figure 4B shows the κLS dependence of Rint calculated from the slope of the V-I curve (Figure S8) at the current when Pmax was obtained. For all IEMs pairs, Rint decreased as κLS increased because the resistance of LS decreased. Except for κLS = 0.45 mS cm−1, Rint values were about 10% larger for CSE/ASE, CIMS/ACS-8T, and FKS-20/FAS-20 and 45% larger for CMX/AMX than those using model SW. This is due to the lower molar mobility of divalent ions in a membrane compared to monovalent ions such as Na+ and Cl, resulting in a larger Rint using natural SW containing the divalent ions [18,38,40]. C-2/A-2 had the lowest Rint (12, 8.6, 6.3, and 5.1 Ω) in all IEM pairs, with FKS-20/FAS-20 and CMX/AMX having the second lowest and the highest Rint, respectively. This result is ascribed to the lowest area resistance of C-2/A-2 (see Table 1) and high current value at Pmax (see Figure S8).
The κLS dependence of Rint,cal is shown in Figure S9. Because the calculations do not consider the presence of multivalent ions, the values of Rint,cal in natural SW were almost the same as those in Model SW. As in the case of model SW and model RO brine, the experimental values at κLS = 0.45 mS cm−1 were lower than Rint,cal values in all the IEM pairs. The experimental values using CSE/ASE and CIMS/ACS-8T at κLS ≥ 2.24 mS cm−1 and using CMX/AMX at κLS ≥ 1.50 mS cm−1 were larger than Rint,cal, probably because of the effect of multivalent ions. In the case of FKS-20/FA-20 and C-2/A-2, the experimental values at κLS ≥ 1.50 mS cm−1 were larger than Rint,cal because the decrease in the conductivity of the LS channel caused by the high current (see Figure S8) may be larger than the effect of multivalent ions.

3.3.3. Comparison of the Maximum Power Density

Figure 4C shows the κLS dependence of the PDmax. CSE/ASE, CMX/AMX, and CIMS/ACS-8T had almost the same PDmax as each other (about 0.66, 0.71, 0.62, 0.55 W m−2 at each κLS). For FKS-20/FAS-20 and C-2/A-2, PDmax increased as κLS increased (from 0.78 to 1.3 W m−2). For all IEM pairs, the values of PDmax using natural SW were 4~39% smaller than those using model SW because of the smaller VOC and larger Rint. The decrease in PDmax due to the use of a natural SW has been reported [16,17,19,38]. PDmax was largest when C-2/A-2 was used because it had the lowest Rint among all IEM pairs (see Figure 4B) except for κLS = 1.50 mS cm−1. In particular, 1.3 W m−2 was obtained at κLS = 3.40 mS cm−1, and this value was 2.3 times higher than that with CIMS/ACS-8T (0.55 W m−2).
When using natural SW as HS and surface water as LS, VOC was lower and Rint was higher than when model SW was used, which is due to the presence of multivalent ions. Although C-2/A-2 did not show the highest VOC, C-2/A-2 showed the lowest Rint due to the lowest area resistance, and thus produced the largest output in all IEM pairs.

3.4. Prediction of the Power Output with a Pilot-Scale RED Stack

Table 3 shows a summary of the best performance of the lab-scale RED stack in this study. VOC per one FKS-20/FAS-20 pair was 5.7/40 = 0.143 V and 7.1/40 = 0.178 V when using model SW and model RO brine, and VOC per one C-2/A-2 pair was 4.5/40 = 0.113 V when using natural SW. Compared to CIMS/ACS-8T as a control, FKS-20/FAS-20 showed 1.7 and 2.0 times higher PDmax when using model SW and model RO brine, and C-2/A-2 showed 2.3 times higher PDmax when using natural SW. We evaluated the performance of the pilot-scale RED stack with CIMS/ACS-8T (299 membrane pairs, 200 μm inter-membrane distance, 179.4 m2 total effective membrane area) using model SW (50 mS cm−1 NaCl), model RO brine (90 mS cm−1 NaCl), and natural SW as HS and surface water (the value of conductivity was 0.34 mS cm−1) as LS, and obtained a power output of 174 W, 263 W and 111 W, respectively [27]. In the pilot-scale RED stack, the flow rate was set to 21 L min−1 of HS and 32 L min−1 of LS to obtain above power outputs. The pumping energies at the flow rate were 44 W with model SW, 41 W with model RO brine, and 31 W with natural SW, respectively. When we assume that osmotic water flow through the IEMs and the internal salt leakage are comparable between the lab and the pilot-scale RED stacks, VOC in the pilot-scale RED stack in a case of using FKS-20/FAS/20 and C-2/A-2 using model SW, model RO brine, and natural SW are expected to be 0.143 × 299 ≈ 43 V, 0.178 × 299 ≈ 53 V, and 0.113 × 299 ≈ 34 V, respectively based on a proportional calculation of the number of IEM pair. Assuming that the SGE conversion efficiency is equal for the lab and the pilot-scale RED stack and using the PDmax ratio to CIMS/ACS-8T, power outputs of 174 × 1.7 ≈ 300 W and 263 × 2.0 ≈ 530 W can be expected in the pilot-scale RED stack with the FKS-20/FAS-20 using model SW and model RO brine at the flow rate of 21 L min−1 of HS and 32 L min−1 of LS. When using natural SW, the pilot-scale RED stack with C-2/A-2 can produce 111 × 2.3 ≈ 260 W. Net power outputs calculated by subtracting the pumping energy were 256 W using model SW, 489 W using model RO brine, and 229 W using natural SW. It is possible that residence time of the solution in the pilot-scale RED stack will increase, and the osmotic water flow will become high, resulting in a slightly lower power output than the prediction. However, it may be possible to achieve the output predicted in this study by trying other methods of increasing RED output, such as using profiled membranes [41,42,43,44,45].

4. Conclusions

In this study, we clarified IEM properties that are effective for RED power generation. In addition, we predicted that the pilot-scale RED stack can produce large outputs by using appropriate IMEs. The key findings are described below.
IEMs with low-area-resistance, such as FKS-20/FAS-20 and C-2/A-2, produced high power outputs in all feed solutions due to the high current.
The monovalent selective membranes (CIMS/ACS-8T) did not contribute to an increase in the power output, though they may be effective in preventing IEM fouling.
For RED power generation, IEMs that can generate a high current flow even if VOC slightly decreases due to osmotic water flow will be effective. Of course, IEMs with low-area-resistance and low osmotic water flow would be able to produce higher power output.
Using appropriate IEMs in the pilot-scale RED stack, we predicted 1.7~2.3 times the power output of the previous study. Although these values are only conjectures, they can be indicators of the power output of large RED stacks.

Supplementary Materials

The following supporting information can be downloaded at: https://www.mdpi.com/article/10.3390/membranes12111141/s1, Figure S1: Flow diagram of the performance evaluation of the RED stack; Table S1: Sodium chloride activity coefficient at the molar concentrations; Figure S2: V-I and P-I curves using model SW (50 mS cm−1 NaCl) as HS and model RW as LS; Figure S3: ϕm measured in 50 mS cm−1 and 1.50 mS cm−1 NaCl solutions combination; Figure S4: κLS dependence of Rint,cal using model SW (50 mS cm−1 NaCl) as HS and model RW as LS; Figure S5: V-I and P-I curves using model RO brine (90 mS cm−1 NaCl) as HS and model RW as LS; Figure S6: ϕm measured in 90 mS cm−1 and 1.50 mS cm−1 NaCl solutions combination; Figure S7: κLS dependence of Rint,cal using model RO brine (90 mS cm−1 NaCl) as HS and model RW as LS; Figure S8: V-I and P-I curves using natural SW as HS and surface water as LS; Figure S9: κLS dependence of Rint,cal using natural SW as HS and surface water as LS; Figure S10: Set up of electrode resistance measurement; Figure S11: V-I curves of the stack without IEMs before and after a series of power generation test using model SW and model RW; Figure S12: V-I curves of the stack without IEMs before and after a series of power generation test using model RO brine and model RW; Figure S13: V-I curves of the stack without IEMs before and after a series of power generation test using natural SW and surface water; Figure S14: Spacer net geometry. References [36,46] are cited in the Supplementary Materials.

Author Contributions

In this study, Y.S. performed an analysis of the data and wrote the manuscript. R.U. performed experiments. M.H. (Minato Higa) performed experiments. Y.K. supervised the manuscript. M.H. (Mitsuru Higa) supervised the project, led the group, and revised the manuscript. All authors have read and agreed to the published version of the manuscript.

Funding

This study was supported by JSPS KAKENHI (Grant Numbers JP16H01796 and JP21H04942).

Institutional Review Board Statement

Not applicable.

Informed Consent Statement

Not applicable.

Data Availability Statement

The data that support the findings of this study are available from the corresponding author, M.H., upon reasonable request.

Conflicts of Interest

The authors declare no conflict of interest.

References

  1. Jia, Z.; Wang, B.; Song, S.; Fan, Y. Blue Energy: Current Technologies for Sustainable Power Generation from Water Salinity Gradient. Renew. Sustain. Energy Rev. 2014, 31, 91–100. [Google Scholar] [CrossRef]
  2. Yip, N.Y.; Brogioli, D.; Hamelers, H.V.M.; Nijmeijer, K. Salinity Gradients for Sustainable Energy: Primer, Progress, and Prospects. Environ. Sci. Technol. 2016, 50, 12072–12094. [Google Scholar] [CrossRef] [PubMed]
  3. Nazif, A.; Karkhanechi, H.; Saljoughi, E.; Mousavi, S.M.; Matsuyama, H. Recent Progress in Membrane Development, Affecting Parameters, and Applications of Reverse Electrodialysis: A Review. J. Water Process Eng. 2022, 47, 102706. [Google Scholar] [CrossRef]
  4. Veerman, J.; Saakes, M.; Metz, S.J.; Harmsen, G.J. Electrical Power from Sea and River Water by Reverse Electrodialysis: A First Step from the Laboratory to a Real Power Plant. Environ. Sci. Technol. 2010, 44, 9207–9212. [Google Scholar] [CrossRef]
  5. Vermaas, D.A.; Saakes, M.; Nijmeijer, K. Doubled Power Density from Salinity Gradients at Reduced Intermembrane Distance. Environ. Sci. Technol. 2011, 45, 7089–7095. [Google Scholar] [CrossRef]
  6. Güler, E.; Elizen, R.; Vermaas, D.A.; Saakes, M.; Nijmeijer, K. Performance-Determining Membrane Properties in Reverse Electrodialysis. J. Membr. Sci. 2013, 446, 266–276. [Google Scholar] [CrossRef]
  7. Vermaas, D.A.; Kunteng, D.; Veerman, J.; Saakes, M.; Nijmeijer, K. Periodic Feedwater Reversal and Air Sparging as Antifouling Strategies in Reverse Electrodialysis. Environ. Sci. Technol. 2014, 48, 3065–3073. [Google Scholar] [CrossRef] [PubMed]
  8. Hong, J.G.; Chen, Y. Nanocomposite Reverse Electrodialysis (RED) Ion-Exchange Membranes for Salinity Gradient Power Generation. J. Membr. Sci. 2014, 460, 139–147. [Google Scholar] [CrossRef]
  9. Daniilidis, A.; Vermaas, D.A.; Herber, R.; Nijmeijer, K. Experimentally Obtainable Energy from Mixing River Water, Seawater or Brines with Reverse Electrodialysis. Renew. Energy 2014, 64, 123–131. [Google Scholar] [CrossRef]
  10. Tedesco, M.; Brauns, E.; Cipollina, A.; Micale, G.; Modica, P.; Russo, G.; Helsen, J. Reverse Electrodialysis with Saline Waters and Concentrated Brines: A Laboratory Investigation towards Technology Scale-Up. J. Membr. Sci. 2015, 492, 9–20. [Google Scholar] [CrossRef]
  11. Avci, A.H.; Sarkar, P.; Tufa, R.A.; Messana, D.; Argurio, P.; Fontananova, E.; Di Profio, G.; Curcio, E. Effect of Mg2+ Ions on Energy Generation by Reverse Electrodialysis. J. Membr. Sci. 2016, 520, 499–506. [Google Scholar] [CrossRef]
  12. Moreno, J.; de Hart, N.; Saakes, M.; Nijmeijer, K. CO2 Saturated Water as Two-Phase Flow for Fouling Control in Reverse Electrodialysis. Water Res. 2017, 125, 23–31. [Google Scholar] [CrossRef] [PubMed]
  13. Zhang, H.; Jiang, D.; Zhang, B.; Hong, J.G.; Chen, Y. A Novel Hybrid Poly (Vinyl Alcohol) (PVA)/Poly (2,6-Dimethyl-1,4-Phenylene Oxide) (PPO) Membranes for Reverse Electrodialysis Power System. Electrochim. Acta 2017, 239, 65–73. [Google Scholar] [CrossRef] [Green Version]
  14. Hee, C.D.; Hyuck, L.K.; Mi, K.Y.; Hyun, P.S.; Hyo, L.W.; Min, L.S.; Moo, L.Y. Effect of Cationic Groups in Poly(Arylene Ether Sulfone) Membranes on Reverse Electrodialysis Performance. Chem. Commun. 2017, 53, 2323–2326. [Google Scholar] [CrossRef]
  15. Fontananova, E.; Messana, D.; Tufa, R.A.; Nicotera, I.; Kosma, V.; Curcio, E.; van Baak, W.; Drioli, E.; Di Profio, G. Effect of Solution Concentration and Composition on the Electrochemical Properties of Ion Exchange Membranes for Energy Conversion. J. Power Source 2017, 340, 282–293. [Google Scholar] [CrossRef]
  16. Farrell, E.; Hassan, M.I.; Tufa, R.A.; Tuomiranta, A.; Avci, A.H.; Politano, A.; Curcio, E.; Arafat, H.A. Reverse Electrodialysis Powered Greenhouse Concept for Water- and Energy-Self-Sufficient Agriculture. Appl. Energy 2017, 187, 390–409. [Google Scholar] [CrossRef]
  17. Kingsbury, R.S.; Liu, F.; Zhu, S.; Boggs, C.; Armstrong, M.D.; Call, D.F.; Coronell, O. Impact of Natural Organic Matter and Inorganic Solutes on Energy Recovery from Five Real Salinity Gradients Using Reverse Electrodialysis. J. Membr. Sci. 2017, 541, 621–632. [Google Scholar] [CrossRef]
  18. Moreno, J.; Díez, V.; Saakes, M.; Nijmeijer, K. Mitigation of the Effects of Multivalent Ion Transport in Reverse Electrodialysis. J. Membr. Sci. 2018, 550, 155–162. [Google Scholar] [CrossRef]
  19. Avci, A.H.; Tufa, R.A.; Fontananova, E.; Profio, G.D.; Curcio, E. Reverse Electrodialysis for Energy Production from Natural River Water and Seawater. Energy 2018, 165, 512–521. [Google Scholar] [CrossRef]
  20. Guo, Z.-Y.; Ji, Z.-Y.; Zhang, Y.-G.; Yang, F.-J.; Liu, J.; Zhao, Y.-Y.; Yuan, J.-S. Effect of Ions (K+, Mg2+, Ca2+ and SO42−) and Temperature on Energy Generation Performance of Reverse Electrodialysis Stack. Electrochim. Acta 2018, 290, 282–290. [Google Scholar] [CrossRef]
  21. Rijnaarts, T.; Moreno, J.; Saakes, M.; de Vos, W.M.; Nijmeijer, K. Role of Anion Exchange Membrane Fouling in Reverse Electrodialysis Using Natural Feed Waters. Colloids Surf. Physicochem. Eng. Asp. 2019, 560, 198–204. [Google Scholar] [CrossRef]
  22. Avci, A.H.; Rijnaarts, T.; Fontananova, E.; Di Profio, G.; Vankelecom, I.F.V.; De Vos, W.M.; Curcio, E. Sulfonated Polyethersulfone Based Cation Exchange Membranes for Reverse Electrodialysis under High Salinity Gradients. J. Membr. Sci. 2020, 595, 117585. [Google Scholar] [CrossRef]
  23. Tedesco, M.; Scalici, C.; Vaccari, D.; Cipollina, A.; Tamburini, A.; Micale, G. Performance of the First Reverse Electrodialysis Pilot Plant for Power Production from Saline Waters and Concentrated Brines. J. Membr. Sci. 2016, 500, 33–45. [Google Scholar] [CrossRef] [Green Version]
  24. Tedesco, M.; Cipollina, A.; Tamburini, A.; Micale, G. Towards 1kW Power Production in a Reverse Electrodialysis Pilot Plant with Saline Waters and Concentrated Brines. J. Membr. Sci. 2017, 522, 226–236. [Google Scholar] [CrossRef] [Green Version]
  25. Nam, J.-Y.; Hwang, K.-S.; Kim, H.-C.; Jeong, H.; Kim, H.; Jwa, E.; Yang, S.; Choi, J.; Kim, C.-S.; Han, J.-H.; et al. Assessing the Behavior of the Feed-Water Constituents of a Pilot-Scale 1000-Cell-Pair Reverse Electrodialysis with Seawater and Municipal Wastewater Effluent. Water Res. 2019, 148, 261–271. [Google Scholar] [CrossRef] [PubMed]
  26. Mehdizadeh, S.; Yasukawa, M.; Abo, T.; Kuno, M.; Noguchi, Y.; Higa, M. The Effect of Feed Solution Temperature on the Power Output Performance of a Pilot-Scale Reverse Electrodialysis (RED) System with Different Intermediate Distance. Membranes 2019, 9, 73. [Google Scholar] [CrossRef] [PubMed] [Green Version]
  27. Mehdizadeh, S.; Kakihana, Y.; Abo, T.; Yuan, Q.; Higa, M. Power Generation Performance of a Pilot-Scale Reverse Electrodialysis Using Monovalent Selective Ion-Exchange Membranes. Membranes 2021, 11, 27. [Google Scholar] [CrossRef]
  28. Kakihana, Y.; Hashim, N.A.; Mizuno, T.; Anno, M.; Higa, M. Ionic Transport Properties of Cation-Exchange Membranes Prepared from Poly(Vinyl Alcohol-b-Sodium Styrene Sulfonate). Membranes 2021, 11, 452. [Google Scholar] [CrossRef]
  29. Mehdizadeh, S.; Yasukawa, M.; Kuno, M.; Kawabata, Y.; Higa, M. Evaluation of Energy Harvesting from Discharged Solutions in a Salt Production Plant by Reverse Electrodialysis (RED). Desalination 2019, 467, 95–102. [Google Scholar] [CrossRef]
  30. Yasukawa, M.; Mehdizadeh, S.; Sakurada, T.; Abo, T.; Kuno, M.; Higa, M. Power Generation Performance of a Bench-Scale Reverse Electrodialysis Stack Using Wastewater Discharged from Sewage Treatment and Seawater Reverse Osmosis. Desalination 2020, 491, 114449. [Google Scholar] [CrossRef]
  31. Vermaas, D.A.; Guler, E.; Saakes, M.; Nijmeijer, K. Theoretical Power Density from Salinity Gradients Using Reverse Electrodialysis. Energy Procedia 2012, 20, 170–184. [Google Scholar] [CrossRef] [Green Version]
  32. Długołęcki, P.; Nymeijer, K.; Metz, S.; Wessling, M. Current Status of Ion Exchange Membranes for Power Generation from Salinity Gradients. J. Membr. Sci. 2008, 319, 214–222. [Google Scholar] [CrossRef]
  33. Kuno, M.; Yasukawa, M.; Kakihana, Y.; Higa, M. The Effect of Divalent Ions on Reverse Electrodialysis Power Generation System. Bull. Soc. Sea Water Sci. Jpn. 2017, 71, 350–351. [Google Scholar] [CrossRef]
  34. Kingsbury, R.S.; Flotron, S.; Zhu, S.; Call, D.F.; Coronell, O. Junction Potentials Bias Measurements of Ion Exchange Membrane Permselectivity. Environ. Sci. Technol. 2018, 52, 4929–4936. [Google Scholar] [CrossRef] [PubMed]
  35. Veerman, J.; Saakes, M.; Metz, S.J.; Harmsen, G.J. Reverse Electrodialysis: Performance of a Stack with 50 Cells on the Mixing of Sea and River Water. J. Membr. Sci. 2009, 327, 136–144. [Google Scholar] [CrossRef] [Green Version]
  36. Mehdizadeh, S.; Yasukawa, M.; Abo, T.; Kakihana, Y.; Higa, M. Effect of Spacer Geometry on Membrane and Solution Compartment Resistances in Reverse Electrodialysis. J. Membr. Sci. 2019, 572, 271–280. [Google Scholar] [CrossRef]
  37. Veerman, J.; de Jong, R.M.; Saakes, M.; Metz, S.J.; Harmsen, G.J. Reverse Electrodialysis: Comparison of Six Commercial Membrane Pairs on the Thermodynamic Efficiency and Power Density. J. Membr. Sci. 2009, 343, 7–15. [Google Scholar] [CrossRef]
  38. Tufa, R.A.; Curcio, E.; van Baak, W.; Veerman, J.; Grasman, S.; Fontananova, E.; Di Profio, G. Potential of Brackish Water and Brine for Energy Generation by Salinity Gradient Power-Reverse Electrodialysis (SGP-RE). RSC Adv. 2014, 4, 42617–42623. [Google Scholar] [CrossRef] [Green Version]
  39. Vermaas, D.A.; Veerman, J.; Saakes, M.; Nijmeijer, K. Influence of Multivalent Ions on Renewable Energy Generation in Reverse Electrodialysis. Energy Environ. Sci. 2014, 7, 1434–1445. [Google Scholar] [CrossRef] [Green Version]
  40. Rijnaarts, T.; Huerta, E.; Baak, W.V.; Nijmeijer, K. Effect of Divalent Cations on RED Performance and Cation Exchange Membrane Selection to Enhance Power Densities. Environ. Sci. Technol. 2017, 51, 13028–13035. [Google Scholar] [CrossRef]
  41. Pawlowski, S.; Crespo, J.G.; Velizarov, S. Profiled Ion Exchange Membranes: A Comprehensible Review. Int. J. Mol. Sci. 2019, 20, 165. [Google Scholar] [CrossRef] [PubMed] [Green Version]
  42. Vermaas, D.A.; Saakes, M.; Nijmeijer, K. Power Generation Using Profiled Membranes in Reverse Electrodialysis. J. Membr. Sci. 2011, 385–386, 234–242. [Google Scholar] [CrossRef]
  43. Güler, E.; Elizen, R.; Saakes, M.; Nijmeijer, K. Micro-Structured Membranes for Electricity Generation by Reverse Electrodialysis. J. Membr. Sci. 2014, 458, 136–148. [Google Scholar] [CrossRef]
  44. Seo, J.; Kushner, D.I.; Hickner, M.A. 3D Printing of Micropatterned Anion Exchange Membranes. ACS Appl. Mater. Interfaces 2016, 8, 16656–16663. [Google Scholar] [CrossRef]
  45. Pawlowski, S.; Geraldes, V.; Crespo, J.G.; Velizarov, S. Computational Fluid Dynamics (CFD) Assisted Analysis of Profiled Membranes Performance in Reverse Electrodialysis. J. Membr. Sci. 2016, 502, 179–190. [Google Scholar] [CrossRef] [Green Version]
  46. Hamer, W.J.; Wu, Y.-C. Osmotic Coefficients and Mean Activity Coefficients of Uni Univalent Electrolytes in Water at 25 °C. J. Phys. Chem. Ref. Data 1972, 1, 1047–1100. [Google Scholar] [CrossRef]
Figure 1. Schematic illustration of the lab-scale RED stack.
Membranes 12 01141 g001
Figure 2. κLS dependence of (A) VOC, (B) Rint, and (C) PDmax using model SW (50 mS cm−1 NaCl) as HS and model RW as LS.
Membranes 12 01141 g002
Figure 3. κLS dependence of (A) VOC, (B) Rint, and (C) PDmax using model RO brine (90 mS cm−1 NaCl) as HS and model RW as LS.
Membranes 12 01141 g003
Figure 4. κLS dependence of (A) VOC, (B) Rint, and (C) PDmax using natural SW as HS and surface water as LS.
Membranes 12 01141 g004
Table 1. Basic properties of IEMs used in this study.
MembraneCharge Density
[M]
Ion Transport Number
[-]
Area Resistance
[Ω cm2]
Thickness
[μm]
CEMCSE1.900.982.03150
CMX1.860.982.70170
CIMS-0.982.49150
C-2-0.940.2134
FKS-201.930.980.4718
AEMASE1.840.982.77150
AMX1.530.982.30140
ACS-8T-0.982.41150
A-2-0.990.2834
FAS-202.140.970.4623
Table 2. Ion composition in natural SW and surface water.
SolutionCations [mM]Anions [mM]TDS, ppm *
Na+K+Mg2+Ca2+ClSO42−
Natural SW
(55.2~55.4 mS cm−1)
4712962155032534300
Surface water
(0.43~0.45 mS cm−1)
0.890.190.190.920.970.20123
* TDS (total dissolved sloid) was calculated by the ion composition, and we assumed mg L−1 equals ppm.
Table 3. Summary of the best performance of the lab-scale RED stack in this study (40 membranes pairs, 200 μm inter-membrane distance, and 7040 cm2 total effective membrane area).
Feed SolutionsCEM/AEM PairVOC [V]Rint [Ω]PDmax
[W m−2]
PDmax Ratio to
CIMS/ACS-8T
Model SW and model RW
(κLS = 2.24 mS cm−1)
FKS-20/FAS-205.77.61.31.7
Model RO brine and
model RW
(κLS = 1.50 mS cm−1)
FKS-20/FAS-207.15.42.62.0
Natural SW and
surface water
(κLS = 3.40 mS cm−1)
C-2/A-24.55.11.32.3
Publisher’s Note: MDPI stays neutral with regard to jurisdictional claims in published maps and institutional affiliations.

