3.4.1. Raw Data and Theoretical Models
In
Figure 3, the
H NMR relaxometry profiles obtained for the membranes studied in the present work are obtained. In order to enable a comparison between the profiles of membranes that were subject to a different drying process, the results previously obtained by de Pinho et al. [
16] for membranes dried using the solvent exchange procedure were also added to the figure.
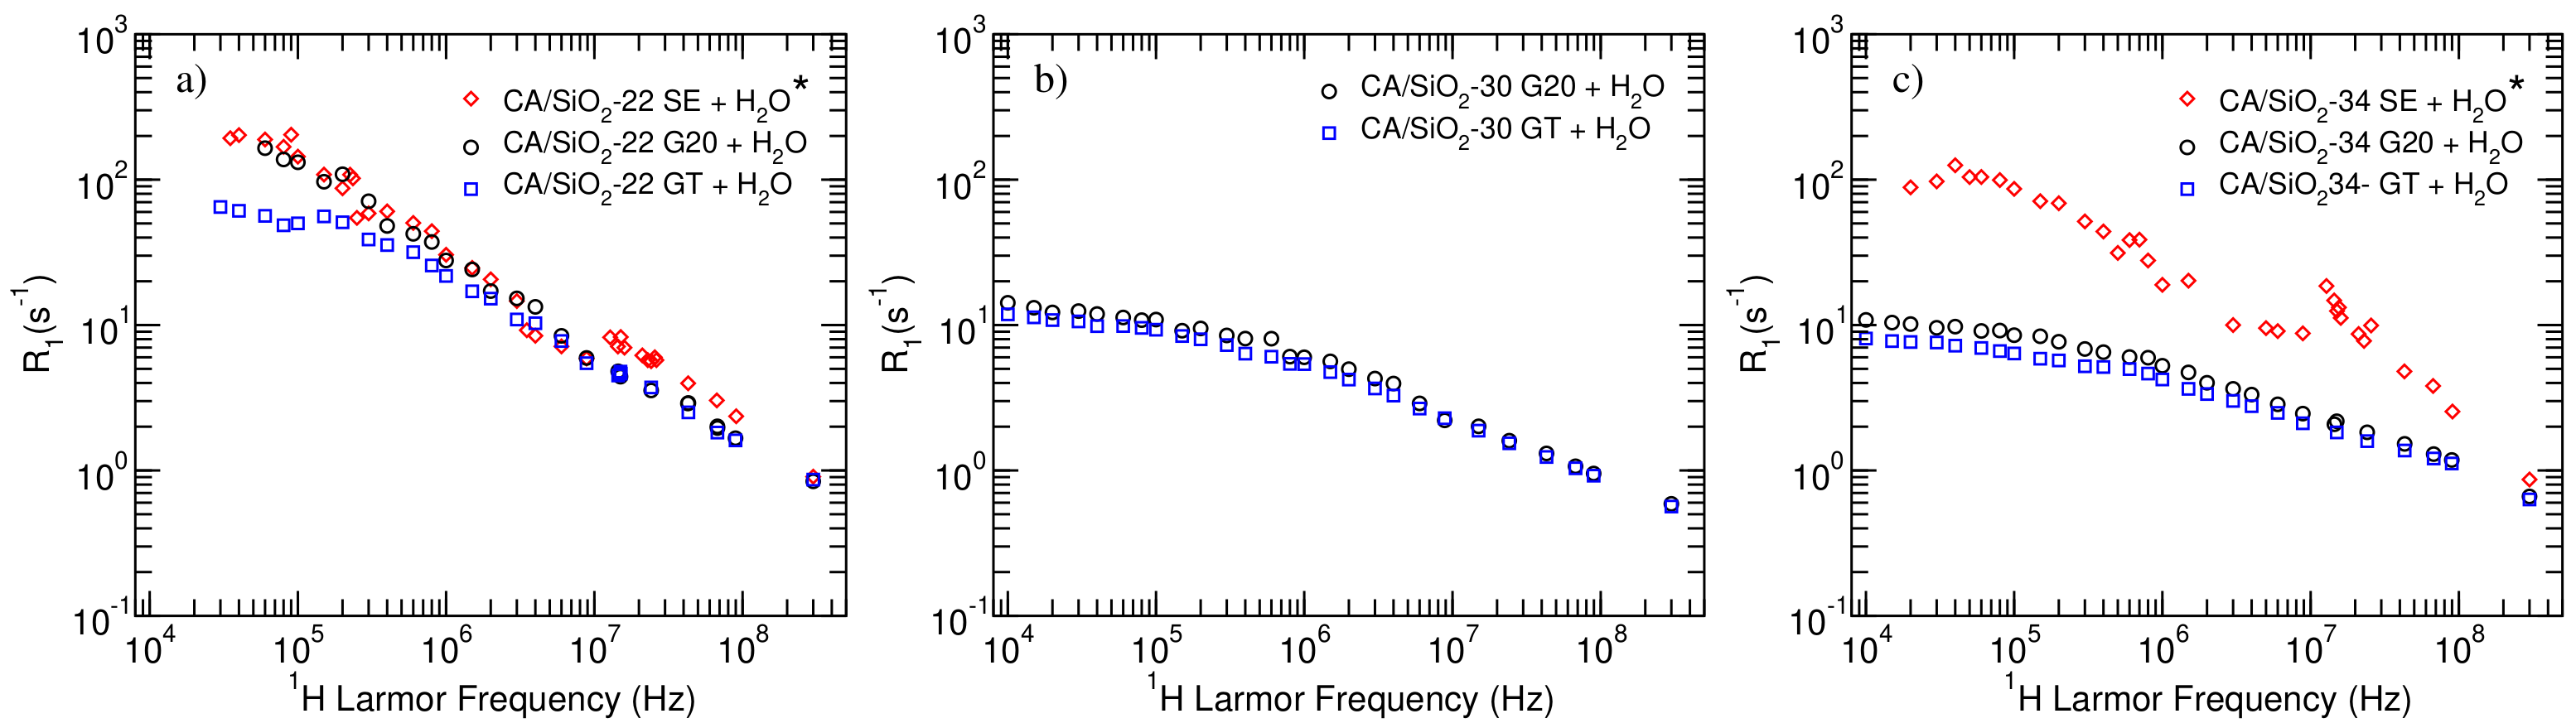
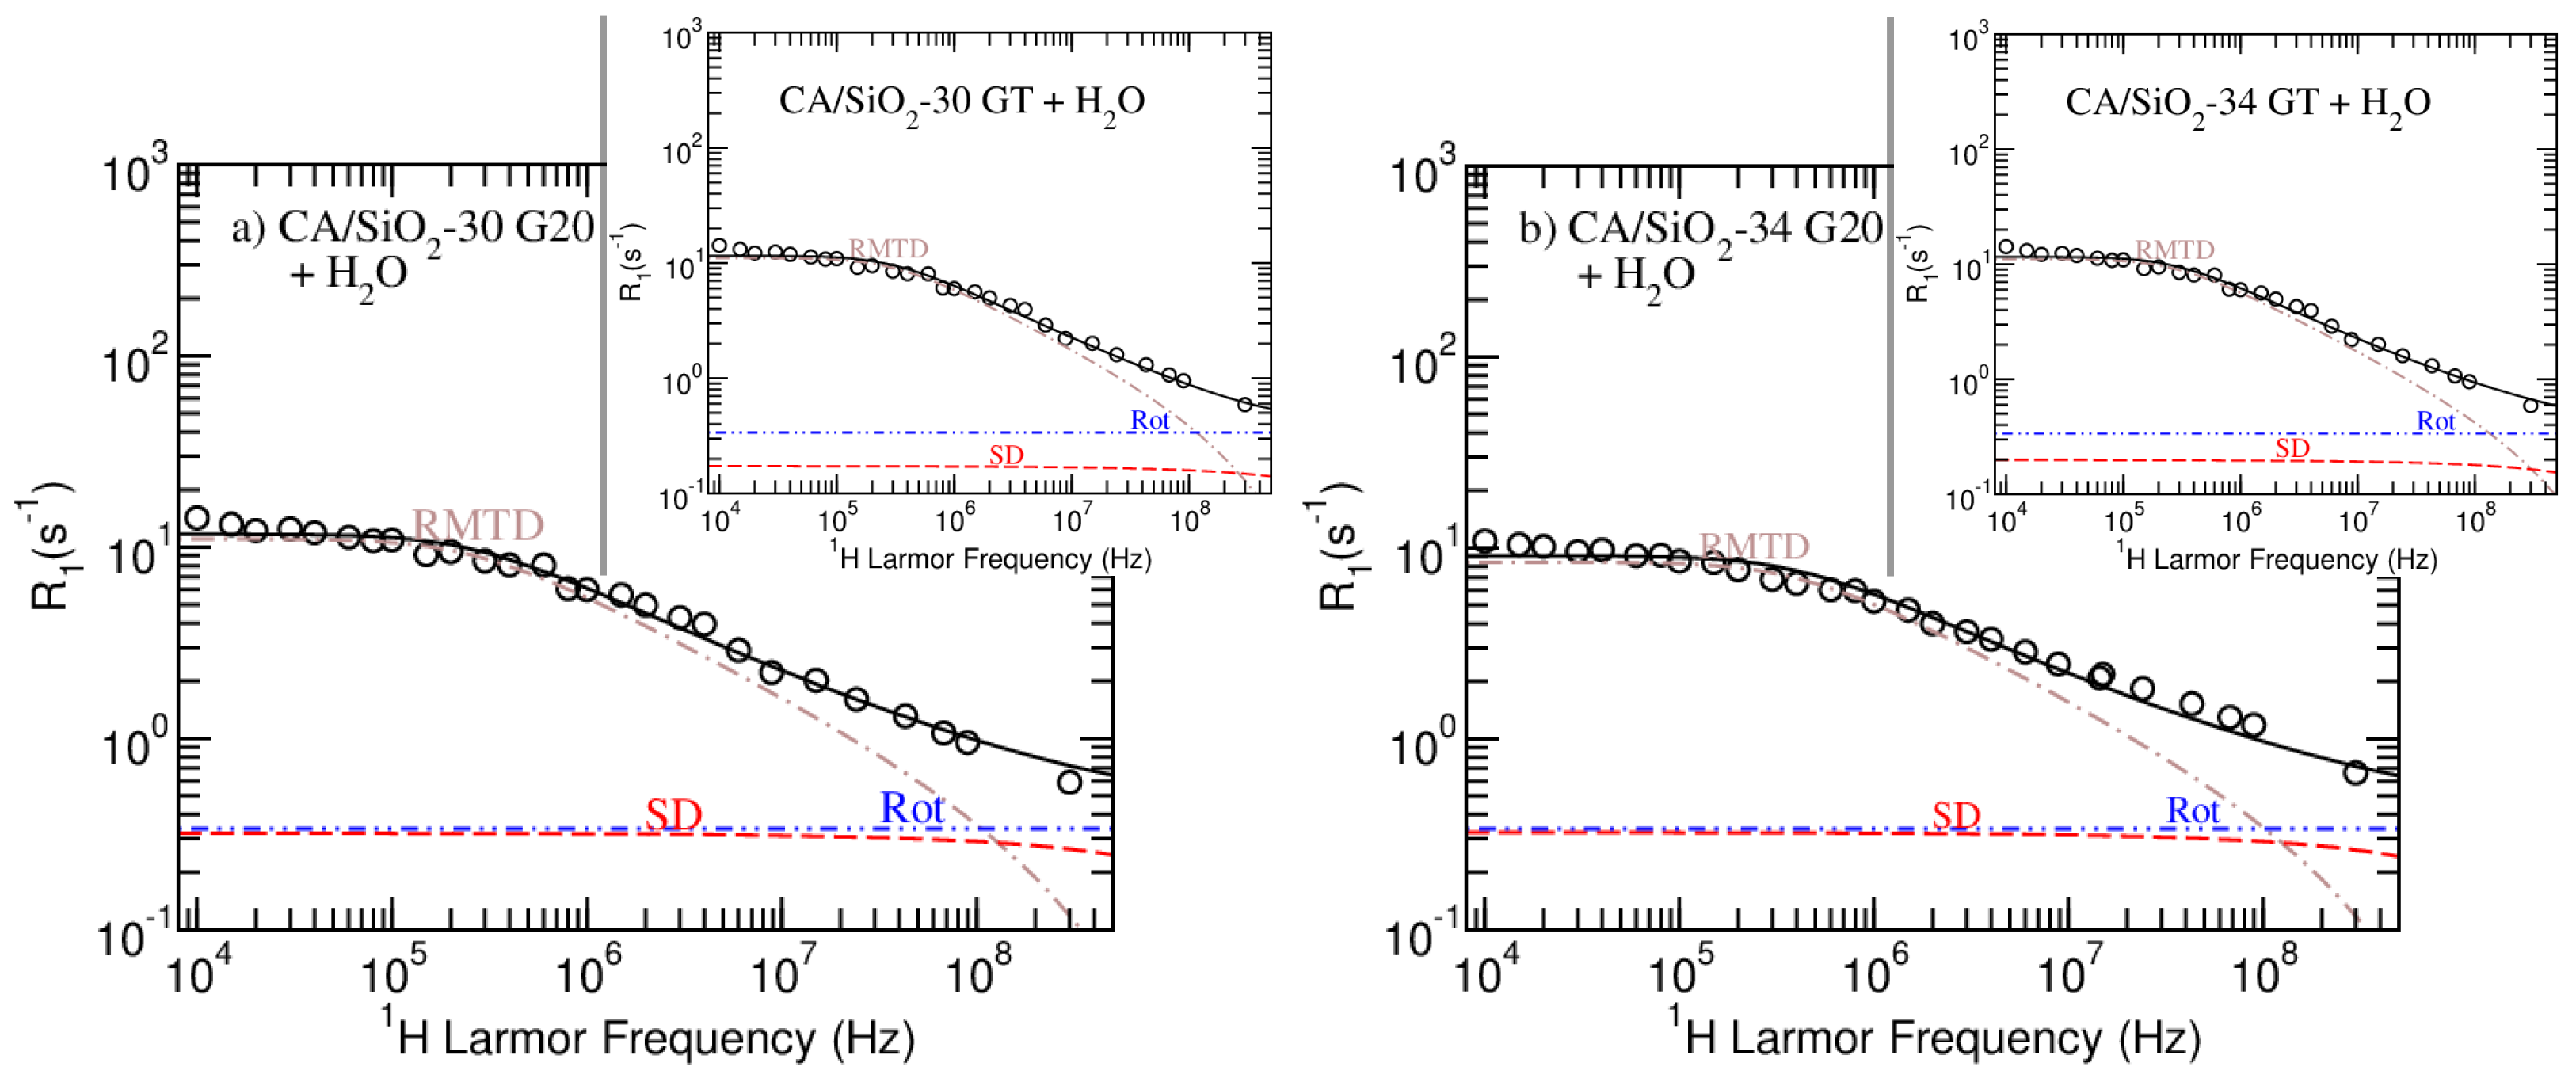
As it can be immediately concluded from the observation of the longitudinal relaxation profiles displayed in
Figure 3, for the systems studied in the present work (black circles—G20—and blue squares—GT), the CA/SiO
-30 and CA/SiO
-34 membranes present rather similar relaxometry profiles, while CA/SiO
-22 membranes presented significantly different results.
It is also possible to see that post-treatment with triton X-100 leads to very small differences for CA/SiO-30 and CA/SiO-34 membranes, while it produces a significant decrease across the lower frequency range in the case of membranes CA/SiO-22.
Furthermore, comparing the results obtained in the present work with those related to the solvent-exchange—(SE) dried membranes (red diamonds)—it is possible to observe a significant difference for the CA/SiO
-34 membranes while the CA/SiO
-22 systems seem almost insensitive to the drying process. This result may be explained by the fact that membranes that are more permeable, such as CA/SiO
-34, are bound to be more impacted by the drying process than systems with smaller pores. In fact, the hydraulic permeabilities found for these systems, reported in previous studies, also show that the permeability of the CA/SiO
-22 membrane is almost unaffected by post-treatment drying processes, while permeabilities obtained for the CA/SiO
-30 and CA/SiO
-34 systems vary over a wider range of values, especially when comparing the SE drying process to the G20 and GT post-treatments [
15].
The curves presented in
Figure 3 representing the longitudinal relaxation rate,
, obtained at different magnetic fields (or
H Larmor frequencies) and called NMR dispersion (NMRD) curves encode information on the molecular dynamics of the systems under analysis. In the present work, it was considered that the water entrapped in the membranes’ pores may relax as a result of rotational and translational diffusions and rotations mediated by translational displacements, which are motivated by the interactions of water molecules with the porous matrix. Furthermore, assuming that these mechanisms are effective at different time scales and, thus, independent of one another, the total relaxation rate may be written as the sum of the individual rates (Equation (
3)):
where
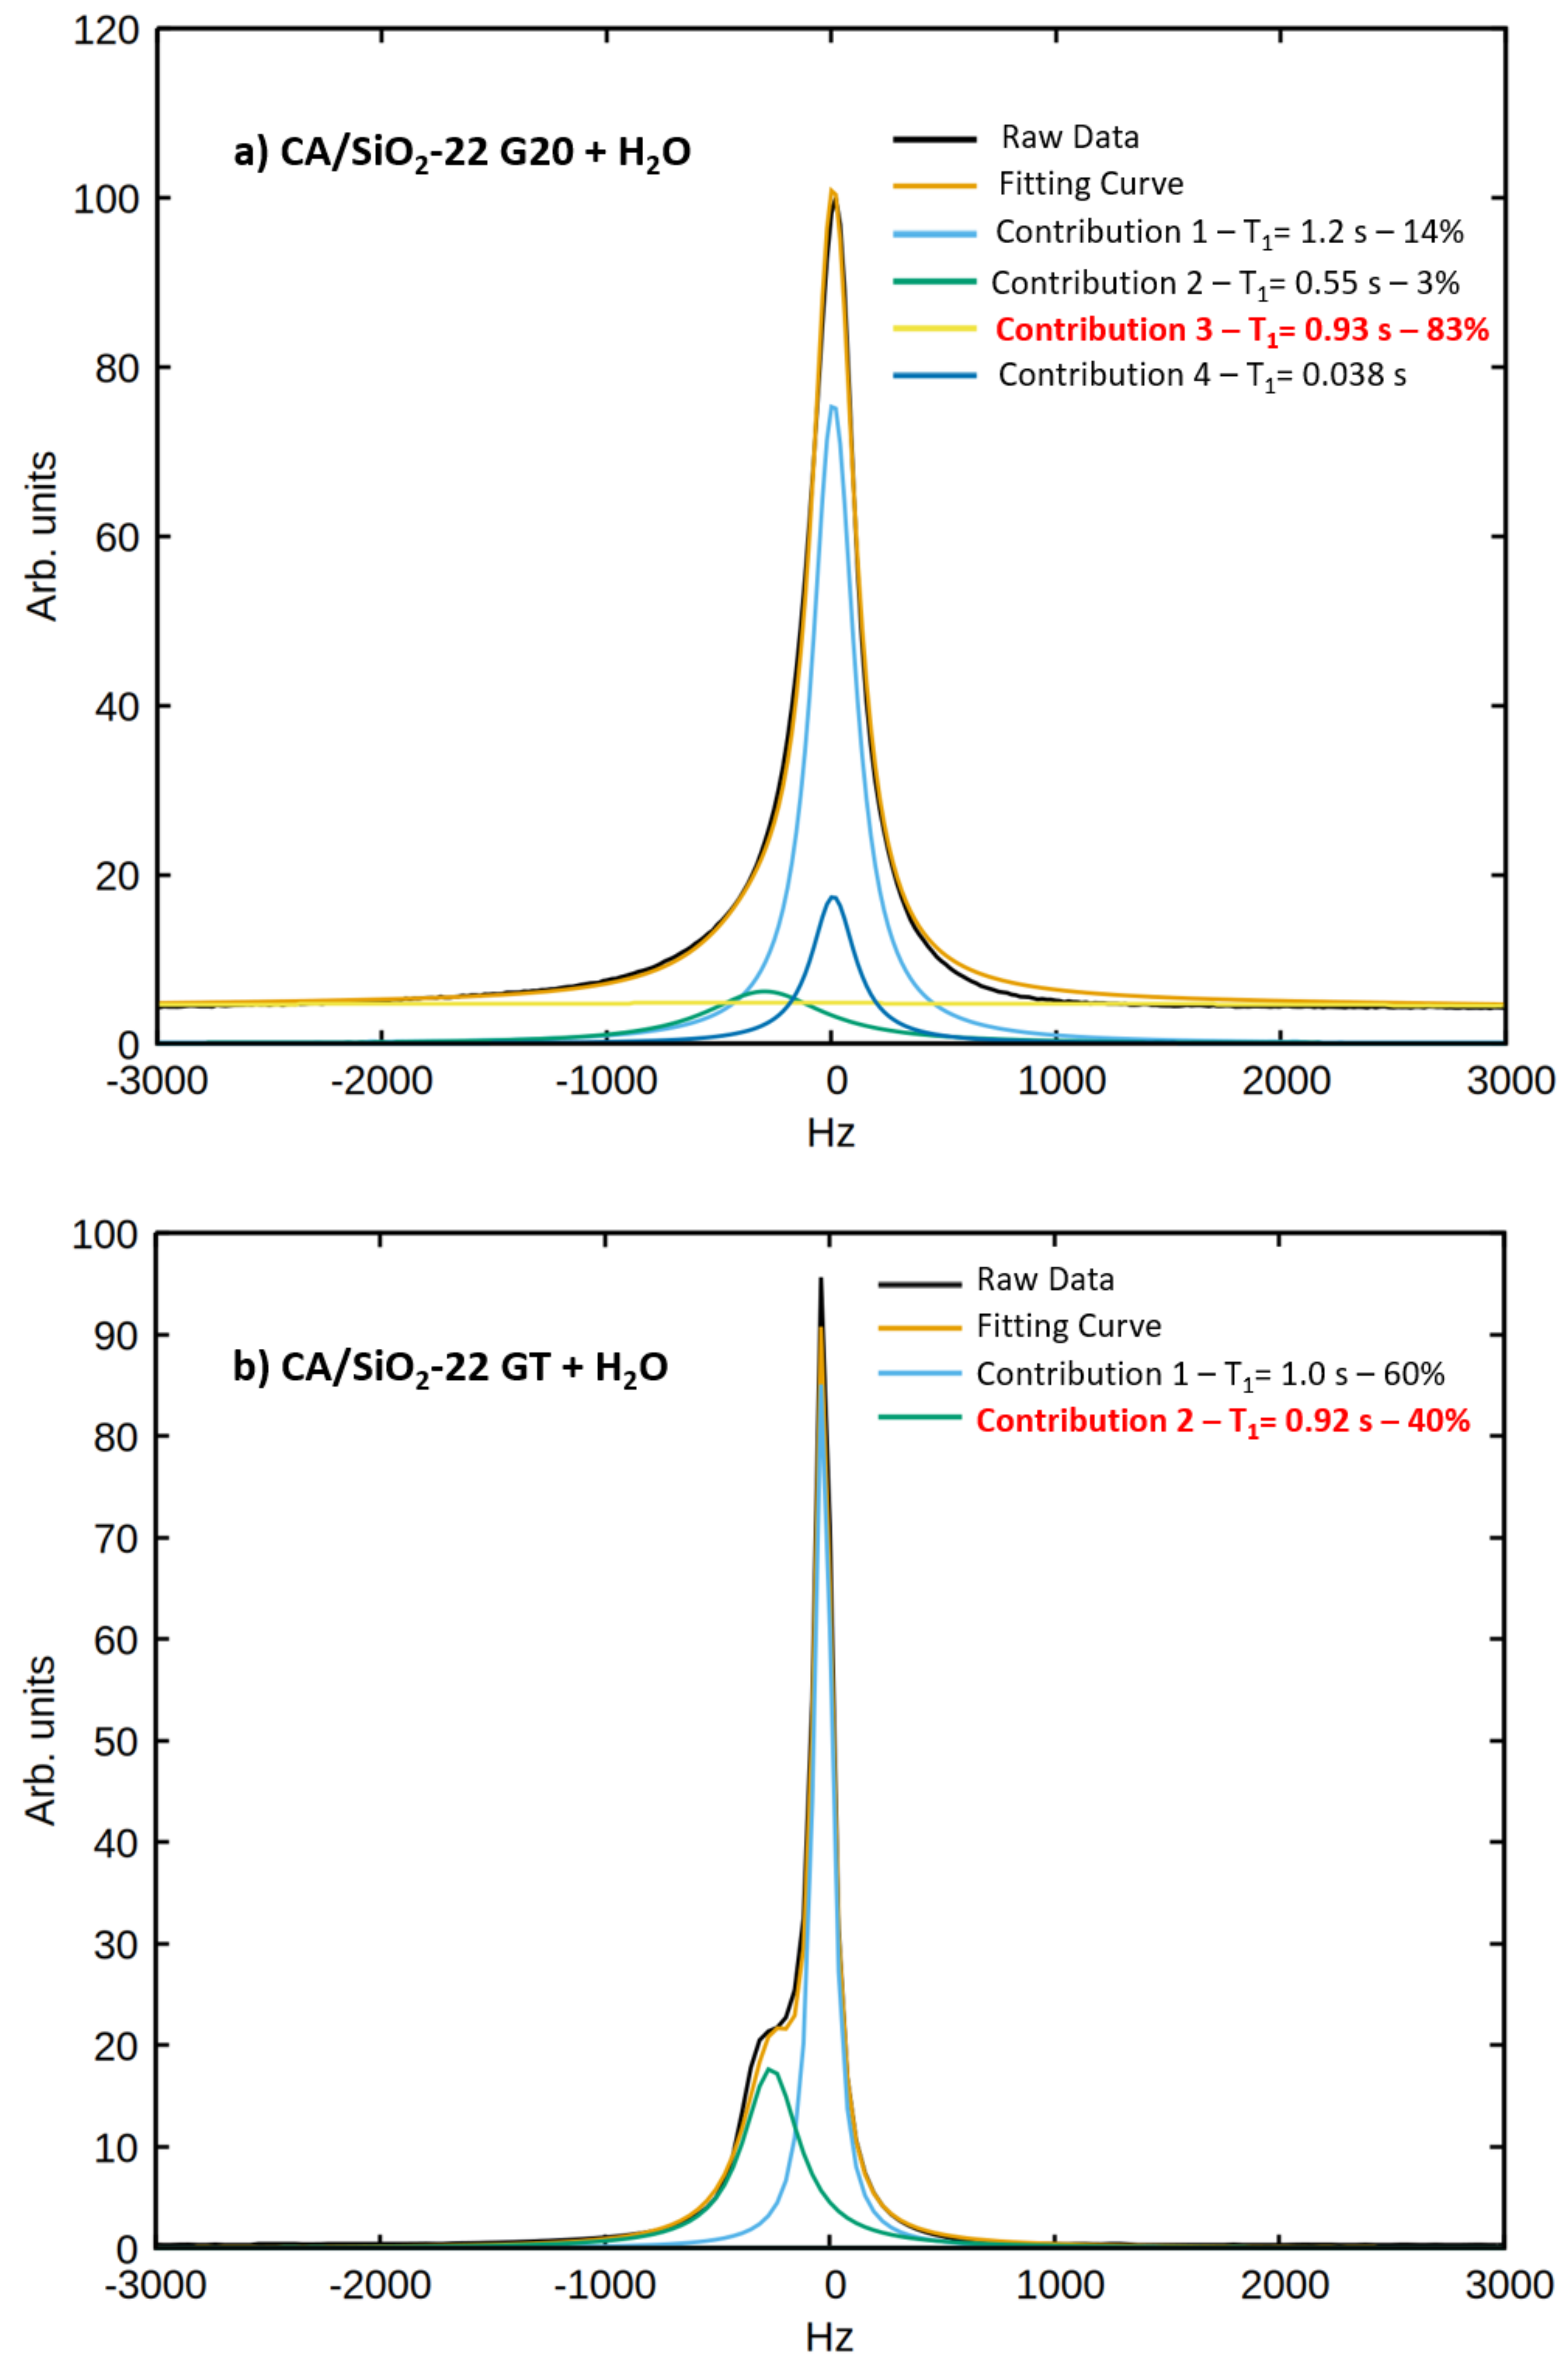
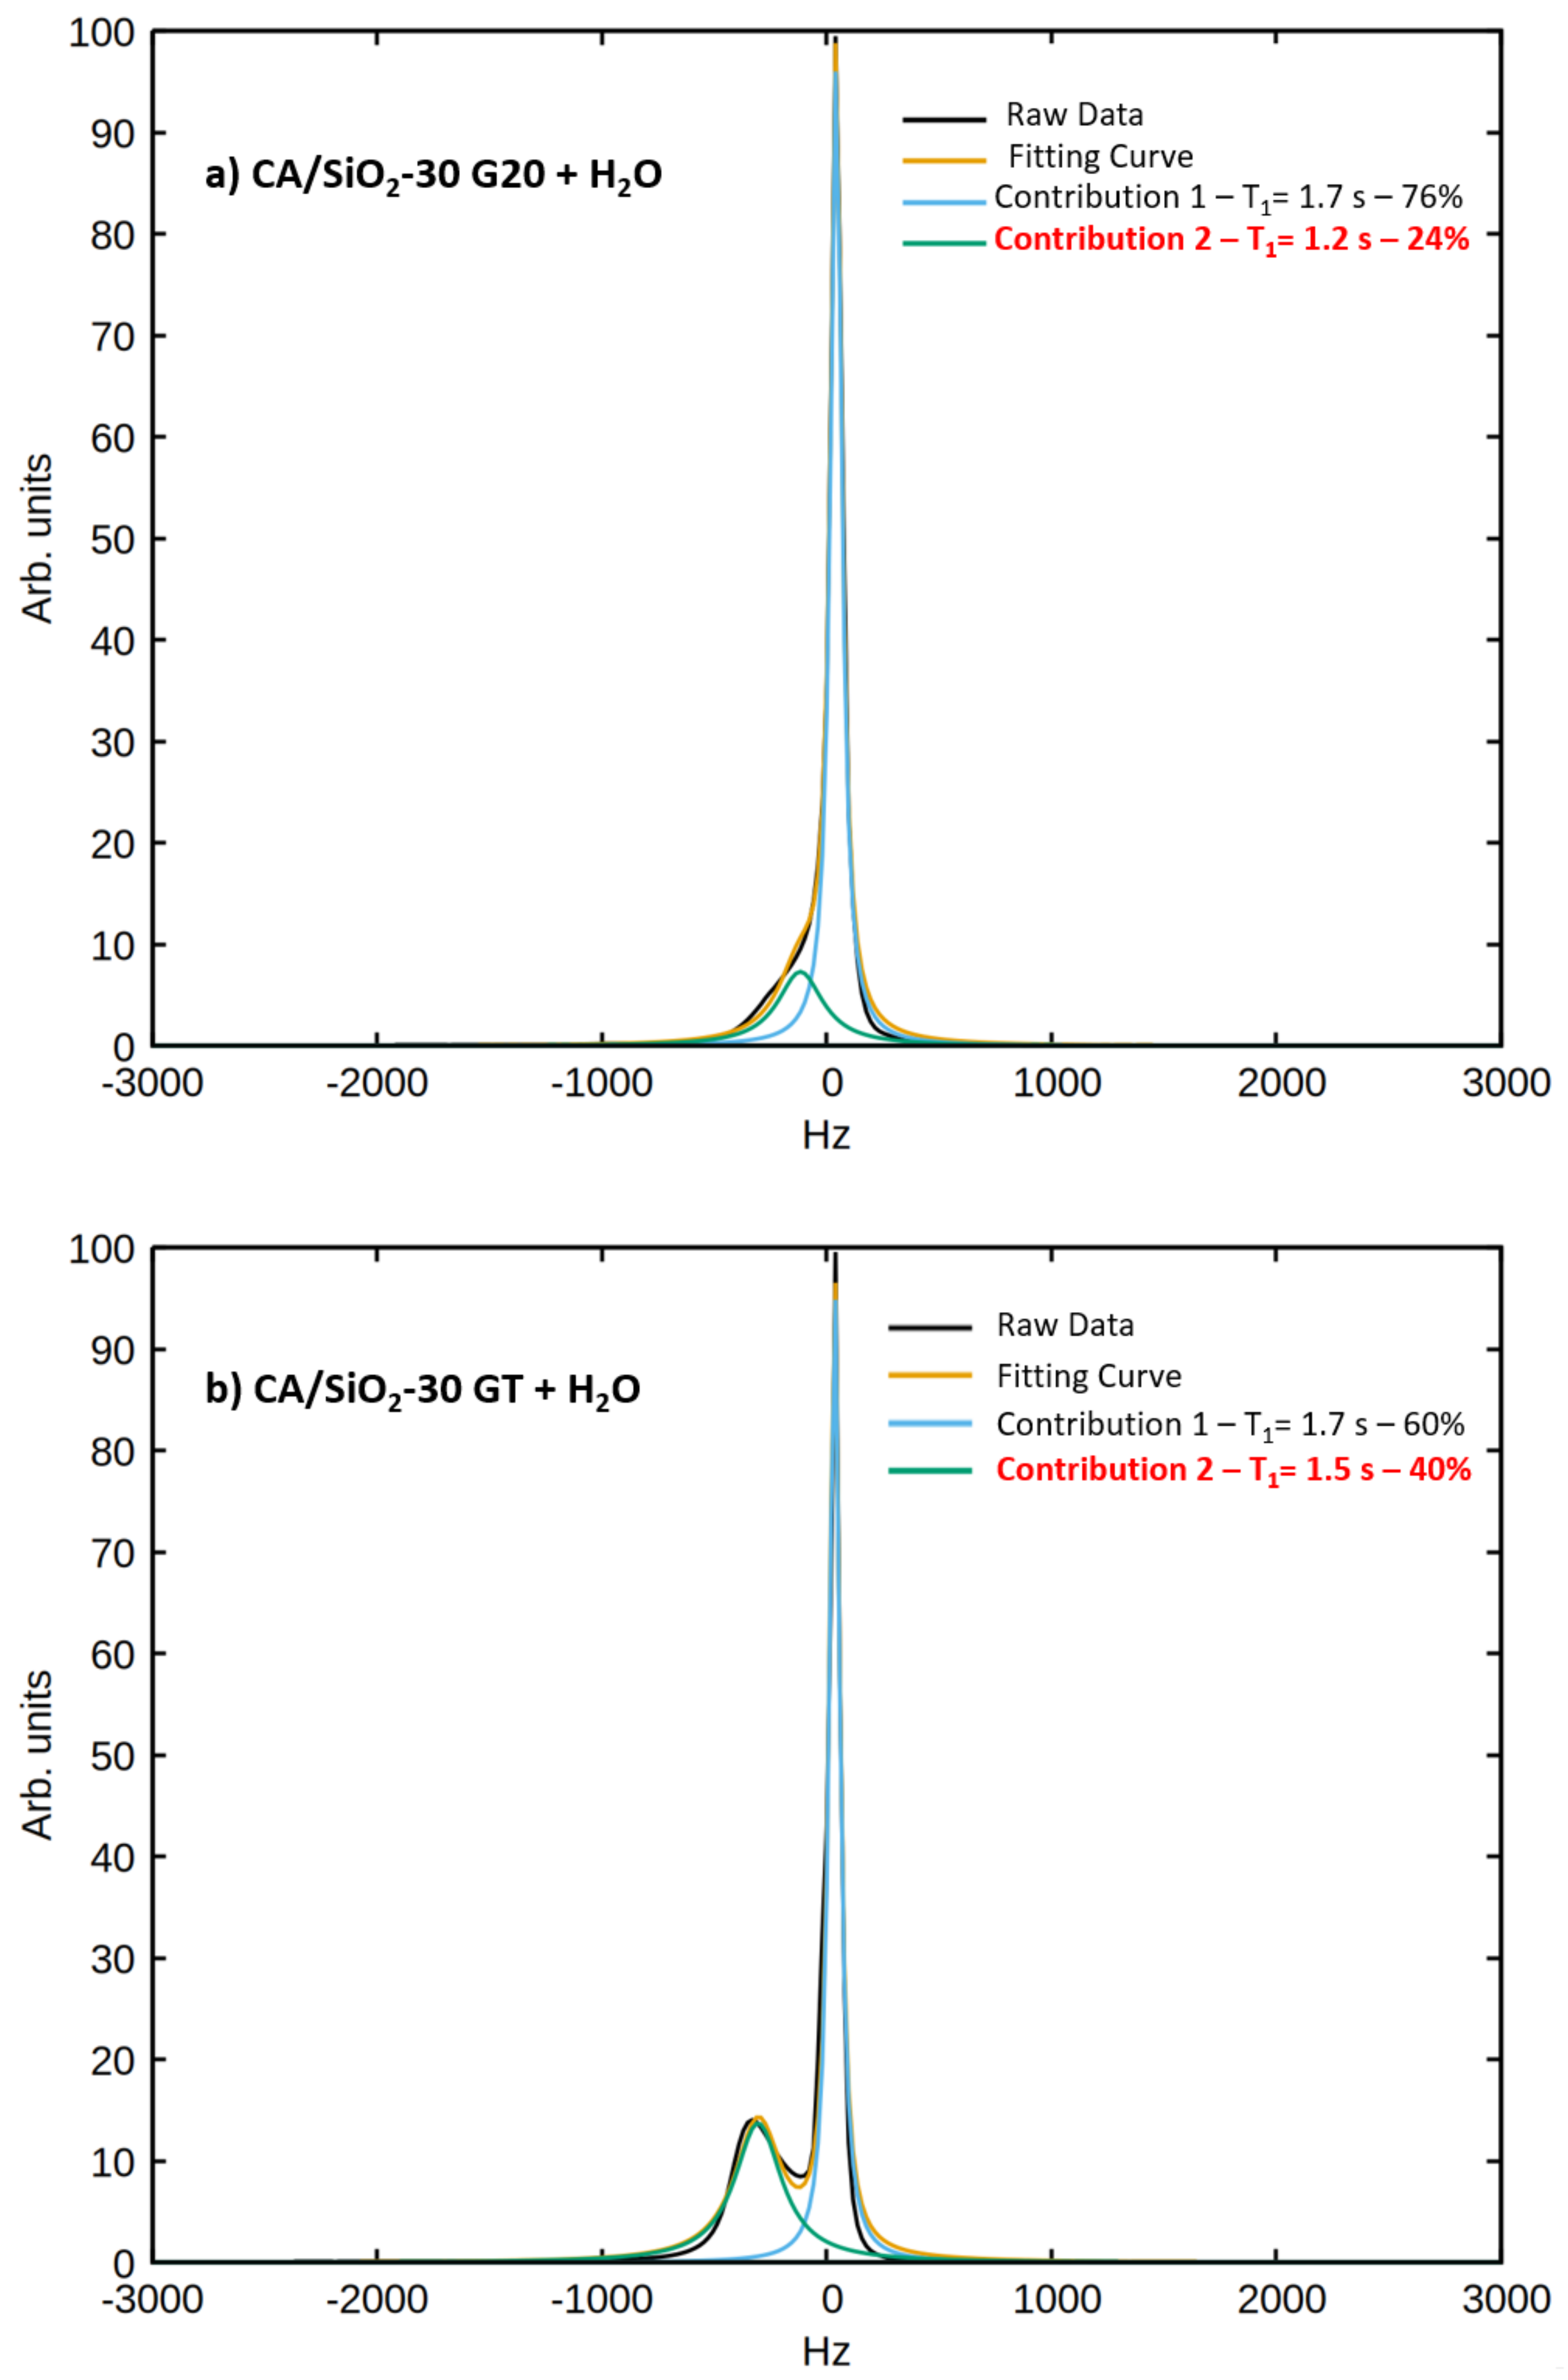
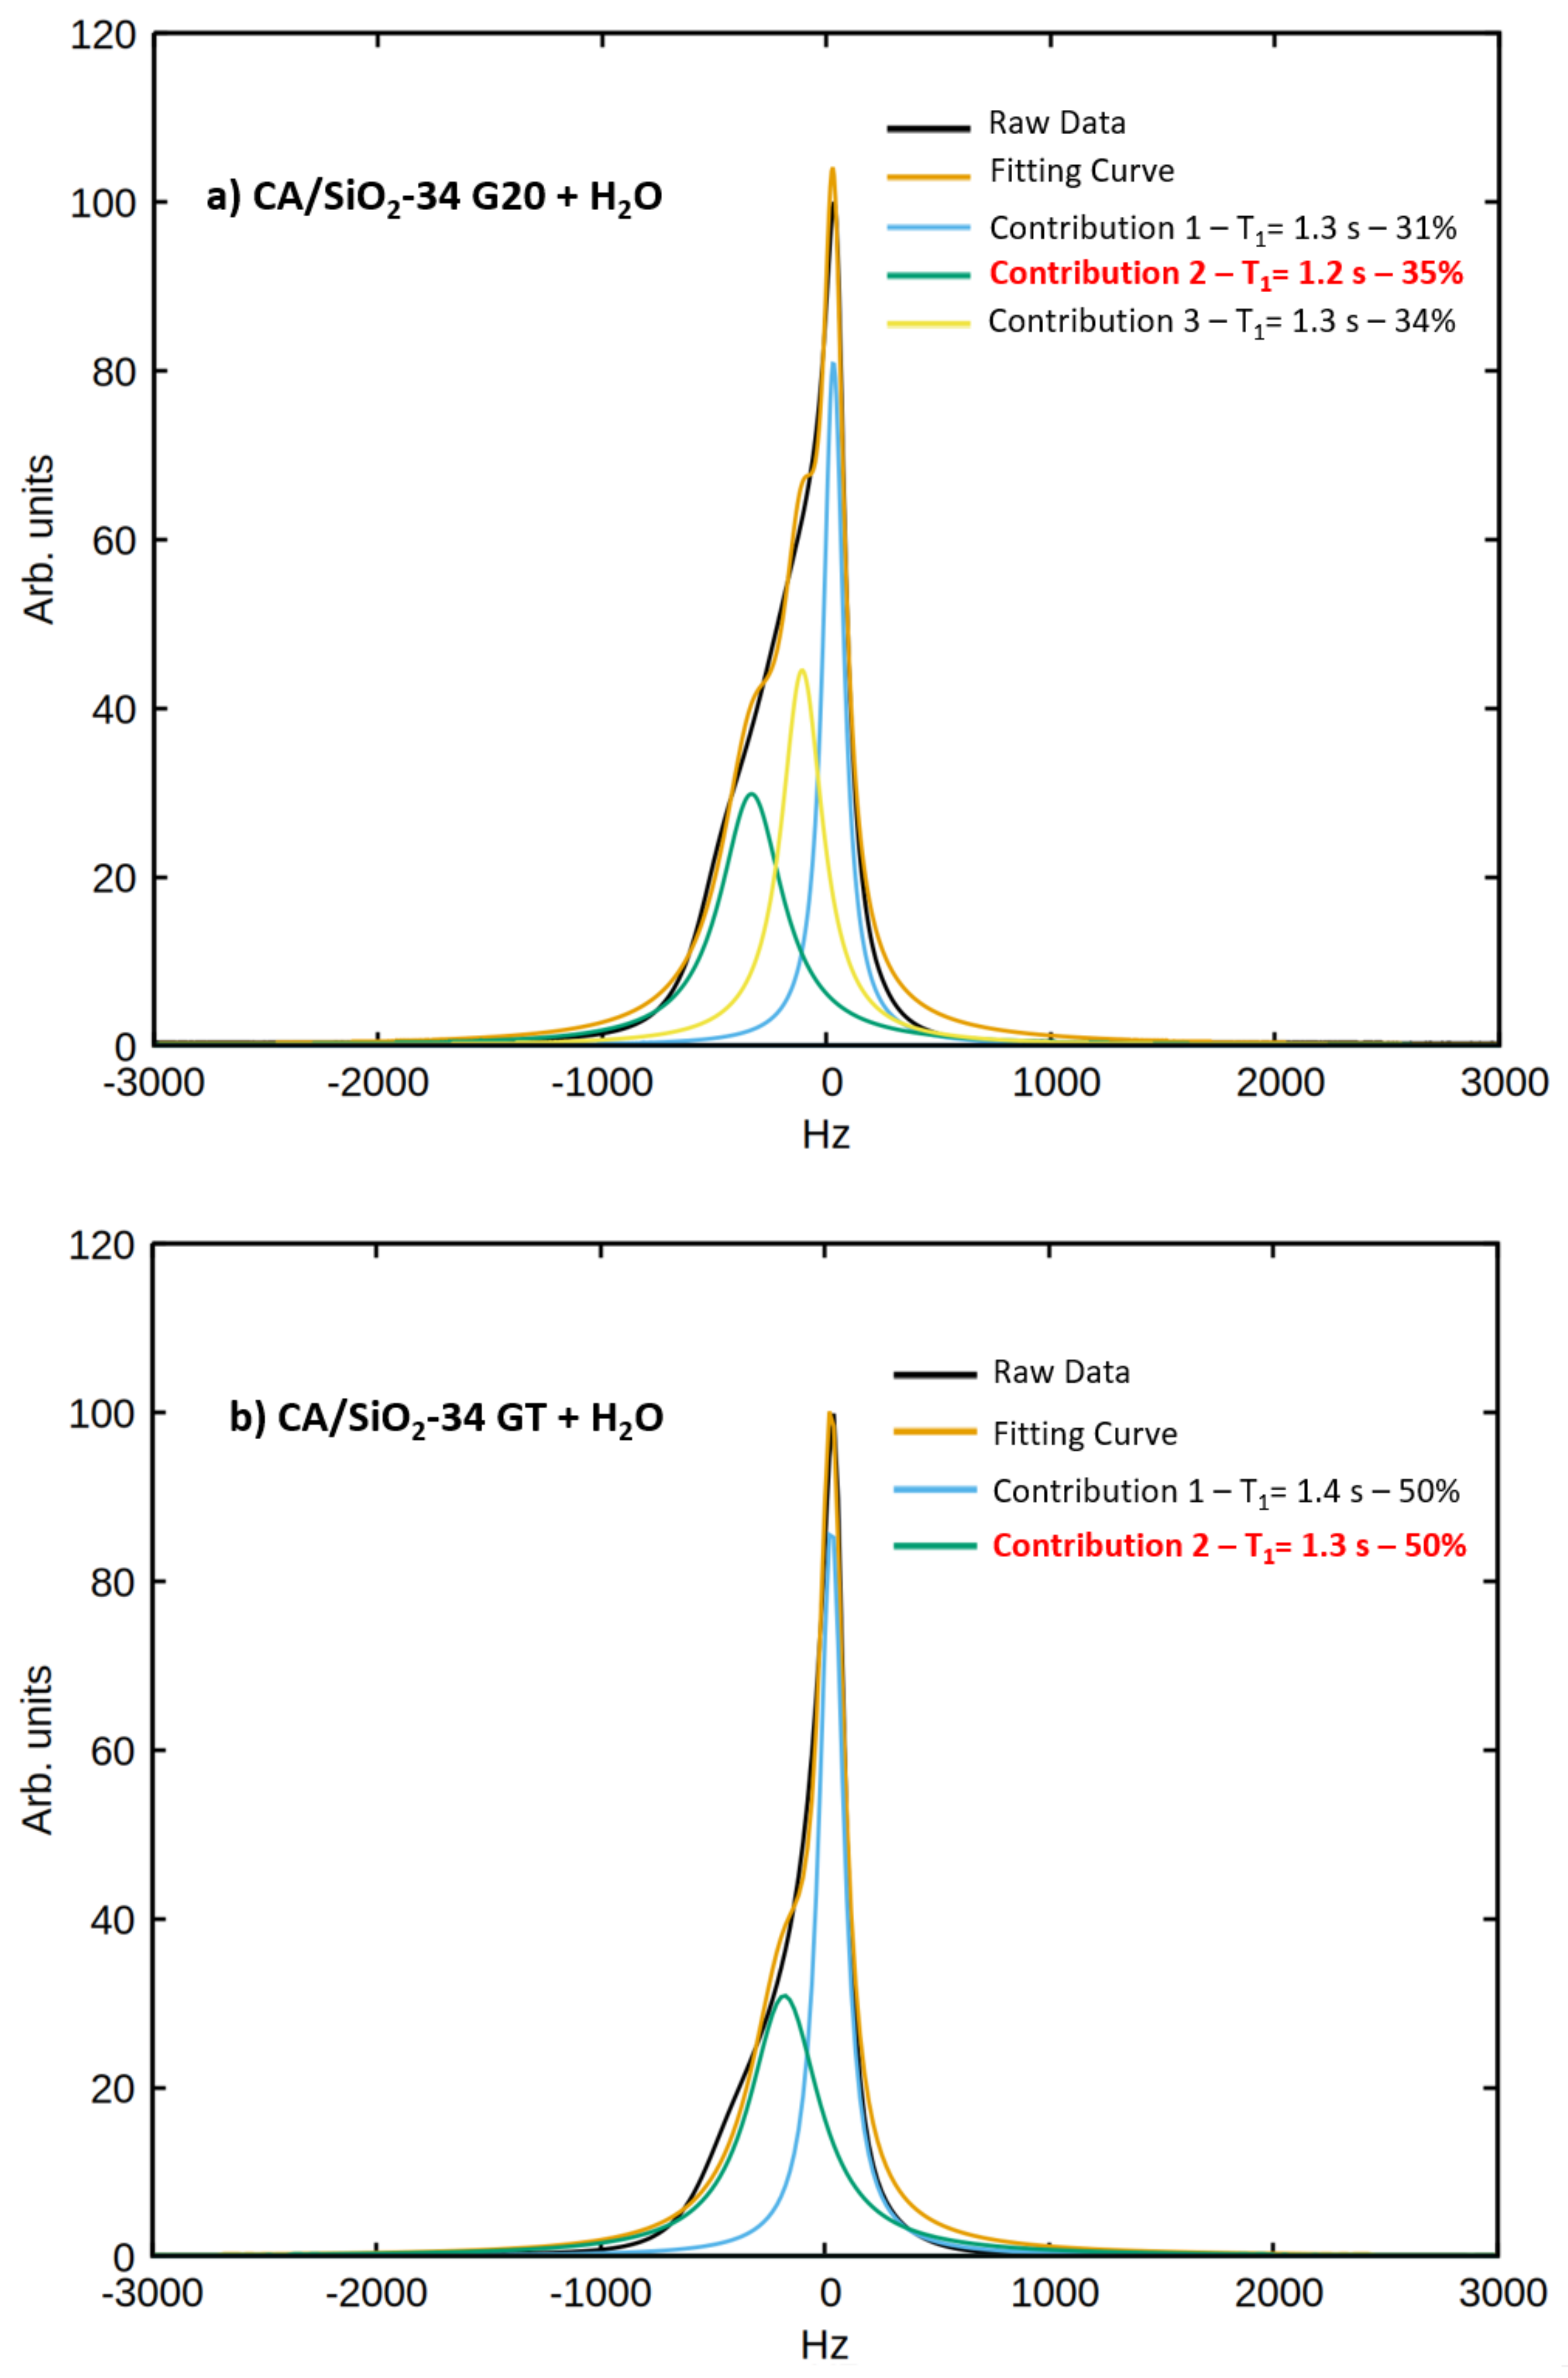
q is the fraction of water molecules interacting with the pore walls, which was determined with the analysis of the spectral components of the signals obtained at a
H Larmor frequency of 300 MHz:
Rotational diffusion (Rot):
The model by Bloembergen, Purcell and Pound, better known as the BPP model, was applied in order to describe rotations of water molecules in the membranes [
31,
32]. The contribution of this mechanism to the NMR dispersion curves of water
H spins is given by Equation (
4).
The prefactor
depends on the effective intramolecular distance between
H nuclear spins,
(
Å in the case of the water molecule), via Expression (
5), which can easily be calculated for the water molecule:
with
denoting the vacuum magnetic permeability (
H/m),
denoting the magnetic ratio of the nucleus with spin
I and
denoting the reduced Planck constant (
m
Kg/s). Given that
can be estimated and fixed, the only parameter in Equation (
4) that needs to be determined via the model-fitting analysis is the rotational correlation time,
.
Translational Diffusion (SD):
Self-diffusion of water molecules may be accounted for using the Torrey model [
33,
34]. Torrey assumed that molecules have equal probabilities of jumping in any direction from an initial state into another, reaching a random jump-like solution. The associated longitudinal relaxation rate frequency dependence is described by Equation (
6).
Parameter
n is the
H spin density, and
d is the average intermolecular interspin distance.
, the translational diffusion correlation time,
, the mean square jump distance, and the diffusion coefficient,
D, are related by the following equation.
The functions
, and
are the spectral density functions described in references [
33,
34].
Rotations mediated by translational displacements (RMTD):
The water motion in the confined system gives rise to a relaxation mechanism associated with rotations mediated by translational displacements. This model describes the movement of water molecules near the pores’ walls and, therefore, is related to the interaction of those molecules with the membranes’ surfaces. The contribution of this model to the longitudinal relaxation rate is given by [
35,
36] the following:
where
This contribution exhibits one high cut-off frequency, , and one low cut-off frequency, , which are, respectively, associated with the largest and smallest possible translational relaxation modes and, therefore, to the smallest and largest possible average displacements, respectively: and , where D is the diffusion coefficient and l is the average displacement. Exponent p can vary between 0.5 and 1, where p = 0.5 corresponds to a situation where there is an isotropic distribution of coupled rotations and self-diffusion motions along the pore/channel’s surfaces, while for p = 1, there is a preferential orientation of the rotations/translations relaxation modes along the constraining surfaces. The parameter is inversely proportional to the square root of the diffusion coefficient and to the range of wave numbers related to the motional modes induced by the surface, . This parameter is proportional to the square of the fraction of molecules interacting with the surface and to the square of the order parameter, representing the long time limit residual correlation of restricted tumbling.
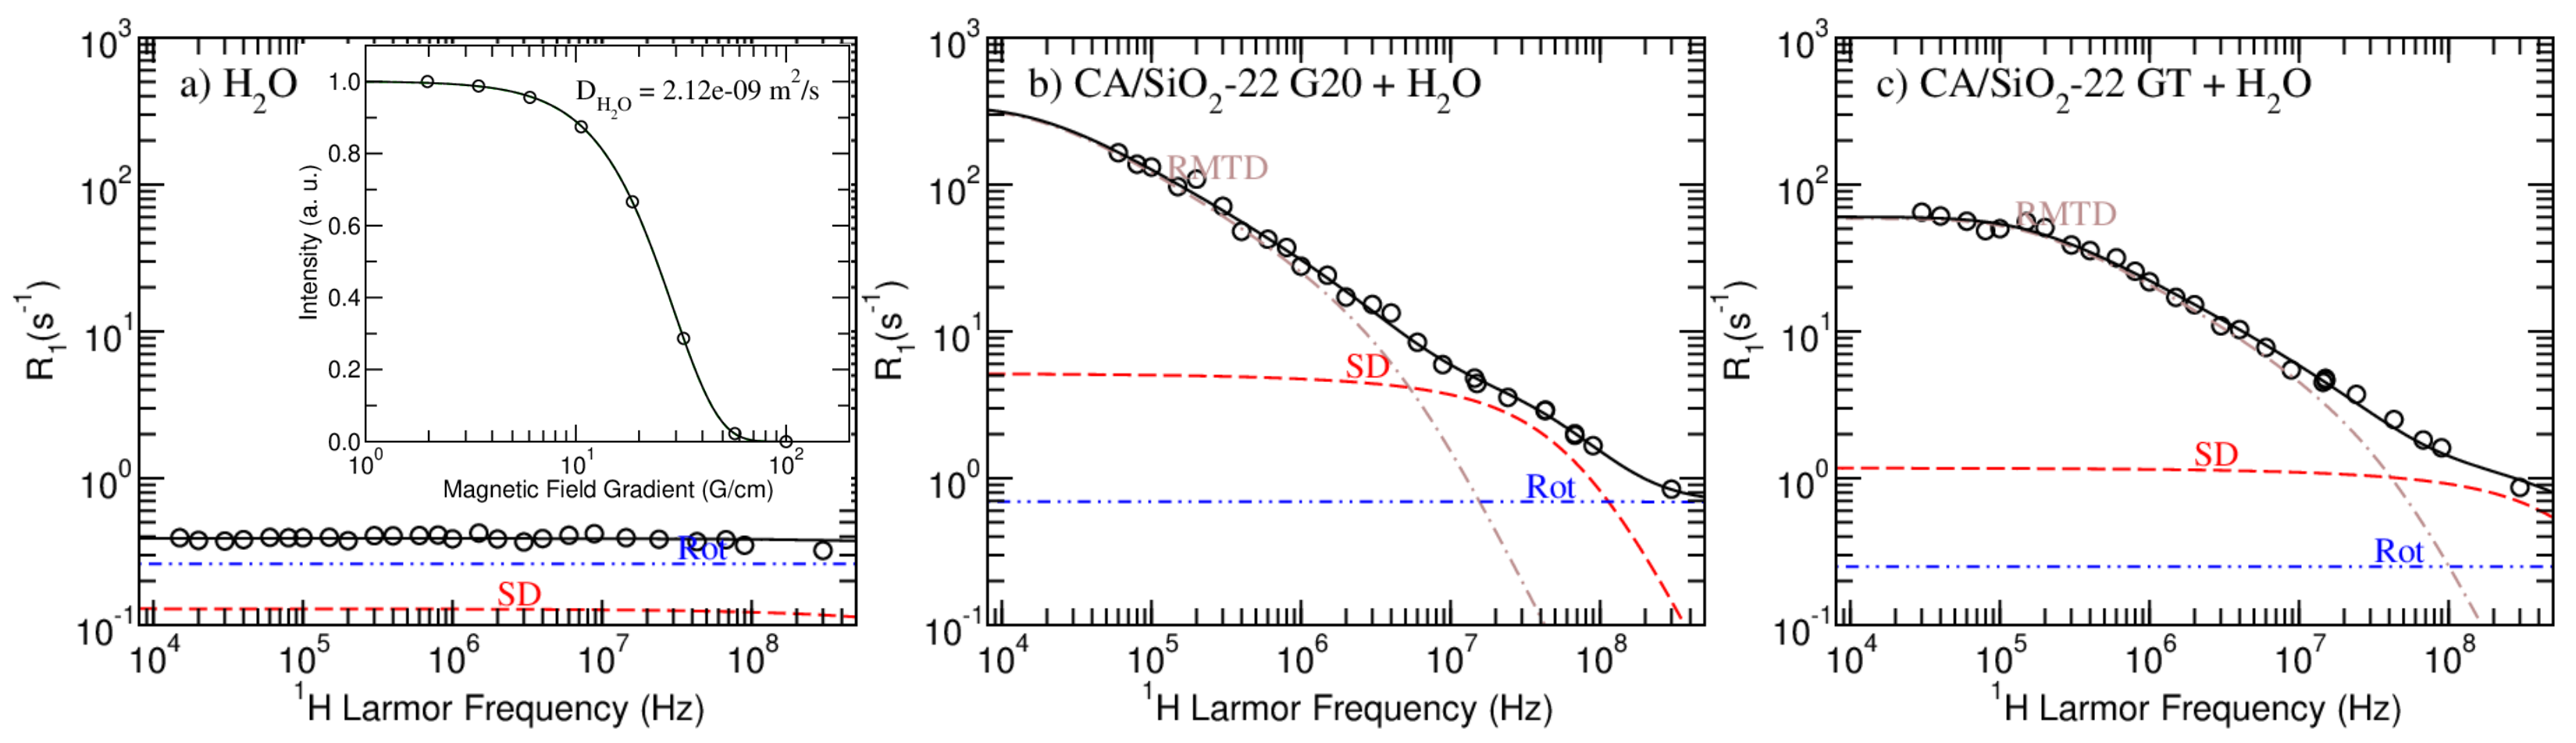
3.4.2. Model Fitting
In
Figure 4 and
Figure 5, the model fitting results produced by the
Master module of the online platform
fitteia® [
37] are presented.
Figure 4 show the results obtained for pure water and the CA/SiO
-22 G20 and GT-hydrated membranes. The model fitting analysis of CA/SiO
-30 and CA/SiO
-34 systems is presented in
Figure 5. The model fitting parameters resulting from the NMRD curves analysis are summarized in
Table 5.
The model proposed in this work and the combination of H NMR relaxometry and diffusometry experimental techniques allowed for a consistent analysis of all the studied hydrated membranes, as it can be concluded by the good quality of the fits.
In
Figure 4, it is possible to observe the striking NMRD profile difference when comparing pure water with confined water. Water molecules entrapped in the matrix have the additional RMTD relaxation pathway, which significantly increases the longitudinal relaxation rate. Moreover, confined water presented diffusion coefficients that are up to three orders of magnitude smaller than that measured for free water (see inserted image in
Figure 4a and
Table 5).
The parameter
q was fixed to the value obtained from the analysis of the spectral components.
and
were set equal to the value of
and
obtained from the diffusometry analysis and presented in
Table 4, respectively.
corresponds to a less confined fraction of water that does not interact directly with the matrix, while
corresponds to a more confined fraction of water that relaxes as a result of interactions with the surface.
Despite the apparent similarities between the relaxometry profiles obtained for the G20 and GT versions of membranes CA/SiO
-30 and CA/SiO
-34, the model-fitting analysis evidences a decrease in the self-diffusion relaxation rate contribution for the membranes that were post-treated with triton X-100 (compare the dashed red line of the sub figures with that of the respective inserted image in
Figure 5). This contribution decrease is more significant for the CA/SiO
-22 membranes, as observed in
Figure 4. This observation is consistent with triton X-100 increasing the hydrophobicity of the cellulose acetate matrix, making the water less bound to it and leading to higher diffusion coefficients (see
and
in
Table 5 or, respectively,
and
in
Table 4). The fact that this increase is more significant for the CA/SiO
-22 hydrated membranes may be explained by the fact that smaller pore sizes relate to a larger ratio of water/surface interactions.Furthermore, the increased hydrophobicity suggested from this model-fitting analysis might explain the uniformization of the bound water fraction,
q, found for the GT porous membranes (see
Table 3).
This analysis enabled the estimation of the characteristic pore size given by the parameter , that, on average, induces more effective H NMR relaxation through rotations mediated by translational displacements. As it can be observed, the additional treatment with triton X-100 does not significantly affect this dimension, except in the case of CA/SiO-34 systems. Combining the previously described increased hydrophobicity with the fact that this membrane is the most permeable, it is possible that the signal from more bound water molecules is masked by the signal of unbound water, leading to an apparently larger characteristic dimension.
Regarding the fact that is inversely proportional to the square root of the diffusion coefficient, the values obtained for this parameter seem to be consistent for all the samples and further support the increased hydrophobicity conferred upon treating the matrix with triton X-100 (GT).
Parameter p shows that there is an isotropic distribution of coupled rotations and self-diffusion motions along the matrix’ pores for all systems, except for the CA/SiO-22 pair, where some degree of anisotropy is detected. The fact that CA/SiO-22 membranes have smaller pores is expected to increase the degree of confinement, thus evidencing water-ordering induced by the surface.

 ,
, 


