
Can Hindered Transport Models for Rigid Spheres Predict the Rejection of Single Stranded DNA from Porous Membranes?
Abstract
:
1. Introduction
2. Materials and Methods
2.1. Experiment
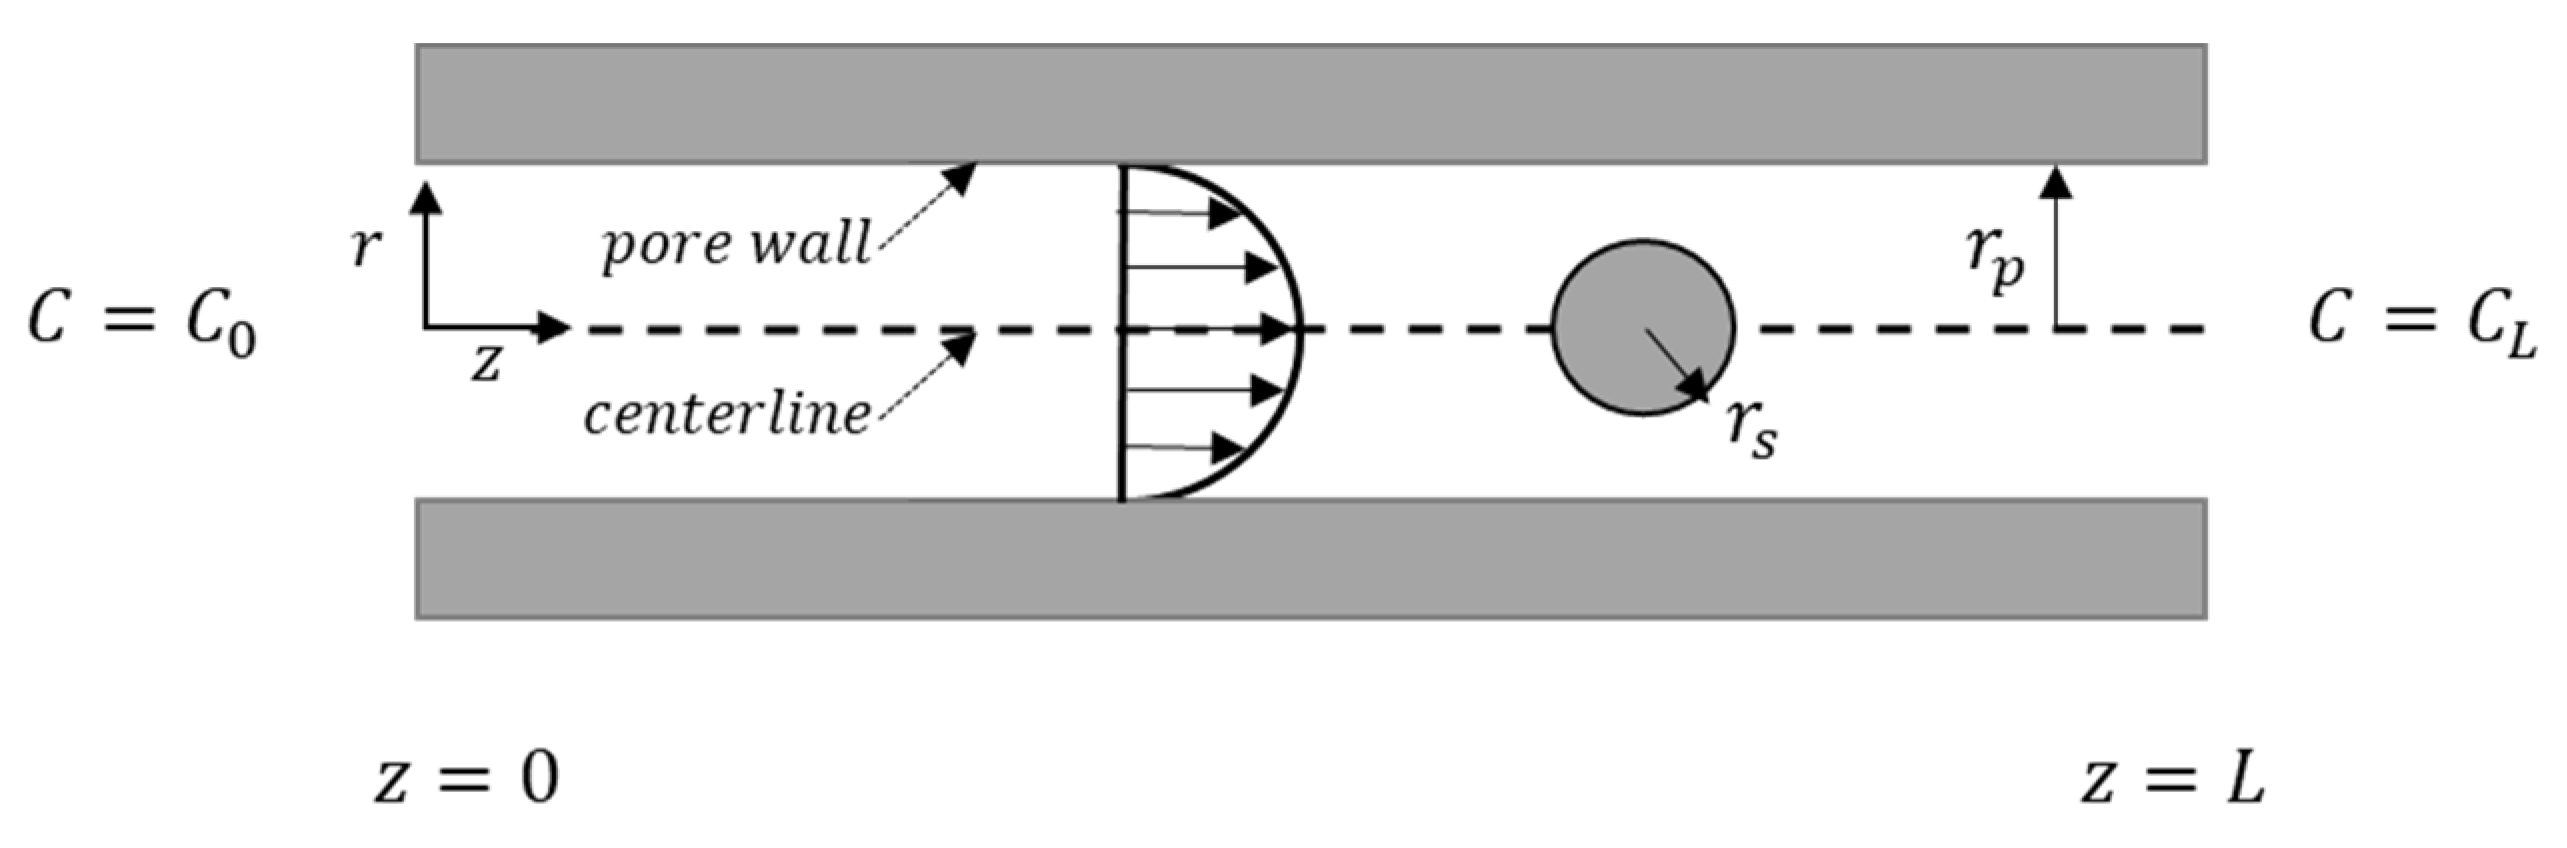
2.2. Modeling
2.2.1. Solute and Pore Sizes
2.2.2. Hydrodynamic Interactions
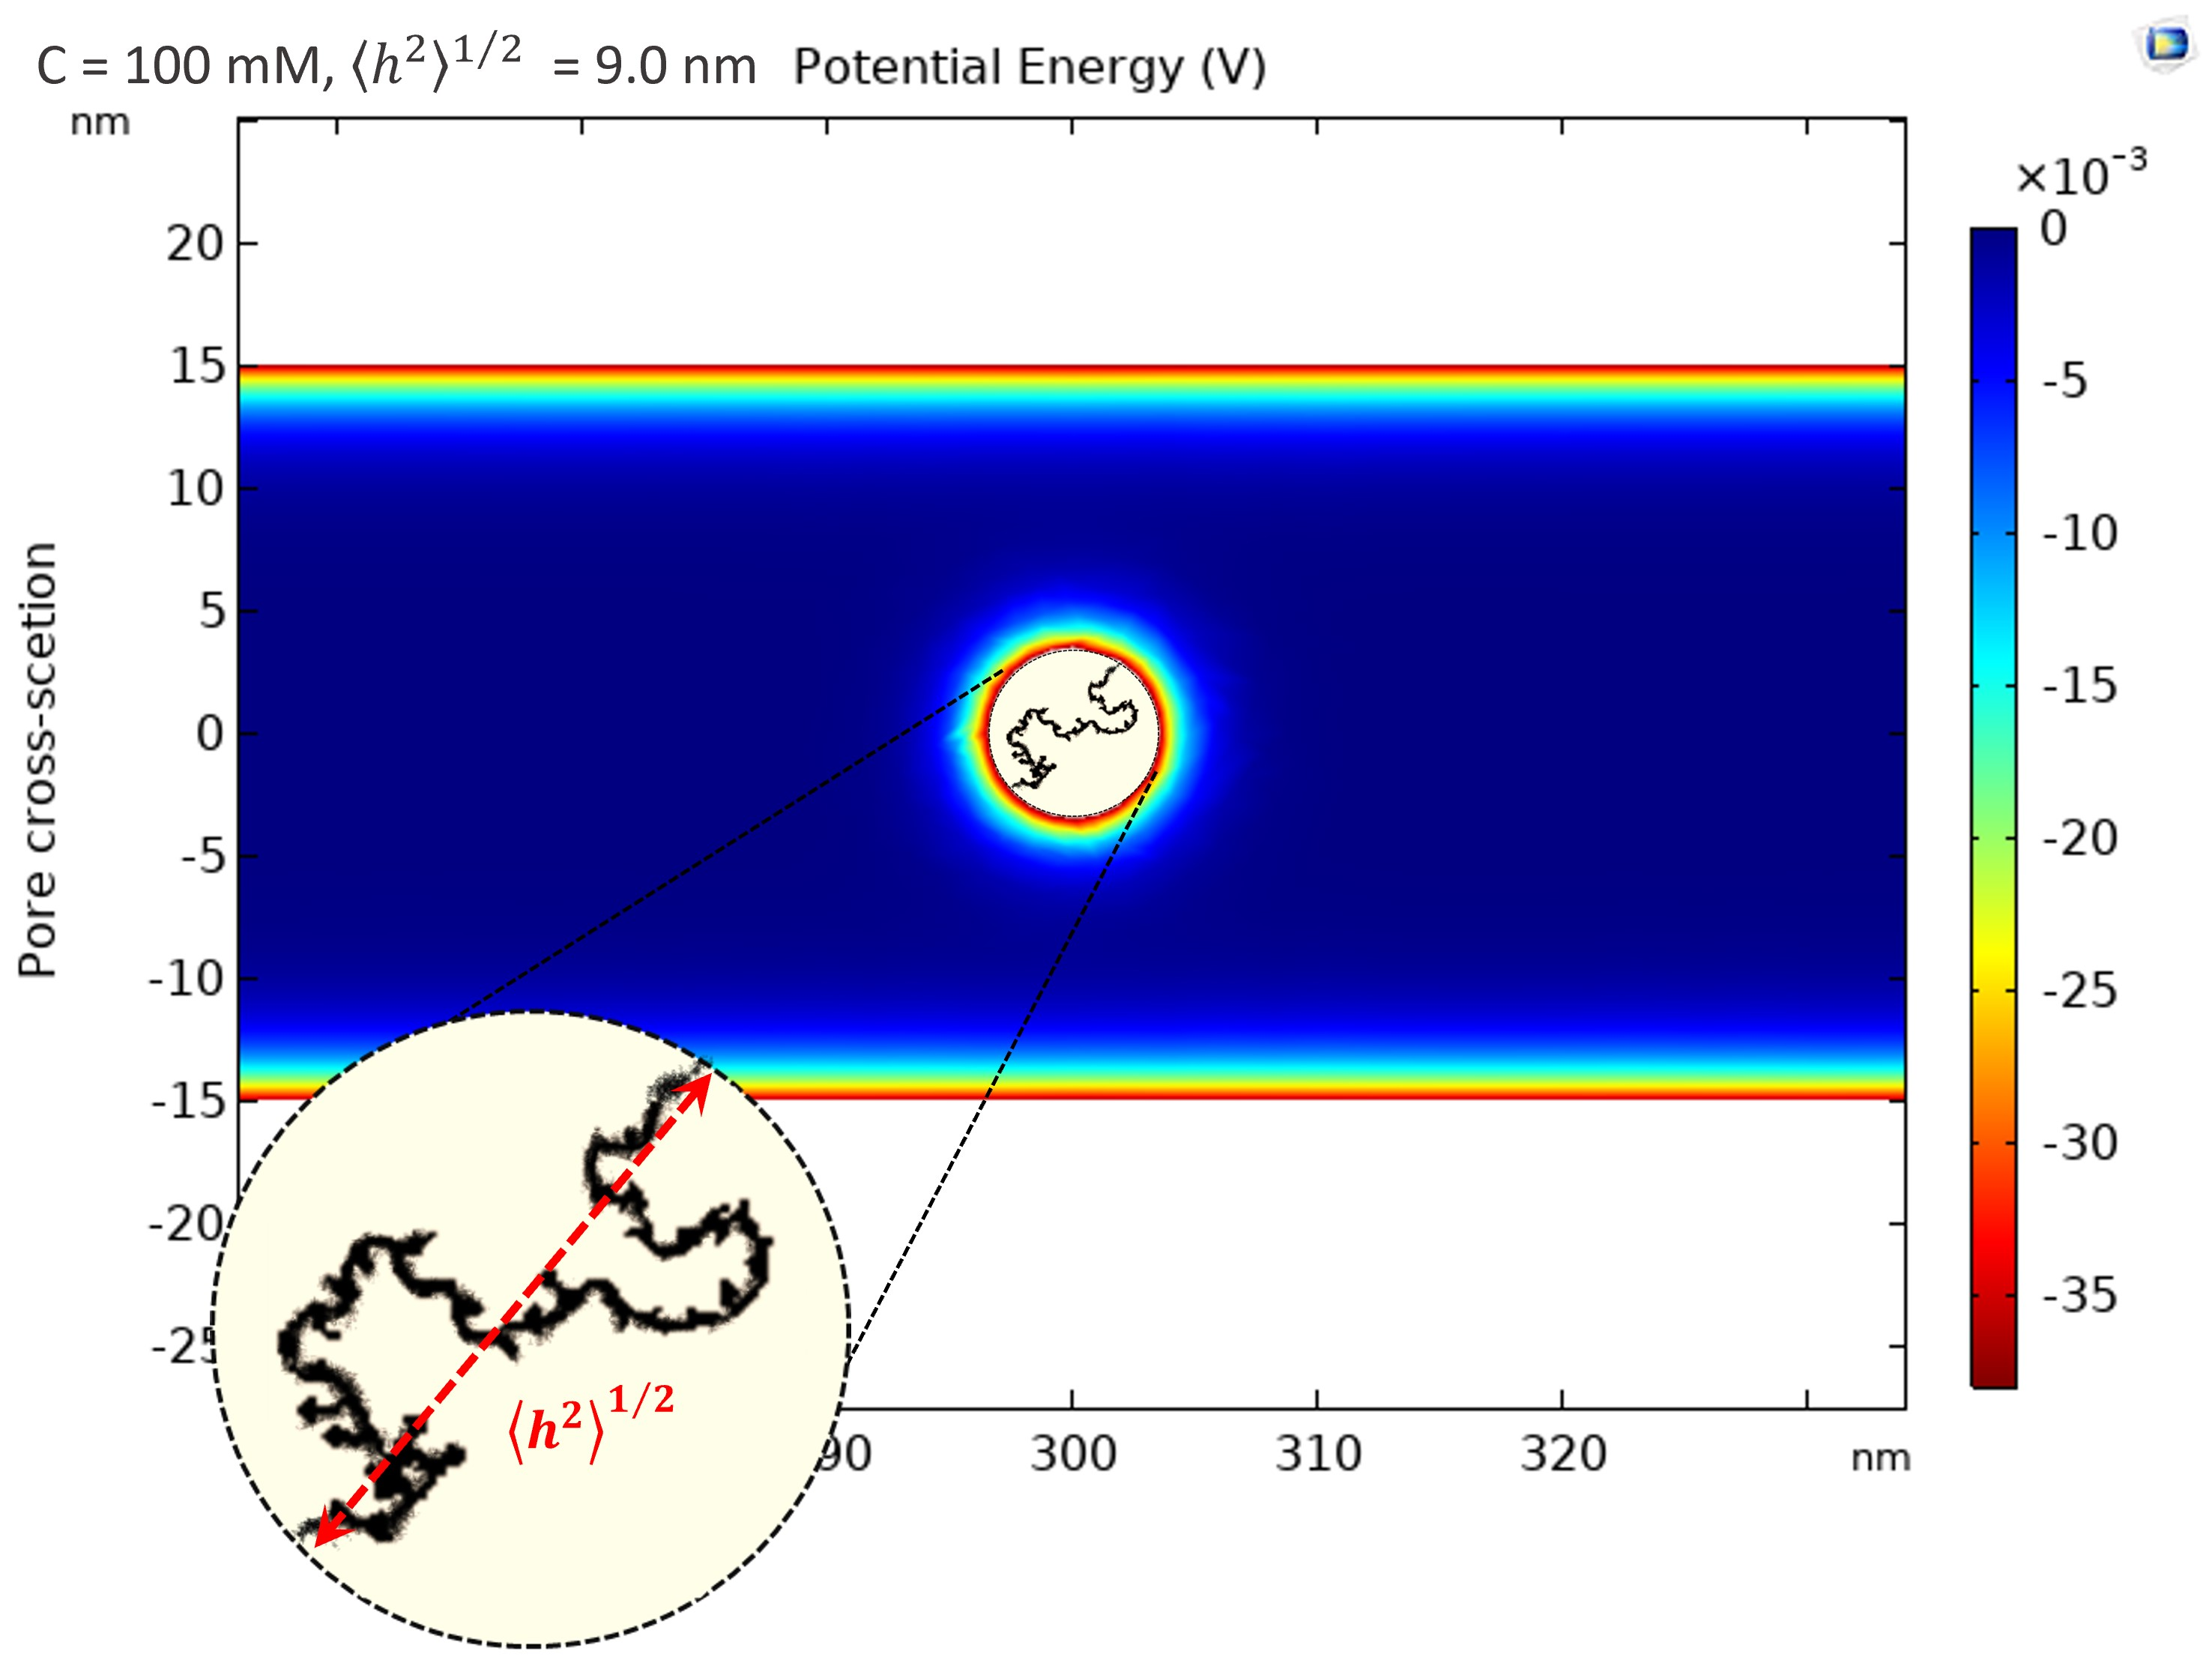
2.2.3. Electrostatic Interactions
3. Results and Discussion
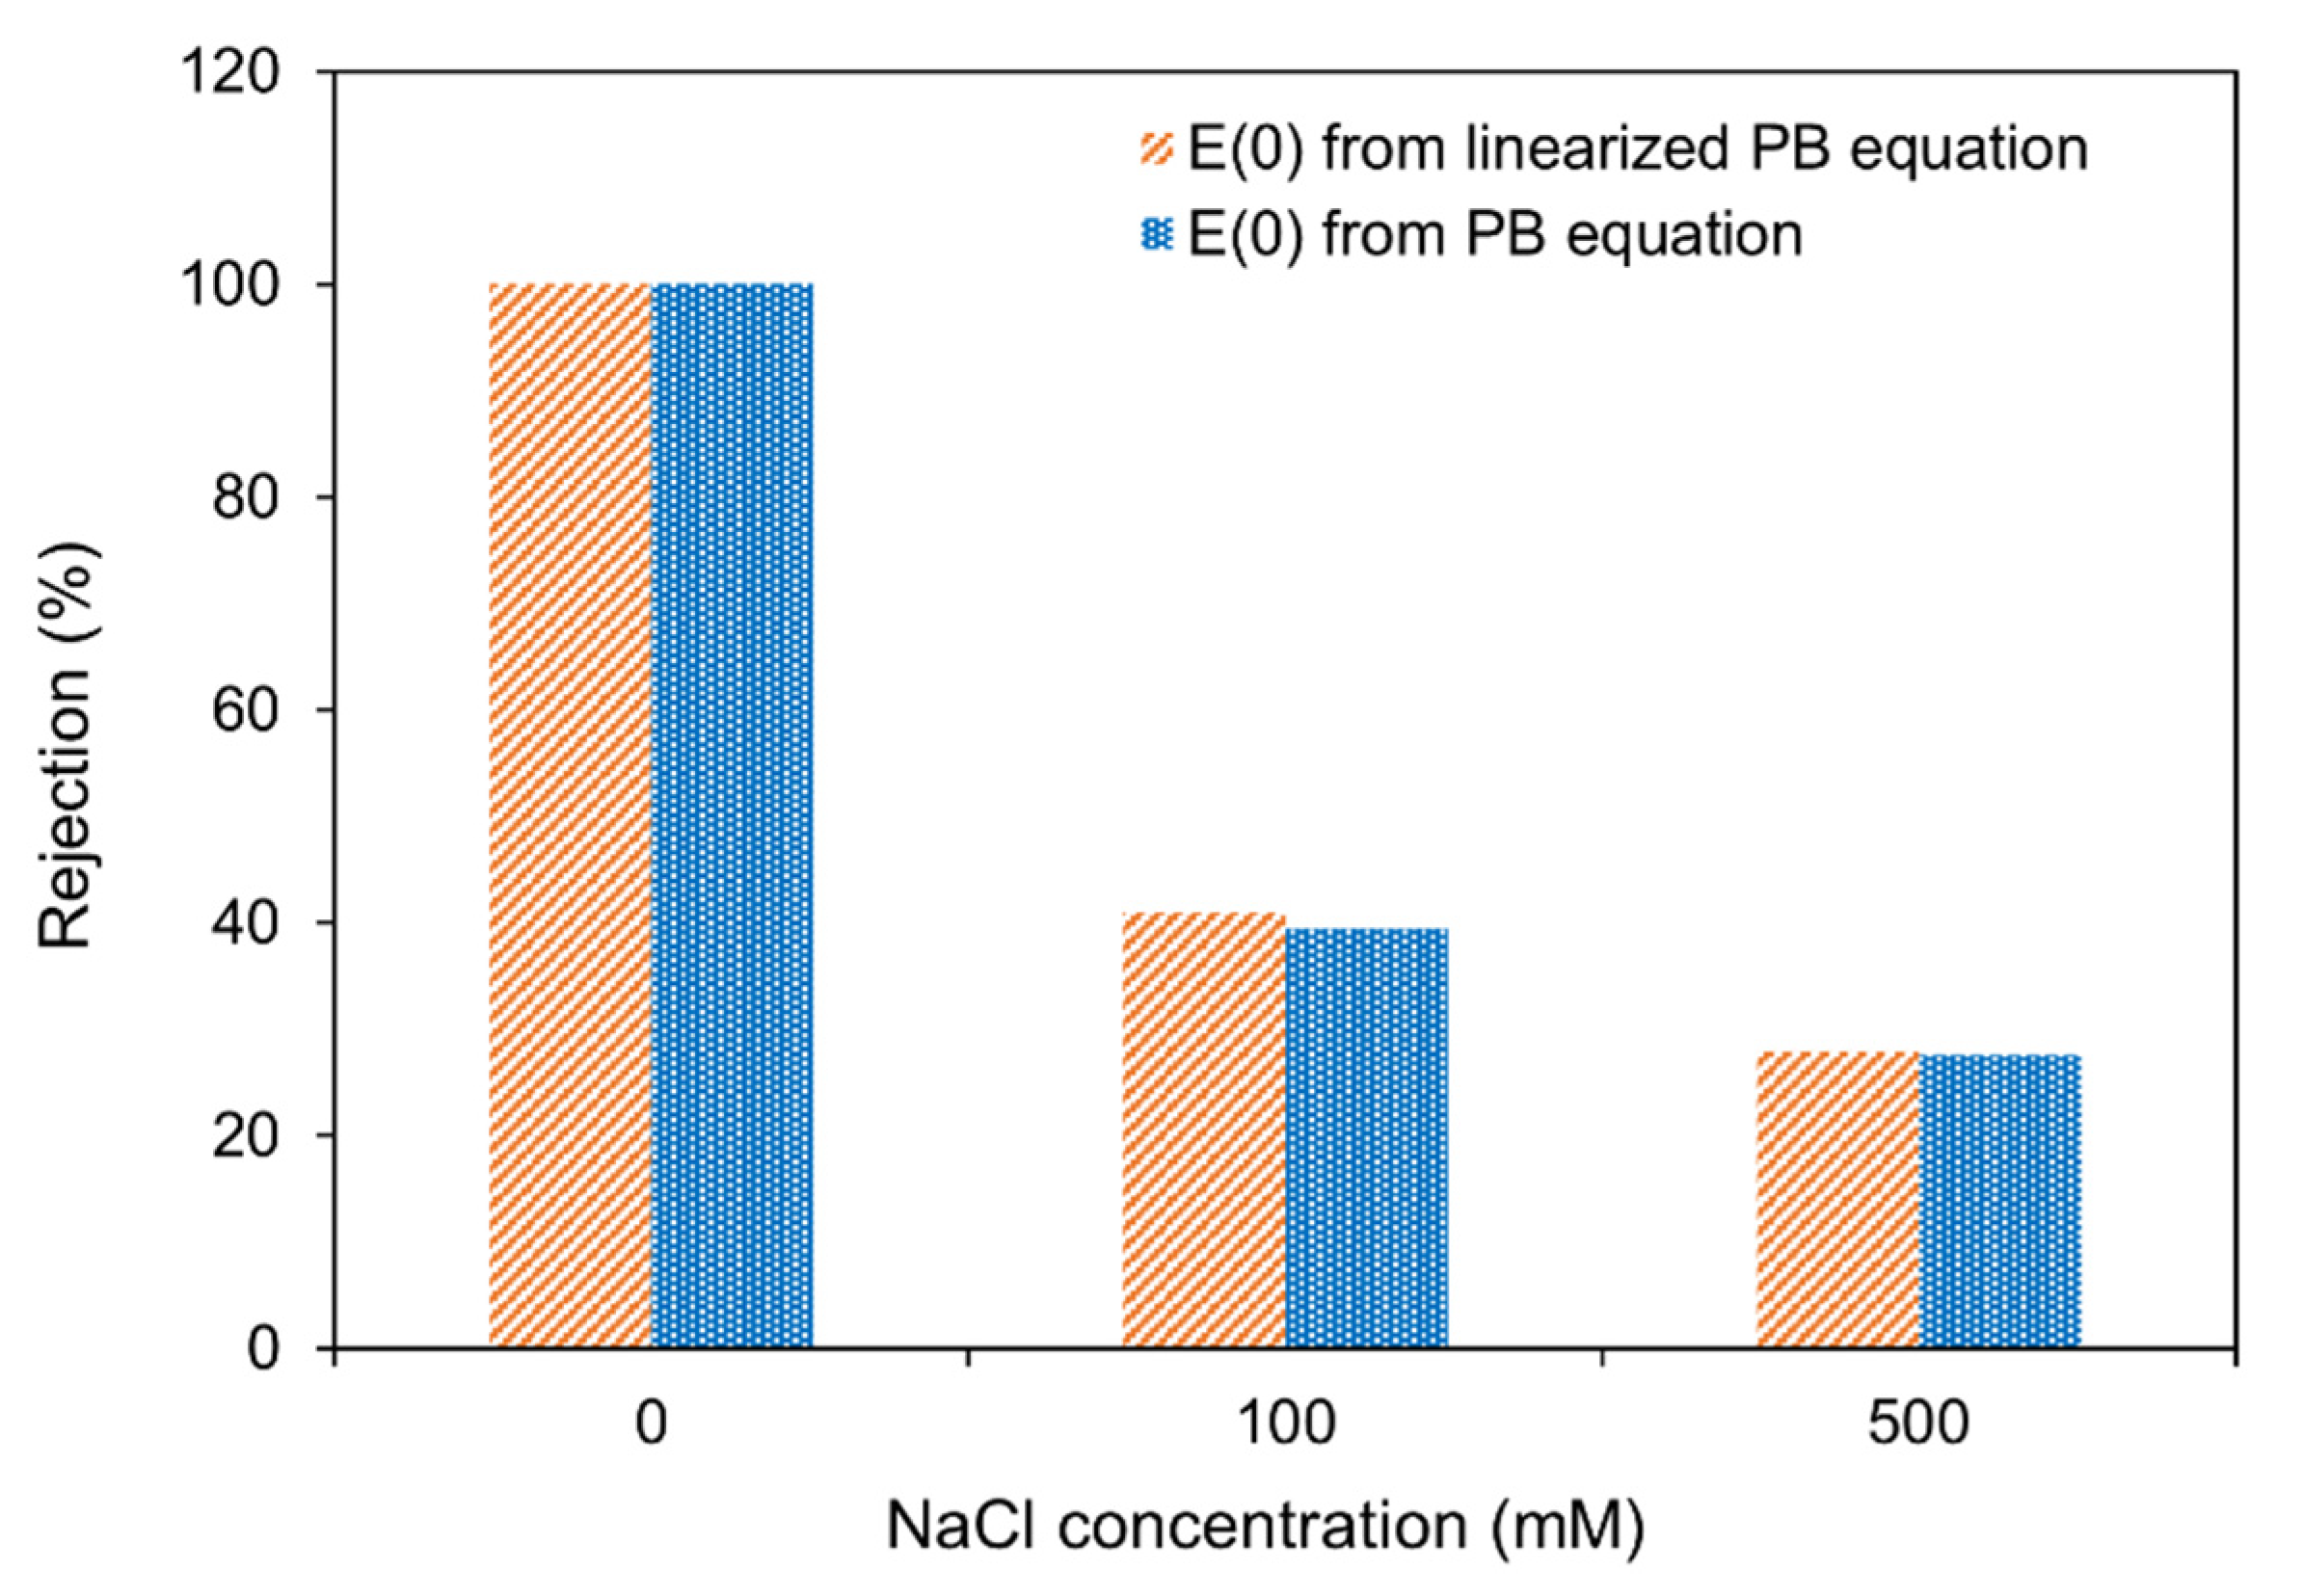
3.1. Linearized vs. Non-Linearized Poisson Boltzmann Equation
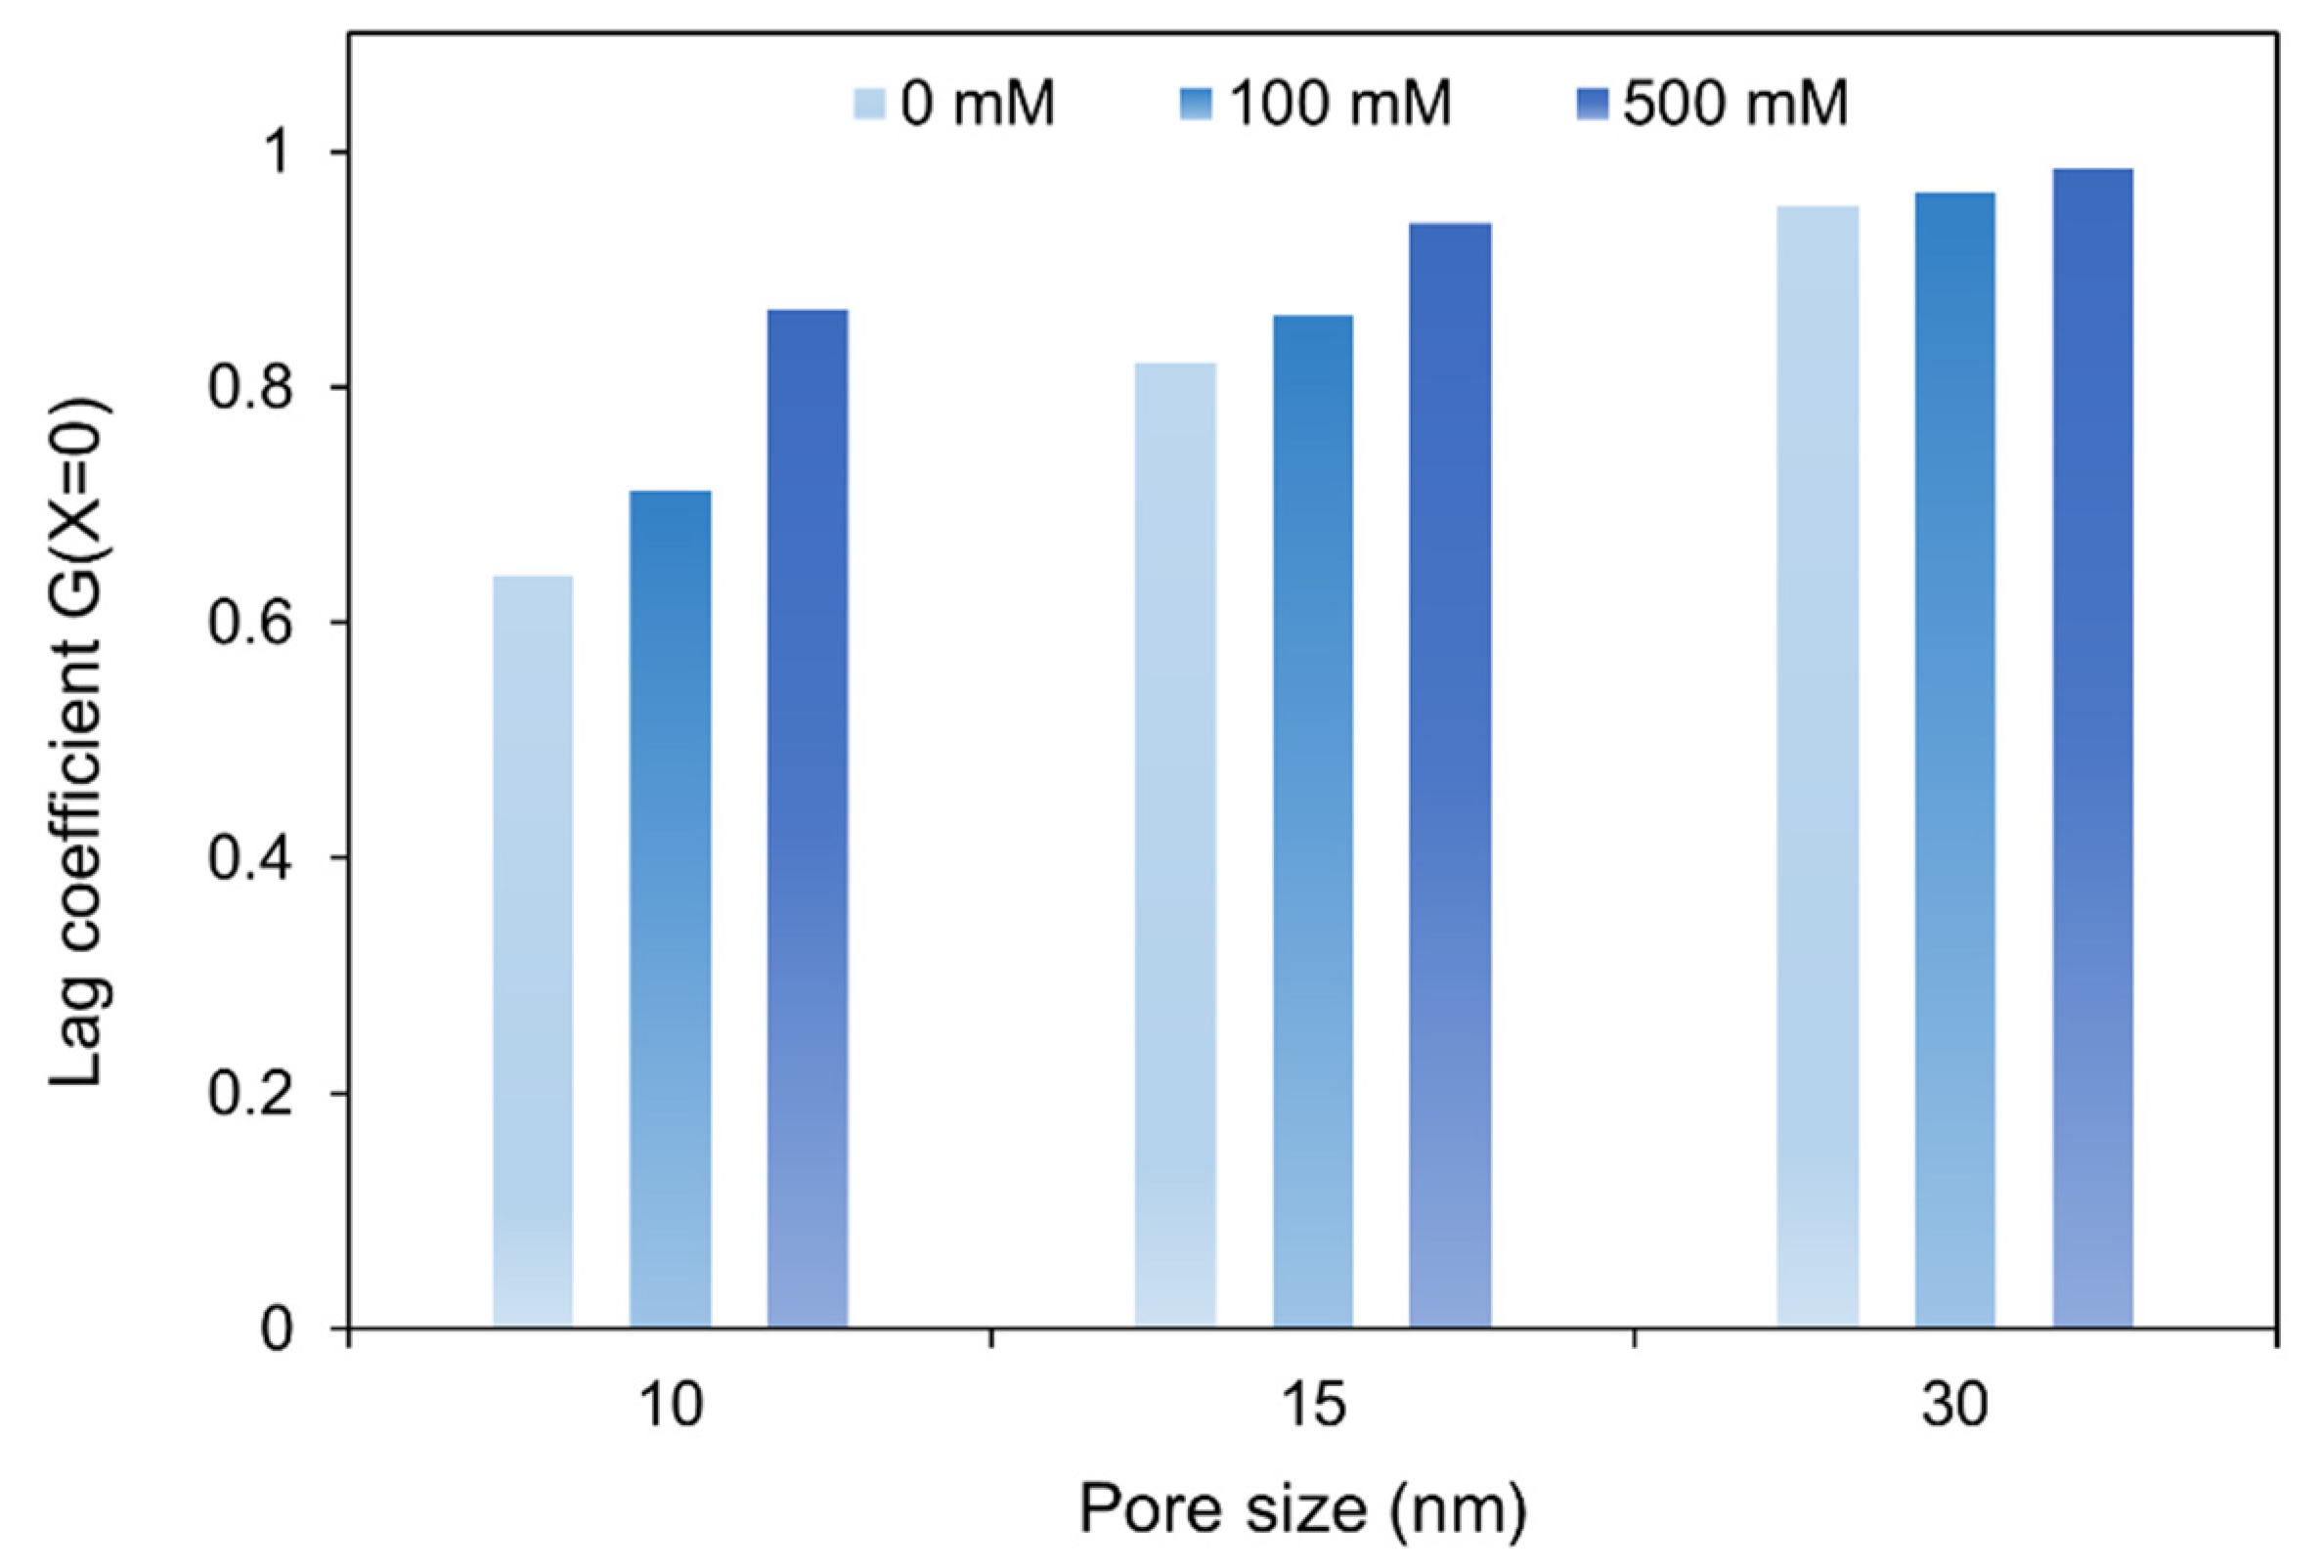
3.2. Hydrodynamic Interactions
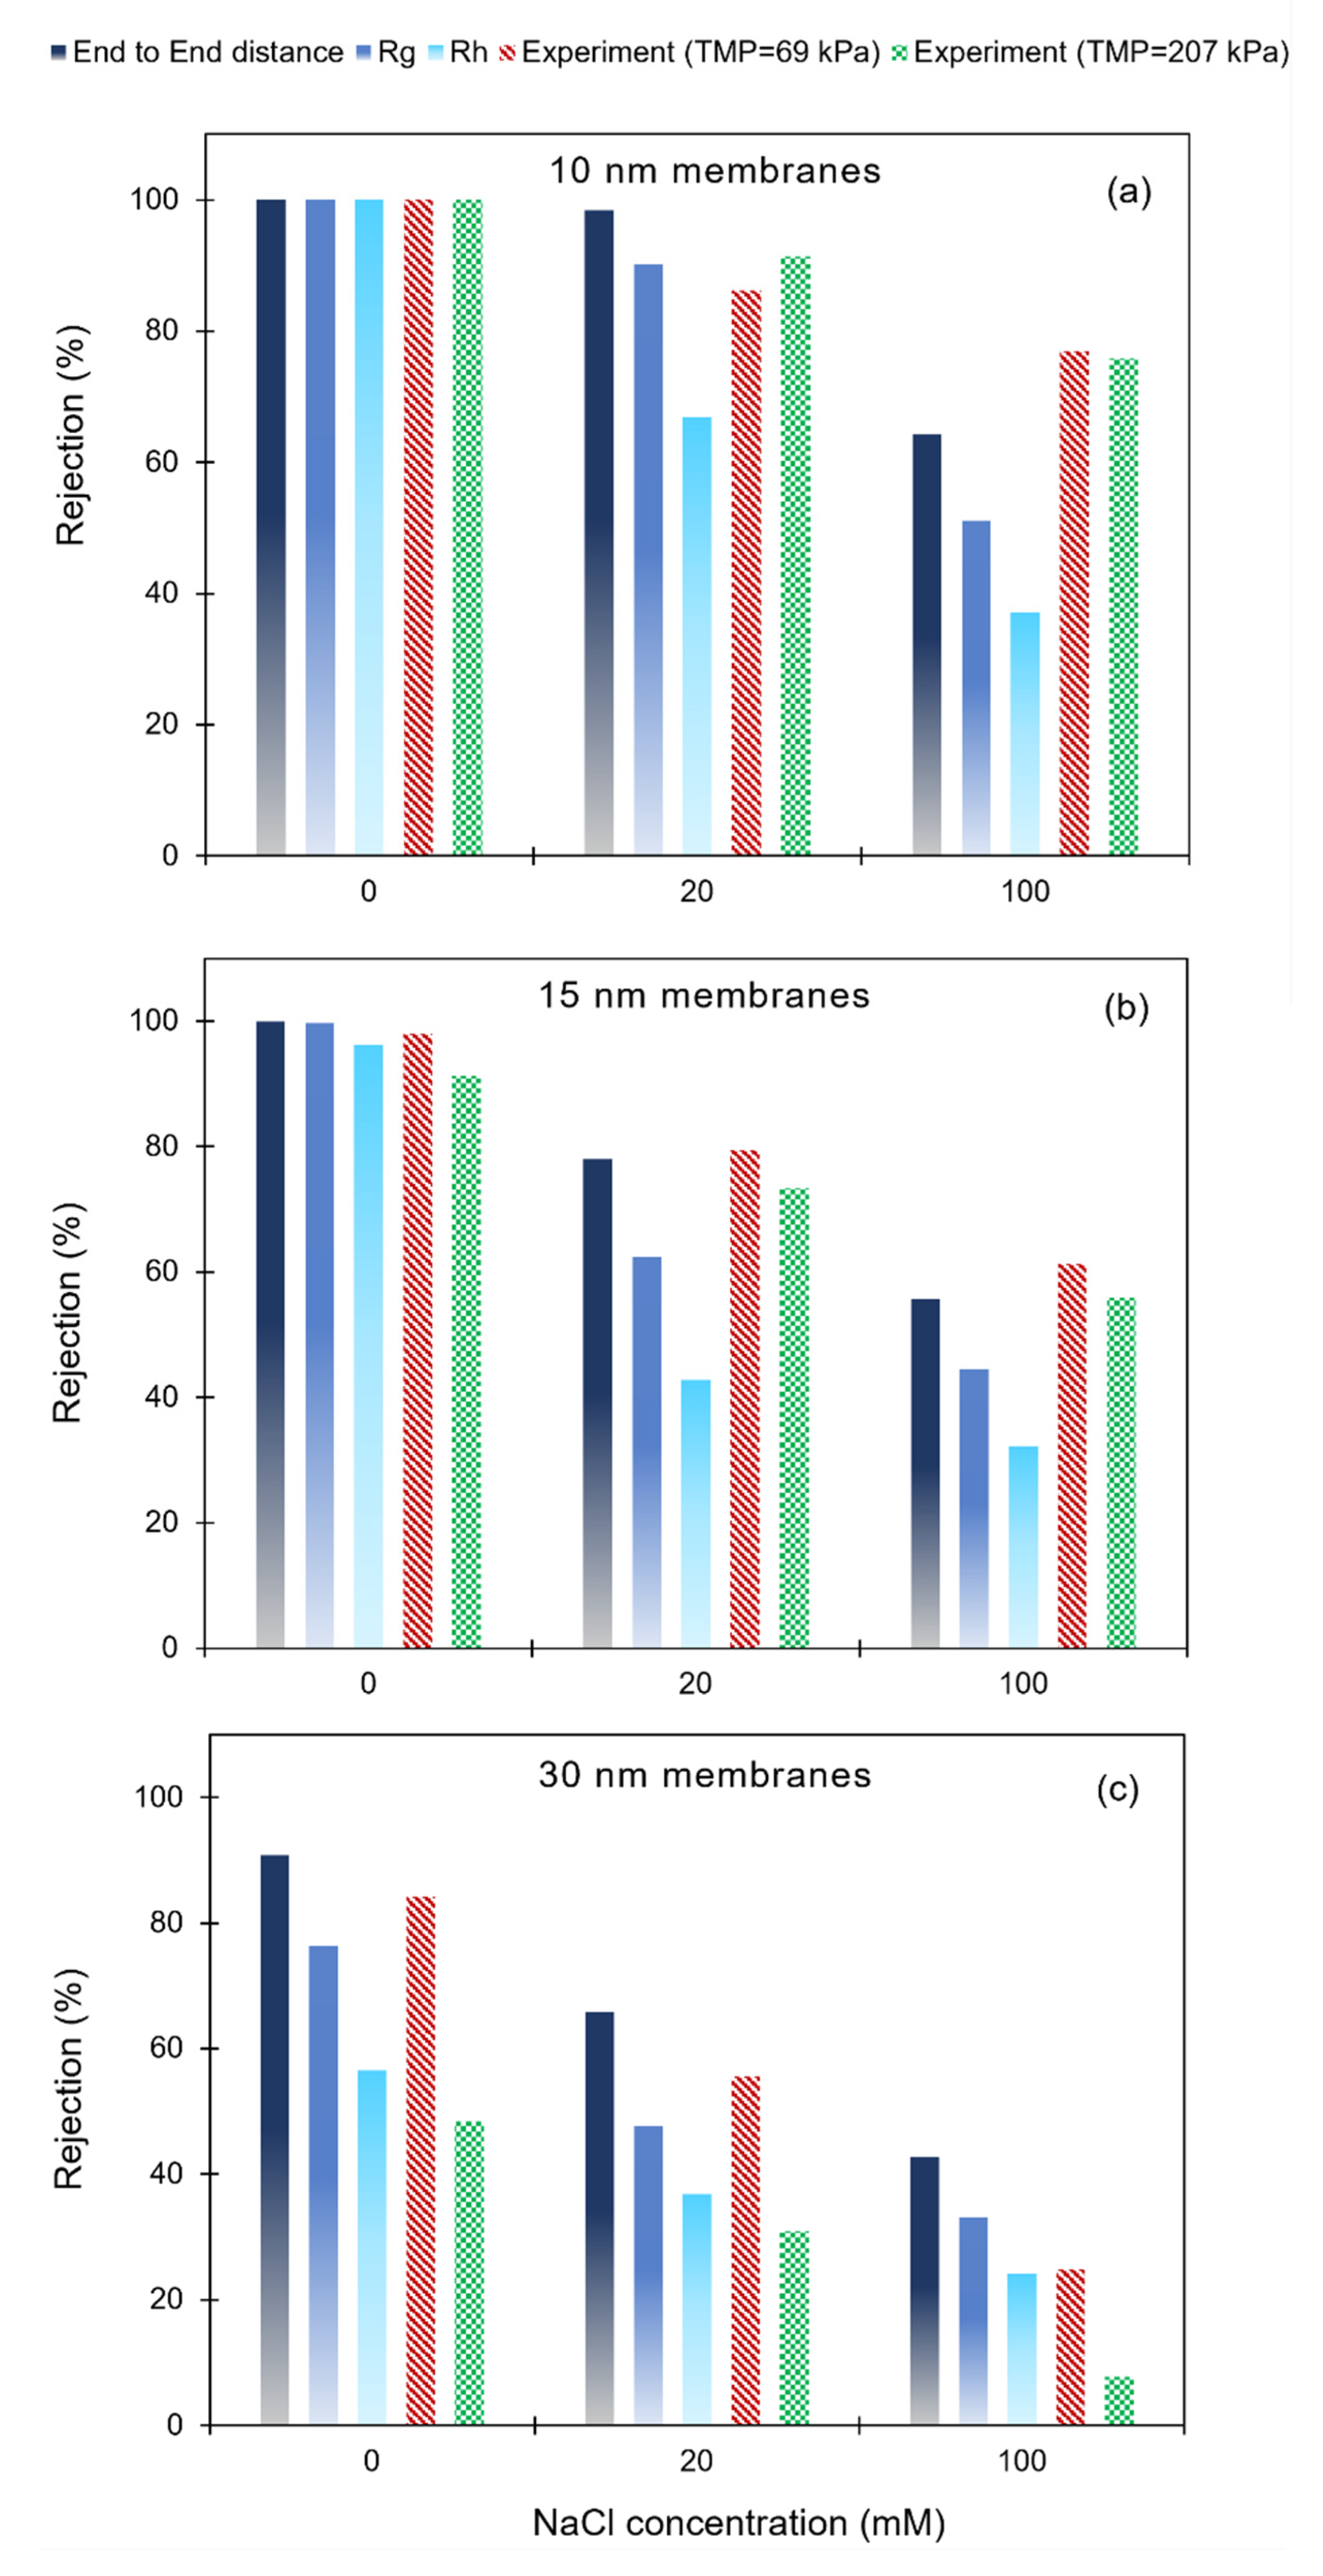
3.3. Poly(dT60) ssDNA Rejection: Model Predictions and Experimental Results
4. Conclusions
Supplementary Materials
Author Contributions
Funding
Institutional Review Board Statement
Informed Consent Statement
Data Availability Statement
Conflicts of Interest
References
- Patil, S.D.; Rhodes, D.G.; Burgess, D.J. DNA-based therapeutics and DNA delivery systems: A comprehensive review. AAPS J. 2005, 7, E61–E77. [Google Scholar] [CrossRef] [PubMed] [Green Version]
- Shi, B.; Zheng, M.; Tao, W.; Chung, R.; Jin, D.; Ghaffari, D.; Farokhzad, O.C. Challenges in DNA Delivery and Recent Advances in Multifunctional Polymeric DNA Delivery Systems. Biomacromolecules 2017, 18, 2231–2246. [Google Scholar] [CrossRef] [PubMed]
- Yurina, V. Live Bacterial Vectors—A Promising DNA Vaccine Delivery System. Med. Sci. 2018, 6, 27. [Google Scholar] [CrossRef] [PubMed] [Green Version]
- Liu, L.; Gao, H.; Guo, C.; Liu, T.; Li, N.; Qian, Q. Therapeutic Mechanism of Nucleic Acid Drugs. ChemistrySelect 2021, 6, 903–916. [Google Scholar] [CrossRef]
- Latulippe, D.R.; Zydney, A.L. Separation of plasmid DNA isoforms by highly converging flow through small membrane pores. J. Colloid Interface Sci. 2011, 357, 548–553. [Google Scholar] [CrossRef]
- Morão, A.M.; Nunes, J.C.; Sousa, F.; Pessoa de Amorim, M.T.; Escobar, I.C.; Queiroz, J.A. Ultrafiltration of supercoiled plasmid DNA: Modeling and application. J. Membr. Sci. 2011, 378, 280–289. [Google Scholar] [CrossRef]
- Zydney, A.L. New developments in membranes for bioprocessing—A review. J. Membr. Sci. 2021, 620, 118804. [Google Scholar] [CrossRef]
- Quinn, J.A.; Anderson, J.L.; Ho, W.S.; Petzny, W.J. Model Pores of Molecular Dimension. Biophys. J. 1972, 12, 990–1007. [Google Scholar] [CrossRef] [Green Version]
- Anderson, J.L. Configurational effect on the reflection coefficient for rigid solutes in capillary pores. J. Theor. Biol. 1981, 90, 405–426. [Google Scholar] [CrossRef]
- Deen, W.M. Hindered transport of large molecules in liquid-filled pores. AIChE J. 1987, 33, 1409–1425. [Google Scholar] [CrossRef]
- Giddings, J.C.; Kucera, E.; Russell, C.P.; Myers, M.N. Statistical theory for the equilibrium distribution of rigid molecules in inert porous networks. Exclusion chromatography. J. Phys. Chem. 1968, 72, 4397–4408. [Google Scholar] [CrossRef]
- Brenner, H.; Gaydos, L.J. The constrained brownian movement of spherical particles in cylindrical pores of comparable radius: Models of the diffusive and convective transport of solute molecules in membranes and porous media. J. Colloid Interface Sci. 1977, 58, 312–356. [Google Scholar] [CrossRef]
- Dechadilok, P.; Deen, W.M. Hindrance Factors for Diffusion and Convection in Pores. Ind. Eng. Chem. Res. 2006, 45, 6953–6959. [Google Scholar] [CrossRef]
- Smith, F.G.; Deen, W.M. Electrostatic double-layer interactions for spherical colloids in cylindrical pores. J. Colloid Interface Sci. 1980, 78, 444–465. [Google Scholar] [CrossRef]
- Smith, F.G.; Deen, W.M. Electrostatic effects on the partitioning of spherical colloids between dilute bulk solution and cylindrical pores. J. Colloid Interface Sci. 1983, 91, 571–590. [Google Scholar] [CrossRef]
- Pujar, N.S.; Zydney, A.L. Electrostatic and Electrokinetic Interactions during Protein Transport through Narrow Pore Membranes. Ind. Eng. Chem. Res. 1994, 33, 2473–2482. [Google Scholar] [CrossRef]
- Burns, D.B.; Zydney, A.L. Contributions to electrostatic interactions on protein transport in membrane systems. AIChE J. 2001, 47, 1101–1114. [Google Scholar] [CrossRef]
- Agasanapura, B.; Baltus, R.E.; Tanneru, C.T.; Chellam, S. Effect of electrostatic interactions on rejection of capsular and spherical particles from porous membranes: Theory and experiment. J. Colloid Interface Sci. 2015, 448, 492–500. [Google Scholar] [CrossRef]
- Dechadilok, P.; Deen, W.M. Electrostatic and electrokinetic effects on hindered convection in pores. J. Colloid Interface Sci. 2009, 338, 135–144. [Google Scholar] [CrossRef]
- Delavari, A.; Breite, D.; Schulze, A.; Baltus, R.E. Latex particle rejections from virgin and mixed charged surface polycarbonate track etched membranes. J. Membr. Sci. 2019, 584, 110–119. [Google Scholar] [CrossRef]
- Rohani, M.M.; Zydney, A.L. Effect of surface charge distribution on protein transport through semipermeable ultrafiltration membranes. J. Membr. Sci. 2009, 337, 324–331. [Google Scholar] [CrossRef]
- Arunkumar, A.; Etzel, M.R. Negatively charged tangential flow ultrafiltration membranes for whey protein concentration. J. Membr. Sci. 2015, 475, 340–348. [Google Scholar] [CrossRef]
- Casassa, E.F.; Tagami, Y. An Equilibrium Theory for Exclusion Chromatography of Branched and Linear Polymer Chains. Macromolecules 1969, 2, 14–26. [Google Scholar] [CrossRef]
- Morão, A.; Nunes, J.C.; Sousa, F.; Amorim, M.T.P.; De Escobar, I.C.; Queiroz, J.A. Development of a model for membrane filtration of long and flexible macromolecules: Application to predict dextran and linear DNA rejections in ultrafiltration. J. Membr. Sci. 2009, 336, 61–70. [Google Scholar] [CrossRef]
- Davidson, M.G.; Suter, U.W.; Deen, W.M. Equilibrium partitioning of flexible macromolecules between bulk solution and cylindrical pores. Macromolecules 1987, 20, 1141–1146. [Google Scholar] [CrossRef]
- Bleha, T.; Cifra, P.; Karasz, F.E. The effects of concentration on partitioning of flexible chains into pores. Polymer 1990, 31, 1321–1327. [Google Scholar] [CrossRef]
- Davidson, M.G.; Deen, W.M. Hydrodynamic theory for the hindered transport of flexible macromolecules in porous membranes. J. Membr. Sci. 1988, 35, 167–192. [Google Scholar] [CrossRef]
- Latulippe, D.R.; Zydney, A.L. Elongational flow model for transmission of supercoiled plasmid DNA during membrane ultrafiltration. J. Membr. Sci. 2009, 329, 201–208. [Google Scholar] [CrossRef]
- Nouri Alavijeh, H.; Baltus, R. Transmission of Poly(dT60) Single-Stranded DNA through Polycarbonate Track-Etched Ultrafiltration Membranes. Biotechnol. Prog. 2022; submitted. [Google Scholar]
- Li, Y.; Currie, D.; Zydney, A.L. Enhanced purification of plasmid DNA isoforms by exploiting ionic strength effects during ultrafiltration. Biotechnol. Bioeng. 2016, 113, 783–789. [Google Scholar] [CrossRef]
- Latulippe, D.R.; Zydney, A.L. Salt-induced changes in plasmid DNA transmission through ultrafiltration membranes. Biotechnol. Bioeng. 2008, 99, 390–398. [Google Scholar] [CrossRef]
- Li, Y.; Butler, N.; Zydney, A.L. Size-based separation of supercoiled plasmid DNA using ultrafiltration. J. Colloid Interface Sci. 2016, 472, 195–201. [Google Scholar] [CrossRef] [Green Version]
- Manzano, I.; Zydney, A.L. Quantitative study of RNA transmission through ultrafiltration membranes. J. Membr. Sci. 2017, 544, 272–277. [Google Scholar] [CrossRef]
- Nouri Alavijeh, H. A Study on Membrane Filtration of Single-Stranded DNA. Ph.D. Thesis, Clarkson University, Potsdam, NY, USA, 2021. [Google Scholar]
- Laurence, T.A.; Kong, X.; Jäger, M.; Weiss, S. Probing structural heterogeneities and fluctuations of nucleic acids and denatured proteins. Proc. Natl. Acad. Sci. USA 2005, 102, 17348–17353. [Google Scholar] [CrossRef] [PubMed] [Green Version]
- Meisburger, S.P.; Sutton, J.L.; Chen, H.; Pabit, S.A.; Kirmizialtin, S.; Elber, R.; Pollack, L. Polyelectrolyte properties of single stranded DNA measured using SAXS and single molecule FRET: Beyond the wormlike chain model. Biopolymers 2013, 99, 1032–1045. [Google Scholar] [CrossRef] [PubMed] [Green Version]
- Murphy, M.C.; Rasnik, I.; Cheng, W.; Lohman, T.M.; Ha, T. Probing single-stranded DNA conformational flexibility using fluorescence spectroscopy. Biophys. J. 2004, 86, 2530–2537. [Google Scholar] [CrossRef] [Green Version]
- Mills, J.B.; Vacano, E.; Hagerman, P.J. Flexibility of single-stranded DNA: Use of gapped duplex helices to determine the persistence lengths of poly(dT) and poly(dA). J. Mol. Biol. 1999, 285, 245–257. [Google Scholar] [CrossRef]
- Kuznetsov, S.V.; Shen, Y.; Benight, A.S.; Ansari, A. A semiflexible polymer model applied to loop formation in DNA hairpins. Biophys. J. 2001, 81, 2864–2875. [Google Scholar] [CrossRef] [Green Version]
- Sim, A.Y.L.; Lipfert, J.; Herschlag, D.; Doniach, S. Salt dependence of the radius of gyration and flexibility of single-stranded DNA in solution probed by small-angle X-ray scattering. Phys. Rev. E 2012, 86, 021901. [Google Scholar] [CrossRef] [Green Version]
- Doose, S.; Barsch, H.; Sauer, M. Polymer properties of polythymine as revealed by translational diffusion. Biophys. J. 2007, 93, 1224–1234. [Google Scholar] [CrossRef] [Green Version]
- Plumridge, A.; Meisburger, S.P.; Andresen, K.; Pollack, L. The impact of base stacking on the conformations and electrostatics of single-stranded DNA. Nucleic Acids Res. 2017, 45, 3932–3943. [Google Scholar] [CrossRef]
- Desruisseaux, C.; Long, D.; Drouin, G.; Slater, G.W. Electrophoresis of composite molecular objects. 1. Relation between friction, charge, and ionic strength in free solution. Macromolecules 2001, 34, 44–52. [Google Scholar] [CrossRef]
- Tinland, B.; Pluen, A.; Sturm, J.; Weill, G. Persistence Length of Single-Stranded DNA. Macromolecules 1997, 30, 5763–5765. [Google Scholar] [CrossRef]
- Chen, Z.; Graham, R.; Burns, M.A.; Larson, R.G. Modeling ssDNA electrophoretic migration with band broadening in an entangled or cross-linked network. Electrophoresis 2007, 28, 2783–2800. [Google Scholar] [CrossRef] [PubMed] [Green Version]
- Record, M.T.; Anderson, C.F.; Lohman, T.M. Thermodynamic analysis of ion effects on the binding and conformational equilibria of proteins and nucleic acids: The roles of ion association or release, screening, and ion effects on water activity. Q. Rev. Biophys. 1978, 11, 103–178. [Google Scholar] [CrossRef] [PubMed]
- Huertas, M.L.; Navarro, S.; Lopez Martinez, M.C.; García de la Torre, J. Simulation of the conformation and dynamics of a double-helical model for DNA. Biophys. J. 1997, 73, 3142–3153. [Google Scholar] [CrossRef] [Green Version]
- Kratky, O.; Porod, G. Röntgenuntersuchung gelöster Fadenmoleküle. Recl. Trav. Chim. Pays-Bas 1949, 68, 1106–1122. [Google Scholar] [CrossRef]
- Mehta, A.; Zydney, A.L. Effect of Membrane Charge on Flow and Protein Transport during Ultrafiltration. Biotechnol. Prog. 2006, 22, 484–492. [Google Scholar] [CrossRef]
- Higdon, J.J.L.; Muldowney, G.P. Resistance functions for spherical particles, droplets and bubbles in cylindrical tubes. J. Fluid Mech. 1995, 298, 193–210. [Google Scholar] [CrossRef]


| NaCl Concentration (mM) | Diffusion Coefficient (µm2/s) | (nm) | (nm) | (nm) | (nm) |
|---|---|---|---|---|---|
| 0 | 85 ± 5 | 2.8 ± 0.3 | 4.0 ± 0.5 | 10.5 | 2.2 |
| 100 | 96 ± 13 | 2.5 ± 0.4 | 3.5 ± 0.6 | 9.0 | 1.6 |
| 500 | 142 ± 16 | 1.6 ± 0.1 | 2.3 ± 0.2 | 5.6 | 0.6 |
| 1000 | 136 ± 10 | 1.6 ± 0.1 | 2.2 ± 0.2 | 5.6 | 0.6 |
Publisher’s Note: MDPI stays neutral with regard to jurisdictional claims in published maps and institutional affiliations. |
© 2022 by the authors. Licensee MDPI, Basel, Switzerland. This article is an open access article distributed under the terms and conditions of the Creative Commons Attribution (CC BY) license (https://creativecommons.org/licenses/by/4.0/).
Share and Cite
Alavijeh, H.N.; Baltus, R.E. Can Hindered Transport Models for Rigid Spheres Predict the Rejection of Single Stranded DNA from Porous Membranes? Membranes 2022, 12, 1099. https://doi.org/10.3390/membranes12111099
Alavijeh HN, Baltus RE. Can Hindered Transport Models for Rigid Spheres Predict the Rejection of Single Stranded DNA from Porous Membranes? Membranes. 2022; 12(11):1099. https://doi.org/10.3390/membranes12111099
Chicago/Turabian StyleAlavijeh, Hossein Nouri, and Ruth E. Baltus. 2022. "Can Hindered Transport Models for Rigid Spheres Predict the Rejection of Single Stranded DNA from Porous Membranes?" Membranes 12, no. 11: 1099. https://doi.org/10.3390/membranes12111099